Download as PDF, PPTX

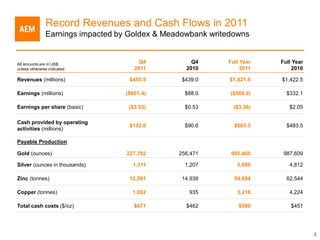

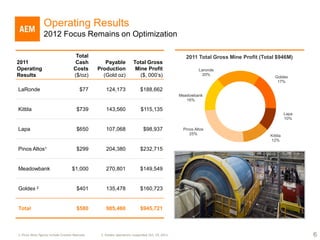
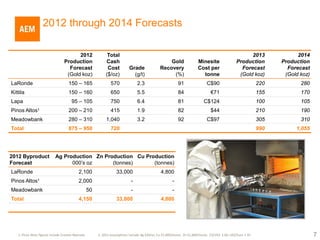
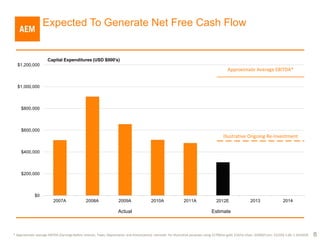
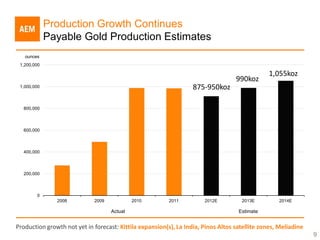
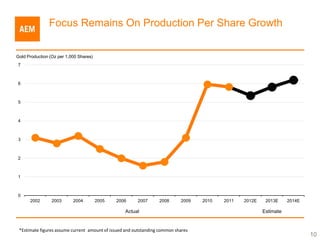
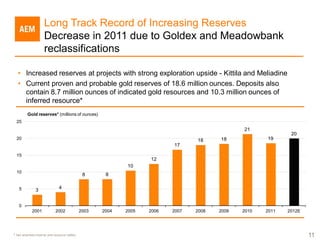
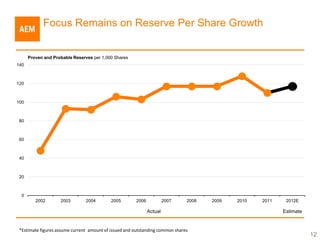
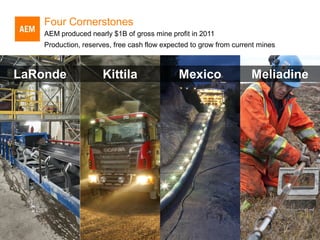


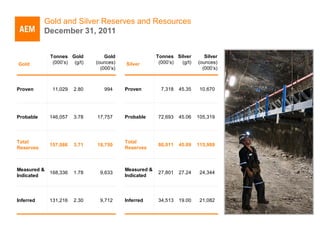


Agnico-Eagle Mines Limited reported its fourth quarter and full year 2011 results in February 2012. Earnings for both the quarter and full year were impacted by non-cash writedowns of the Goldex and Meadowbank mines. Revenues reached record levels in 2011 of $1.82 billion due to higher gold prices, however earnings were negative due to the writedowns. Production guidance is provided for 2012-2014, with payable gold production expected to increase each year from 875,000-950,000 ounces in 2012 to over 1 million ounces in 2014 through contributions from all mines. Capital expenditures are also forecast to remain below average EBITDA levels, allowing for expected ongoing free cash flow generation