Download to read offline
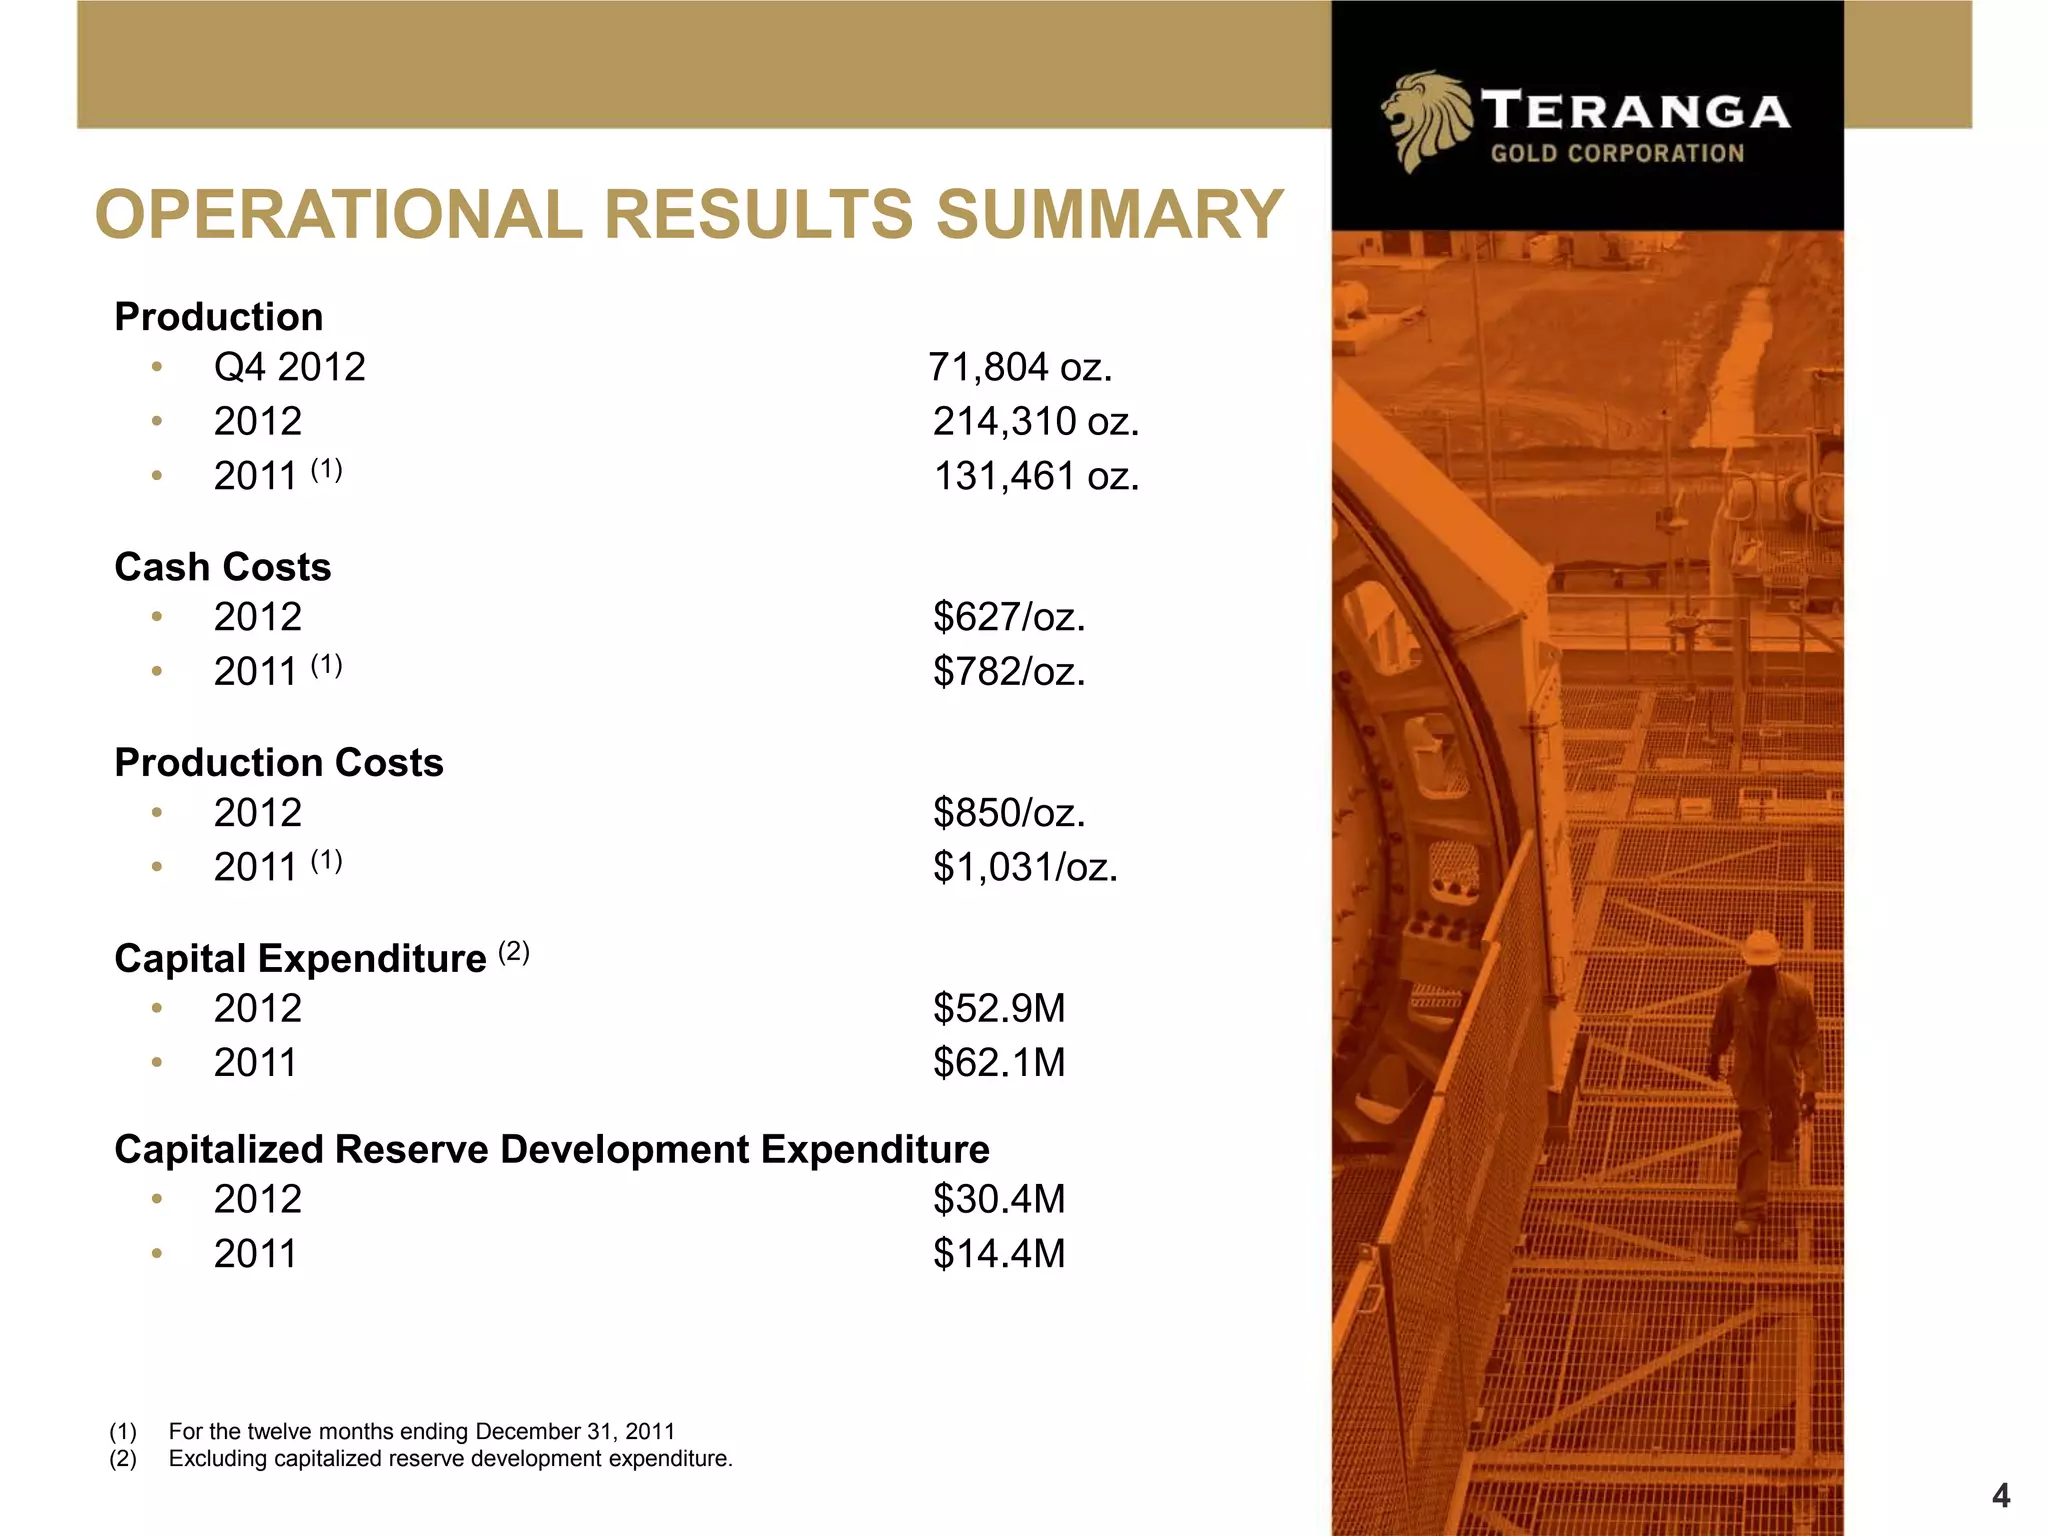
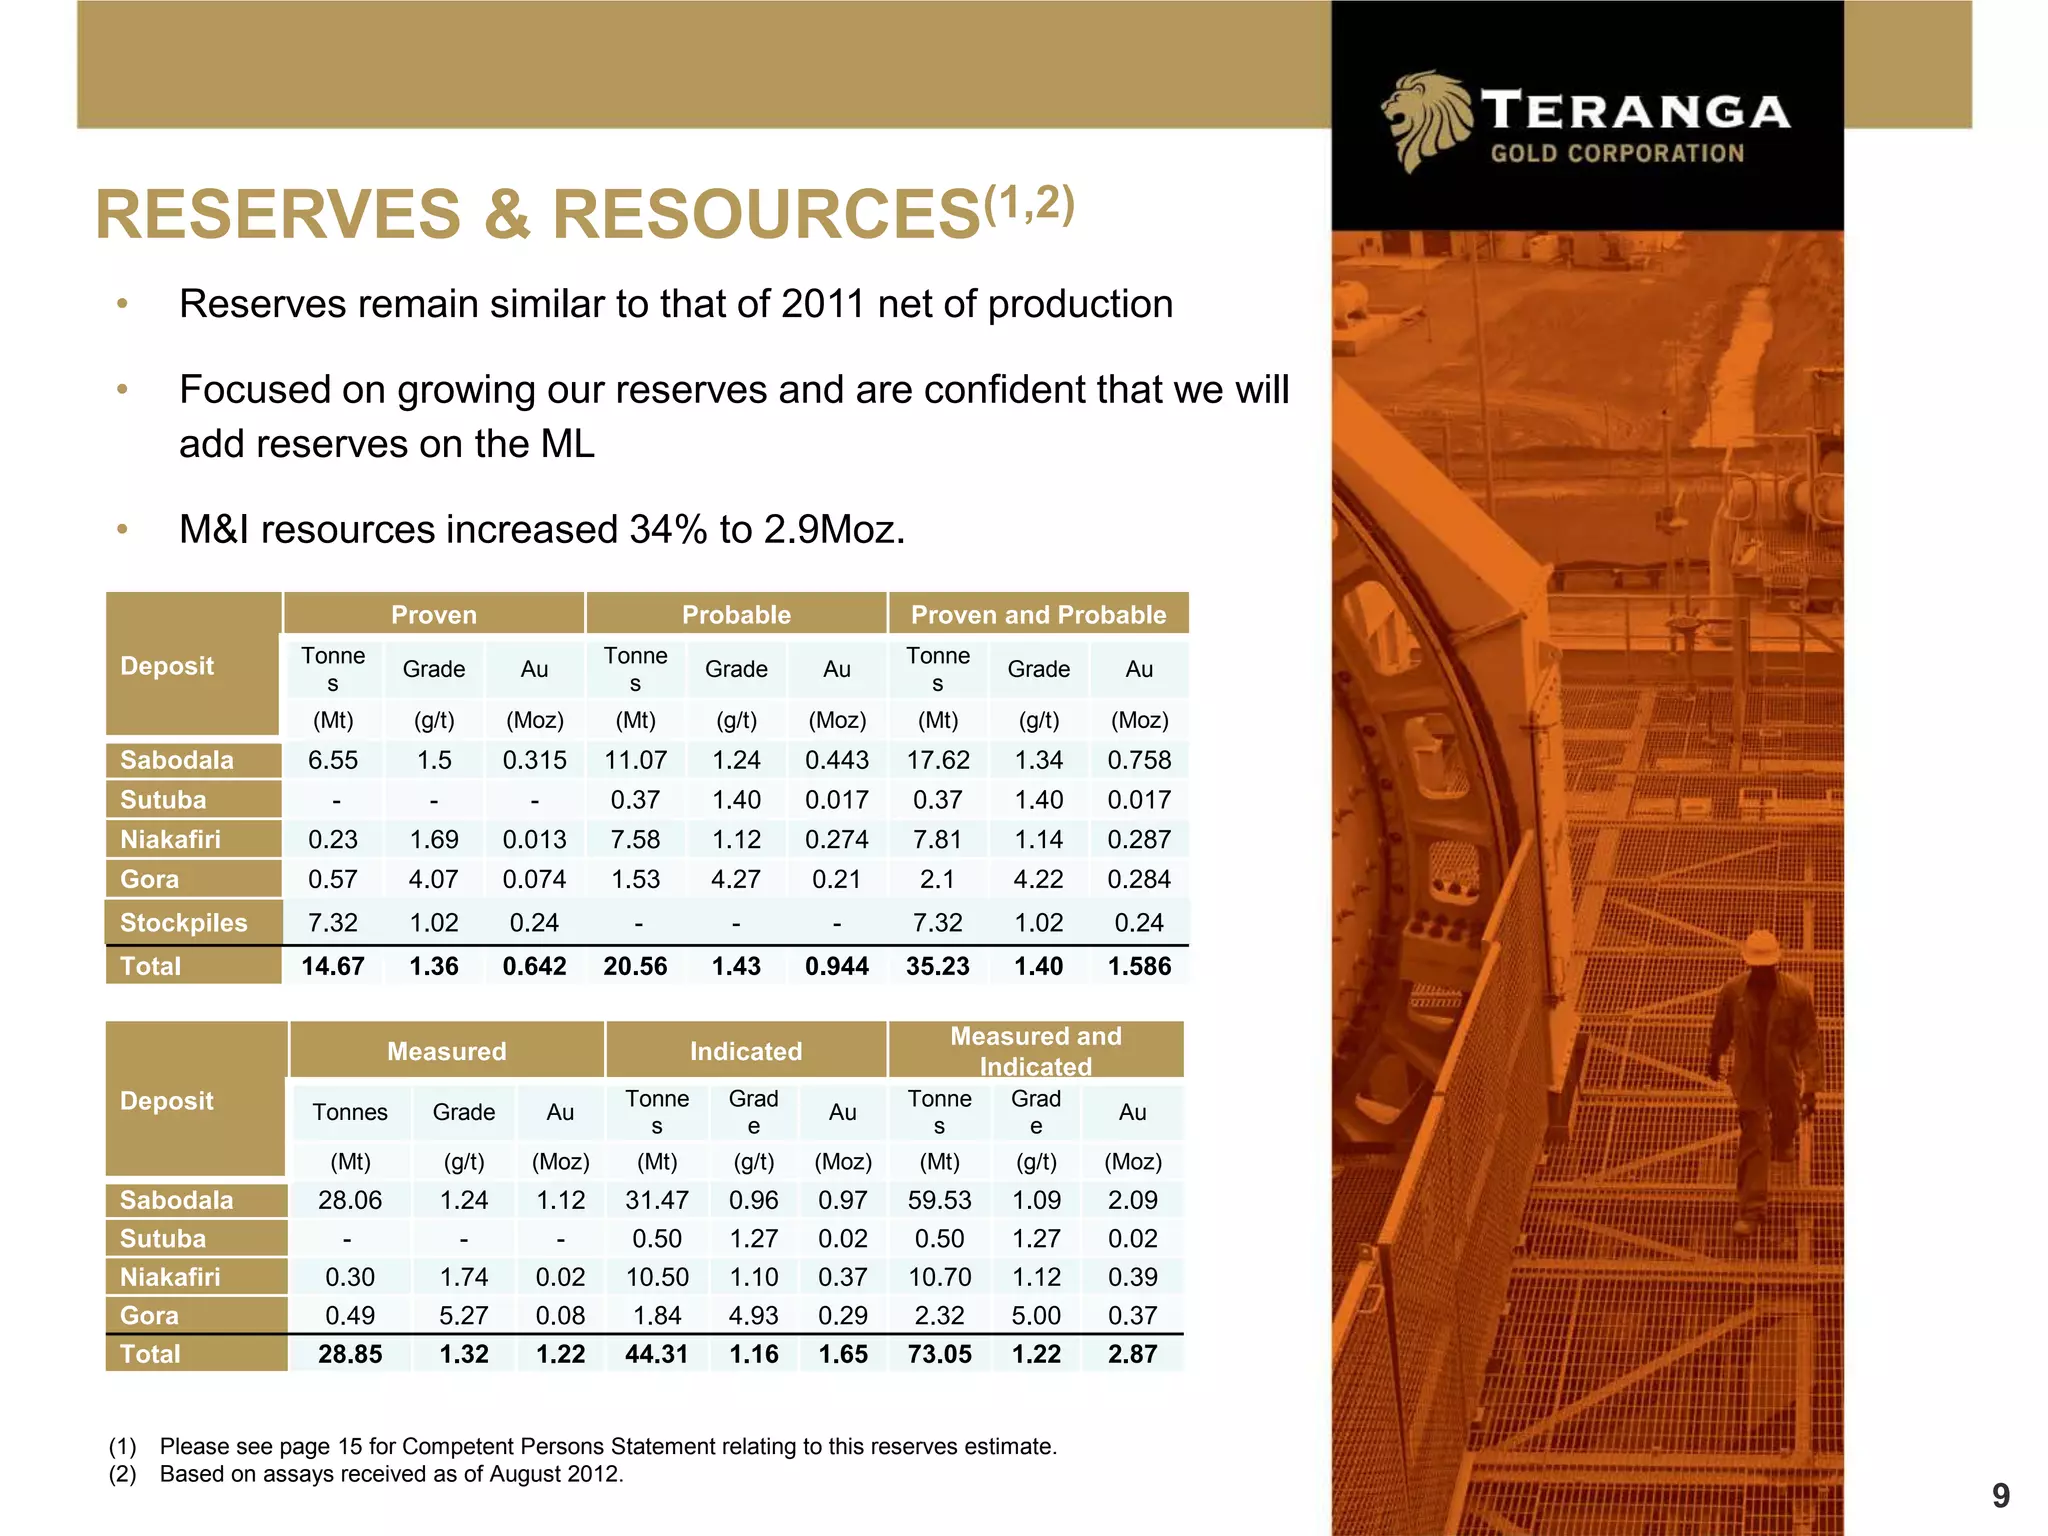
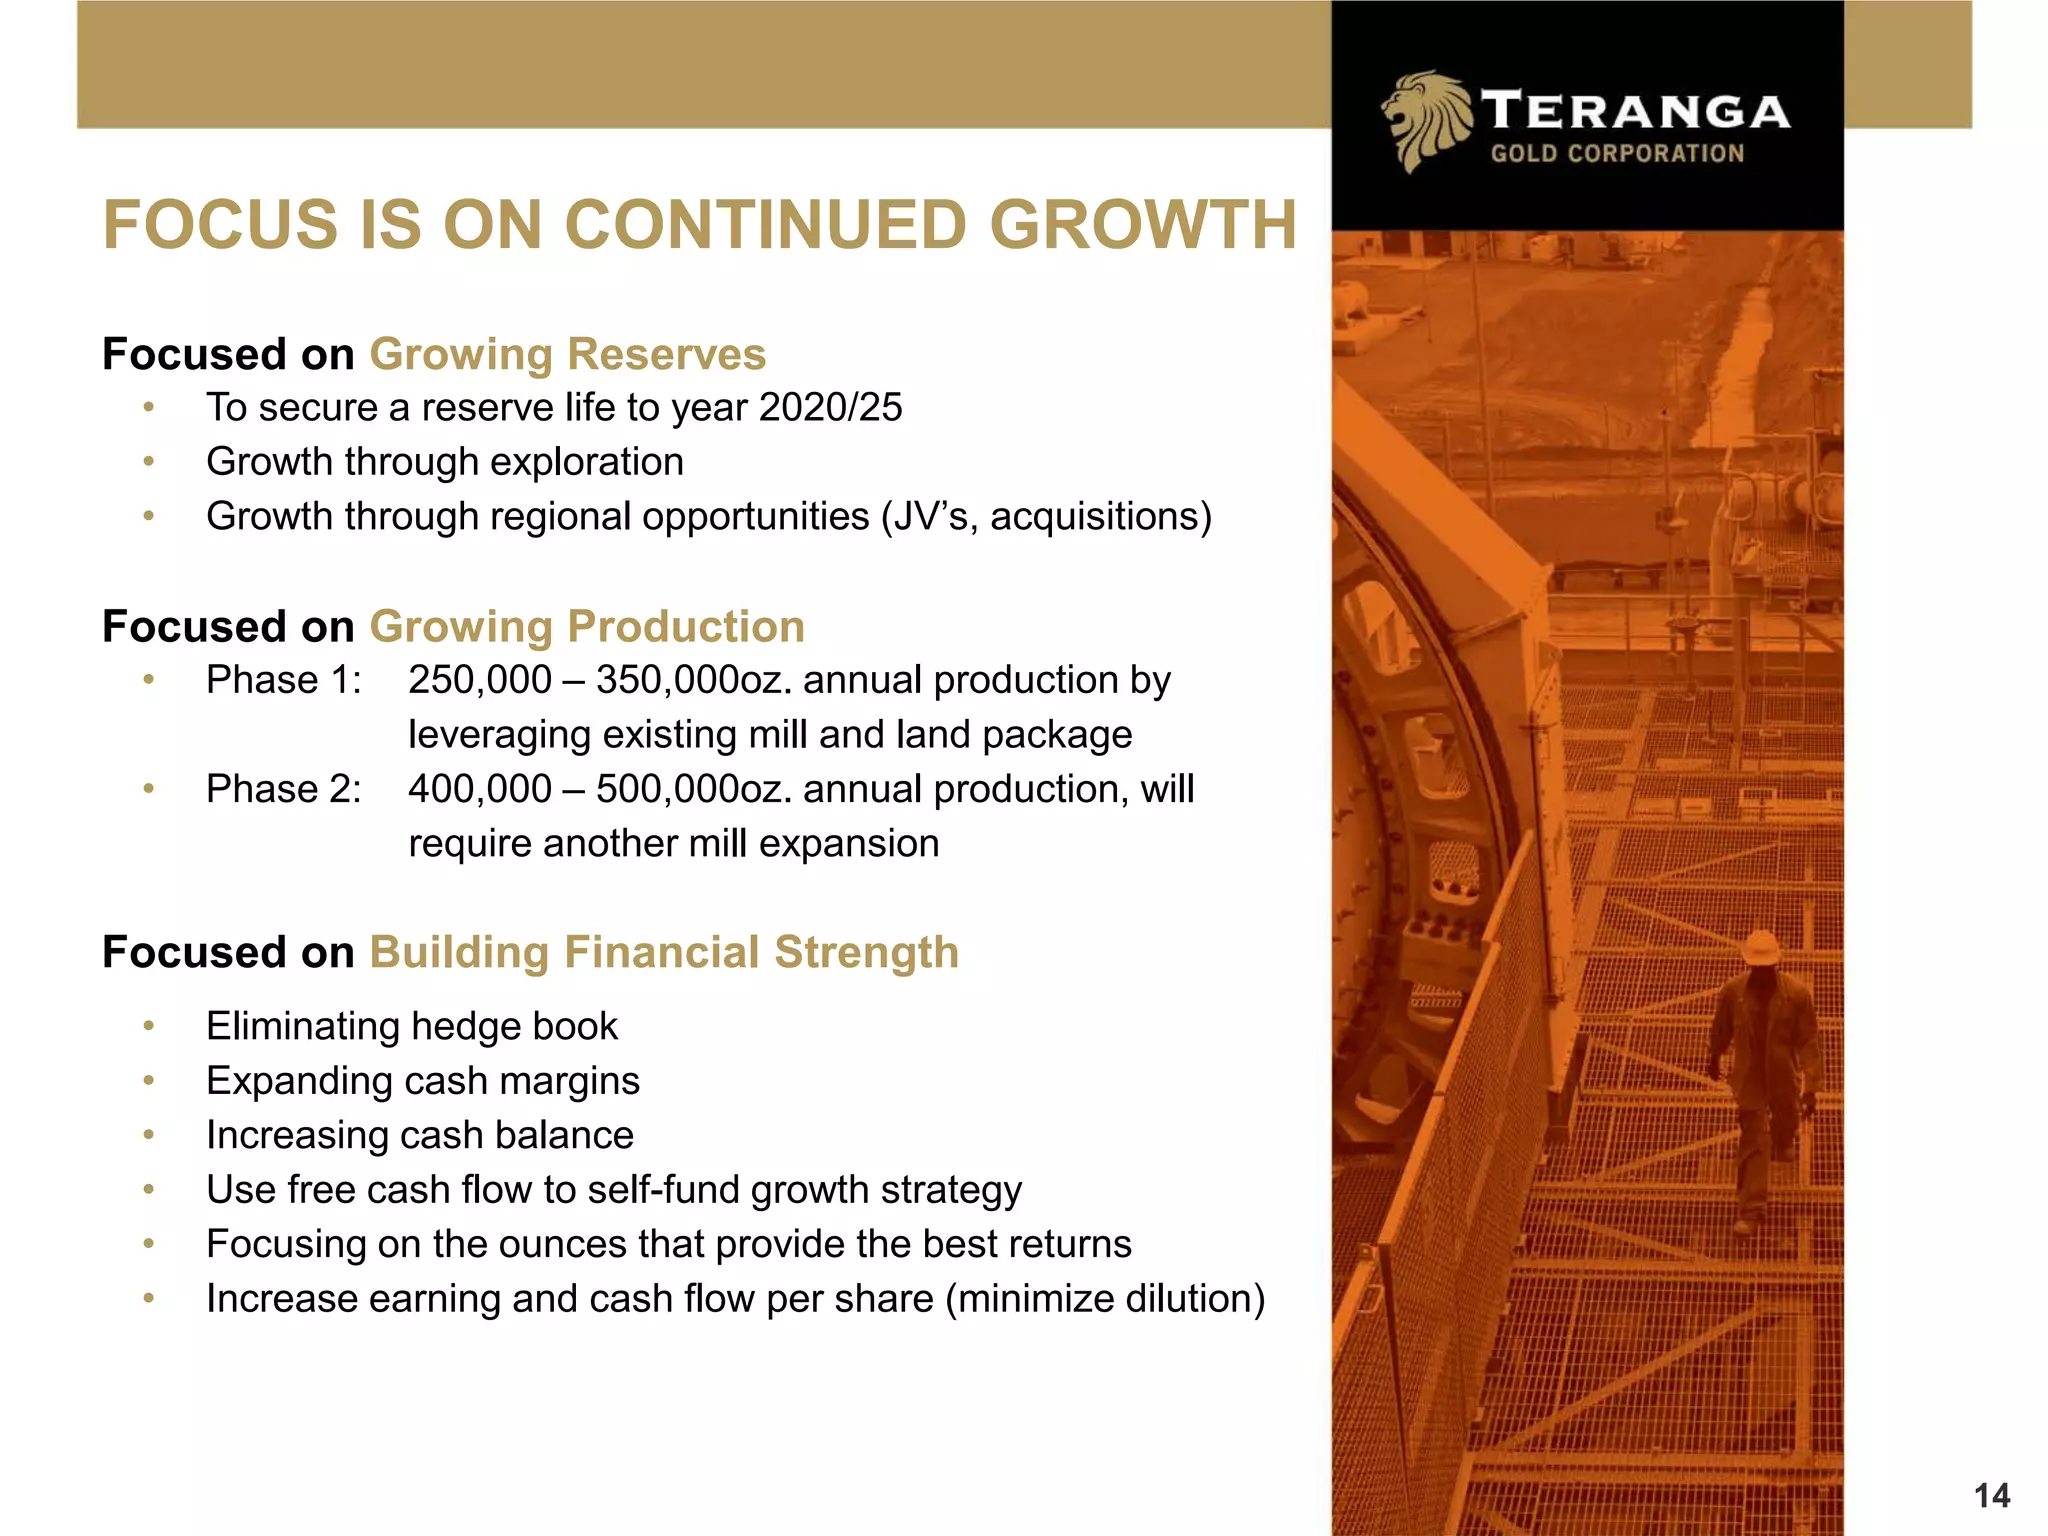

- Teranga produced 214,310 ounces of gold in 2012 at a cash cost of $627 per ounce and expects to produce 190,000-210,000 ounces in 2013 at a cash cost of $650-700 per ounce. - Mill expansion was completed in 2012, increasing capacity. Production is expected to reach 250,000-350,000 ounces annually through developing the Gora deposit. - Proven and probable reserves remain similar to 2011 at 1 million ounces despite 2012 production, and measured and indicated resources increased 34% to 2.9 million ounces through exploration.


