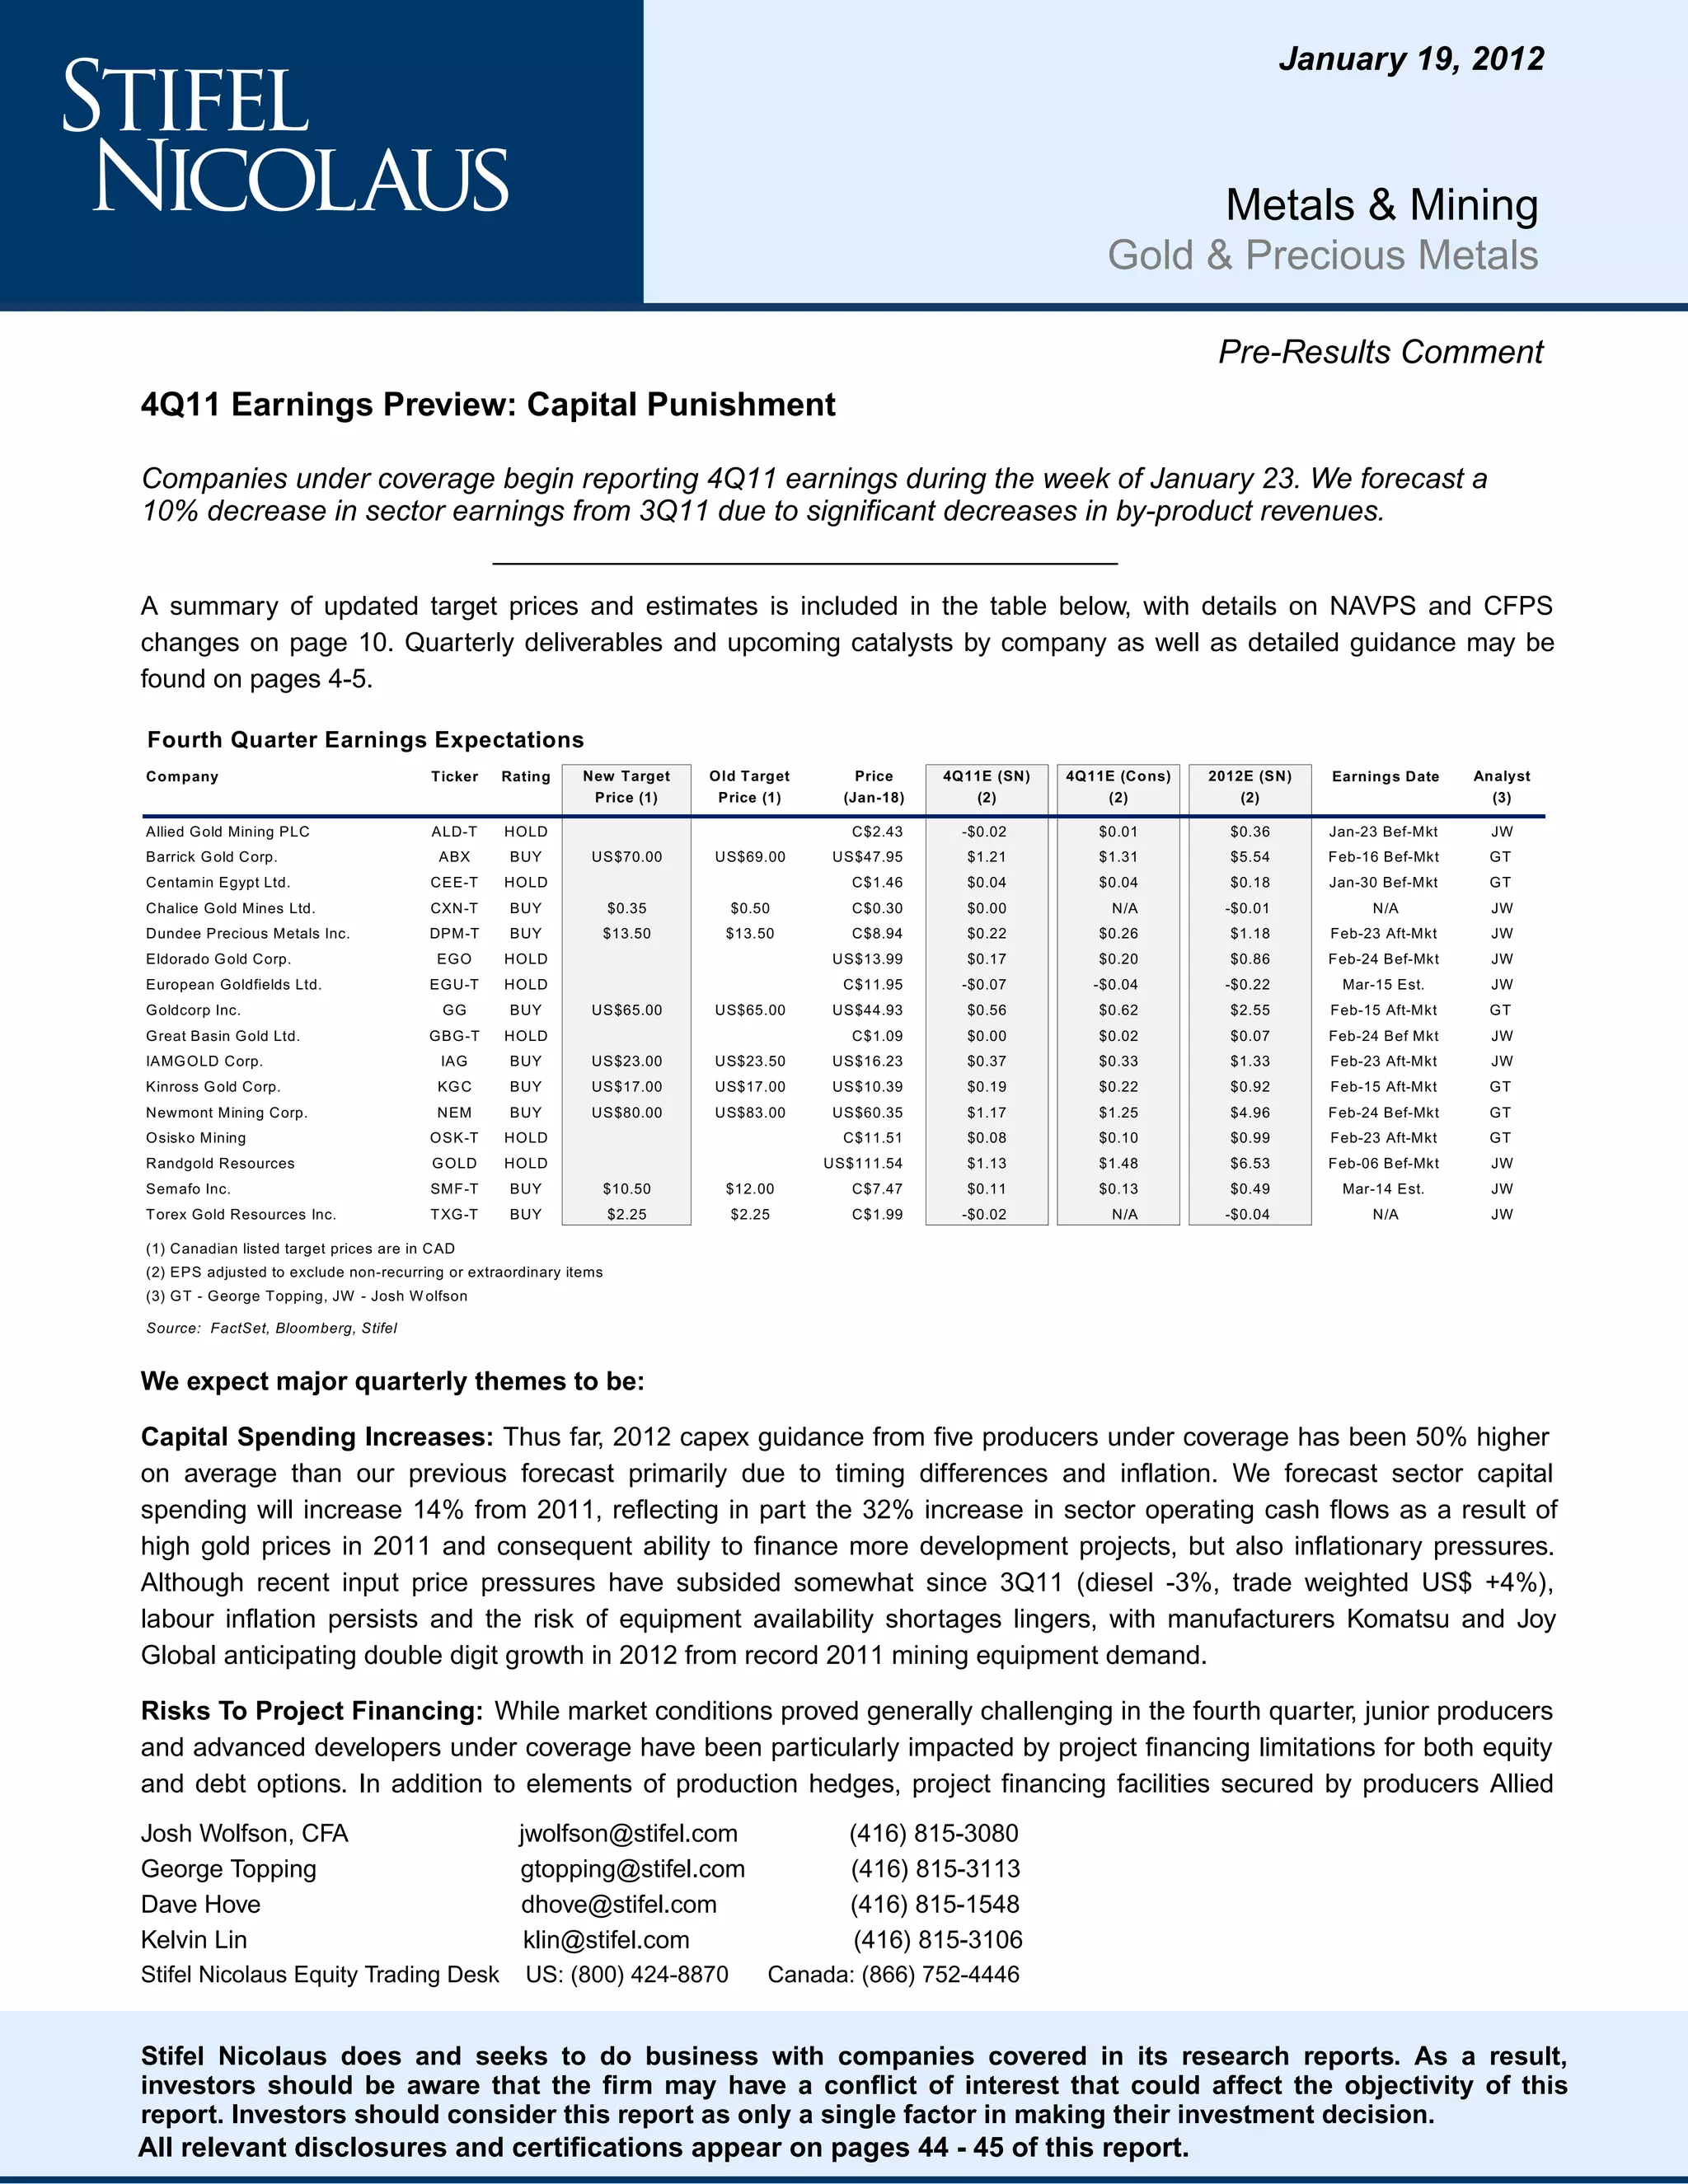
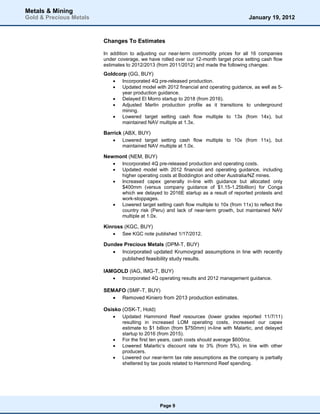
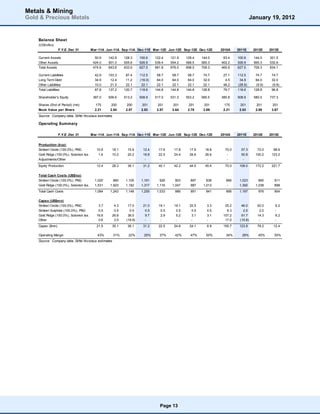
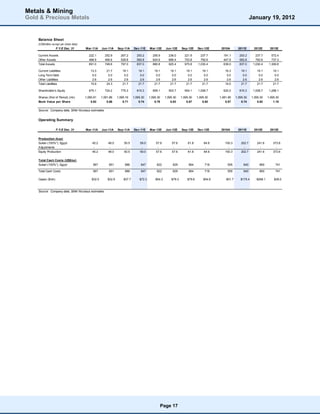
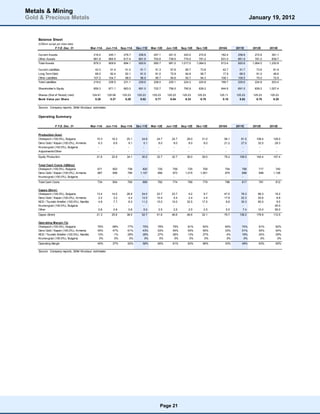
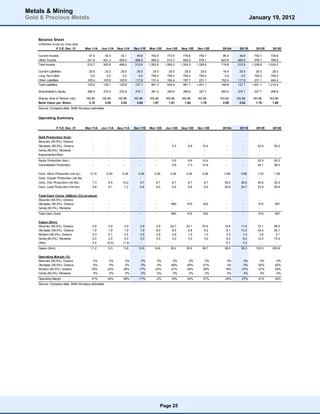
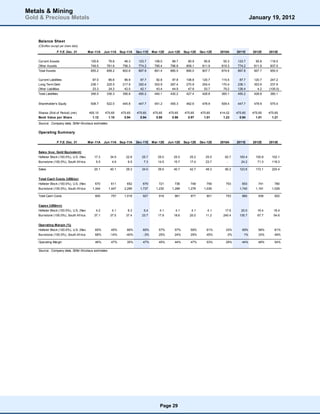
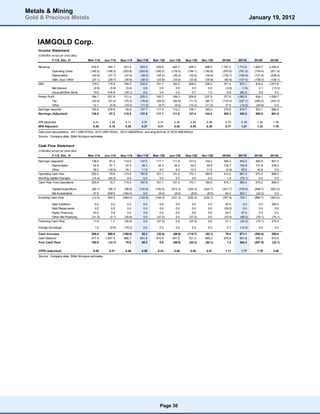
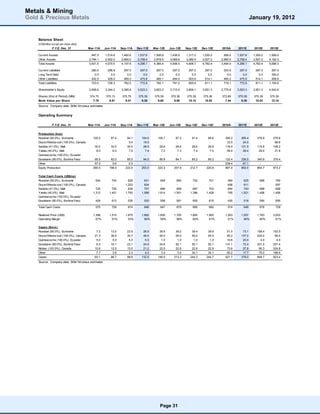
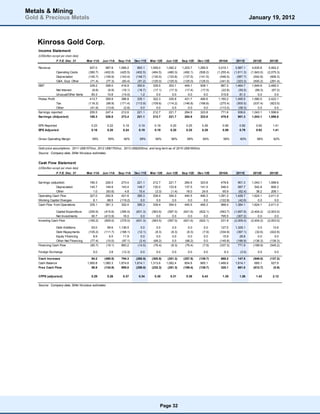
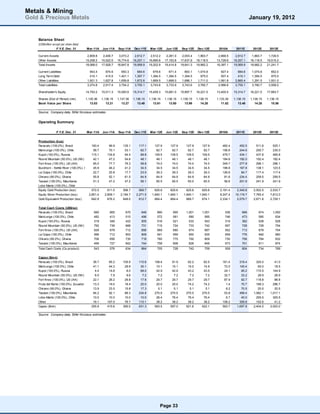
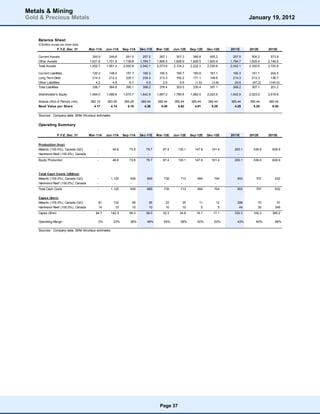
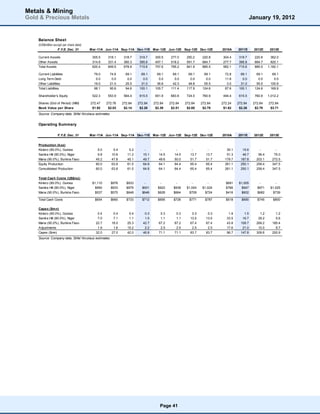
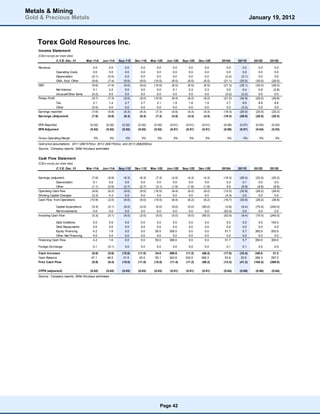
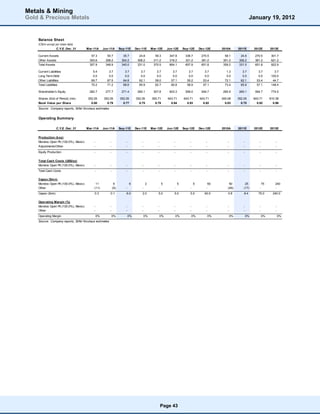
The document provides an earnings preview for gold and precious metals companies reporting 4th quarter 2011 earnings during the week of January 23rd. It is forecasted that sector earnings will decrease 10% from 3Q11 due to decreases in by-product revenues. A table provides target prices, estimates, and earnings dates for covered companies. Key quarterly themes discussed are expected increases in capital spending, risks to project financing, potential for industry consolidation, and rising operating costs.
This corporate presentation from IMPACT Silver Corp outlines their profitable silver production in Mexico, strong financial position with $19.6M cash and no debt, and growth plans. IMPACT is currently transitioning operations from older, lower grade mines to new high grade Capire Mine and Processing Plant, with completion scheduled for Q1 2013. They have explored over 3,000 old mine workings in the Royal Mines of Zacualpan district, Mexico, which has 485 years of mining history, to guide modern exploration efforts.
This document provides an overview and corporate presentation for IMPACT Silver Corp. Key points include:
- IMPACT is a Canadian silver mining company with production at its Royal Mines of Zacualpan in Mexico and several exploration projects.
- It has a strong financial position with $19.6 million in cash and no debt as of Q3 2012.
- Construction is underway for the new Capire Mine and processing plant in Mexico to drive production growth.
- Resources reported for Capire include over 7 million ounces of silver and 30,000 ounces of gold.
- A new high-grade Cuchara-Oscar Mine is scheduled to begin production in early 2013.
This presentation summarizes IMPACT Silver Corp., a silver mining and exploration company. It highlights IMPACT's profitable silver production in Mexico, strong financial position with $19.6 million in cash and no debt, and construction of a new mining district. The presentation provides an overview of IMPACT's management team, board of directors, project locations, growth in production, and exploration targets to drive future growth.
Agnico-Eagle Mines reported record annual gold production of 1,043,811 ounces in 2012 at a total cash cost of $640 per ounce. Cash flows from operations reached a record $696 million. Production is expected to increase to approximately 990,000 ounces in 2013 and reach over 1.2 million ounces by 2015 through contributions from new projects. Capital expenditures will be focused on expanding the Kittila mine and advancing new projects.
This document provides a corporate update from Agnico-Eagle Mines Limited for February 2009. It summarizes the company's operating and financial results for Q4 and full year 2008, highlights its strong gold reserves which are larger than its peers, and outlines its global growth strategy with three operating mines and three new mines under construction. It also previews upcoming news in 2009 regarding expansion studies at several of its projects which could further increase production.
Agnico-Eagle Mines Limited reported strong second quarter 2012 results, with record quarterly gold production from currently operating mines of 265,350 ounces at total cash costs of $660 per ounce. Cash provided by operating activities was a record $194 million for the quarter. Production guidance for 2012 was increased to approximately 975,000 ounces of gold. The company has a portfolio of quality, long-life mines that continue to perform well and provide low-risk production growth from existing assets. Significant exploration upside and reserve growth have been demonstrated at the company's 100%-owned assets.
This presentation provides an overview of IMPACT Silver Corp., a silver producer with mines located in central Mexico. IMPACT has a strong cash position of $16 million with no debt. Production decreased in 2012 as operations transitioned to new, higher grade mines. IMPACT aims to grow organically by exploring attractive targets within its land package. The presentation highlights IMPACT's profitable silver production, growth strategy, management team, and location of its mines in the Zacualpan and Capire Silver Districts of Mexico.
Agnico-Eagle Mines Limited reported its third quarter 2012 results in October 2012. The company achieved record quarterly gold production of 286,971 ounces at total cash costs of $556 per ounce. Cash flow from operations was also a record at $199 million for the quarter. Agnico increased its 2012 gold production guidance to approximately 1,025,000 ounces and lowered its total cash cost guidance to approximately $660 per ounce. The company's portfolio of long-life mines continued to perform well, and it expects low political risk and meaningful production growth from existing assets.
This corporate presentation summarizes IMPACT Silver Corp., a silver mining and exploration company operating in Mexico. Key points include:
- IMPACT has increased net earnings 1,390% from 2006-2011 through profitable silver production from two mining districts in Mexico.
- Construction of the new Capire Production Centre is complete, providing organic growth through exploration of additional targets on its land package.
- As of Q3 2012, IMPACT has a strong cash position of $19.6 million with no debt and revenues primarily from silver.
- Production is growing through transition from older, lower grade mines to new higher grade mines including the open-pit Capire Mine.
Agnico-Eagle Mines Limited reported its fourth quarter and full year 2011 results in February 2012. Earnings for both the quarter and full year were impacted by non-cash writedowns of the Goldex and Meadowbank mines. Revenues reached record levels in 2011 of $1.82 billion due to higher gold prices, however earnings were negative due to the writedowns. Production guidance is provided for 2012-2014, with payable gold production expected to increase each year from 875,000-950,000 ounces in 2012 to over 1 million ounces in 2014 through contributions from all mines. Capital expenditures are also forecast to remain below average EBITDA levels, allowing for expected ongoing free cash flow generation
Agnico-Eagle Mines reported record quarterly gold production from its currently operating mines of 254,955 ounces in Q1 2012, a 19% increase over Q1 2011. Total cash costs were $594 per ounce. Net income was $79 million, up 74% year-over-year. Cash provided by operating activities was $196 million. Production is expected to grow further from existing long-life assets through exploration and mine plan optimization. The company aims to continue generating strong cash flows to fund growth and maintain its dividend.
SilverCrest Mines | Corporate Presentation | September 2012Silvercrestmines
This document provides forward-looking production estimates and financial information for SilverCrest Mines Inc., a precious metals mining company. It summarizes the company's operating results for the second quarter of 2012, including silver and gold production and cash costs. It also outlines the company's mineral resource estimates across its properties and management's experience. However, readers are cautioned that the information presented is forward-looking and subject to various risks and uncertainties.
This document provides information from Agnico-Eagle Mines Limited's shareholder meeting on April 30, 2009. It summarizes the company's operating results for the first quarter of 2009, highlighting record quarterly gold production of 91,812 ounces and total cash costs per ounce of $312. The document also emphasizes Agnico-Eagle's consistent strategy of growing gold reserves and production while maintaining low production costs to create shareholder value.
This corporate presentation provides the following information:
1) IMPACT Silver Corp. operates two silver production centers in Mexico and has several exploration targets to drive growth.
2) In 2012, production totaled over 600,000 ounces of silver from four mines, with revenues of $15.9 million.
3) Recent development included commissioning a new open-pit mine and pilot plant at the Capire Property in 2013.
4) The presentation highlights drill results from ongoing exploration programs aimed at expanding resources and reserves.
This presentation provides an overview of IMPACT Silver Corp., a silver producer with mines located in central Mexico. IMPACT has a strong cash position of $16 million with no debt. Production increased over time through transitioning to newer, higher grade mines. IMPACT aims to grow organically by exploring attractive targets within its land package. The presentation discusses IMPACT's financial highlights, management team, mine properties, and growth strategy.
Claude Resources Inc. Q4 2012 Conference Call and Webcast PresentationClaude Resources Inc.
Neil McMillan, President and CEO of Claude Resources Inc., presented the company's 2012 financial and operating results on March 28, 2013. Key highlights included net profit of $5.6 million, cash flow from operations of $25.8 million, gold sales increasing 16% to 48,672 ounces, and production reaching a record 49,570 ounces. The presentation also provided details on the company's financial position, debt facilities, operations at Seabee Gold Operation and exploration projects, and production and cost guidance for 2013.
The document provides Frontline's Q4 2012 results and outlook. It discusses several transactions in Q4 including terminating some vessels and early termination of TC contracts on two OBO carriers. It reported a net loss of $16.9 million for Q4 2012 and $82.8 million for full year 2012. Frontline also provides an overview of its fleet size and average time charter rates and coverage for 2013-2014. The company estimates its cash cost breakeven rates for VLCCs and Suezmax tankers for the remainder of 2013.
The document discusses Newmont Mining Corporation's growth strategy and financial performance. It highlights production growth potential to around 7 million ounces of gold by 2017 through its project pipeline. It also notes exploration upside with potential to add reserves equivalent to 90 million ounces of gold over the next decade. Finally, it provides updates on various projects in its portfolio such as Akyem, Conga, and Long Canyon.
The document discusses the company's forward-looking estimates and plans for growing gold production, reserves, and cash flow over the next few years. It estimates increasing gold production from 1.13-1.23 million ounces in 2011 to 1.5 million ounces by 2014 through projects like expanding existing mines. It also estimates growing gold reserves to 20-21 million ounces by the end of 2010 and 21-22 million ounces by the end of 2011. The company aims to be a low-cost leader with total cash costs below industry averages.
This document contains cautionary statements regarding forward-looking statements in Gary Goldberg's presentation at the Bank of Montreal Metals and Mining Conference on February 25, 2013. It warns that actual results could differ materially from projections due to risks and uncertainties. It also notes that estimates of resources are subject to further exploration and development and are not guarantees that minerals can be economically extracted. The document outlines Newmont's priorities of strong free cash flow growth, leverage to gold prices, returning capital to shareholders, total cost management, and maximizing asset value.
- Teranga produced 214,310 ounces of gold in 2012 at a cash cost of $627 per ounce and expects to produce 190,000-210,000 ounces in 2013 at a cash cost of $650-700 per ounce.
- Mill expansion was completed in 2012, increasing capacity. Production is expected to reach 250,000-350,000 ounces annually through developing the Gora deposit.
- Proven and probable reserves remain similar to 2011 at 1 million ounces despite 2012 production, and measured and indicated resources increased 34% to 2.9 million ounces through exploration.
Sanatana Resources Inc. presented an investor presentation on their Watershed property which surrounds IAMGOLD's Côté Gold project. Sanatana has explored the property extensively through drilling and geophysics, intercepting gold mineralization along strike from Côté. IAMGOLD has applied for easements over Sanatana claims, likely to incorporate the mineralization into an expanded mine plan, but Sanatana is defending its property rights. Sanatana sees value in potentially being acquired by IAMGOLD to consolidate the deposits and optimize the project.
This corporate presentation from Orvana Minerals Corp. provides an overview of the company's operations and financial performance. Orvana operates gold and copper mines in Bolivia and Spain, including its recently commissioned Upper Mineralized Zone deposit. The presentation summarizes Orvana's key assets and growth projects, financial results, production forecasts, and mineral reserve and resource estimates. It also outlines various risk factors and forward-looking statements regarding the company's plans and estimates.
Symposium resources roadshow white rock minerals geoff loweSymposium
White Rock Minerals Ltd is an Australian mining company focused on developing its Mt Carrington gold and silver project located in New South Wales, Australia. The project contains a February 2012 resource estimate of 284,000 ounces of gold and 23.3 million ounces of silver. White Rock has $4.5 million in cash and no debt as of December 31, 2011. Managing Director Geoff Lowe presented details on the project's history, resources, exploration potential, and plans for 2012.
- The document summarizes Newmont Mining Corporation's third quarter 2008 conference call, highlighting adjusted net income, gold sales, average gold prices realized, and costs applicable to sales.
- Key metrics for year-to-date 2008 and third quarter 2008 such as adjusted net income, gold sales, average gold prices, and costs applicable to sales are presented for several regions and in total.
- Newmont reaffirms its annual guidance for 2008 equity gold sales and costs applicable to sales.
Russell Ball, EVP and CFO of Newmont Mining Corporation, presented at the CIBC Institutional Investor Conference on January 23, 2013. Newmont's 2013 outlook reflects stable production from its portfolio, with contribution expected from the Akyem mine in late 2013. Newmont is focused on total cost management and returning capital to shareholders through its gold price-linked dividend, currently yielding approximately 3.8%. Newmont aims to create leverage through reducing its all-in sustaining costs, which are expected to be $1,100-$1,200 per ounce in 2013.
1) Canaccord Adams raises its peak gold price scenario from $950/oz to $1,100/oz, resulting in approximately 20% higher equity target prices for gold mining companies.
2) The report remains bullish on gold due to ongoing weak global financial conditions and expectations that inflation and currency devaluation will result from monetary and fiscal stimulus policies.
3) Investment demand for gold, as seen in surging SPDR gold trust holdings, is more than offsetting other factors and driving gold prices higher, though the trust remains a small portion of funds on the sidelines.
The document provides an overview of Newmont Mining Corporation's operations and outlook. It discusses Q3 2012 operational performance, with gold production of 1.24Moz at a CAS of $693/oz. It highlights the company's regional operations in North America, South America, and Asia Pacific. It also discusses the company's focus on cost control and margin protection through optimizing current operations and overhead cost reductions. The document emphasizes Newmont's commitment to delivering shareholder value through consistent production, a gold price-linked dividend, and leading reserves and production metrics per share.
This corporate presentation summarizes SilverCrest Mines Inc., a growing Mexican silver and gold producer. Key points include:
- SilverCrest owns the Santa Elena Mine in Sonora, Mexico which has produced over 2.37 million ounces of silver equivalents in 2012.
- The company has an experienced management team with decades of mining experience.
- As of January 2013, SilverCrest has proven and probable reserves of over 21.7 million ounces of silver equivalents and indicated and inferred resources totaling over 125.9 million ounces.
- The company also owns the new La Joya silver-copper-gold discovery which is growing.
- Newmont Mining Corporation's President and CEO Richard O'Brien presented at the Bank of Montreal Metals and Mining Conference on February 27, 2012.
- In his presentation, O'Brien highlighted Newmont's growth potential through projects in the pipeline that could increase gold production by 35% to around 7 million ounces by 2017. He also noted potential to double copper production over the same period.
- O'Brien emphasized Newmont's strong financial position and competitive project returns across its portfolio.
Richard O'Brien, President and CEO of Newmont Mining Corporation, presented at the Bank of Montreal Metals and Mining Conference on February 27, 2012. In his presentation, O'Brien highlighted Newmont's strong operating performance in 2011, growth potential through 2022, competitive project returns, and significant exploration upside. Newmont is well positioned to potentially grow attributable gold production by 35% to around 7 million ounces by 2022 through projects in its pipeline. The company also has potential to double copper production over this period.
New Pacific Metals Corp announced initial drill results from its Snake Hole prospect located near its flagship Silver Sand project in Bolivia. The first 19 holes showed potential for high grade silver mineralization. However, the analyst moves their recommendation on New Pacific Metals to Neutral from Buy due to the company's premium valuation relative to peers. The analyst's target price remains $5.25 per share based on a valuation of the Silver Sand project and exploration potential. Near-term news on additional drill results and a maiden resource could provide opportunities to reevaluate the recommendation.
SilverCrest Mines | Corporate Presentation | November 2012Silvercrestmines
This corporate presentation provides an overview of SilverCrest Mines Inc. as of November 2012. Key highlights include:
- SilverCrest is a growing Mexican silver and gold producer with estimated 2012 production of 2.2 million silver equivalent ounces.
- The company's key asset is the Santa Elena Mine in Sonora, Mexico which had proven and probable reserves of 21.7 million silver equivalent ounces as of January 2012.
- SilverCrest has a strong cash position of $34.9 million and no debt as of June 30, 2012. Production is estimated to generate low operating cash costs of $7.00 per silver equivalent ounce.
- The company has experienced significant growth in 2012, with revenue of
This document provides Richard O'Brien's presentation at the Bank of Montreal Metals and Mining Conference on February 27, 2012. The presentation highlights Newmont Mining Corporation's growth potential through 2017, competitive project returns, and exploration upside. It discusses Newmont's record 2011 financial results, leadership in key metrics like reserves and production per share, and outlook for 2012 of attributing gold production of 5.0-5.2 million ounces and copper production of 150-170 million pounds.
Agnico Eagle Mines Limited provided a corporate update in January 2013. The update discussed Agnico Eagle's strong financial and operating performance in 2012, including record gold production and improved costs. Plans for growth in 2013 include commercial production at the La India and Goldex projects by mid-2014. Exploration success was noted at La India, Tarachi and Kittila, with drilling continuing to expand mineralized zones at these properties.
National Bank Financial London Gold Conference Corporate PresentationDetourGold
- Detour Gold Corporation aims to become Canada's next intermediate gold producer through its Detour Lake Project in Ontario.
- Detour Lake is an open pit mine with proven and probable reserves of 15.6 million ounces of gold and an estimated mine life of over 20 years. Commercial production is expected to begin in Q1 2013.
- The presentation provides details on Detour Gold's vision, share structure, project timeline and achievements, operating costs, production plan, and opportunities for organic growth through exploration of additional targets on its large land package near Detour Lake.
Minera Andes is a mining company with silver, gold, and copper assets located in Argentina. It owns 49% of the San José mine, a silver-gold mine currently in production. It also owns 100% of the large Los Azules copper deposit, which is one of the largest undeveloped copper deposits in the world, containing over 12 billion pounds of copper. The CEO of Minera Andes owns 31% of the company and has invested over $60 million of his own money, aligning his interests with shareholders. The presentation recommends Minera Andes as providing leverage to rising silver and copper prices through its producing assets and large undeveloped copper deposit.
Minera Andes is a mining company with silver, gold, and copper assets located in Argentina. It owns 49% of the San José mine, a silver-gold mine currently in production. It also owns 100% of the large Los Azules copper deposit, which is one of the largest undeveloped copper deposits in the world, containing over 12 billion pounds of copper. The CEO of Minera Andes owns 31% of the company and has invested over $60 million of his own money. The presentation recommends Minera Andes as a way for investors to gain exposure to silver, gold, and copper assets with significant exploration upside.
Agnico-Eagle Mines Limited provided a corporate update presentation in March 2010. The presentation discussed Agnico-Eagle's strategy of increasing gold production through internal expansions, growing gold reserves, acquiring early stage projects, maintaining low costs, and solid financial positioning. It also provided an operations update on improved performance in Q4 2009 at all mines, rising production and earnings, a strong financial position, and industry leading gold production growth estimates through potential internal expansions.
This weekly report from Lincoln Crowne & Company provides an overview of the copper and gold markets and notable company announcements:
- Copper and gold prices rebounded on signals the US Fed may maintain economic stimulus. Freeport resumed shipments from Grasberg and Rio Tinto shipped first copper from Oyu Tolgoi.
- China's copper imports in June rose nearly 6% from May to the highest level since September 2012. However, H1 2013 imports are down 15% year-on-year.
- The DRC delayed a ban on copper and cobalt concentrate exports until year-end to allow miners to clear stockpiles. Codelco needs more funding to achieve its production targets.
- The document summarizes Newmont Mining Corporation's third quarter 2008 conference call, highlighting adjusted net income, gold sales, average gold prices realized, and costs applicable to sales.
- Key metrics for year-to-date 2008 and third quarter 2008 such as adjusted net income, gold sales, average gold prices, and costs applicable to sales are provided for several regions and in total.
- Newmont reaffirms its annual guidance for 2008 equity gold sales and costs applicable to sales.
Minera Andes owns 49% of the San José silver-gold mine in Argentina, which produced over 5 million ounces of silver in 2010. It also owns 100% of the large Los Azules copper deposit, located in the same region as other world-class copper mines. Based on preliminary economic assessments, Los Azules has the potential to become one of the largest copper mines in the world. The company's CEO owns 31% of the shares and is focused on increasing shareholder value through exploration success and advancing projects like Los Azules towards development.
SilverCrest Mines | Corporate Presentation | October 2012Silvercrestmines
This document provides forward-looking statements about the Company's anticipated results, operations, and projects. It contains non-exhaustive information about the Company's resource base, production estimates, operating costs, expansion plans, and sensitivities to metal price fluctuations. The information is not a comprehensive review and should be read with all other Company disclosures. No securities commission has verified the accuracy of the information presented.
SilverCrest Mines Inc. January 2013 Presentation 1Silvercrestmines
SilverCrest Mines Inc is a Canadian Silver & Gold producer in Mexico. The Santa Elena Mine in Sonora Mexico should produce about 33,000 ounces of Gold and 535,000 ounces of Silver in 2012. SilverCrest also has an exploration propertyin Durango, Mexico. The La Joya Project currently has a 101 million ounce silver eq. Resource After an 80 hole drill program in 2012, a new resource is expected to be released in early 2013.
CIBC organized a bus tour of gold mining operations in the Abitibi Gold Belt of Quebec and Ontario. Key observations included high competition for labor but it was manageable, infrastructure choices impact start-ups, equipment selection affects expansions, and the Abitibi camp still has significant gold reserves. Following the tour, CIBC lowered its price targets for Osisko and Kirkland Lake Gold due to commissioning issues at Osisko and adjusted assumptions at Kirkland Lake Gold.
- Agnico-Eagle Mines Limited provided a corporate update in May 2010, outlining its strategy, operating results, and strong financial position.
- The company's strategy focuses on increasing gold production, growing gold reserves through acquisitions like Comaplex Minerals Corp, being a low-cost leader, and maintaining a solid financial profile with $860 million in available liquidity.
- In Q1 2010 the company produced over 188,000 ounces of gold, exceeding Q1 2009 production, and estimates 2010 full year gold production around 1.057 million ounces at a total cash cost of $399 per ounce. Revenues increased to $237.6 million in Q1 2010.
This document provides an investor presentation for Newmont Mining Corporation from August 2018. It contains forward-looking statements regarding estimates of future production, costs, capital expenditures, and other metrics. It summarizes Newmont's strategy of investing in profitable projects across economic cycles to create long-term value. Examples provided include the Merian mine in Suriname, the Long Canyon expansion in Nevada, and the Tanami expansion in Australia. The presentation also highlights Newmont's industry-leading reserve base and long-term production profile from existing and future projects.
Newmont Mining Corporation reported its Q2 2018 earnings. Some key points:
- Gold production was in line with guidance at 1.2 million ounces. All-in sustaining costs were $1,024 per ounce.
- Safety performance is improving through applying lessons learned from recent accidents.
- Two projects, Twin Underground and Northwest Exodus, were delivered on time and under budget.
- An agreement was reached to evaluate the world-class Galore Creek copper-gold asset through a partnership with Teck.
- Costs and capital expenditures remain on track with full-year guidance.
Newmont Mining Corporation held an ESG briefing on May 22, 2018 to discuss their approach to sustainability. The briefing covered Newmont's environmental, social, and governance performance and strategies. Newmont's sustainability efforts are focused on minimizing risks and creating long-term value. Their sustainability framework and robust management systems aim to drive accountability and continuous improvement across their global portfolio.
- The document is a presentation from Gary Goldberg, President and CEO of Newmont Mining Corporation, at the BAML Global Metals & Mining Conference in May 2018.
- It discusses Newmont's strategy of focusing on sustainable value creation through its global portfolio of long-life assets and project pipeline, with improvements including new lower cost mines and profitable expansions.
- Newmont highlights its leading sustainability performance and top quartile total shareholder returns since 2014.
The document is an investor presentation from Newmont Mining Corporation that provides an overview of the company's operations and projects. It summarizes Newmont's track record of improving operational execution and reducing costs. It outlines a portfolio of projects expected to sustain profitable production over the next several years. These include expansions and new mines across North America, Australia, Africa, and South America. The presentation provides production and cost guidance for 2018-2022 and demonstrates Newmont's pipeline of long-term projects beyond the next 5 years.
- Newmont Mining Corporation reported its Q1 2018 earnings on April 26, 2018.
- The company reported adjusted EBITDA of $644 million, up 12% from the prior year quarter, and adjusted net income of $0.35 per diluted share.
- Production was in line with guidance at 1.2 million ounces of gold, and AISC was $973 per ounce, also in line with guidance.
This document provides an investor presentation for Newmont Mining Corporation from March 2018. It includes cautionary statements regarding forward-looking statements. The presentation summarizes Newmont's steady trajectory of improved financial and operational performance from 2013 to 2017. It highlights projects in the pipeline expected to sustain profitable production through 2024. The presentation also discusses Newmont's industry-leading reserve base, balanced capital priorities of growth, debt reduction and returning cash to shareholders, and leadership in profitability and responsibility.
This document is an investor presentation from Newmont Mining Corporation given at a BMO Metals & Mining Conference in February 2018. It summarizes Newmont's financial and operating performance in recent years, current projects and growth plans, and strategy for delivering long-term value to shareholders through profitable production, an industry-leading project pipeline, and returning cash to shareholders.
This document contains the highlights from Newmont Mining Corporation's full year and Q4 2017 earnings report. Some key points:
- Newmont achieved strong operational and financial performance in 2017, with 8% higher gold production of 5.3 million ounces and $1.5 billion in free cash flow, an 88% increase over 2016.
- The company invested in five expansion projects to extend production and replaced mining depletion by adding 6.4 million ounces of gold reserves and 7.9 million ounces of resources.
- Guidance for 2018 forecasts gold production of 4.9-5.4 million ounces at an all-in sustaining cost of $965-1,025 per ounce and total capital spending
This investor presentation provides an overview of Newmont Mining Corporation and its strategy for long-term value creation. Key points include:
- Newmont has a proven strategy of improving operations, strengthening its global portfolio of long-life assets, and delivering superior returns to shareholders.
- The company has significantly reduced costs while increasing production and reserves through operational improvements and profitable expansion projects.
- Newmont has an industry-leading project pipeline expected to provide stable production for over a decade and generate significant free cash flow.
- The company maintains a strong balance sheet, stable production profile, and pays a sustainable dividend, while continuing to invest in growth.
The document summarizes Newmont Mining Corporation's 2017 Investor Day that took place on December 6, 2017. It includes an agenda for the day-long event covering Newmont's business, technical, operational and exploration outlooks. Presentations were given on safety, Newmont's strategy and performance, the gold market outlook, and financial projections. The document provides an overview of Newmont's global portfolio of long-life assets and projects as well as charts on production, cost, capital and reserve metrics through 2022. It emphasizes Newmont's focus on operational excellence, profitable growth from its project pipeline, and leadership in sustainability and value creation.
This document is an investor presentation from Newmont Mining Corporation from November 2017. It summarizes Newmont's strategy to improve its underlying business through superior operational execution, strengthen its portfolio of global assets, and sustain a portfolio of long-life mines. Key points include Newmont leading the sector in safety and sustainability performance, having a global portfolio of long-life assets across four continents, and investing in profitable growth projects across its portfolio to extend mine lives and production.
- Newmont Mining Corporation reported its Q3 2017 earnings. Key highlights included strong operational execution, leading safety performance, and top sustainability ratings.
- AISC for Q3 was $943/oz due to strong performance in Africa, Australia, and North America. Attributable gold production for Q3 was 1.3 million ounces, up 7% from the prior year.
- The company is progressing long-life assets globally and longer-term growth projects in Canada, Australia, and French Guiana to sustain production and extend mine lives.
This document provides an overview of Newmont Mining Corporation's Nevada site tour in September 2017. It begins with a cautionary statement regarding forward-looking statements. The summary then discusses Newmont's strategic focus on improving safety and sustainability performance, strengthening its portfolio through projects like Long Canyon and Twin Creeks, and using its Full Potential program to drive cost improvements across its Nevada assets. An asset management discussion and demonstration of centralized health monitoring follows. The document provides background on regional leadership and concludes with information on local site leadership at Long Canyon.
Gary Goldberg, President and CEO of Newmont Mining Corporation, presented at the Denver Gold Forum in September 2017. The presentation covered Newmont's strategy of improving its underlying business through superior operational execution, strengthening its global portfolio of long-life assets, and creating value for shareholders by leading the sector in profitability and responsibility. It provided details on Newmont's projects and growth pipeline, industry-leading reserves, and financial flexibility to fund growth and return cash to shareholders.
Gary Goldberg, President and CEO of Newmont Mining Corporation, presented at the Denver Gold Forum in September 2017. The presentation covered Newmont's strategy of improving its underlying business through superior operational execution, strengthening its global portfolio of long-life assets, and creating value for shareholders by leading the sector in profitability and responsibility. It highlighted Newmont's industry-leading safety and cost improvement performance, profitable growth projects, top-tier reserves, and financial flexibility.
This document provides an overview of Newmont Mining Corporation's Nevada site tour in September 2017. It begins with a cautionary statement regarding forward-looking statements. The summary then discusses Newmont's strategic focus on improving safety and sustainability performance, strengthening its portfolio through projects like Long Canyon and Twin Creeks, and using its Full Potential program to drive cost improvements across its Nevada operations. An asset management discussion and demonstration of centralized health monitoring follows. The document provides background on regional leadership and concludes with information on site-specific leadership at Long Canyon.
The document is an investor presentation from Newmont Mining Corporation dated September 2017. It provides an overview of Newmont's operations, projects, growth opportunities and key metrics. Newmont has a geographically diverse portfolio of gold mines in North America, South America, Africa and Australia. It is investing in profitable growth projects across its portfolio to sustain steady long-term production while maintaining cost and capital discipline. Newmont also has a leading project pipeline and track record of bringing projects into production.
This document provides a cautionary statement regarding forward-looking statements in an investor presentation by Newmont Mining Corporation. It notes that estimates and expectations in the presentation are based on assumptions that may prove to be incorrect. It also lists potential risks to the forward-looking statements including changes in geotechnical or other conditions, permitting and development issues, political risks, commodity price volatility, and other operational risks. The company does not undertake to publicly revise or update forward-looking statements except as required by law.
SATTA MATKA DPBOSS KALYAN MATKA RESULTS KALYAN CHART KALYAN MATKA MATKA RESULT KALYAN MATKA TIPS SATTA MATKA MATKA COM MATKA PANA JODI TODAY BATTA SATKA MATKA PATTI JODI NUMBER MATKA RESULTS MATKA CHART MATKA JODI SATTA COM INDIA SATTA MATKA MATKA TIPS MATKA WAPKA ALL MATKA RESULT LIVE ONLINE MATKA RESULT KALYAN MATKA RESULT DPBOSS MATKA 143 MAIN MATKA KALYAN MATKA RESULTS KALYAN CHART
Unlocking WhatsApp Marketing with HubSpot: Integrating Messaging into Your Ma...Niswey
50 million companies worldwide leverage WhatsApp as a key marketing channel. You may have considered adding it to your marketing mix, or probably already driving impressive conversions with WhatsApp.
But wait. What happens when you fully integrate your WhatsApp campaigns with HubSpot?
That's exactly what we explored in this session.
We take a look at everything that you need to know in order to deploy effective WhatsApp marketing strategies, and integrate it with your buyer journey in HubSpot. From technical requirements to innovative campaign strategies, to advanced campaign reporting - we discuss all that and more, to leverage WhatsApp for maximum impact. Check out more details about the event here https://events.hubspot.com/events/details/hubspot-new-delhi-presents-unlocking-whatsapp-marketing-with-hubspot-integrating-messaging-into-your-marketing-strategy/
SATTA MATKA DPBOSS KALYAN MATKA RESULTS KALYAN MATKA MATKA RESULT KALYAN MATKA TIPS SATTA MATKA MATKA COM MATKA PANA JODI TODAY BATTA SATKA MATKA PATTI JODI NUMBER MATKA RESULTS MATKA CHART MATKA JODI SATTA COM INDIA SATTA MATKA MATKA TIPS MATKA WAPKA ALL MATKA RESULT LIVE ONLINE MATKA RESULT KALYAN MATKA RESULT DPBOSS MATKA 143 MAIN MATKA KALYAN MATKA RESULTS KALYAN CHART KALYAN CHART
Enabling Digital Sustainability by Jutta EcksteinJutta Eckstein
This is a New Zealand wide meetup event with meetup groups from Auckland, Wellington and Christchurch attending and open to anyone with an interest in digital sustainability or agile. All welcome. Joke, this is how it started. Jutta is now also available in Germany, i.e. hosted by Berlin/Brandenburg
According to the World Economic Forum, digital technologies can help reduce global carbon emissions by up to 15%. However, digitalization also comes with some challenges. Thus, if we want to make a positive impact by increasing sustainability, we need to address challenges like the digital divide, energy consumption of IT, or the rise of electronic waste. In this talk, I want to explore how Agile can help to leverage Digital Sustainability.
Tired of chasing down expiring contracts and drowning in paperwork? Mastering contract management can significantly enhance your business efficiency and productivity. This guide unveils expert secrets to streamline your contract management process. Learn how to save time, minimize risk, and achieve effortless contract management.
SATTA MATKA DPBOSS KALYAN MATKA RESULTS KALYAN CHART KALYAN MATKA MATKA RESULT KALYAN MATKA TIPS SATTA MATKA MATKA COM MATKA PANA JODI TODAY BATTA SATKA MATKA PATTI JODI NUMBER MATKA RESULTS MATKA CHART MATKA JODI SATTA COM INDIA SATTA MATKA MATKA TIPS MATKA WAPKA ALL MATKA RESULT LIVE ONLINE MATKA RESULT KALYAN MATKA RESULT DPBOSS MATKA 143 MAIN MATKA KALYAN MATKA RESULTS KALYAN CHART
Dpboss Satta Matta Matka Kalyan Chart Indian MatkaDpboss Matka
dpboss,Sattamatka,satta,matka,satta matka,kalyan weekly chart.kalyan chart. Kalyan jodi chart.kalyan penal chart.kalyan today.kalyan open.fix satta, fix fix fix Satta matka nambar,Sattamatka Win Provide The Best strategy to win a lot of money and Get Best Satta Matka Tips On Every Market & Fix Fix Fix Satta Namber, Satta Matka, Kalyan Matka, Matka Guessing, Satta Matka Result, and Matka Bazar. Satta Bazar, Matka Game, Kalyan Panel Chart, Sattaking143 Number Weekly Jodi, Matka Guessing Final Ank Open Close. Fix Fix FixSatta Nambar prabhat satta. Kalyan panel chart 2020–2010 Kalyan Night Chart, Indian Satta King Satta. Matka Result, Fix Matka, Satta Market, Matka Market, Matka, sattamatka, main ratan panel chart, mumbai panel chart. Milan panel chart, Matka one, simple matka guessing, param matka guessing trick 143 surya alex, satta, Dpboss, sattamatka, boss matka, matka boss,Satta Boss Tara Matka, Rajdhani Night Chart, and Golden Dubai Matka.Sattamatka Madhur Satta, Fastest Matka Satka Batta. Matka 420 Matka Boss, Kalyan Wapka Mobi Site 100 Tricks,Kalyan Night Panel Chart. Milan night panel chart, time bazar khiladi 420. Sona matka 111 420, boss 440, matka india net, weekly Indian Satta fix ank otg. Satta Matka Cool Tag- matka result, matka guessing, satta matta matka 143, dpboss, matka guessing fix Jodi, matka guessing 143, matka guessing dpboss, kalyan chart, Fix fix 3 ank today, Fix fix 3 ank 143, kalyan chart, kalyan final, kalyan open fix pana, fix fix 3 ank 4 ank, fix fix 3 ank time bazar, kalyan chart fix open to close Fix fix 3 ank kalyan, Fix fix 3 ank chart, fix fix fix open, 100 fix ank, , kalyan fix open 143, kalyan fix open guessing, kalyan open, kalyan 100 fix open today,
NewBase 20 June 2024 Energy News issue - 1731 by Khaled Al Awadi_compressed.pdfKhaled Al Awadi
Greetings,
Hawk Energy is pleased to present you with the latest energy news
NewBase 20 June 2024 Energy News issue - 1731 by Khaled Al Awadi
Regards.
Founder & S.Editor - NewBase Energy
Khaled M Al Awadi, Energy Consultant
MS & BS Mechanical Engineering (HON), USAGreetings,
Hawk Energy is pleased to present you with the latest energy news
NewBase 20 June 2024 Energy News issue - 1731 by Khaled Al Awadi
Regards.
Founder & S.Editor - NewBase Energy
Khaled M Al Awadi, Energy Consultant
MS & BS Mechanical Engineering (HON), USAGreetings,
Hawk Energy is pleased to present you with the latest energy news
NewBase 20 June 2024 Energy News issue - 1731 by Khaled Al Awadi
Regards.
Founder & S.Editor - NewBase Energy
Khaled M Al Awadi, Energy Consultant
MS & BS Mechanical Engineering (HON), USAGreetings,
Hawk Energy is pleased to present you with the latest energy news
NewBase 20 June 2024 Energy News issue - 1731 by Khaled Al Awadi
Regards.
Founder & S.Editor - NewBase Energy
Khaled M Al Awadi, Energy Consultant
MS & BS Mechanical Engineering (HON), USAGreetings,
Hawk Energy is pleased to present you with the latest energy news
NewBase 20 June 2024 Energy News issue - 1731 by Khaled Al Awadi
Regards.
Founder & S.Editor - NewBase Energy
Khaled M Al Awadi, Energy Consultant
MS & BS Mechanical Engineering (HON), USAGreetings,
Hawk Energy is pleased to present you with the latest energy news
NewBase 20 June 2024 Energy News issue - 1731 by Khaled Al Awadi
Regards.
Founder & S.Editor - NewBase Energy
Khaled M Al Awadi, Energy Consultant
MS & BS Mechanical Engineering (HON), USA
L'indice de performance des ports à conteneurs de l'année 2023SPATPortToamasina
Une évaluation comparable de la performance basée sur le temps d'escale des navires
L'objectif de l'ICPP est d'identifier les domaines d'amélioration qui peuvent en fin de compte bénéficier à toutes les parties concernées, des compagnies maritimes aux gouvernements nationaux en passant par les consommateurs. Il est conçu pour servir de point de référence aux principaux acteurs de l'économie mondiale, notamment les autorités et les opérateurs portuaires, les gouvernements nationaux, les organisations supranationales, les agences de développement, les divers intérêts maritimes et d'autres acteurs publics et privés du commerce, de la logistique et des services de la chaîne d'approvisionnement.
Le développement de l'ICPP repose sur le temps total passé par les porte-conteneurs dans les ports, de la manière expliquée dans les sections suivantes du rapport, et comme dans les itérations précédentes de l'ICPP. Cette quatrième itération utilise des données pour l'année civile complète 2023. Elle poursuit le changement introduit l'année dernière en n'incluant que les ports qui ont eu un minimum de 24 escales valides au cours de la période de 12 mois de l'étude. Le nombre de ports inclus dans l'ICPP 2023 est de 405.
Comme dans les éditions précédentes de l'ICPP, la production du classement fait appel à deux approches méthodologiques différentes : une approche administrative, ou technique, une méthodologie pragmatique reflétant les connaissances et le jugement des experts ; et une approche statistique, utilisant l'analyse factorielle (AF), ou plus précisément la factorisation matricielle. L'utilisation de ces deux approches vise à garantir que le classement des performances des ports à conteneurs reflète le plus fidèlement possible les performances réelles des ports, tout en étant statistiquement robuste.
SATTA MATKA DPBOSS KALYAN MATKA RESULTS KALYAN CHART KALYAN MATKA MATKA RESULT KALYAN MATKA TIPS SATTA MATKA MATKA COM MATKA PANA JODI TODAY BATTA SATKA MATKA PATTI JODI NUMBER MATKA RESULTS MATKA CHART MATKA JODI SATTA COM INDIA SATTA MATKA MATKA TIPS MATKA WAPKA ALL MATKA RESULT LIVE ONLINE MATKA RESULT KALYAN MATKA RESULT DPBOSS MATKA 143 MAIN MATKA KALYAN MATKA RESULTS KALYAN CHART
"𝑩𝑬𝑮𝑼𝑵 𝑾𝑰𝑻𝑯 𝑻𝑱 𝑰𝑺 𝑯𝑨𝑳𝑭 𝑫𝑶𝑵𝑬"
𝐓𝐉 𝐂𝐨𝐦𝐬 (𝐓𝐉 𝐂𝐨𝐦𝐦𝐮𝐧𝐢𝐜𝐚𝐭𝐢𝐨𝐧𝐬) is a professional event agency that includes experts in the event-organizing market in Vietnam, Korea, and ASEAN countries. We provide unlimited types of events from Music concerts, Fan meetings, and Culture festivals to Corporate events, Internal company events, Golf tournaments, MICE events, and Exhibitions. 𝐓𝐉 𝐂𝐨𝐦𝐬 provides unlimited package services including such as Event organizing, Event planning, Event production, Manpower, PR marketing, Design 2D/3D, VIP protocols, Interpreter agency, etc.
⭐ 𝐅𝐞𝐚𝐭𝐮𝐫𝐞𝐝 𝐩𝐫𝐨𝐣𝐞𝐜𝐭𝐬:
➢2024 GROUNDBREAKING CEREMONY OF SK LEAVEO PLANT
➢2024 BAEKHYUN [Lonsdaleite] IN HO CHI MINH
➢2024 CHILDREN ART EXHIBITION 2024: BEYOND BARRIERS
➢SUPER JUNIOR-L.S.S. THE SHOW : Th3ee Guys in HO CHI MINH
➢WOW K-Music Festival 2023
➢ Winner [CROSS] Tour in HCM
➢ Super Show 9 in HCM with Super Junior
➢ HCMC - Gyeongsangbuk-do Culture and Tourism Festival
➢ Korean Vietnam Partnership - Fair with LG
➢ Korean President visits Samsung Electronics R&D Center
➢ Vietnam Food Expo with Lotte Wellfood
➢ Daewon Pharm Year End Party
➢ Giant Lantern Festival in Ha Noi with Gamuda Land
➢ Light Festival 2019 in HCMC with Phu My Hung Corp
(etc)
"𝐄𝐯𝐞𝐫𝐲 𝐞𝐯𝐞𝐧𝐭 𝐢𝐬 𝐚 𝐬𝐭𝐨𝐫𝐲, 𝐚 𝐬𝐩𝐞𝐜𝐢𝐚𝐥 𝐣𝐨𝐮𝐫𝐧𝐞𝐲. 𝐖𝐞 𝐚𝐥𝐰𝐚𝐲𝐬 𝐛𝐞𝐥𝐢𝐞𝐯𝐞 𝐭𝐡𝐚𝐭 𝐬𝐡𝐨𝐫𝐭𝐥𝐲 𝐲𝐨𝐮 𝐰𝐢𝐥𝐥 𝐛𝐞 𝐚 𝐩𝐚𝐫𝐭 𝐨𝐟 𝐨𝐮𝐫 𝐬𝐭𝐨𝐫𝐢𝐞𝐬."
SATTA MATKA DPBOSS KALYAN MATKA RESULTS KALYAN CHART KALYAN MATKA MATKA RESULT KALYAN MATKA TIPS SATTA MATKA MATKA COM MATKA PANA JODI TODAY BATTA SATKA MATKA PATTI JODI NUMBER MATKA RESULTS MATKA CHART MATKA JODI SATTA COM INDIA SATTA MATKA MATKA TIPS MATKA WAPKA ALL MATKA RESULT LIVE ONLINE MATKA RESULT KALYAN MATKA RESULT DPBOSS MATKA 143 MAIN MATKA KALYAN MATKA RESULTS KALYAN CHART
Satta Matka Dpboss Kalyan Matka Results Kalyan Chart
Stifel report
1. January 19, 2012
Metals & Mining
Gold & Precious Metals
Pre-Results Comment
4Q11 Earnings Preview: Capital Punishment
Companies under coverage begin reporting 4Q11 earnings during the week of January 23. We forecast a
10% decrease in sector earnings from 3Q11 due to significant decreases in by-product revenues.
A summary of updated target prices and estimates is included in the table below, with details on NAVPS and CFPS
changes on page 10. Quarterly deliverables and upcoming catalysts by company as well as detailed guidance may be
found on pages 4-5.
Fourth Quarter Earnings Expectations
Company Ticker Rating New Target Old Target Price 4Q11E (SN) 4Q11E (Cons) 2012E (SN) Earnings Date Analyst
Price (1) Price (1) (Jan-18) (2) (2) (2) (3)
Allied G old Mining PLC ALD-T HOLD C$2.43 -$0.02 $0.01 $0.36 Jan-23 Bef-Mkt JW
Barrick G old Corp. ABX BUY US$70.00 US$69.00 US$47.95 $1.21 $1.31 $5.54 Feb-16 Bef-Mkt GT
Centamin Egypt Ltd. CEE-T HOLD C$1.46 $0.04 $0.04 $0.18 Jan-30 Bef-Mkt GT
Chalice Gold Mines Ltd. CXN-T BUY $0.35 $0.50 C$0.30 $0.00 N/A -$0.01 N/A JW
Dundee Precious Metals Inc. DPM-T BUY $13.50 $13.50 C$8.94 $0.22 $0.26 $1.18 Feb-23 Aft-Mkt JW
Eldorado G old Corp. EGO HOLD US$13.99 $0.17 $0.20 $0.86 Feb-24 Bef-Mkt JW
European Goldfields Ltd. EGU-T HOLD C$11.95 -$0.07 -$0.04 -$0.22 Mar-15 Est. JW
G oldcorp Inc. GG BUY US$65.00 US$65.00 US$44.93 $0.56 $0.62 $2.55 Feb-15 Aft-Mkt GT
G reat Basin Gold Ltd. GBG-T HOLD C$1.09 $0.00 $0.02 $0.07 Feb-24 Bef Mkt JW
IAMG OLD Corp. IAG BUY US$23.00 US$23.50 US$16.23 $0.37 $0.33 $1.33 Feb-23 Aft-Mkt JW
Kinross G old Corp. KG C BUY US$17.00 US$17.00 US$10.39 $0.19 $0.22 $0.92 Feb-15 Aft-Mkt GT
Newmont Mining Corp. NEM BUY US$80.00 US$83.00 US$60.35 $1.17 $1.25 $4.96 Feb-24 Bef-Mkt GT
O sisko Mining OSK-T HOLD C$11.51 $0.08 $0.10 $0.99 Feb-23 Aft-Mkt GT
Randgold Resources G OLD HOLD US$111.54 $1.13 $1.48 $6.53 Feb-06 Bef-Mkt JW
Semafo Inc. SMF-T BUY $10.50 $12.00 C$7.47 $0.11 $0.13 $0.49 Mar-14 Est. JW
T orex Gold Resources Inc. T XG-T BUY $2.25 $2.25 C$1.99 -$0.02 N/A -$0.04 N/A JW
(1) Canadian listed target prices are in CAD
(2) EPS adjusted to exclude non-recurring or extraordinary items
(3) G T - George Topping, JW - Josh W olfson
Source: FactSet, Bloomberg, Stifel
We expect major quarterly themes to be:
Capital Spending Increases: Thus far, 2012 capex guidance from five producers under coverage has been 50% higher
on average than our previous forecast primarily due to timing differences and inflation. We forecast sector capital
spending will increase 14% from 2011, reflecting in part the 32% increase in sector operating cash flows as a result of
high gold prices in 2011 and consequent ability to finance more development projects, but also inflationary pressures.
Although recent input price pressures have subsided somewhat since 3Q11 (diesel -3%, trade weighted US$ +4%),
labour inflation persists and the risk of equipment availability shortages lingers, with manufacturers Komatsu and Joy
Global anticipating double digit growth in 2012 from record 2011 mining equipment demand.
Risks To Project Financing: While market conditions proved generally challenging in the fourth quarter, junior producers
and advanced developers under coverage have been particularly impacted by project financing limitations for both equity
and debt options. In addition to elements of production hedges, project financing facilities secured by producers Allied
Josh Wolfson, CFA jwolfson@stifel.com (416) 815-3080
George Topping gtopping@stifel.com (416) 815-3113
Dave Hove dhove@stifel.com (416) 815-1548
Kelvin Lin klin@stifel.com (416) 815-3106
Stifel Nicolaus Equity Trading Desk US: (800) 424-8870 Canada: (866) 752-4446
Stifel Nicolaus does and seeks to do business with companies covered in its research reports. As a result,
investors should be aware that the firm may have a conflict of interest that could affect the objectivity of this
report. Investors should consider this report as only a single factor in making their investment decision.
All relevant disclosures and certifications appear on pages 44 - 45 of this report.
2. Metals & Mining
Gold & Precious Metals January 19, 2012
Gold and Great Basin Gold in 4Q bear coupon rates of 12% and LIBOR + 4% respectively. While these debt financings
facilitate project development and ramp up in the absence of equity financing options, increased corporate leverage and
production hedges will limit the operating leverage available to equity investors. In our view, as financing limitations persist
for advanced developers, investor focus will shift towards project operating margins and initial spending requirements,
from traditional NAV and per ounce valuations.
Potential Industry Consolidation: Discounted equity valuations have spurred an increase in gold-related transactions
with companies seeking to consolidate jurisdictions and grow through acquisition. Eldorado Gold and European Goldfields
announced a friendly combination that would increase Eldorado’s presence in the Aegean, New Gold consolidated
ownership of its Blackwater project in Canada by acquiring property holders Silver Quest Resources and Geo Minerals,
and Chalice Gold announced the sale of its Zara gold project in Eritrea to Shanghai Construction Group, which maintains
a portfolio of projects in country. During the quarter, B2Gold announced it would acquire Auryx Gold, while Jaguar Mining
and Oromin Explorations both announced entering discussions with unidentified parties that could potentially lead to sales
or mergers.
Operating Costs On The Rise: We forecast operating costs will increase by 11% in 2012 as a result of expected general
cost inflation in the mining industry, including consumables and labour, as well as lower grades mined, which become
economic at high gold prices. Below is a summary of 2012 cost expectations by senior producers:
Senior Producer Forecast Total Cash Cost Increases - Latest 2012E Guidance vs. 2011E
2011E 2012E Guidance 2012E Guidance/2011E
Company Ticker (US$/oz) (US$/oz) (% Change)
Goldcorp GG $530 $550 - $600 4% - 13%
Kinross KGC $600 $670 - $715 12% - 19%
Newmont NEM $597 $625 - $675 5% - 13%
Barrick (1) ABX $461 $530 15%
(1) Barrick - no guidance has been provided for 2012, $530/oz (15% 2012E/2011E increase) is current SN estimate
Source: Stifel Nicolaus estimates, company reports
Page 2
3. Metals & Mining
Gold & Precious Metals January 19, 2012
Earnings Calendar
Com pany Ticker Earnings Date Tim e Consensus S N 3Q 11E Adj. Call Date & Tim e Call N um bers
EP S EP S (ET)
Week of Jan 23, 2012 22-Jan
Allied Gold Ltd. ALD-T 23-Jan B ef-M kt 0.01 (0.02)
Week of Jan 30, 2012 29-Jan
Centam in E gypt Ltd. CE E-T 30-Jan B ef-M kt 0.04 0.04
Royal Gold Inc. R GLD , RGL-T 2-Feb B ef-M kt 0.49 2-Feb 12:00PM 1 800 603 2779 or 1 973 200 3960
Week of Feb 6, 2012 5-Feb
Harm ony Gold M ining Co. Ltd. H MY 6-Feb E st. 1.00
Randgold R esources Ltd. GOLD 6-Feb B ef-M kt 1.48 1.13 6-Feb 11:00AM 1 866 966 5335 or 1 800 608 0547
Week of Feb 13, 2012 12-Feb
Pan Am erican Silver Corp. P AAS 15-Feb E st. 0.55
Goldcorp Inc. G G, GG -T 15-Feb Aft-M kt 0.62 0.56 16-Feb 1:00PM 1 800 355 4959 or 1 416 695 6617
Kinross G old C orp. KGC , K-T 15-Feb Aft-M kt 0.22 0.19 16-Feb 8:30AM 1 800 319 4610 or 1 604 638 5340
Agnico-E agle M ines Ltd. AEM , AE M-T 16-Feb E st. 0.52 16-Feb 11:00AM 1 800 814 4859 or 1 416 644 3414
OceanaGold Corp. OG C-T 16-Feb B ef-M kt 0.03
Barrick G old Corp. AB X, AB X-T 16-Feb B ef-M kt 1.31 1.21 16-Feb 9:30AM 1 800 742 6164 or 1 212 231 2901
Gold Fields Ltd. GFI 17-Feb E st. 1.49
Week of Feb 20, 2012 19-Feb
Yam ana Gold Inc. AUY , YRI-T 22-Feb Aft-M kt 0.25 23-Feb 11:00AM 1 800 952 6845 or 1 416 695 6616
Dundee P recious M etals Inc. D PM -T 23-Feb Aft-M kt 0.26 0.22
Golden Star Resources Ltd. G SS, G SC-T 23-Feb E st. 0.01
IAM GOLD Corp. IAG, IM G-T 23-Feb Aft-M kt 0.33 0.37
Alam os Gold Inc. AG I-T 23-Feb B ef-M kt 0.21 23-Feb 12:00PM 1 800 355 4959 or 1 416 695 6617
Centerra Gold Inc. CG -T 23-Feb Aft-M kt 0.37 24-Feb 10:30AM 1 800 895 5087 or 1 212 231 2903
Osisko Mining O SK-T 23-Feb Aft-M kt 0.10 0.08 24-Feb 11:00AM 1 800 931 6421 or 1 416 981 9000
Minefinders C orp. Ltd. M FN, M FL-T 23-Feb A ft-m kt 0.22 24-Feb 11:00AM 1 877 440 9795 or 1 416 340 8530
Com pania de M inas Buenaventura B VN 24-Feb E st. 0.84
Newm ont M ining C orp. N EM 24-Feb B ef-M kt 1.25 1.17
Great Basin Gold Ltd. GB G, GB G-T 24-Feb Bef Mkt 0.02 0.00
Prim ero M ining P-T 24-Feb E st. N/A
Hecla M ining Com pany HL 24-Feb E st. 0.07
Eldorado Gold C orp. E GO, E LD-T 24-Feb B ef-M kt 0.20 0.17 24-Feb 11:30AM 1 877 440 9795 or 1 416 340 8527
Week of Feb 27, 2012 and thereafter 26-Feb
New Gold Inc. NG D, NG D-T 2-Mar E st. 0.11
Week of M ar 5, 2012 and thereafter 4-M ar
Silver W heaton Corp. SLW , SLW -T 14-Mar E st. 0.44
Aurizon M ines Ltd. A ZK, A RZ-T 15-Mar E st. 0.13
AngloG old Ashanti Ltd. AU 15-Mar E st. 3.87
European Goldfields Ltd. EG U-T 15-Mar E st. (0.04) (0.07)
Jaguar Mining Inc. JA G, JAG -T 21-Mar E st. 0.03
Franco-N evada Corporation FNV-T 21-Mar E st. 0.32 22-Mar 10:00AM
AuRico Gold Inc AU Q, AU Q-T 23-Mar E st. 0.19
Sem afo Inc. S MF-T 14-Mar E st. 0.13 0.11
Source: Bloom berg, Com pany reports, Stifel N icolaus estim ates
Page 3
4. Metals & Mining
Gold & Precious Metals January 19, 2012
Deliverables Update and Production Guidance - Senior and Intermediate Producers
4Q11 Deliverables In the Pipeline 2011 Corporate Guidance SN Models - 2011E 2012 Corporate Guidance SN Models - 2012E
Barrick Gold Production (koz) Costs ($/oz) Production (koz) Costs ($/oz) Production (koz) Costs ($/oz) Production (koz) Costs ($/oz)
· Pueblo Viejo construction update · Pueblo Viejo 60% j/v startup ( $3.6-3.8B capex, mid-2012) 7,600-7,800 equity $460-$475 TCC 7,700 $460 TBA 7,830 $530
· Lumw ana copper production and exploration results from 16 rigs · Pascua Lama $1.25B debt financing (2012)
· Pascua Lama startup ($5.0B capex, mid-2013)
· Cerro Casale 75% j/v EIA approval ($6B capex, early 2013)
· Jabal Sayid copper production startup ($400mm capex, 2H12)
Eldorado Gold
· Efemcukuru ramp-up update · European Goldfields merger meeting (February 2012) 650 consolidated $400 CC 659 $405 730-775 $430-$450 CC 743 $429
· Eastern Dragon permitting update (1H12), commissioning (3Q12) P ro ductio n and o perating co sts pre-released consolidated
· Tocantizinho feasibility study (2Q12) and construction decision (2H12)
· Approval of Perama Hill EIA (1H12)
Goldcorp
· Penasquito ramp up to 130ktpd ($30mm remedial capex) · Pueblo Viejo 40% j/v startup ($3.6-3.8B capex, delayed mid-2012) 2,500-2,550 equity $500-$550 TCC 2,515 $531 2,600 equity $550-$600 TCC 2,596 $566
· Reserve and resource update, including Cerro Negro · El Morro construction startup ($3.9B capex, 2Q12) P ro ductio n pre-released
· Cerro Negro startup ($0.7B capex, 2013) and Eleonore startup ($1.4B Trimmed fro m 2.65-2.75mmo z at $ 475-500/o z po st 2Q.
IAMGOLD
· Rosebel expansion details · Niobec pre-feasibility (1Q12), rare earth element resource (1Q12) 870-930 equity* $620-$650 TCC 896* $637 840-910 equity $670-$695 TCC 865 $676
· Essakane expansion feasibility and construction decision · Updated Westw ood feasibility (1Q12) Operating results pre-released
· Sadiola deep sulphide construction decision · Potential Niobec strategic transaction (2012)
· Kalana resource (3Q12)
· French Guiana election (April 2012), France election (May 2012)
· Mali election (April 2012) *fro m co ntinuing o peratio ns
Kinross
· Tasiast, FDN, and Lobo Marte project capex and optimization plan · Lobo Marte ($0.7B+~20% capex) feasibility study (delayed, 2012) 2,600-2,700 equiv. $565-$610 CAS 2,580 $604 2,600-2,800 equiv. $670-$715 CAS 2,672 $734
· FDN mining agreement w ith Ecuador update · FDN ($1.1B+~20%) feasibility study (delayed, 2012) P rereleased that o perating results will be
· Paracatu remedial third ball mill ramp up update · Tasiast 60ktpd expansion feasibility study ($3.0B, delayed to end-2012) appro ximately 2.6 mm GEO at $ 600/GEO
· Dvoinoye feasibility study ($300mm capex, 1Q12)
· Dvoinoye initial ore to Kupol (2H13)
· Paracatu remedial investment (4th ball mill $120mm capex, 1H12)
· Tasiast expansion permits (delayed, from 2Q12)
· Tasiast startup (delayed, from 4Q13) Revised fro m 2.5-2.6 mmGEO po st co nso lidatio n o f Kupo l.
New m ont Mining
· Boddington ramp up update · Akyem start-up ($0.95-$1.1bln capex, early 2014E) 5,100-5,300 equity $560-$590 CAS 5,160 $897 5,100-5,200 equity $625-$675 CAS 5,139 $884
· Conga (Peru) update · Conga startup ($4.0-$4.8B capex, 2015/2016E) P ro ductio n and o perating co sts pre-released
· Merian (Suriname) development agreement update · Tanami expansion completion ($400-$450mm capex, 2015E)
Osisko Mining
· Malartic ramp up to 55ktpd capacity · South Barnat deposit road deviation approval (delayed) 190-200 equity *$900-932 CC 200 $925 610 - 675 equity $510-575 CC 537 $677
· Hammond Reef development update · Malartic expansion to 60ktpd ($32mm capex, 1H12) 201 guidance trimmed fro m 285-295ko z po st 3Q, 350-400ko z po st 2Q & o riginal feasibility 498ko z at $ 273/o z
1
· Ramp up to full 60ktpd capacity (end of 2012) 201 CC guidance was fo r 2H1 o nly
1 1
Randgold Resources
· Loulo mill installation, heap leach study · Senegal elections (February 2012) 690-700 < $700 TCC 696 $718 TBA 853 $592
· Gounkoto underground economic evaluation · Mali elections (April - July 2012) consolidated
· Kibali construction commencement
· Morila tailings reprocessing feasibility study
· Recalculation of reserves at $1,000/oz Revised fro m < $ 600 TCC
SEMAFO
· Mana expansion to 8,000 tpd update · Samira Hill exploration (ongoing) 238-263 equity $595-$645 CC 250 $608 TBA 259 $655
· Kiniero care and maintenance update · Mana exploration (ongoing)
· Underground construction commencement (1Q12)
· Mana phase IV plant expansion (2Q12)
· Potential GoviEX listing (2H12)
· Burkina Faso pow er line commissioning (2H13)
(1) equivalent - Equivalent Gold Production (silver and gold); consolidated/ equity - Consolidated/ Equity Gold Production
(2) CC - Cash Costs (before royalties); TCC - Total Cash Costs (after royalties); CAS - Cost Applicable To Sales
Source: Company reports, Stifel Nicolaus estimates
Page 4
5. Metals & Mining
Gold & Precious Metals January 19, 2012
Deliverables Update and Production Guidance - Junior Producers and Advanced Developers
4Q11 Deliverables In the Pipeline 2011 Corporate Guidance SN Models - 2011E 2012 Corporate Guidance SN Models - 2012E
Allied Gold Production (koz) Costs ($/oz) Production (koz) Costs ($/oz) Production (koz) Costs ($/oz) Production (koz) Costs ($/oz)
· Gold Ridge ramp-up update · Simberi plant 3.5 mmtpa expansion and HFO installation (4Q12) 58 Simberi $1,000 TCC 57 $1023 Simberi TBA 72 $890 Simberi
· Simberi sulphide bankable feasibility (2012); construction decision (2014) 40 Gold Ridge Not Provided 51 $1392 Gold Ridge 100 $1038 Gold Ridge
· Simberi & Gold Ridge exploration (ongoing) (FYE June 30) - co mpany guidance and SN estimates are CY 2011
Centam in Egypt
· Sukari mine ramp up to 5mmtpy update · Stage 4 plant expansion to 10 mmtpa completion ($255mm capex, 1Q13) 202-210 equity $550 CC 203* $640 TBA 242 $660
· Sukari underground mining ramp up update · Egypt parliamentary (Nov 2011 - Mar 2012) P ro ductio n pre-released
· Egypt update · Egypt presidential elections (Jun 2012)
· New mining law in Egypt (pending) Guidance lo wered fro m 250-290ko z at $ 450/o z po st 2Q
Chalice Gold
· Koka mining agreement (delivered) · Receipt of ENAMCO $34mm payment for 30% interest (January 2012) - - - - - - - -
· Koka mining license (delivered) · Due diligence completion by Shanghai Construction Group (March 2012)
· Mogoraib drilling (1Q12)
· Koka construction (1H12) and production (2014)
Dundee Precious Metals
· Krumovgrad EIA decision (delivered) · Chelopech expansion to 2 mmtpa (3Q12) 120-123* gold 113* $384* TBA 153* $314*
· Krumovgrad feasibility study (delivered) · NCS sulphuric acid plant feasibility study (mid-2012) 38.0-39.5* mmlbs copper 34.1* $0.96*/lb 43.7* $0.7*/lb
· Chelopech expansion update · NCS throughput expansion (4Q12) 1.8 mmt ore processed at Chelopech 1.7 mmt ore processed at Chelopech
· Deno open-pit scoping study (2H12), underground resource (1Q13) *metals in co ncentrate
European Goldfields
· Eldorado Gold merger meeting (February 2012) - - - - - - - -
· Skouries construction permits and contractor selection (1H12)
· Olympias concentrate agreement (1H12)
· Piavitsa resource (1H12)
· Flash smelter feasibility (2H12)
· Certej final permits (2012)
Great Basin Gold
· Hollister resource update · Burnstone ramp-up (2011-2013) 100-110* Hollister $600-$650 CC 100* $574 100* 101* $653
· Esmeralda on-site dore production · Hollister EIS approval (2012) 29-32 Burnstone $1677 - CC 24 $1676 135 71 $1120
· Burnstone line 2 electrical permit (2012) *go ld equivalent pro ductio n
Torex Gold Resources
· Updated Morelos resource estimate (1Q12) - - - - - - - -
· Morelos bankable feasibility study (2Q12)
· Mexico elections (July 2012)
· Permanent land access agreements (1H12)
· Morelos south of the river drilling (2012)
(1) equivalent - Equivalent Gold Production (silver and gold); consolidated/ equity - Consolidated/ Equity Gold Production
(2) CC - Cash Costs (before royalties); TCC - Total Cash Costs (after royalties); CAS - Cost Applicable To Sales
Source: Company reports, Stifel Nicolaus estimates
Page 5
6. Metals & Mining
Gold & Precious Metals January 19, 2012
4Q11 Earnings Preview
Producers in our coverage universe are expected to begin reporting December
quarter earnings during the week of January 23. Total sector earnings are
forecasted to decrease 10% from last quarter and increase 24% from last year.
Observations:
Total sector earnings are forecast to decrease 10% from 3Q11 to 4Q11,
impacted by a 1% decrease in the price of gold, a 1% increase in total
cash costs, and significant decreases in by-product revenues. Of the 14
reporting companies under coverage, producers expected to report
notable increases in EPS include IAMGOLD and Osisko.
Year-over-year, total sector earnings excluding write-downs are
expected to rise 24% from 4Q10 to 4Q11, due to higher metal prices
(gold +23%, silver +20%, offset by copper -13%) and 2% higher
production (13% increase in throughput as a result of consolidations,
expansions, and new mines), slightly offset by 13% higher operating
costs (3% lower head grades, 10% increase in diesel prices).
4Q results from by-product metal producers are expected to be weaker
versus 3Q11 due to lower silver (-18%), copper (-17%), and zinc prices
(-15%). The largest percentages of non-gold revenues in 4Q11 are
expected to be generated by European Goldfields, (43% silver, 57%
zinc and lead), Dundee Precious Metals (2% silver and 31% copper),
and Goldcorp (15% silver, 4% copper, 7% zinc and lead). Lower base
metals’ prices in the quarter are also expected to negatively impact by-
product copper producers, including Barrick (14% copper) and
Newmont (6% copper). The lower silver price in the quarter is expected
to negatively impact Kinross (7% silver) and Great Basin (6% silver).
Quarterly Currency & Commodity Comparisons
Spot Change Change Change
4Q11 3Q11 4Q10
(Jan-18) Spot/4Q11 4Q11/3Q11 4Q11/4Q10
Gold (US$/oz) $1,661 -1% $1,682 $1,704 -1% $1,367 23%
Silver (US$/oz) $30.50 -4% $31.80 $38.86 -18% $26.46 20%
Copper (US$/lb) $3.73 10% $3.40 $4.07 -17% $3.92 -13%
Zinc (US$/lb) $0.91 6% $0.86 $1.01 -15% $1.05 -18%
WTI Crude (US$/Bbl) $100 7% $94 $89 5% $85 10%
C$:US$ 1.01 -1% 1.02 0.98 4% 1.01 1%
A$:US$ 0.96 -2% 0.99 0.95 4% 1.01 -2%
Rand:US$ 8.02 -1% 8.09 7.13 13% 6.90 17%
Real:US$ 1.77 -1% 1.80 1.63 10% 1.70 6%
CLP:US$ 496 -3% 512 472 8% 480 7%
Source: Factset, Bloomberg, Stifel Nicolaus
Page 6
7. Metals & Mining
Gold & Precious Metals January 19, 2012
Operating Expectations
For companies under coverage, production will be flat at 5.3 million ounces in
4Q11 versus last quarter. Increased production from Goldcorp (+16%,
Penasquito ramping up and Marlin accessing higher grade ore) and IAMGOLD
(+14%, 3Q11 production shortfall) is expected to be offset by weaker results from
Barrick (-4%, lower grades at Cortez Hills) and Kinross (-5%, lower throughput
at Paracatu).
Fourth quarter total cash costs (co-product basis) are expected to rise 2% to
$585/oz from $573/oz in 4Q11, and 14% from 4Q10. Compared to last quarter,
the strongest improvements in total cash costs on a per ounce basis are
expected to be reported by Centamin (-6%, Sukari ramping up as well as
management capitalizing underground development costs and deferring
stripping), Osisko (-8%, higher grades at Malartic), Newmont (-5%, higher
grades at Boddington, Yanacocha, and Nevada), but not enough to offset higher
costs forecasted for Barrick (+12%, higher consumable and labor costs at
operations in Africa, Australia and South America off a low 3Q11 base), Kinross
(+5%, higher consumable and labor costs at operations in Africa and South
America), Dundee Precious Metals (+12%, lower copper revenues and weaker
anticipated Deno results), and Allied Gold (+9%, ramp-up at Gold Ridge).
Gold Production (000 ounces)
4Q11E 4Q11 4Q11 2011 2012 2013
Com pany 3Q11A 4Q10A 2010A 2011E 2012E 2013E
(SN) /3Q11 /4Q10 /2010 /2011 /2012
Allied Gold Mining PLC 31 36 -14% 19 65% 70 108 54% 172 59% 222 29%
Barrick Gold Corp. 1,835 1,928 -5% 1,700 8% 7,788 7,700 -1% 7,830 2% 8,158 4%
Centamin Egypt Ltd. 59 51 17% 53 11% 150 203 35% 242 19% 374 55%
Dundee Precious Metals Inc. 30 34 -12% 20 49% 79 109 37% 140 29% 157 12%
Eldorado Gold Corp. 158 167 -6% 138 15% 594 612 3% 700 14% 836 20%
European Goldfields Ltd. 0 0 NM 0 NM 0 0 NM 23 NM 55 142%
Goldcorp Inc. 688 592 16% 690 0% 2,520 2,515 0% 2,596 3% 3,168 22%
Great Basin Gold Ltd. 33 29 14% 21 62% 65 118 82% 163 38% 210 29%
IAMGOLD Corp. 253 222 14% 315 -20% 967 963 0% 865 -10% 973 13%
Kinross Gold Corp. 570 597 -5% 623 -9% 2,191 2,350 7% 2,503 6% 2,534 1%
New mont Mining Corp. 1,279 1,311 -2% 1,353 -5% 5,391 5,160 -4% 5,139 0% 5,071 -1%
Osisko Mining 80 74 8% 0 NM 0 200 NM 537 168% 630 17%
Randgold Resources 190 182 4% 132 44% 440 696 58% 853 22% 855 0%
Semafo Inc. 65 62 5% 62 5% 261 250 -4% 259 4% 348 34%
Total 5,270 5,285 0% 5,124 3% 20,517 20,983 2% 22,021 5% 23,591 7%
(1) Co-product costs w ith royalties
Source: FactSet, Company reports, Stifel Nicolaus estimates
Total Cash Costs (US$/oz) (co-product basis)
4Q11E 4Q11 4Q11 2011 2012 2013
Com pany 3Q11A 4Q10A 2010A 2011E 2012E 2013E
(SN) /3Q11 /4Q10 /2010 /2011 /2012
Allied Gold Mining PLC 1254 1148 9% 652 92% 666 1196 80% 976 -18% 904 -7%
Barrick Gold Corp. 509 453 12% 486 5% 457 460 1% 530 15% 562 6%
Centamin Egypt Ltd. 647 686 -6% 539 20% 555 640 15% 660 3% 741 12%
Dundee Precious Metals Inc. 69
8 765 14% 834 4% 786 817 4% 781 -4% 812 4%
Eldorado Gold Corp. 472 477 -1% 460 3% 423 472 12% 486 3% 523 8%
European Goldfields Ltd. 0 0 NM 0 NM 0 0 NM 915 NM 957 5%
Goldcorp Inc. 542 561 -3% 461 18% 443 531 20% 566 7% 512 -9%
Great Basin Gold Ltd. 1001 1018 -2% 669 50% 753 901 20% 943 5% 925 -2%
IAMGOLD Corp. 646 674 -4% 574 12% 574 648 13% 676 4% 729 8%
Kinross Gold Corp. 663 634 5% 551 20% 509 604 19% 734 21% 769 5%
New mont Mining Corp. 600 634 -5% 517 16% 513 598 17% 675 13% 725 7%
Osisko Mining 868 939 -8% 0 NM 0 953 NM 707 -26% 632 -11%
Randgold Resources 741 747 -1% 766 -3% 697 718 3% 592 -17% 577 -3%
Semafo Inc. 712 733 -3% 596 19% 518 690 33% 745 8% 800 7%
Weighted Average 585 573 2% 515 14% 490 554 13% 615 11% 636 3%
Source: FactSet, Company reports, Stifel Nicolaus estimates
Page 7
9. Metals & Mining
Gold & Precious Metals January 19, 2012
Changes To Estimates
In addition to adjusting our near-term commodity prices for all 16 companies
under coverage, we have rolled over our 12-month target price setting cash flow
estimates to 2012/2013 (from 2011/2012) and made the following changes:
Goldcorp (GG, BUY)
Incorporated 4Q pre-released production.
Updated model with 2012 financial and operating guidance, as well as 5-
year production guidance.
Delayed El Morro startup to 2018 (from 2016).
Adjusted Marlin production profile as it transitions to underground
mining.
Lowered target setting cash flow multiple to 13x (from 14x), but
maintained NAV multiple at 1.3x.
Barrick (ABX, BUY)
Lowered target setting cash flow multiple to 10x (from 11x), but
maintained NAV multiple at 1.0x.
Newmont (NEM, BUY)
Incorporated 4Q pre-released production and operating costs.
Updated model with 2012 financial and operating guidance, including
higher operating costs at Boddington and other Australia/NZ mines.
Increased capex generally in-line with guidance but allocated only
$400mm (versus company guidance of $1.15-1.25billion) for Conga
which we delayed to 2016E startup as a result of reported protests and
work-stoppages.
Lowered target setting cash flow multiple to 10x (from 11x) to reflect the
country risk (Peru) and lack of near-term growth, but maintained NAV
multiple at 1.0x.
Kinross (KGC, BUY)
See KGC note published 1/17/2012.
Dundee Precious Metals (DPM-T, BUY)
Incorporated updated Krumovgrad assumptions in line with recently
published feasibility study results.
IAMGOLD (IAG, IMG-T, BUY)
Incorporated 4Q operating results and 2012 management guidance.
SEMAFO (SMF-T, BUY)
Removed Kiniero from 2013 production estimates.
Osisko (OSK-T, Hold)
Updated Hammond Reef resources (lower grades reported 11/7/11)
resulting in increased LOM operating costs, increased our capex
estimate to $1 billion (from $750mm) in-line with Malartic, and delayed
startup to 2016 (from 2015).
For the first ten years, cash costs should average $600/oz.
Lowered Malartic’s discount rate to 3% (from 5%), in line with other
producers.
Lowered our near-term tax rate assumptions as the company is partially
sheltered by tax pools related to Hammond Reef spending.
Page 9
10. Metals & Mining
Gold & Precious Metals January 19, 2012
Centamin (CEE-T, Hold)
Updated model with 4Q11 pre-released production.
Lowered 2012/2013 production estimates due to ongoing country
turmoil, and in line with company expectations.
Eldorado Gold (EGO, ELD-T, Hold)
Incorporated 4Q operating results and 2012 management guidance.
Randgold (GOLD, Hold)
Revised 4Q estimates to reflect production issues at Tongon and Loulo.
Incorporated expanded throughput at Kibali, Loulo heap leach
production, and updated Gounkoto underground mining assumptions.
Allied Gold (ALD-T, Hold)
Revised Simberi per tonne costs to more appropriately reflect year-end
throughput increases and HFO use.
NAVPS And LOM Cash Cost Changes NAV At Target Gold LOM Cash Costs
Price
Com pany Ticker (Jan-18) New Previous Change New Previous Change
Allied Gold Mining PLC ALD-T $3.20 4.58 4.35 5% 980 1,071 -8%
Barrick Gold Corp. ABX $47.95 60.88 62.27 -2% 606 603 0%
Centamin Egypt Ltd. CEE-T $1.46 2.84 2.87 -1% 799 772 4%
Dundee Precious Metals Inc. DPM-T $8.94 14.96 14.60 2% 705 721 -2%
Eldorado Gold Corp. EGO $13.99 15.53 16.18 -4% 607 585 4%
European Goldfields Ltd. EGU-T $11.95 15.61 15.21 3% 687 702 -2%
Goldcorp Inc. GG $44.93 53.68 56.52 -5% 550 528 4%
Great Basin Gold Ltd. GBG-T $1.09 3.17 3.18 0% 833 836 0%
IAMGOLD Corp. IAG $16.23 25.38 27.28 -7% 682 683 0%
Kinross Gold Corp.(1) KGC $10.39 20.36 20.36 0% 782 782 0%
New mont Mining Corp. NEM $60.35 80.98 84.78 -4% 711 702 1%
Osisko Mining OSK-T $11.51 13.59 15.54 -13% 811 563 44%
Randgold Resources GOLD $111.54 100.97 95.44 6% 634 621 2%
Semafo Inc. SMF-T $7.47 9.04 9.25 -2% 930 921 1%
(1) Updated KGC estimates published 1/17/2012
Source: FactSet, Stifel Nicolaus estimates
Cash Flow Estimate Changes 2011E 2012E
Price New Previous Change New Previous Change
Com pany Ticker (Jan-18)
Allied Gold Mining PLC ALD-T $3.20 0.10 0.17 -41% 0.47 0.70 -32%
Barrick Gold Corp. ABX $47.95 6.14 6.26 -2% 7.27 7.90 -8%
Centamin Egypt Ltd. CEE-T $1.46 0.17 0.18 -3% 0.23 0.41 -43%
Dundee Precious Metals Inc. DPM-T $8.94 0.93 0.93 0% 1.54 1.55 -1%
Eldorado Gold Corp. EGO $13.99 0.93 0.98 -5% 1.26 1.35 -7%
European Goldfields Ltd. EGU-T $11.95 (0.10) (0.10) 0% (0.21) (0.20) 6%
Goldcorp Inc. GG $44.93 3.17 3.30 -4% 3.64 4.52 -19%
Great Basin Gold Ltd. GBG-T $1.09 0.06 0.06 -1% 0.13 0.12 12%
IAMGOLD Corp. IAG $16.23 1.77 1.75 1% 1.79 1.81 -1%
Kinross Gold Corp.(1) KGC $10.39 1.26 1.26 0% 1.43 1.43 0%
New mont Mining Corp. NEM $60.35 6.42 6.82 -6% 7.23 7.89 -8%
Osisko Mining OSK-T $11.51 0.18 0.20 -13% 1.12 0.97 15%
Randgold Resources GOLD $111.54 6.12 6.96 -12% 8.70 8.97 -3%
Semafo Inc. SMF-T $7.47 0.61 0.59 3% 0.73 0.77 -5%
(1) Updated KGC estimates published 1/17/2012
Source: FactSet, Stifel Nicolaus estimates
Page 10
11. Metals & Mining
Gold & Precious Metals January 19, 2012
Target Price Setting Methodology and Risk Statements
Valuation Statem ent
KGC Kinross Gold Corp.
Our 12-month target price of $17.00 is based on an equal w eighting of 0.90x our 3%-NAVPS estimate at $1600/oz gold and 9.0x our 2011E/2012E blended CFPS estimates.
Risks to our target price include: changes in the gold, silver, and copper price; input inflation risks; country and permitting risks; successful ramp-up of development and
expansion projects, including Tasiast; and attainment of the company’s operating targets.
GG Goldcorp Inc.
Our 12-month target price of $65.00 is based on an equal w eighting of 1.30x our 3%-NAVPS estimate at $1600/oz gold and 13.0x our 2011E/2012E blended CFPS estimates.
Risks to our target price include: changes in the gold, silver, and copper price; input inflation risks; country and permitting risks; successful ramp-up of development projects,
including Penasquito; and attainment of the company’s operating targets.
ABX Barrick Gold Corp.
Our 12-month target price of $70.00 is based on an equal w eighting of 1.00x our 3%-NAVPS estimate at $1600/oz gold and 10.0x our 2011E/2012E blended CFPS estimates.
Risks to our target price include: changes in the gold, silver, and copper price; input inflation risks; country and permitting risks; successful ramp-up of development projects,
including Pueblo Viejo 60% j/v and Pascua Lama; and attainment of the company’s operating targets.
NEM New m ont Mining Corp.
Our 12-month target price of $80.00 is based on an equal w eighting of 1.00x our 3%-NAVPS estimate at $1600/oz gold and 10.0x our 2011E/2012E blended CFPS estimates.
Risks to our target price include: changes in the gold, silver, and copper price; input inflation risks; country and permitting risks; successful ramp-up of development projects,
including Boddington, Akyem and Conga; and attainment of the company’s operating targets.
DPM Dundee Precious Metals Inc.
Our 12-month target price of $13.50 is based on an equal w eighting of 0.80x our 3%-NAVPS estimate at $1600/oz gold and 8.0x our 2011E/2012E blended CFPS estimates.
Risks to our target price include: changes in the gold and base metals prices; input inflation risks; successful ramp-up of development projects; permitting and country risks;
and attainment of the company’s operating targets.
IAG IAMGOLD Corp.
Our 12-month target price of $23.00 is based on an equal w eighting of 1.00x our 3%-NAVPS estimate at $1600/oz gold and 10.0x our 2011E/2012E blended CFPS estimates.
Risks to our target price include: changes in the gold price; input inflation risks; successful ramp-up of development projects, including Essakane; country risks; and
attainment of the company’s operating targets.
SMF Sem afo Inc.
Our 12-month target price of $10.50 is based on an equal w eighting of 1.10x our 3%-NAVPS estimate at $1600/oz gold and 11.0x our 2011E/2012E blended CFPS estimates.
Risks to our target price include: changes in the price of gold; input inflation risks (in particular energy); country risks; and attainment of operating and development targets.
CXN Chalice Gold Mines Ltd.
Our 12-month target price of $0.35 is based on 0.90x our 8%-NAVPS estimate at $1600/oz gold.
Risks to our target price include: changes in the price of gold; input inflation risks (in particular energy); country risks; and attainment of operating and development targets.
TXG Torex Gold Resources Inc.
Our 12-month target price of $2.25 is based on 1.10x our 8%-NAVPS estimate at $1600/oz gold.
Risks to our target price include: changes in the price of gold; input inflation risks (in particular energy); country risks; and attainment of operating and development targets.
Source: Stifel Nicolaus estimates
Page 11