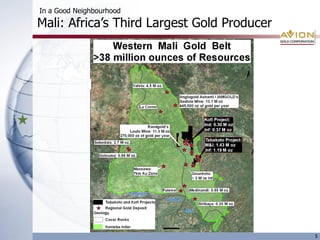
- Avion Gold is a gold mining company focused on West Africa with assets in Mali.
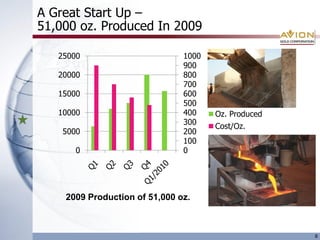
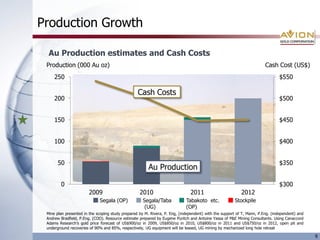
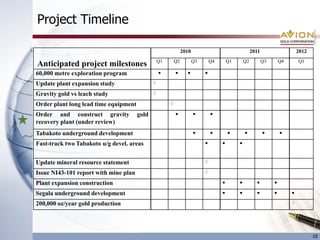
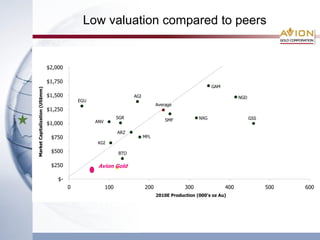
- In 2009, Avion produced 51,000 ounces of gold and estimates production will increase to 75-85,000 ounces in 2010 and ramp up to 200,000 ounces by 2012.
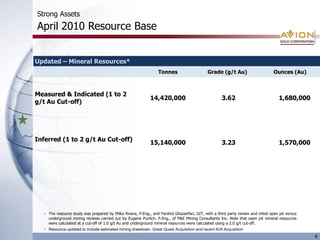
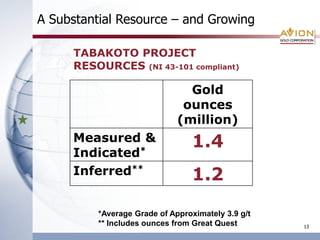
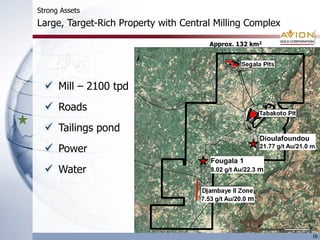
- Avion's resource base includes over 14 million ounces of measured and indicated gold resources and over 15 million ounces of inferred gold resources across its properties in Mali.