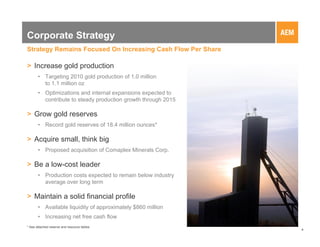
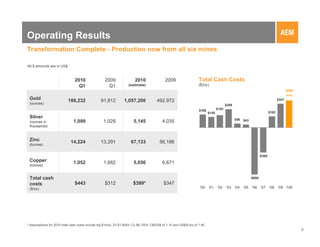
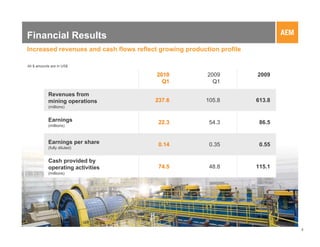
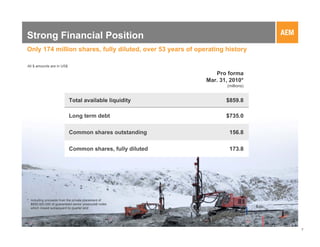
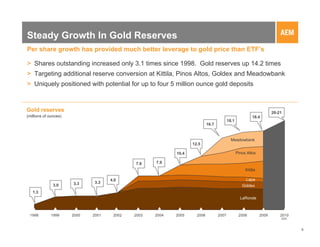
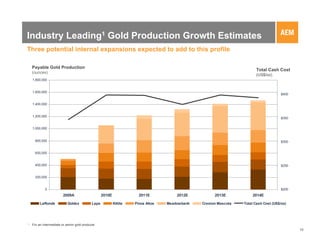
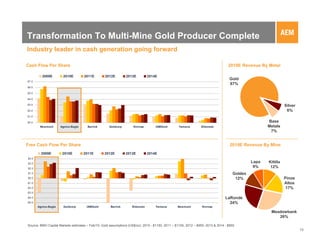
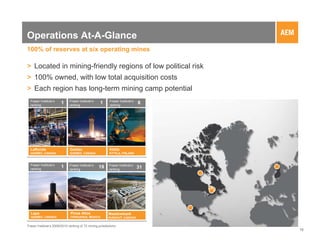
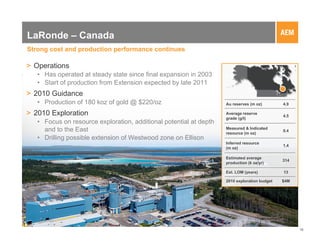
- Agnico-Eagle Mines Limited provided a corporate update in May 2010, outlining its strategy, operating results, and strong financial position.
- The company's strategy focuses on increasing gold production, growing gold reserves through acquisitions like Comaplex Minerals Corp, being a low-cost leader, and maintaining a solid financial profile with $860 million in available liquidity.
- In Q1 2010 the company produced over 188,000 ounces of gold, exceeding Q1 2009 production, and estimates 2010 full year gold production around 1.057 million ounces at a total cash cost of $399 per ounce. Revenues increased to $237.6 million in Q1 2010.
This document provides information from Agnico-Eagle Mines Limited's shareholder meeting on April 30, 2009. It summarizes the company's operating results for the first quarter of 2009, highlighting record quarterly gold production of 91,812 ounces and total cash costs per ounce of $312. The document also emphasizes Agnico-Eagle's consistent strategy of growing gold reserves and production while maintaining low production costs to create shareholder value.
This document provides a corporate update from Agnico-Eagle Mines Limited for February 2009. It summarizes the company's operating and financial results for Q4 and full year 2008, highlights its strong gold reserves which are larger than its peers, and outlines its global growth strategy with three operating mines and three new mines under construction. It also previews upcoming news in 2009 regarding expansion studies at several of its projects which could further increase production.
Agnico-Eagle Mines Limited has emerged as a top gold stock due to its emphasis on quality, exceptional record of shareholder value creation, and robust growth profile. The document discusses Agnico-Eagle's corporate strategy of increasing gold production and reserves while maintaining a solid financial profile and low costs. It provides an overview of the company's operating results, strong financial position, industry-leading growth estimates, and high gold reserves per share.
Agnico-Eagle Mines reported record annual gold production of 1,043,811 ounces in 2012 at a total cash cost of $640 per ounce. Cash flows from operations reached a record $696 million. Production is expected to increase to approximately 990,000 ounces in 2013 and reach over 1.2 million ounces by 2015 through contributions from new projects. Capital expenditures will be focused on expanding the Kittila mine and advancing new projects.
Agnico-Eagle Mines Limited reported its third quarter 2012 results in October 2012. The company achieved record quarterly gold production of 286,971 ounces at total cash costs of $556 per ounce. Cash flow from operations was also a record at $199 million for the quarter. Agnico increased its 2012 gold production guidance to approximately 1,025,000 ounces and lowered its total cash cost guidance to approximately $660 per ounce. The company's portfolio of long-life mines continued to perform well, and it expects low political risk and meaningful production growth from existing assets.
Agnico-Eagle Mines Limited reported strong second quarter 2012 results, with record quarterly gold production from currently operating mines of 265,350 ounces at total cash costs of $660 per ounce. Cash provided by operating activities was a record $194 million for the quarter. Production guidance for 2012 was increased to approximately 975,000 ounces of gold. The company has a portfolio of quality, long-life mines that continue to perform well and provide low-risk production growth from existing assets. Significant exploration upside and reserve growth have been demonstrated at the company's 100%-owned assets.
The document discusses the company's forward-looking estimates and plans for growing gold production, reserves, and cash flow over the next few years. It estimates increasing gold production from 1.13-1.23 million ounces in 2011 to 1.5 million ounces by 2014 through projects like expanding existing mines. It also estimates growing gold reserves to 20-21 million ounces by the end of 2010 and 21-22 million ounces by the end of 2011. The company aims to be a low-cost leader with total cash costs below industry averages.
Goldman Sachs hosted a basic materials conference where Newmont presented. Newmont discussed its focus on eliminating its hedge book, divesting non-core assets, and growing reserves through acquisitions like Miramar. Newmont also provided updates on major projects like its Nevada power plant, Yanacocha gold mill, and Boddington mine. Newmont emphasized that it is the largest unhedged gold producer and expects to continue delivering strong financial and operating performance in 2008 through focus and execution.
Agnico-Eagle Mines Limited reported its fourth quarter and full year 2011 results in February 2012. Earnings for both the quarter and full year were impacted by non-cash writedowns of the Goldex and Meadowbank mines. Revenues reached record levels in 2011 of $1.82 billion due to higher gold prices, however earnings were negative due to the writedowns. Production guidance is provided for 2012-2014, with payable gold production expected to increase each year from 875,000-950,000 ounces in 2012 to over 1 million ounces in 2014 through contributions from all mines. Capital expenditures are also forecast to remain below average EBITDA levels, allowing for expected ongoing free cash flow generation
- The document provides an overview of Newmont Mining Corporation's 2008 strategic priorities and financial outlook.
- Key priorities include ongoing project execution like the Nevada power plant and Yanacocha gold mill. Exploration and development activities at projects like Conga and Akyem are also emphasized.
- Financial guidance for 2008 includes equity gold sales of 5.1-5.4 million ounces at costs of $425-450 per ounce, and capital expenditures of $1.8-2 billion.
Neil McMillan, President & CEO of Q1 Financials, presented highlights from Q1 2012. Key points included a significant increase in mineral reserves and resources at Seabee Gold Operation, completion of the St. Eugene Mining acquisition, and appointment of Peter Longo as VP of Operations. Financial highlights showed increased revenues and average gold prices compared to Q1 2011, though net profits decreased. Exploration plans for 2012 focus on continued reserve growth at Seabee and advancing projects at Amisk and Madsen.
The document is a presentation from Adriaan van Kersen given at the Paydirt Gold Conference on April 2-3, 2008. It contains forward-looking statements and provides an overview of Newmont Mining Corporation's operational execution and outlook for 2008, including production targets and cost estimates. It also summarizes Newmont's exploration strategy and tracks its success in reserve replacement through exploration over the past 5 years. Key development projects discussed include Conga in Peru and Akyem in Ghana, as well as ongoing projects like the Nevada power plant and Yanacocha gold mill.
- The document is a presentation from Merrill Lynch's Global Metals, Mining and Steel Conference on May 14, 2008.
- It discusses Newmont Mining Corporation's record first quarter results in 2008, including record gold sales and cash flow. It also provides an update on Newmont's major projects and production guidance for 2008.
- The presentation emphasizes Newmont's leverage to rising gold prices through focus on costs and an unhedged production strategy.
This corporate presentation from Orvana Minerals Corp. provides an overview of the company's operations and financial performance. Orvana operates gold and copper mines in Bolivia and Spain, including its recently commissioned Upper Mineralized Zone deposit. The presentation summarizes Orvana's key assets and growth projects, financial results, production forecasts, and mineral reserve and resource estimates. It also outlines various risk factors and forward-looking statements regarding the company's plans and estimates.
- The document summarizes Newmont Mining Corporation's third quarter 2008 conference call, highlighting adjusted net income, gold sales, average gold prices realized, and costs applicable to sales.
- Key metrics for year-to-date 2008 and third quarter 2008 such as adjusted net income, gold sales, average gold prices, and costs applicable to sales are presented for several regions and in total.
- Newmont reaffirms its annual guidance for 2008 equity gold sales and costs applicable to sales.
This document contains cautionary statements regarding forward-looking statements in Gary Goldberg's presentation at the Bank of Montreal Metals and Mining Conference on February 25, 2013. It warns that actual results could differ materially from projections due to risks and uncertainties. It also notes that estimates of resources are subject to further exploration and development and are not guarantees that minerals can be economically extracted. The document outlines Newmont's priorities of strong free cash flow growth, leverage to gold prices, returning capital to shareholders, total cost management, and maximizing asset value.
Star Bulk reported financial results for the third quarter and nine months of 2012. Revenues declined compared to the same periods in 2011 due to lower charter rates. The company reported a large net loss for the third quarter and nine months of 2012 due to non-cash items. Excluding these items, adjusted earnings were lower but the company had positive adjusted EBITDA. The company maintained a low net debt to EBITDA ratio and had contracted future revenues of $140 million. Star Bulk continued efforts to control costs and optimize operations.
This document provides an annual report summary for Jacobs Engineering Group for fiscal year 2003. It highlights increased revenues and record net income compared to previous years. It also summarizes key financial metrics like backlog, assets, and return on equity. The report discusses Jacobs' continued focus on safety, quality, and client satisfaction. It reaffirms Jacobs' core values of being relationship-based and putting people and growth as top priorities.
This presentation summarizes Newmont Mining Corporation's Westcoast Winter Roadshow. It discusses Newmont's financial results and production guidance, the positive fundamentals for gold including declining mine supply. It also covers Newmont's efforts to manage increasing operating costs, diversify its political risk across multiple countries, and use its investment portfolio to generate additional value. Newmont is positioned as a leading gold company with a large reserve base and market capitalization.
1) Occidental Petroleum Corporation reported record financial results in 2005, including net income of $5.3 billion and operating cash flow of $5.3 billion, both all-time highs.
2) The company's oil and gas production reached 566,000 barrels of oil equivalent per day in 2005, while proved oil and gas reserves reached a record high of 2.71 billion barrels of oil equivalent at the end of 2005.
3) Occidental significantly reduced its total debt in 2005 while maintaining a strong balance sheet, allowing it to compete for large international growth projects.
The document provides an overview of Q3 2012 financial and operating results for Claude Resources Inc. Key highlights include:
- Net profit of $3.0 million and cash flow from operations of $8.6 million.
- Gold production of 15,073 ounces at a total cash cost of $920 per ounce.
- Continued exploration success extending resources at Santoy Gap and confirming continuity.
- Capital projects on track to increase production including shaft extension and mill expansion.
- Management additions bringing significant operating experience to optimize operations.
- Outlook focuses on increasing production and reserves while advancing projects like Amisk.
- Avion Gold is a gold mining company focused on West Africa with assets in Mali.
- In 2009, Avion produced 51,000 ounces of gold and estimates production will increase to 75-85,000 ounces in 2010 and ramp up to 200,000 ounces by 2012.
- Avion's resource base includes over 14 million ounces of measured and indicated gold resources and over 15 million ounces of inferred gold resources across its properties in Mali.
- Agnico-Eagle Mines reported fourth quarter 2009 results on February 17, 2010
- Gold production in Q4 2009 was 163,276 ounces, up 83% from Q4 2008, with total cash costs of $297/ounce
- Issues that lowered production and increased costs in Q3 2009 at some mines were largely resolved by Q4
- The company is now a multi-mine international gold producer with 6 operating mines and production expected to grow to over 1 million ounces annually through expansions
Agnico-Eagle Mines Limited provided a corporate update presentation in March 2010. The presentation discussed Agnico-Eagle's strategy of increasing gold production through internal expansions, growing gold reserves, acquiring early stage projects, maintaining low costs, and solid financial positioning. It also provided an operations update on improved performance in Q4 2009 at all mines, rising production and earnings, a strong financial position, and industry leading gold production growth estimates through potential internal expansions.
Agnico-Eagle Mines reported record quarterly gold production from its currently operating mines of 254,955 ounces in Q1 2012, a 19% increase over Q1 2011. Total cash costs were $594 per ounce. Net income was $79 million, up 74% year-over-year. Cash provided by operating activities was $196 million. Production is expected to grow further from existing long-life assets through exploration and mine plan optimization. The company aims to continue generating strong cash flows to fund growth and maintain its dividend.
- The document summarizes Newmont Mining Corporation's third quarter 2008 conference call, highlighting adjusted net income, gold sales, average gold prices realized, and costs applicable to sales.
- Key metrics for year-to-date 2008 and third quarter 2008 such as adjusted net income, gold sales, average gold prices, and costs applicable to sales are provided for several regions and in total.
- Newmont reaffirms its annual guidance for 2008 equity gold sales and costs applicable to sales.
Russell Ball, EVP and CFO of Newmont Mining Corporation, presented at the CIBC Institutional Investor Conference on January 23, 2013. Newmont's 2013 outlook reflects stable production from its portfolio, with contribution expected from the Akyem mine in late 2013. Newmont is focused on total cost management and returning capital to shareholders through its gold price-linked dividend, currently yielding approximately 3.8%. Newmont aims to create leverage through reducing its all-in sustaining costs, which are expected to be $1,100-$1,200 per ounce in 2013.
1) Newmont Mining Corporation presented at its annual Westcoast Winter Roadshow, highlighting its strong financial performance in 2006 and outlook.
2) The presentation noted declining global gold mine supply, rising input costs putting pressure on industry margins, and Newmont's strategy to diversify its political risk across operations in developed and developing countries.
3) Newmont is moving forward with projects in Nevada, Ghana, Australia to maintain and grow production, while its investment portfolio has generated significant returns to enhance long-term shareholder value.
Agnico Eagle Mines Limited provided a corporate update in January 2013. The update discussed Agnico Eagle's strong financial and operating performance in 2012, including record gold production and improved costs. Plans for growth in 2013 include commercial production at the La India and Goldex projects by mid-2014. Exploration success was noted at La India, Tarachi and Kittila, with drilling continuing to expand mineralized zones at these properties.
This corporate document provides an update for March 2011. It discusses forward-looking statements and the risks associated with them. Key points include increasing gold production to 1.5 million ounces by 2014, growing gold reserves to over 22 million ounces, acquiring smaller companies, maintaining low costs, and increasing net free cash flow and dividends per share. Operating results for 2010 show growing revenue diversified across six mines, with total gold production of 987,609 ounces and total cash costs of $451 per ounce. Financial results for 2010 were record levels of earnings and cash flow driven by production growth.
The document is a presentation from Adriaan van Kersen given at the Paydirt Gold Conference on April 2-3, 2008. It contains forward-looking statements and provides an overview of Newmont Mining Corporation's 2008 strategic priorities, including progress on exploration and development projects such as Conga in Peru and Akyem in Ghana. It also discusses operational execution, capital projects, and Newmont's focus on driving shareholder value through focus and execution on its core gold business.
Agnico-Eagle Mines Limited provided forward-looking statements and information regarding its third quarter 2011 results. The document notes that certain statements constitute forward-looking statements that are subject to risks and uncertainties. It then provides a summary of production and financial results for the third quarter, including record gold production at Pinos Altos and record throughput at Kittila and Meadowbank. The document also notes that Goldex operations have been suspended indefinitely.
- Teranga produced 214,310 ounces of gold in 2012 at a cash cost of $627 per ounce and expects to produce 190,000-210,000 ounces in 2013 at a cash cost of $650-700 per ounce.
- Mill expansion was completed in 2012, increasing capacity. Production is expected to reach 250,000-350,000 ounces annually through developing the Gora deposit.
- Proven and probable reserves remain similar to 2011 at 1 million ounces despite 2012 production, and measured and indicated resources increased 34% to 2.9 million ounces through exploration.
The document provides an overview of Newmont Mining Corporation's operations and outlook. It discusses Q3 2012 operational performance, with gold production of 1.24Moz at a CAS of $693/oz. It highlights the company's regional operations in North America, South America, and Asia Pacific. It also discusses the company's focus on cost control and margin protection through optimizing current operations and overhead cost reductions. The document emphasizes Newmont's commitment to delivering shareholder value through consistent production, a gold price-linked dividend, and leading reserves and production metrics per share.
Claude Resources Inc. Q4 2012 Conference Call and Webcast PresentationClaude Resources Inc.
Neil McMillan, President and CEO of Claude Resources Inc., presented the company's 2012 financial and operating results on March 28, 2013. Key highlights included net profit of $5.6 million, cash flow from operations of $25.8 million, gold sales increasing 16% to 48,672 ounces, and production reaching a record 49,570 ounces. The presentation also provided details on the company's financial position, debt facilities, operations at Seabee Gold Operation and exploration projects, and production and cost guidance for 2013.
1) The document summarizes Barrick Gold Corporation's third quarter 2007 conference call. It discusses Barrick's focus on operational execution and maintaining financial strength and flexibility.
2) Barrick provided an outlook for 2007 with estimates for gold production, costs, capital expenditures, and taxes. Costs applicable to sales are estimated to be between $400-430 per ounce.
3) Barrick reported third quarter 2007 financial results including revenues of $1.6 billion and net income of $397 million. Gold production was in line with guidance.
The document discusses Newmont Mining Corporation's growth strategy and financial performance. It highlights production growth potential to around 7 million ounces of gold by 2017 through its project pipeline. It also notes exploration upside with potential to add reserves equivalent to 90 million ounces of gold over the next decade. Finally, it provides updates on various projects in its portfolio such as Akyem, Conga, and Long Canyon.
The presentation provides an overview of Merrill Lynch's Global Metals, Mining and Steel Conference on May 14, 2008. It discusses Newmont Mining Corporation's record first quarter results in 2008, focus on continued cost reductions and reserve growth, and progress on major projects including the Nevada power plant and Yanacocha gold mill expansion. Updates are also given on the Boddington, Conga, Hope Bay, and Akyem projects. The presentation contains cautionary statements regarding forward-looking estimates and metrics.
Minera Andes owns the San Jose silver and gold mine in Argentina which produced over 5 million ounces of silver and 84,000 ounces of gold in 2010. Exploration continues to expand resources at San Jose which now has an estimated 12 year mine life. Minera Andes also owns the large undeveloped Los Azules copper project in Argentina which contains over 18% of the world's copper resources. Drilling and feasibility studies are ongoing to advance Los Azules with the goal of developing a 100,000 ton per day copper mine.
Smurfit-Stone Container Corporation reported a net loss of $229 million or $0.90 per share for Q3 2005, primarily due to a $293 million pretax restructuring charge related to mill closures in Canada and a paper machine closure. Net sales were $2.1 billion, down from $2.2 billion in Q3 2004. For the first nine months of 2005, the net loss was $247 million or $0.97 per share, compared to a net loss of $48 million or $0.19 per share for the same period in 2004. The company expects costs to increase in Q4 due to higher energy and freight expenses, while average corrugated prices are expected to
- The document provides financial results and highlights for Q4 2012 and full year 2012 for Alamos Gold Inc.
- For Q4 2012, production was 41,145 ounces at a total cash cost of $628 per ounce, with adjusted net earnings of $13.7 million.
- For full year 2012, production was 127,283 ounces at a total cash cost of $516 per ounce, with adjusted net earnings of $34.7 million.
- Production at the Young-Davidson mine is ramping up as planned and the shaft system is on track to be commissioned in Q3.
Similar to May 2010 Agnico Eagle Corporate Presentation (20)
The document provides supplemental information for Agnico Eagle Mines in May 2021. It discusses the company's operating mines across Canada, Finland, and Mexico which are expected to produce around 850,000 ounces of gold per year in the Abitibi region. Exploration plans are outlined to extend mine life at operations like LaRonde, Goldex, and Kittila. The acquisition of TMAC Resources and its Hope Bay mine in Nunavut is also summarized, which could potentially produce 250,000-300,000 ounces annually starting in 2024.
- Agnico Eagle reported second quarter 2018 results with total payable gold production of 404,961 ounces and total cash costs per ounce of $656.
- Production guidance for 2018 was increased to 1.58 million ounces of gold from 1.53 million ounces previously.
- The Amaruq project received permit approval and preliminary construction work began, while the Meliadine project remains on schedule for first production in Q2 2019.
- LaRonde Zone 5 declared commercial production as of June 1, 2018 and the mine life at Lapa was extended until the fourth quarter of 2018.
Raymond james-39th-annual-institutional-investors-conferenceAgnico Eagle Mines
- The document provides forward-looking statements regarding Agnico Eagle's operations, projects, production estimates, costs, and cash flows.
- It notes key assumptions underlying these statements and risks that could cause actual results to differ materially.
- Non-GAAP financial measures including total cash costs, all-in sustaining costs, and minesite costs are discussed and reconciled to IFRS measures.
Agnico Eagle reported its fourth quarter and full year 2017 results. Some highlights include:
- Production guidance for 2018 of 1.75-1.8 million ounces of gold at total cash costs between $650-700 per ounce and AISC of $950-1000 per ounce.
- Continued progress on construction at the Meliadine and Amaruq projects in Nunavut, with production expected to begin in 2019.
- Exploration success at several mines, with potential to extend mine lives and add new resources.
The document provides an overview of Agnico Eagle's corporate update presentation from January 2018. It includes forward-looking statements and notes regarding non-GAAP measures. The summary highlights Agnico Eagle's growing production base, high quality long life assets, strategy of value creation, track record of meeting guidance, mineral reserves and resources, successful M&A and exploration adding value, and project pipeline expected to drive further production growth to 2 million ounces by 2020.
This document provides forward-looking statements and notes to investors regarding Agnico Eagle's corporate update presentation at the Scotiabank Mining Conference in December 2017. It outlines key assumptions and risk factors for Agnico Eagle's projections, including commodity prices, production estimates, costs estimates, currency fluctuations, and permitting/development timelines. It also notes that certain terms used in the presentation, such as total cash costs per ounce and all-in sustaining costs per ounce, are non-GAAP measures and provides reconciliations to IFRS measures.
The LaRonde mine achieved record quarterly gold production of 105,345 ounces due to higher tonnage and grades from mining areas. Production guidance for 2017 was increased to over 1.68 million ounces of gold and unit costs were reduced based on strong year-to-date operational performance across Agnico Eagle's mines. Exploration continues at LaRonde to evaluate mining below current levels and infill drilling is ongoing to define higher grade mineralization in the western portions of the deposit.
Operations continue to deliver strong performance in the second quarter of 2017, with total gold production of 427,743 ounces and total cash costs per ounce of $556. Infill and exploration drilling at multiple properties, including LaRonde and Amaruq, yielded positive results that are expected to result in mineral resource additions and conversions. The Meliadine project is progressing on schedule and budget, with underground development ahead of plan and engineering 80% complete at the end of June 2017.
BMO Capital Markets 26th Global Metals & Mining ConferenceAgnico Eagle Mines
- The document discusses Agnico Eagle's forward-looking statements and provides context for non-GAAP financial measures used. It notes key assumptions and risks that could impact projections.
- Agnico Eagle exceeded 2016 production guidance of 1.6 million ounces at total cash costs of $600 per ounce. Production was 1.66 million ounces at total cash costs of $573 per ounce.
- New four-year guidance forecasts production growth to over 2 million ounces in 2020 as the Amaruq and Meliadine projects come online. Costs are expected to decline as production increases.
Raymond James 38th Annual Institutional Investors ConferenceAgnico Eagle Mines
The document provides forward-looking statements and notes regarding Agnico Eagle's presentation at the Raymond James 38th Annual Institutional Investors Conference in March 2017. It discusses Agnico Eagle's solid production base, high quality long life assets, and proven value creating strategy. It also summarizes Agnico Eagle's 2016 operating and financial highlights, 2016 exploration and reserve highlights, and track record of meeting production guidance. Finally, it notes Agnico Eagle mined below its average reserve grade in 2016 and successfully replaced reserves and resources with grades remaining unchanged.
Agnico Eagle reported its fourth quarter and full year 2016 results. Key highlights included:
1) Continued strong operating performance in 2016 with gold production exceeding guidance and lower than expected costs.
2) The Amaruq satellite deposit at Meadowbank and the Meliadine project were approved for development with both expected to start up in Q3 2019.
3) A four-year production guidance was issued with gold production expected to increase from current levels to 2 million ounces by 2020 and unit costs expected to decline over that period.
- Agnico Eagle provides a corporate update for November 2016, outlining its consistent strategy and solid execution that drives superior per share returns.
- Production is expected to grow to approximately 2.0 million ounces of gold in 2020 from its existing asset base.
- Agnico Eagle has high quality gold reserves with an average grade more than double that of North American peers that will support production growth.
- Exploration continues to be a key value driver, with several prospects delivering results.
The document provides an overview of Agnico Eagle's Kittila mine site visit in November 2016. Some key points:
- Kittila is Agnico Eagle's largest gold mine in Europe and has estimated reserves to continue operations through 2035.
- Underground development and mining rates are being optimized to fully access the Rimpi and newly discovered Sisar zones.
- Drilling in Q3 2016 yielded the widest intercept to date in the Sisar Central Zone of 6.6 g/t gold over 12.7 metres.
- The processing plant uses pressure oxidation in an autoclave to treat the refractory gold ore, followed by milling, flotation, leaching and electrowin
The Barsele Gold Project is located in northern Sweden near existing infrastructure. Agnico Eagle has a 55% interest in the project. Previous exploration identified gold mineralization at the Central, Avan, and Skiråsen zones. In 2015-2016, Agnico Eagle conducted drilling programs to expand and define these zones, with the goal of releasing an initial inferred resource estimate by the end of 2016. Drilling to date has shown potential to extend mineralization to depth at the Avan zone.
The document discusses Agnico Eagle's third quarter 2016 results. It provides forward-looking statements regarding production guidance, projects, and costs. It notes the risks and assumptions underlying the forward-looking statements. It also discusses non-GAAP measures used to evaluate performance such as total cash costs per ounce and all-in sustaining costs per ounce.
- Agnico Eagle provides a corporate update for September 2016, outlining key points such as production growth targets, high quality gold reserves, ongoing exploration success, and a strong balance sheet.
- The company has a goal of producing over 2 million ounces of gold annually by 2020 through exploiting its existing asset base, which contains high average grade reserves over double the industry average.
- Exploration continues to deliver value by expanding reserves and resources at mines such as Kittila, Meadowbank, Meliadine, Pinos Altos, and La India.
Bank of America Merrill Lynch 2016 Global Metals, Mining EventAgnico Eagle Mines
This document provides an overview of Agnico Eagle Mines Limited's presentation at the 22nd Annual Canada Mining Event hosted by Bank of America Merrill Lynch in September 2016. It contains forward-looking statements about Agnico Eagle's production guidance, costs, projects and growth plans. It also notes the risks associated with forward-looking statements and provides details on Agnico Eagle's non-GAAP financial measures and production guidance methodology. Finally, it highlights Agnico Eagle's strategy of value creation through consistent performance, production growth, high-quality reserves, exploration success and financial strength.
Agnico Eagle held a Denver Gold Forum in September 2016 to provide information to investors. The document included forward-looking statements about production guidance, costs, and other estimates. It noted the risks that actual results may differ from expectations due to uncertainties in metal prices, costs, and other factors. It also summarized the company's strategy of production growth from its existing assets, high-quality gold reserves with above-average grades, and exploration adding new resources.
- The document is a presentation from Agnico Eagle Mines Limited given at a Scotia BBQ on August 18, 2016.
- It discusses Agnico Eagle's forward-looking statements and production guidance, provides an overview of the company's strong financial position and long history of dividend payments, and outlines its growth strategy through projects in its development pipeline.
- Agnico Eagle has successfully grown production and reserves through acquisitions and exploration over the past decade and expects its project pipeline to drive a new phase of 30-40% production growth by 2020.
The document provides an update on Agnico Eagle Mines for August 2016. It includes forward-looking statements and notes of caution regarding the use of non-GAAP measures in financial presentations. The update discusses Agnico Eagle's consistent strategy of production growth, high quality gold reserves with above peer average grades, strong balance sheet, and exploration as a value driver. It also provides highlights on recent operational and financial results and production guidance into 2019 and beyond.
2. Forward Looking Statements
The information in this document has been prepared as at April 29, 2010. Certain statements contained in this document constitute
“forward-looking statements” within the meaning of the United States Private Securities Litigation Reform Act of 1995 and forward
looking information under the provisions of Canadian provincial securities laws. When used in this document, the words “anticipate”,
“expect”, “estimate”, “forecast”, “will”, “planned”, and similar expressions are intended to identify forward-looking statements or
information.
Such statements include without limitation: statements regarding timing and amounts of capital expenditures and other assumptions;
estimates of future reserves, resources, mineral production and sales; estimates of mine life; estimates of future internal rates of
return, mining costs, cash costs, minesite costs and other expenses; estimates of future capital expenditures and other cash needs,
and expectations as to the funding thereof; statements and information as to the projected development of certain ore deposits,
including estimates of exploration, development and production and other capital costs, and estimates of the timing of such
exploration, development and production or decisions with respect to such exploration, development and production; estimates of
reserves and resources, and statements and information regarding anticipated future exploration; the anticipated timing of events with
respect to the Company's minesites and statements and information regarding the sufficiency of the Company's cash resources. Such
statements and information reflect the Company's views as at the date of this document and are subject to certain risks, uncertainties
and assumptions, and undue reliance should not be placed on such statements and information. Many factors, known and unknown
could cause the actual results to be materially different from those expressed or implied by such forward looking statements and
information. Such risks include, but are not limited to: the volatility of prices of gold and other metals; uncertainty of mineral reserves,
mineral resources, mineral grades and mineral recovery estimates; uncertainty of future production, capital expenditures, and other
costs; currency fluctuations; financing of additional capital requirements; cost of exploration and development programs; mining risks;
community protests; risks associated with foreign operations; governmental and environmental regulation; the volatility of the
Company's stock price; and risks associated with the Company's byproduct metal derivative strategies. For a more detailed
discussion of such risks and other factors that may affect the Company’s ability to achieve the expectations set forth in the forward-
looking statements contained in this document, see the Company's Annual Report on Form 20-F for the year ended December 31,
2009, as well as the Company's other filings with the Canadian Securities Administrators and the U.S. Securities and Exchange
Commission. The Company does not intend, and does not assume any obligation, to update these forward-looking statements and
information. Marc Legault, a Qualified Person and the Company’s Vice-President, Project Development, reviewed the technical
information disclosed herein. For a detailed breakdown of the Company’s reserve and resource position see the February 17, 2010
press release on the Company’s website. That press release also lists the Qualified Persons for each project.
2
3. Note To Investors
Regarding the Use of Non-GAAP Financial Measures
This document presents estimates of future "total cash cost per ounce" and "minesite cost per tonne" that are not recognized
measures under United States generally accepted accounting principles ("US GAAP"). This data may not be comparable to data
presented by other gold producers. These future estimates are based upon the total cash costs per ounce and minesite costs per
tonne that the Company expects to incur to mine gold at the applicable projects and do not include production costs attributable to
accretion expense and other asset retirement costs, which will vary over time as each project is developed and mined. It is therefore
not practicable to reconcile these forward-looking non-GAAP financial measures to the most comparable GAAP measure. A
reconciliation of the Company's total cash cost per ounce and minesite cost per tonne to the most comparable financial measures
calculated and presented in accordance with US GAAP for the Company's historical results of operations is set forth in the notes to the
financial statements included in the Company's Annual Information Form and Annual Report on Form 20-F, for the year ended
December 31, 2009, as well as the Company's other filings with the Canadian Securities Administrators and the SEC.
3
4. Corporate Strategy
Strategy Remains Focused On Increasing Cash Flow Per Share
> Increase gold production
• Targeting 2010 gold production of 1.0 million
to 1.1 million oz
• Optimizations and internal expansions expected to
contribute to steady production growth through 2015
> Grow gold reserves
• Record gold reserves of 18.4 million ounces*
> Acquire small, think big
• Proposed acquisition of Comaplex Minerals Corp.
> Be a low-cost leader
• Production costs expected to remain below industry
average over long term
> Maintain a solid financial profile
• Available liquidity of approximately $860 million
• Increasing net free cash flow
* See attached reserve and resource tables
4
5. Operating Results
Transformation Complete - Production now from all six mines
All $ amounts are in US$
2010 2009 2010 2009 Total Cash Costs
Q1 Q1 (estimate) ($/oz)
$399
est.
Gold 188,232 91,812 1,057,200 492,972 $347
(ounces) $269
$188 $182
$155 $162
Silver $56 $43
(ounces in 1,099 1,029 5,145 4,035
thousands)
Zinc 14,224 13,291 67,133 56,186
(tonnes)
-$365
Copper 1,052 1,682 5,056 6,671
(tonnes)
Total cash -$690
costs $443 $312 $399* $347
($/oz) '00 '01 '02 '03 '04 '05 '06 '07 '08 '09 '10E
* Assumptions for 2010 total cash costs include Ag $14/oz, Zn $1,800/t, Cu $6,100/t, C$/US$ of 1.10 and US$/Euro of 1.40
5
6. Financial Results
Increased revenues and cash flows reflect growing production profile
All $ amounts are in US$
2010 2009 2009
Q1 Q1
Revenues from
mining operations 237.6 105.8 613.8
(millions)
Earnings 22.3 54.3 86.5
(millions)
Earnings per share 0.14 0.35 0.55
(fully diluted)
Cash provided by
operating activities 74.5 48.8 115.1
(millions)
6
6
7. Strong Financial Position
Only 174 million shares, fully diluted, over 53 years of operating history
All $ amounts are in US$
Pro forma
Mar. 31, 2010*
(millions)
Total available liquidity $859.8
Long term debt $735.0
Common shares outstanding 156.8
Common shares, fully diluted 173.8
* Including proceeds from the private placement of
$600,000,000 of guaranteed senior unsecured notes
which closed subsequent to quarter end
77
9. Steady Growth In Gold Reserves
Per share growth has provided much better leverage to gold price than ETF’s
> Shares outstanding increased only 3.1 times since 1998. Gold reserves up 14.2 times
> Targeting additional reserve conversion at Kittila, Pinos Altos, Goldex and Meadowbank
> Uniquely positioned with potential for up to four 5 million ounce gold deposits
Gold reserves 20-21
(millions of ounces) 18.4
18.1
16.7
Meadowbank
12.5
10.4 Pinos Altos
7.9 7.9
Kittila
4.0 Lapa
3.3 3.3
3.0 Goldex
1.3
LaRonde
1998 1999 2000 2001 2002 2003 2004 2005 2006 2007 2008 2009 2010
EST.
9
10. Industry Leading1 Gold Production Growth Estimates
Three potential internal expansions expected to add to this profile
Payable Gold Production
Total Cash Cost
(ounces)
(US$/oz)
1,800,000
1,600,000
$400
1,400,000
1,200,000
$350
1,000,000
800,000 $300
600,000
400,000 $250
200,000
0 $200
2009A 2010E 2011E 2012E 2013E 2014E
LaRonde Goldex Lapa Kittila Pinos Altos Meadowbank Creston Mascota Total Cash Cost (US$/oz)
1 For an intermediate or senior gold producer
10
11. Leading Production Growth Profile Among Senior Producers
Gold production (oz) / 1,000 shares
14
2007A 2008A 2009E 2010E
2011E 2012E 2013E 2014E
12
10
8
6
4
2
0
Newmont Agnico-Eagle Barrick Goldcorp Kinross IAMGold Eldorado Yamana
Source: AEM guidance, BMO Capital Markets estimates – Feb/10
11
12. Capital Expenditures Declining
Major construction spending nearing completion ($000’s)
Actual Estimate
1,000,000
900,000
800,000
700,000
600,000
500,000
400,000
300,000
200,000
100,000
0
2007A 2008A 2009A 2010E 2011E 2012E 2013E 2014E
Meadowbank Pinos Altos Kittila Lapa Goldex LaRonde Sustaining Capital
12
15. Operations At-A-Glance
100% of reserves at six operating mines
> Located in mining-friendly regions of low political risk
> 100% owned, with low total acquisition costs
> Each region has long-term mining camp potential
Fraser Institute’s Fraser Institute’s Fraser Institute’s
ranking
1 ranking
1 ranking
6
LaRonde Goldex Kittila
QUEBEC, CANADA QUEBEC, CANADA KITTILA, FINLAND
Fraser Institute’s Fraser Institute’s Fraser Institute’s
ranking
1 ranking
19 ranking
31
Lapa Pinos Altos Meadowbank
QUEBEC, CANADA CHIHUAHUA, MEXICO NUNAVUT, CANADA
Fraser Institute’s 2009/2010 ranking of 72 mining jurisdictions
15
16. LaRonde – Canada
Strong cost and production performance continues
> Operations
• Has operated at steady state since final expansion in 2003
• Start of production from Extension expected by late 2011
> 2010 Guidance
• Production of 180 koz of gold @ $220/oz Au reserves (m oz) 4.9
> 2010 Exploration Average reserve
4.5
grade (g/t)
• Focus on resource exploration, additional potential at depth
and to the East Measured & Indicated
0.4
resource (m oz)
• Drilling possible extension of Westwood zone on Ellison
Inferred resource
1.4
(m oz)
Estimated average
314
production (k oz/yr)
Est. LOM (years) 13
2010 exploration budget $4M
16
17. Goldex – Canada
Steady state performance continues
> Operations
• Increasing production rate from 6,900 tpd to 8,000 tpd
(an additional 20,000 oz of gold/yr) by 2011
• Drilling and blasting approximately 1.5 years ahead
of schedule
Au reserves (m oz) 1.6
> 2010 Guidance Average reserve
2.1
grade (g/t)
• Production of 164 koz of gold @ $318/oz
Measured & Indicated
0.0
> 2010 Exploration resource (m oz)
• Focus on resource conversion, exploration to west, Inferred resource
(m oz)
0.8
east and at depth
Estimated average
175
production (k oz/yr)
Est. LOM (yrs) 8
2010 exploration budget $3M
17
18. Lapa – Canada
Steady state mine delivering good tonnage and cost performance
> Operations
• Tonnage exceeding plan. Mill recoveries nearing design
> 2010 Guidance
• Production of 116 koz of gold @ $506/oz
Au reserves (m oz) 0.8
> 2010 Exploration Average reserve
8.2
grade (g/t)
• Focus on resource conversion, further exploration upside
at depth and to the East Measured & Indicated
0.2
resource (m oz)
Inferred resource
0.1
(m oz)
Estimated average
115
production (k oz/yr)
Est. LOM (yrs) 6
2010 exploration budget $3M
18
19. Kittila – Finland
Final optimization phase in progress
> Operations
• Longer than expected maintenance shutdown of mill reduces
gold production in Q1, 2010
• Mill recoveries fluctuating. Expected to reach design rate
in 2010 Au reserves (m oz) 4.0
> 2010 Guidance Average reserve
4.8
grade (g/t)
• Production of 147 koz of gold @ $502/oz
Measured & Indicated
1.5
> 2010 Exploration resource (m oz)
• Focus on resource conversion, expansion below Suuri Inferred resource
0.5
(m oz)
and Roura, and along strike
Estimated average
150
production (k oz/yr)
Est. LOM (yrs) 14
2010 exploration budget $16M
19
20. Kittila – Expansion Opportunity
Examining expansion options; potential reserve increases at depth
> Studying production rate increases, accessing deeper ore
> 2009 gold reserves grew 25%
> Orebody remains open at depth and along strike
> Eleven drills currently operating
2010 Exploration &
Conversion program
2010 Exploration &
Conversion program
0 1000
Probable Reserve Mineral Resource Open Pit Outline
metres
20
21. Pinos Altos – Mexico
Achieving design throughput, steady state expected in Q3
> Operations
• Improved performance of the tailings filters –
additional capacity ordered to facilitate expansion
• Started development of Creston Mascota
> 2010 Guidance Au reserves (m oz) 3.4
• Production of 151 koz of gold @ $401/oz Average reserve
2.5
grade (g/t)
> 2010 Exploration
Measured & Indicated
0.5
• Potential to develop additional satellite resource (m oz)
deposits (Cubiro, Sinter, San Eligio) Inferred resource
0.7
(m oz)
• Focus on resource conversion, expansion of
Pinos Altos zones, Reyna de Plata, Creston Mascota Estimated average
165
production (k oz/yr)
Est. LOM (yrs) 20
2010 exploration budget $4M
21
22. Meadowbank – Canada
Commercial production achieved March 1, 2010
> Operations
• Ramping up to design throughput. 6,400 tpd in March
• Potential production increase from 8,500 tpd to 10,000 tpd
> 2010 Guidance Au reserves (m oz) 3.7
• Production of 300 koz of gold @ $460/oz Average reserve
3.5
grade (g/t)
> 2010 Exploration
Measured & Indicated
3.3
• Focus on resource conversion and expansion of Vault, resource (m oz)
Goose South and Portage Inferred resource
0.8
(m oz)
Estimated average
350
production (k oz/yr)
Est. LOM (yrs) 10
2010 exploration budget $6M
22
24. 2010 Exploration Budget
$75M, up from $54M in 2009
Grassroots Exploration
Quebec $5M (26.5 km)
Mexico $8M (21.0 km) > Targeting 3.0 million ounces of
Finland $7M (20.0 km) gold discovered, including
W. Canada $7M (16.5 km) approximately 2.0 million ounces
Nunavut $5M (16.0 km) of reserves
Nevada $7M (15.9 km)
Total $39M (115.9 km)
> Emphasis on resource exploration
(discovery) & conversion
Mine Site Exploration
(grow reserves)
Kittila $16M (80.6 km) > Objective: 20 Moz to 21 Moz
Goldex $3M (28.2 km) reserves by end of 2010
Meadowbank $6M (25.4 km)
Pinos Altos $4M (19.4 km) > 297 kilometres of exploration
LaRonde $4M (19.3 km)
drilling planned
Lapa $3M (8.0 km)
Total $36M (180.9 km)
24
27. A solid financial position, low-cost structure,
well-funded growth projects in regions of low
political risk, and a focused, consistent strategy
put Agnico-Eagle in a strong position to continue
creating exceptional per share value.
Sean Boyd
Vice Chairman and Chief Executive Officer
Ebe Scherkus
President and Chief Operating Officer
David Garofalo
Senior Vice President, Finance and Chief Financial Officer
Trading Symbol: AEM on TSX & NYSE
Executive and Registered Office:
145 King Street East, Suite 400
Toronto, Ontario, Canada, M5C 2Y7
Tel: 416-947-1212
Toll-Free: 888-822-6714
Fax: 416-367-4681
www.agnico-eagle.com
Investor Relations:
416-947-1212
info@agnico-eagle.com
Member of the World Gold Council www.gold.org
27