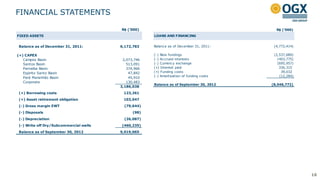
OGX reported financial results for the first nine months of 2012. Key highlights include:
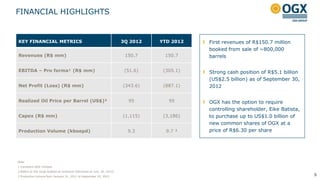
- Revenues of R$150.7 million from the sale of ~800,000 barrels of oil in Q3 2012.
- EBITDA loss of R$305.1 million for the year-to-date and R$51.6 million in Q3.
- Net loss of R$887.1 million for the year-to-date and R$343.6 million in Q3.
- Production averaged 9.3 kboepd in Q3 from the Campos Basin fields, with a third well coming online soon.
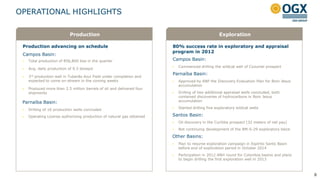
- Exploration success rate was 80% in 2012, with
3. COMPANY STRATEGY
OGX is Brazil’s largest private oil and natural gas exploration company focused on accessing Brazil’s
substantial, untapped reserves
• World class portfolio consisting of 32 prime shallow water and onshore blocks
28 exploratory blocks in 5 Brazilian sedimentary basins
4 onshore exploratory blocks in 2 Colombian sedimentary basins
• Executing the largest and most successful private sector exploratory campaign in Brazil
Overall exploratory success rate of 80% in 2012
More than 100 wells spud since the beginning of its exploratory campaign in Sep. 2009
• Proven production capability
Quickly move from exploration to production – 2 years and 3 months in Campos Basin
Fully established operations that utilize low cost and off-the-shelf technology
• Sound, flexible financial profile supports exploration and production strategy
Cash position to support exploration commitments, development and production ramp-up
First revenues of R$150.7 million booked in Q3 2012 from the sale of ~800,000 barrels
Economies of scale will dilute costs per barrel
3
5. FINANCIAL HIGHLIGHTS
KEY FINANCIAL METRICS 3Q 2012 YTD 2012 First revenues of R$150.7 million
booked from sale of ~800,000
Revenues (R$ mm) 150.7 150.7 barrels
EBITDA – Pro forma¹ (R$ mm) (51.6) (305.1) Strong cash position of R$5.1 billion
(US$2.5 billion) as of September 30,
Net Profit (Loss) (R$ mm) (343.6) (887.1) 2012
Realized Oil Price per Barrel (US$)² 95 95 OGX has the option to require
controlling shareholder, Eike Batista,
Capex (R$ mm) (1,115) (3,186) to purchase up to US$1.0 billion of
new common shares of OGX at a
Production Volume (kboepd) 9.3 9.7 ³ price of R$6.30 per share
Note:
1 Considers OGX Campos
2 Refers to the cargo booked as revenues (delivered on July, 26, 2012)
3 Production volume from January 31, 2012 to September 30, 2012 5
7. FPSO OSX-1 FINANCIAL RESULTS
Pro Forma EBITDA Reconciliation
Delivered cargos 1st ¹ 2nd ¹ 3rd ² 4th ³ Total
Delivery Date 03/28/2012 4/21/2012 07/26/2012 10/15/2012
Operation Period 51 days 27 days 98 days 80 days
Production related to the shipments
547,376 246,809 789,774 809,495 2,393,454
- in barrels (bbls)
R$ ('000)
Net Revenue 118,003 55,996 150,686 169,145 493,830
Sales Taxes - - - - -
Royalties (10,687) (4,938) (14,842) (15,772) (46,239)
Leasing (24,078) (13,222) (52,708) (41,998) (132,006)
OSX Services (13,944) (7,236) (28,071) (22,499) (71,750)
Logistics (12,005) (7,410) (27,795) (18,405) (65,615)
Others (871) 36 (1,183) (1,529) (3,547)
EBITDA 56,418 23,226 26,087 68,942 174,673
Total Net Revenue of R$ 493.8 million and Total
% EBITDA / Net Revenue 47.81% 41.48% 17.31% 40.76% 35.37%
EBITDA / barrel - (R$/barrel) 103.07 94.11 33.03 85.17 72.98 EBITDA of R$ 174.7 million, reflecting the asset’s
Daily Cost (USD '000) 1st cargo 2nd cargo 3rd cargo 4th cargo Average
high value
Leasing (268) (262) (268) (259) (264)
Economies of scale will dilute costs per barrel
OSX Services (155) (143) (143) (139) (144)
Logistics (134) (147) (141) (113) (131)
Others (10) 1 (6) (9) (7)
Total (567) (551) (557) (520) (546)
Note:
1 Sales occurred during the Extended Well Test and before the declaration of commerciality – not accounted in Results and recorded as a reduction of “Fixed Assets”
2 Sale occurred after the Extended Well Test and declaration of commerciality – recorded as net revenues
3 Sale occurred after the Extended Well Test and declaration of commerciality – recorded as net revenues. Net figure of expenses associated with the sale of freight costs
7
8. OPERATIONAL HIGHLIGHTS
Production Exploration
Production advancing on schedule 80% success rate in exploratory and appraisal
program in 2012
Campos Basin:
Total production of 856,800 boe in the quarter Campos Basin:
Commenced drilling the wildcat well of Cozumel prospect
Avg. daily production of 9.3 kboepd
Parnaíba Basin:
3rd production well in Tubarão Azul Field under completion and
expected to come on-stream in the coming weeks Approved by ANP the Discovery Evaluation Plan for Bom Jesus
accumulation
Produced more than 2.5 million barrels of oil and delivered four
shipments Drilling of two additional appraisal wells concluded, both
contained discoveries of hydrocarbons in Bom Jesus
Parnaíba Basin: accumulation
Drilling of 16 production wells concluded Started drilling five exploratory wildcat wells
Operating License authorizing production of natural gas obtained Santos Basin:
Oil discovery in the Curitiba prospect (32 meters of net pay)
Not continuing development of the BM-S-29 exploratory block
Other Basins:
Plan to resume exploration campaign in Espírito Santo Basin
before end of exploration period in October 2014
Participation in 2012 ANH round for Colombia basins and plans
to begin drilling the first exploration well in 2013
8
9. OPERATIONAL HIGHLIGHTS
Tubarão Azul Field Development Tubarão Martelo Field Development
BM-C-41
BM-C-39
TUBARÃO
AZUL TUBARÃO
MARTELO
Exploration wells drilled Exploration wells drilled
Production wells drilled Production wells drilled
BM-C-40
Average Monthly Production(kboepd)
Average Monthly Production (kboepd)
11.6
10.3 10.6 10.4 10.3
9.1 9.0 9.2
7.0
Concluding the drilling and completion of 3 horizontal production
wells (TBMT-2HP, TBMT-4HP and TBMT-6HP)
Effective
Production Days
Feb-12 Mar-12 Apr-12 May-12 Jun-12 Jul-12 Aug-12 Sep-12 Oct-12
FPSO OSX-3 scheduled to arrive by 3Q13
OGX-26HP 29 31 30 29 20 - 27 30 31
OGX-68HP - - - 17 30 31 31 30 31
Total 29 31 30 46 50 31 58 60 62
Tubarão Martelo Field is scheduled to come on-stream by 4Q13
Average per well
11.6 10.3 9.1 6.1 5.5 7.0 5.7 5.2 5.2
(kboepd)¹
Note: 9
¹ Considers the total volume produced divided by the effective days of production
11. 2013 OUTLOOK
Prospect Block
Total Estimated
Recoverable Volume Working Interest
OGX Estimated
Recoverable Volume Spud date
Exploratory wells to be drilled
(PMean) (PMean)
Cozumel BM-C-37 209-270 mmboe 70% 146-189 mmboe 4Q12 • Santos Basin: 1 well until the concession for exploration ends in
Tulum BM-C-37 194-280 mmboe 70% 136-196 mmboe 4Q12
Cancun BM-C-37 184-294 mmboe 70% 129-206 mmboe 1Q13 March 2013
Viedma BM-C-38 245-313 mmboe 70% 172-219 mmboe 1Q13
Cotopaxi BM-C-38 30-40 mmboe 70% 21-28 mmboe 1Q13 • Parnaíba Basin: 10 wells
Total - 861-1,196 mm boe 70% 603-837 mm boe -
TOTAL PRODUCTION • Espírito Santo Basin: 3 wells, together with Perenco, the operator
[XXX] of the blocks
Cancun
CAPEX
Tulum 2013 Capex Breakdown
2012 annual estimate:
Exploration 2013 Annual
$1.2 billion 20% estimate:
Cozumel
US$1.2 billion
Viedma
Development
80%
Drilled Wells
Cotopaxi 2012/2013 planned wells
11
12. UPCOMING EVENTS
CAMPOS BASIN PARNAÍBA BASIN
Campos Basin:
• Connection of the third production well in the Tubarão Azul Field
• Drilling important prospects in blocks BM-C-37 and BM-C-38 in the Campos Basin
Parnaíba Basin:
• Beginning of GTU commissioning and gas production
• Continuation of the exploration and wildcat campaigns
SANTOS BASIN ESPÍRITO SANTO BASIN
Santos Basin:
• Results of tests and drilling in the Santos Basin
• Continuation of the exploration and wildcat campaigns
Espírito Santo Basin:
• Continuation of the exploration and wildcat campaigns
12