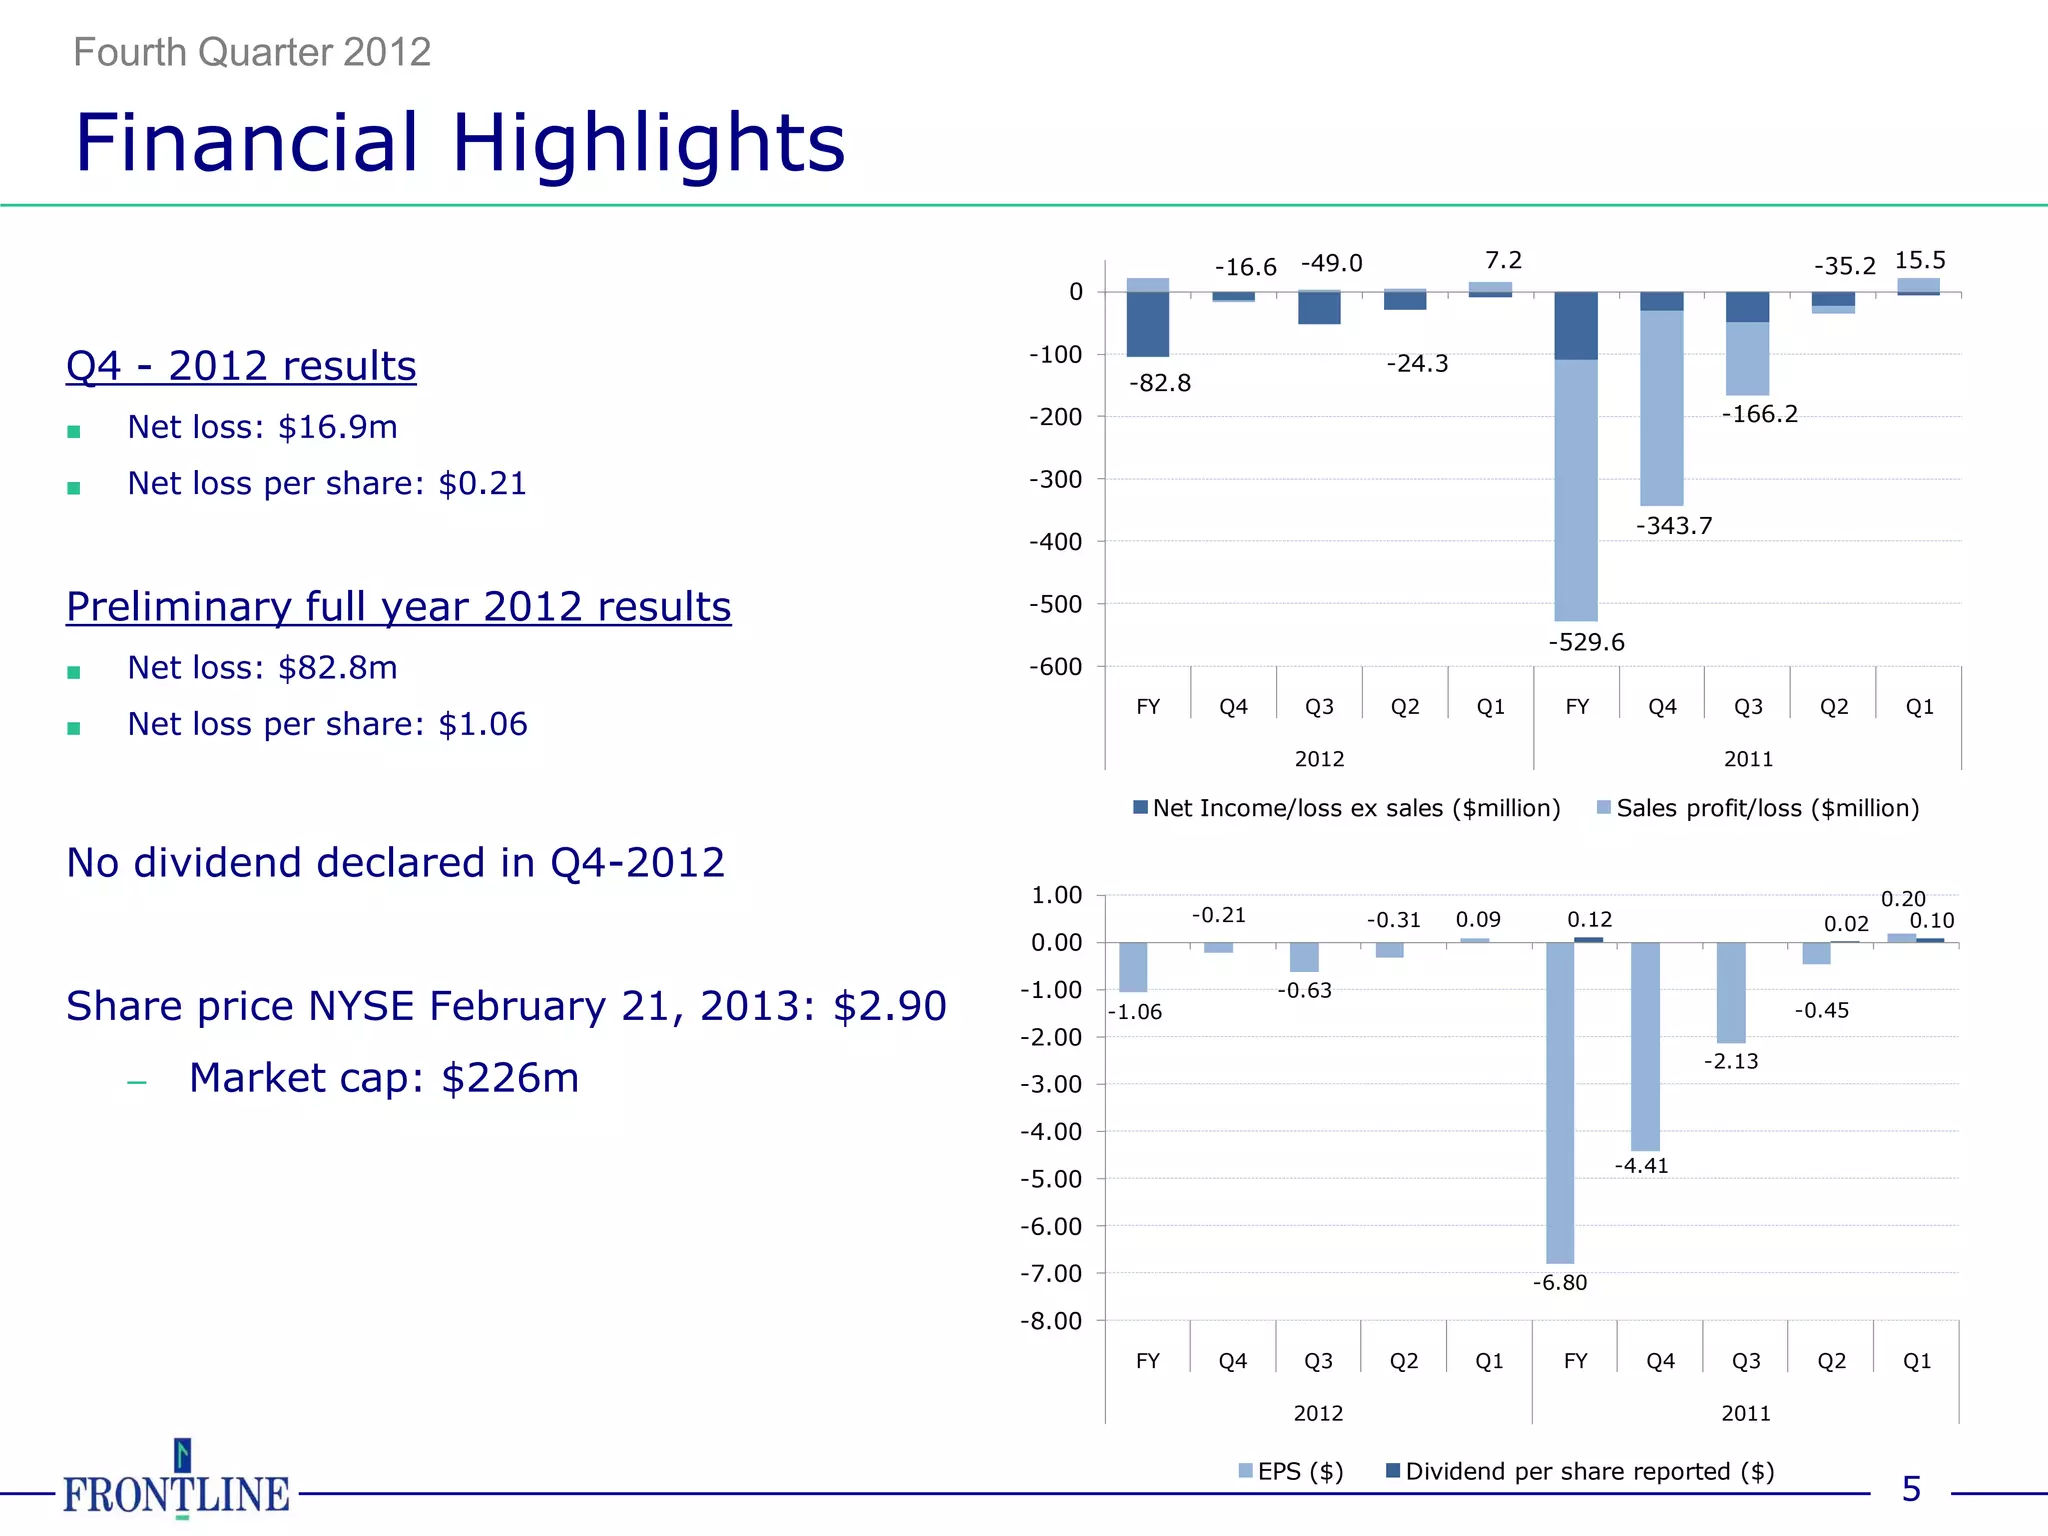
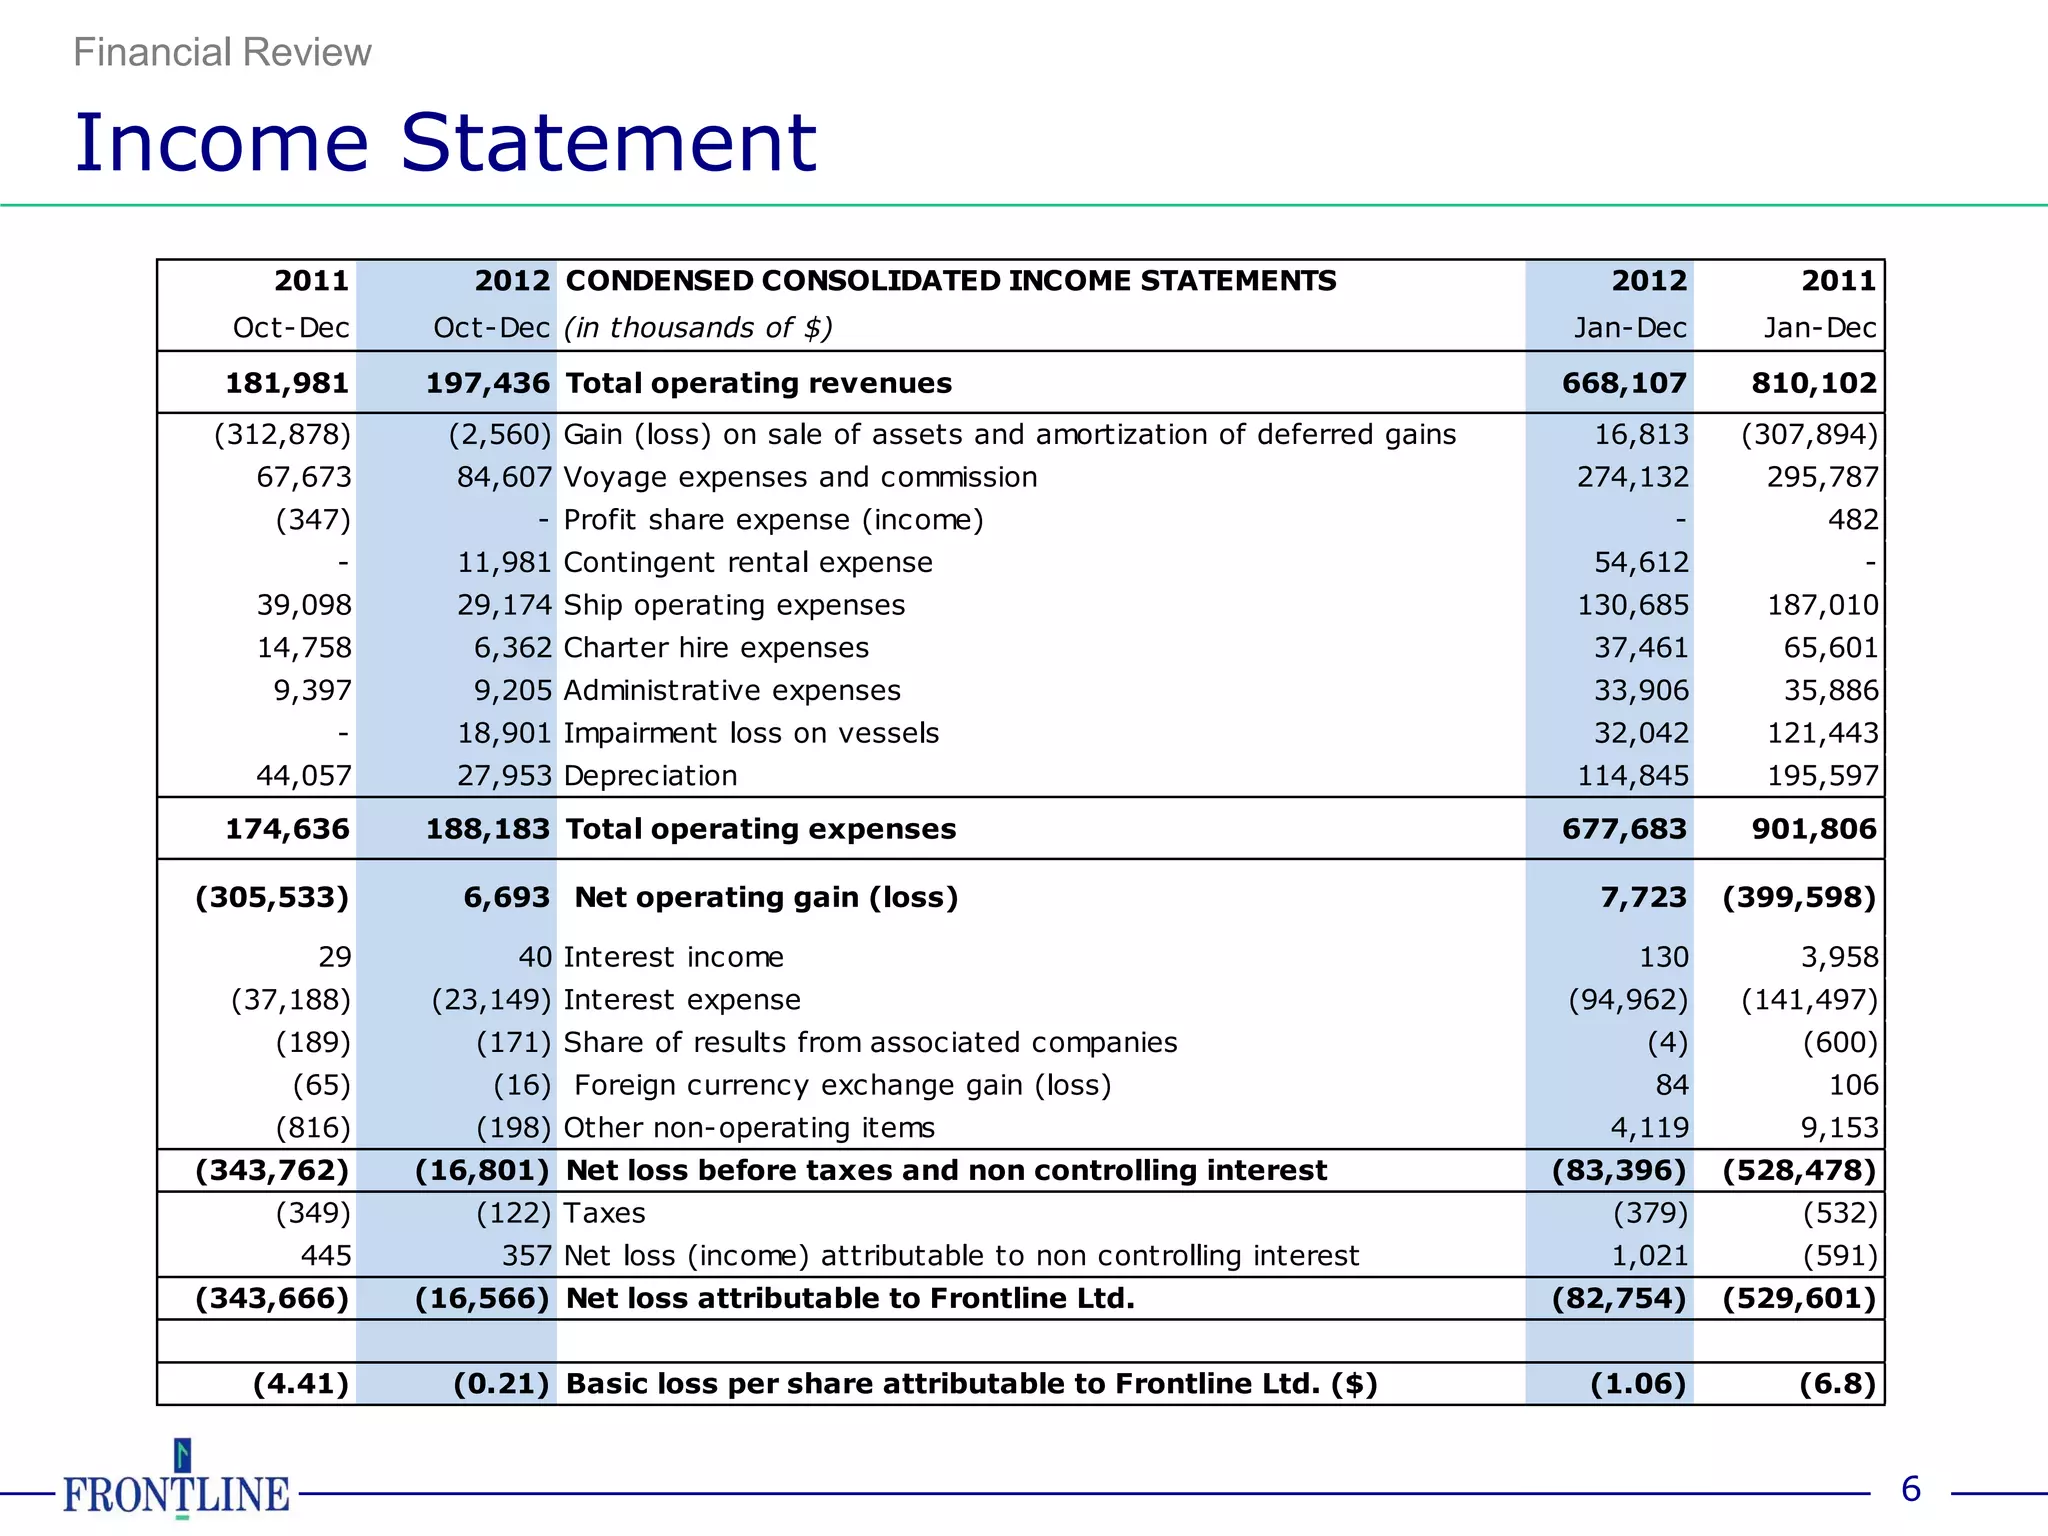
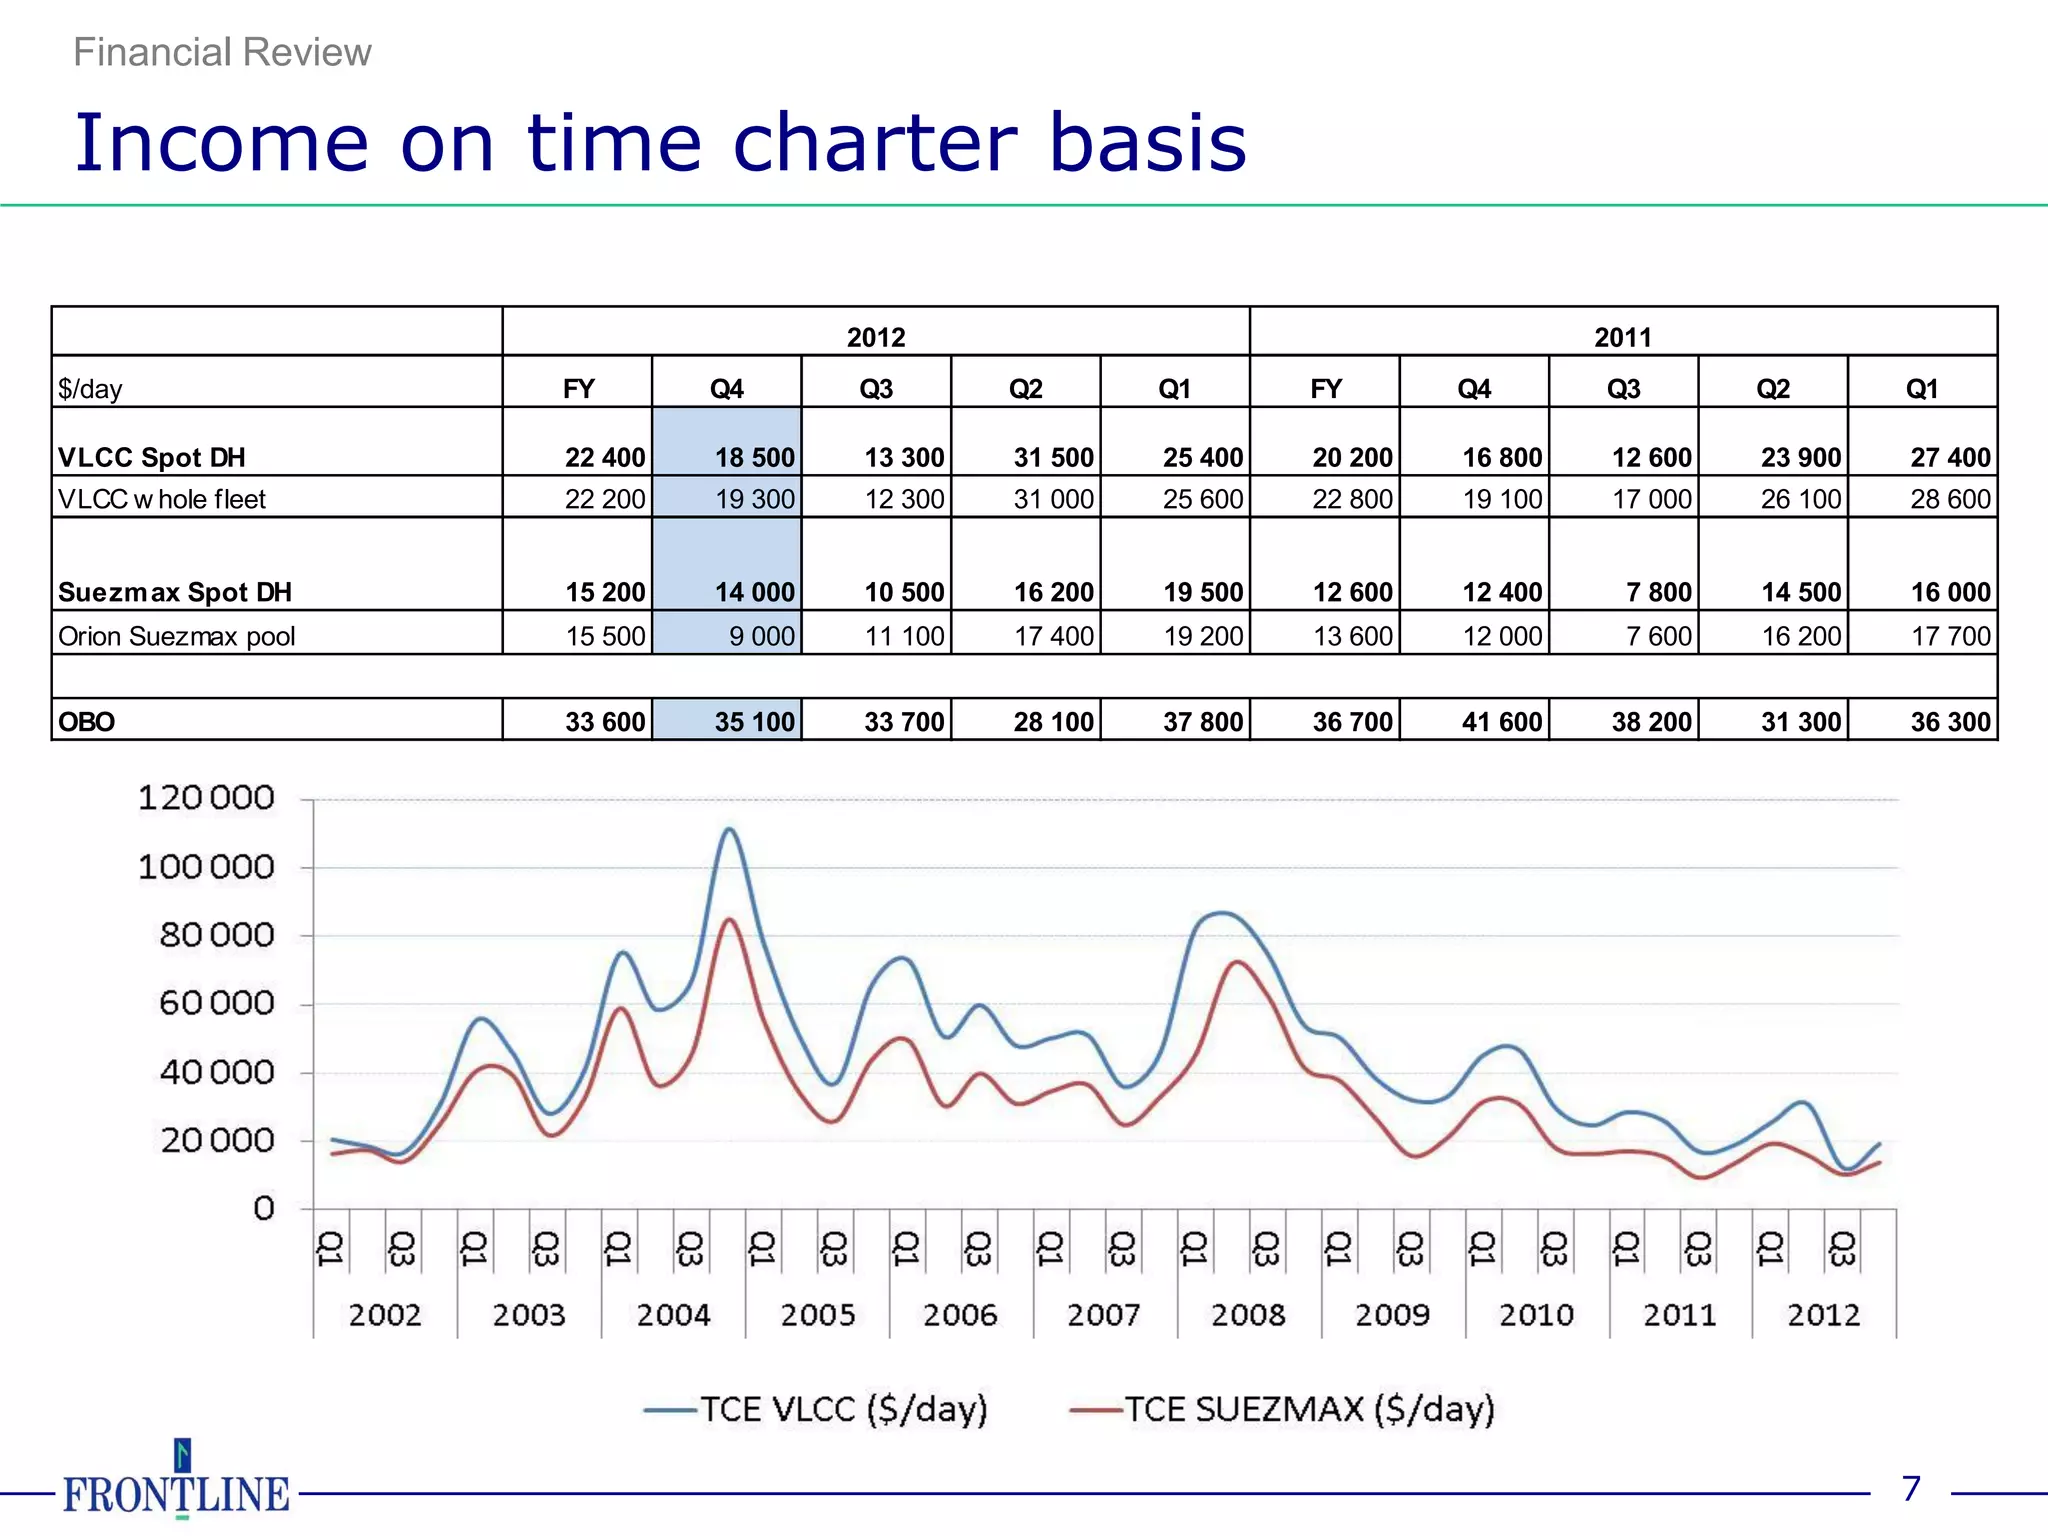
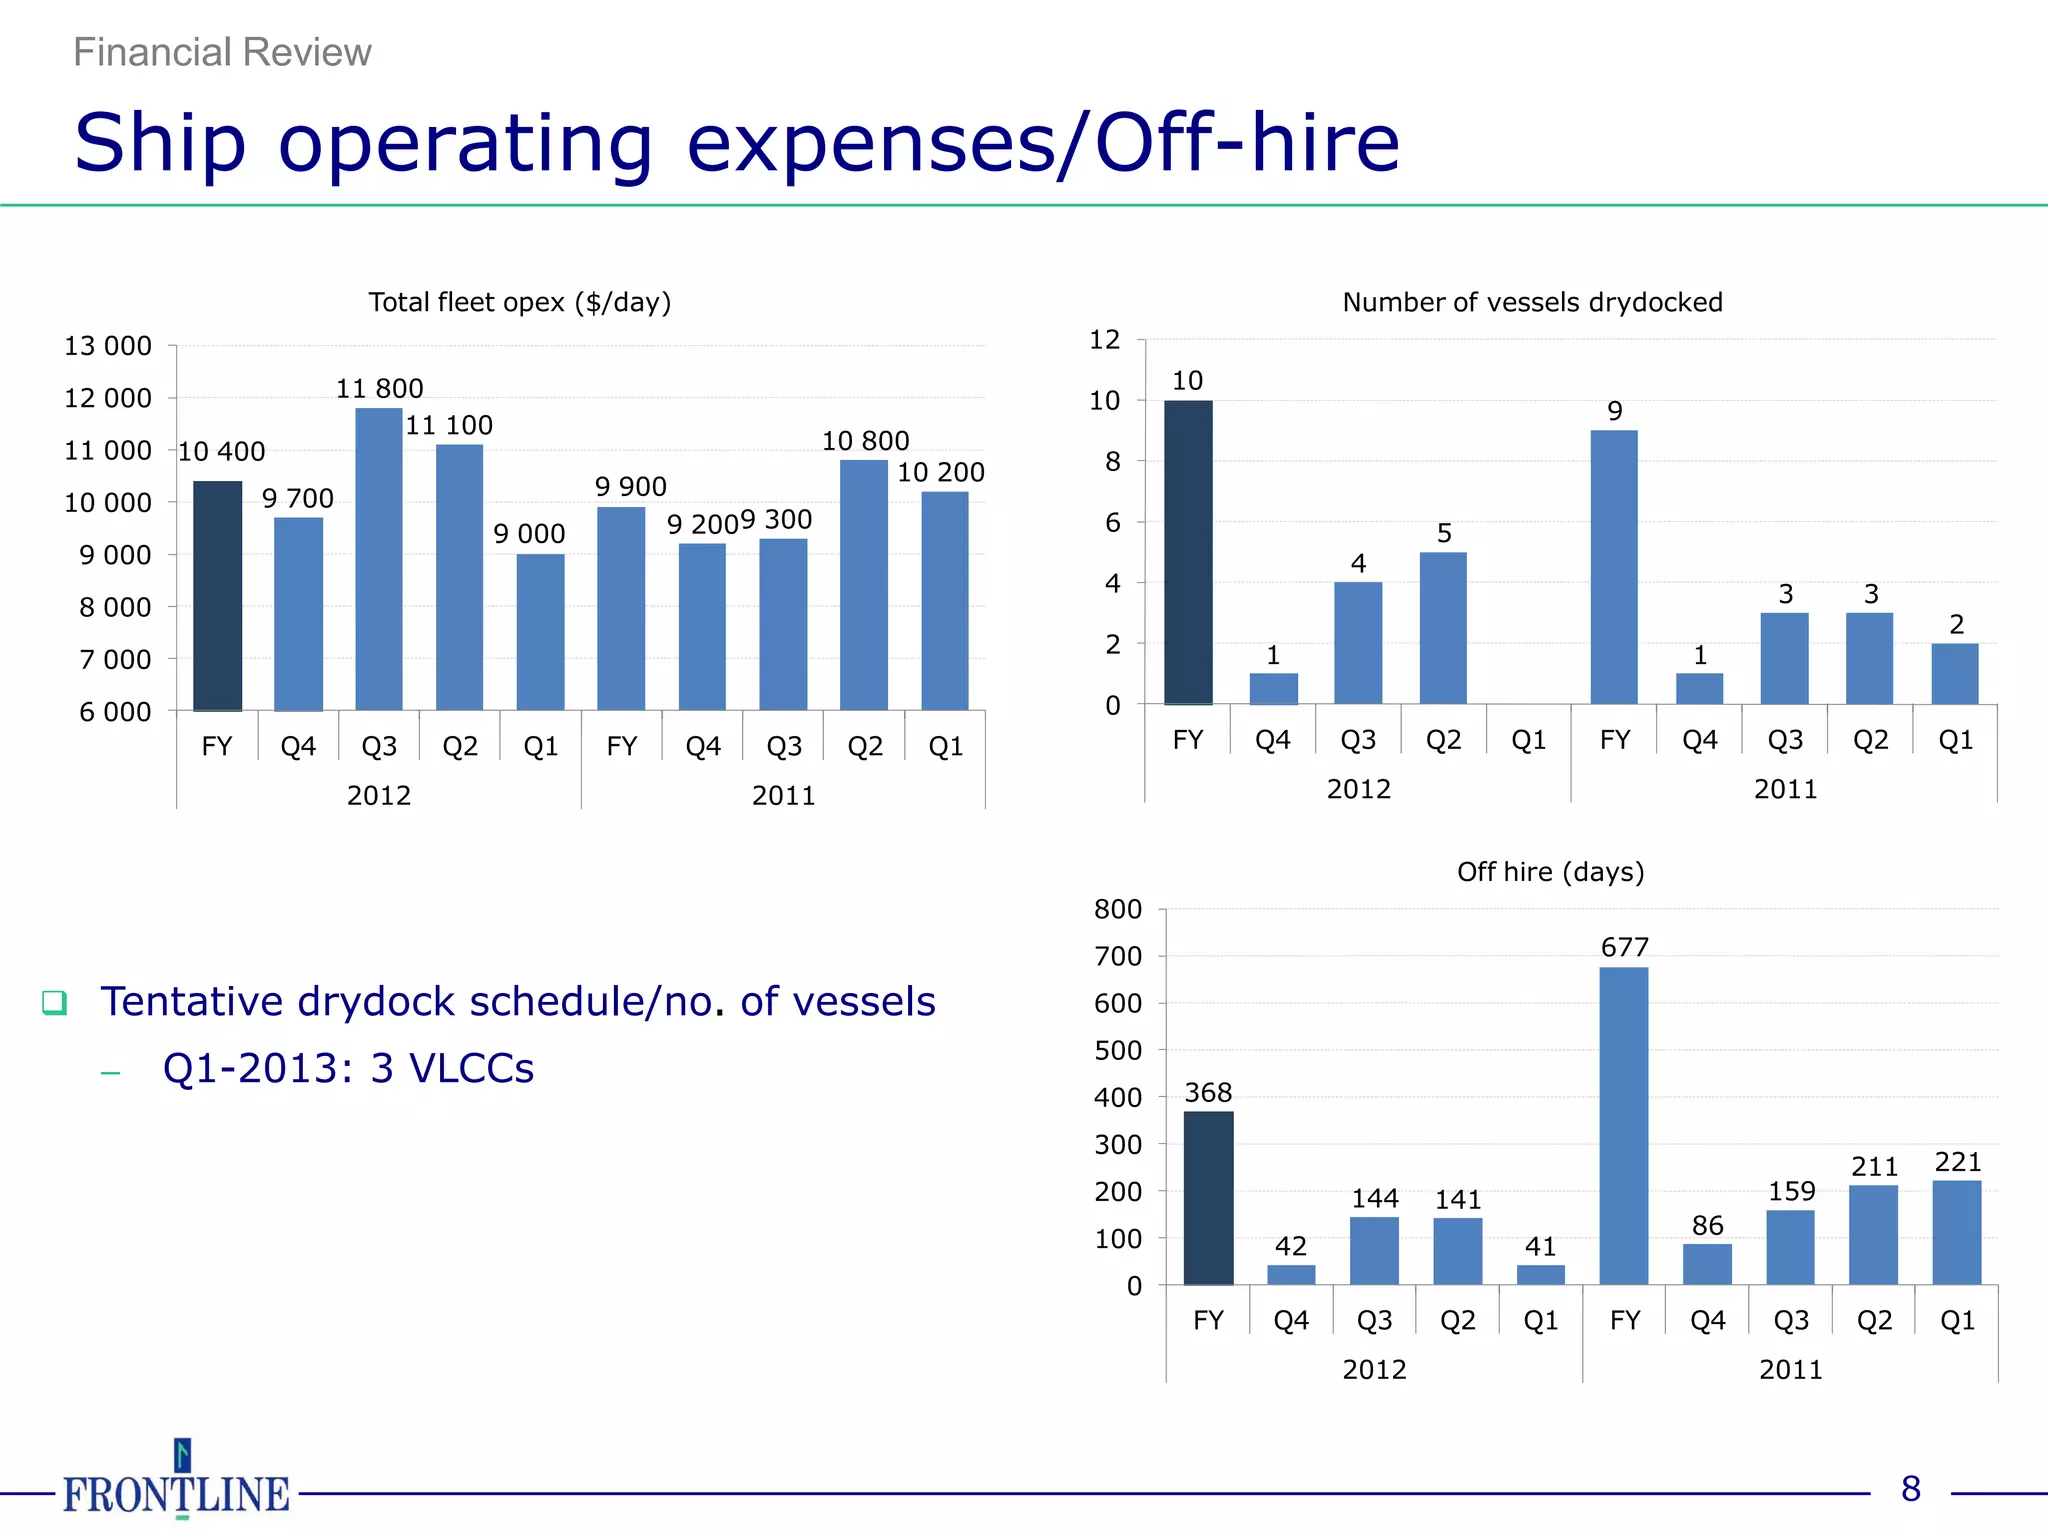
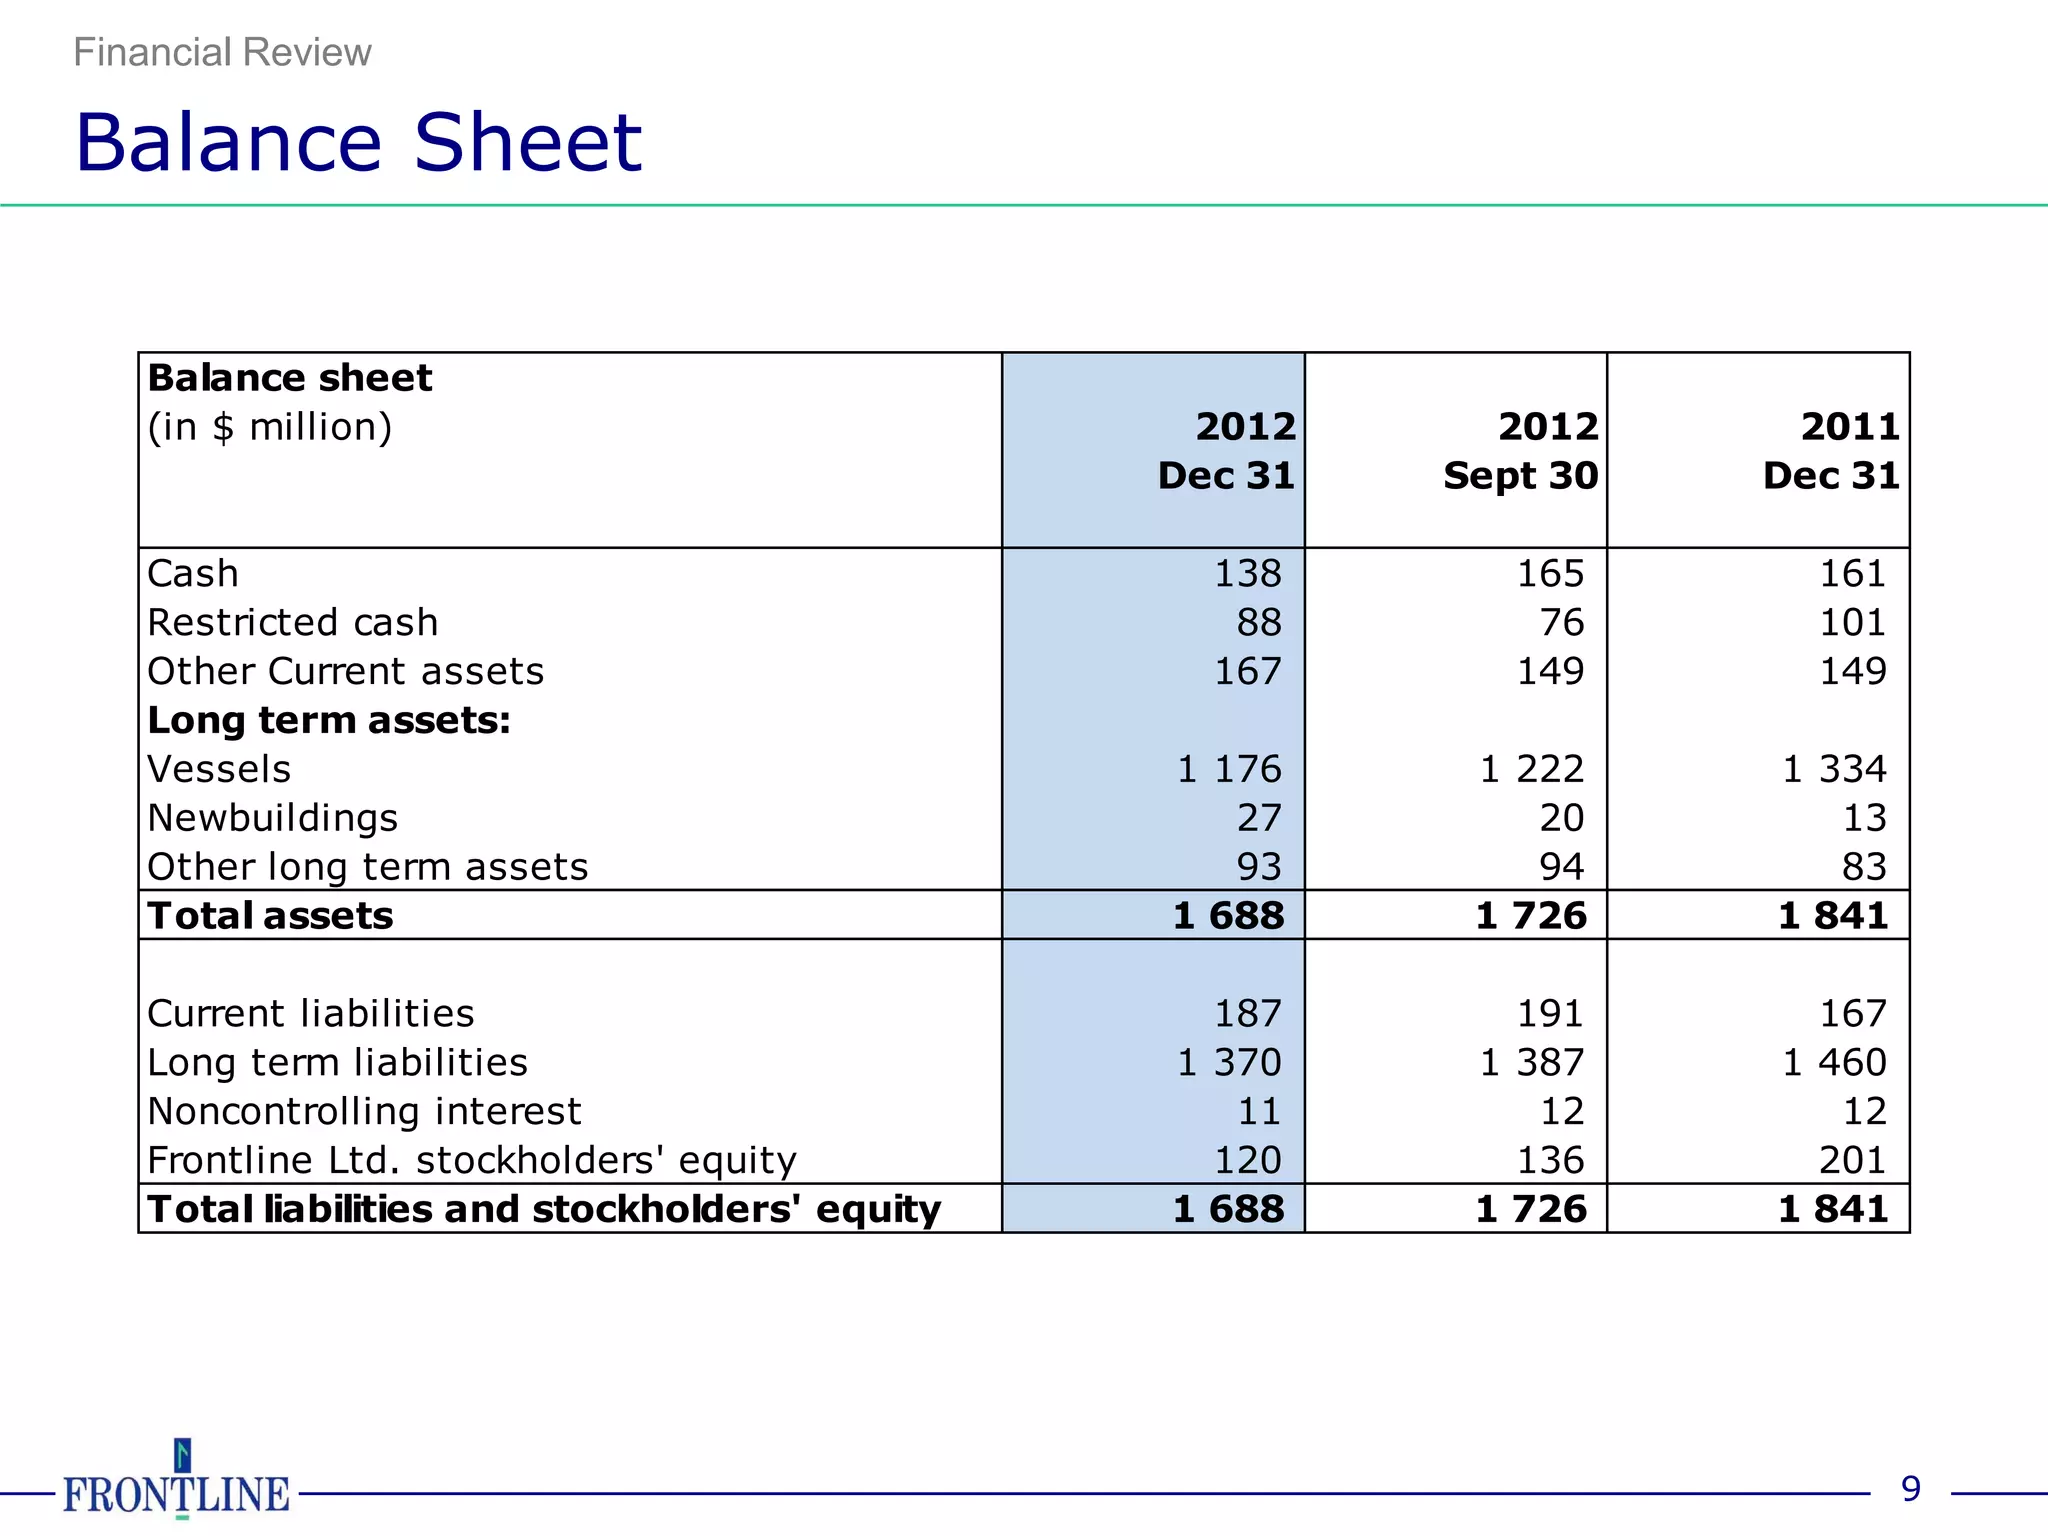
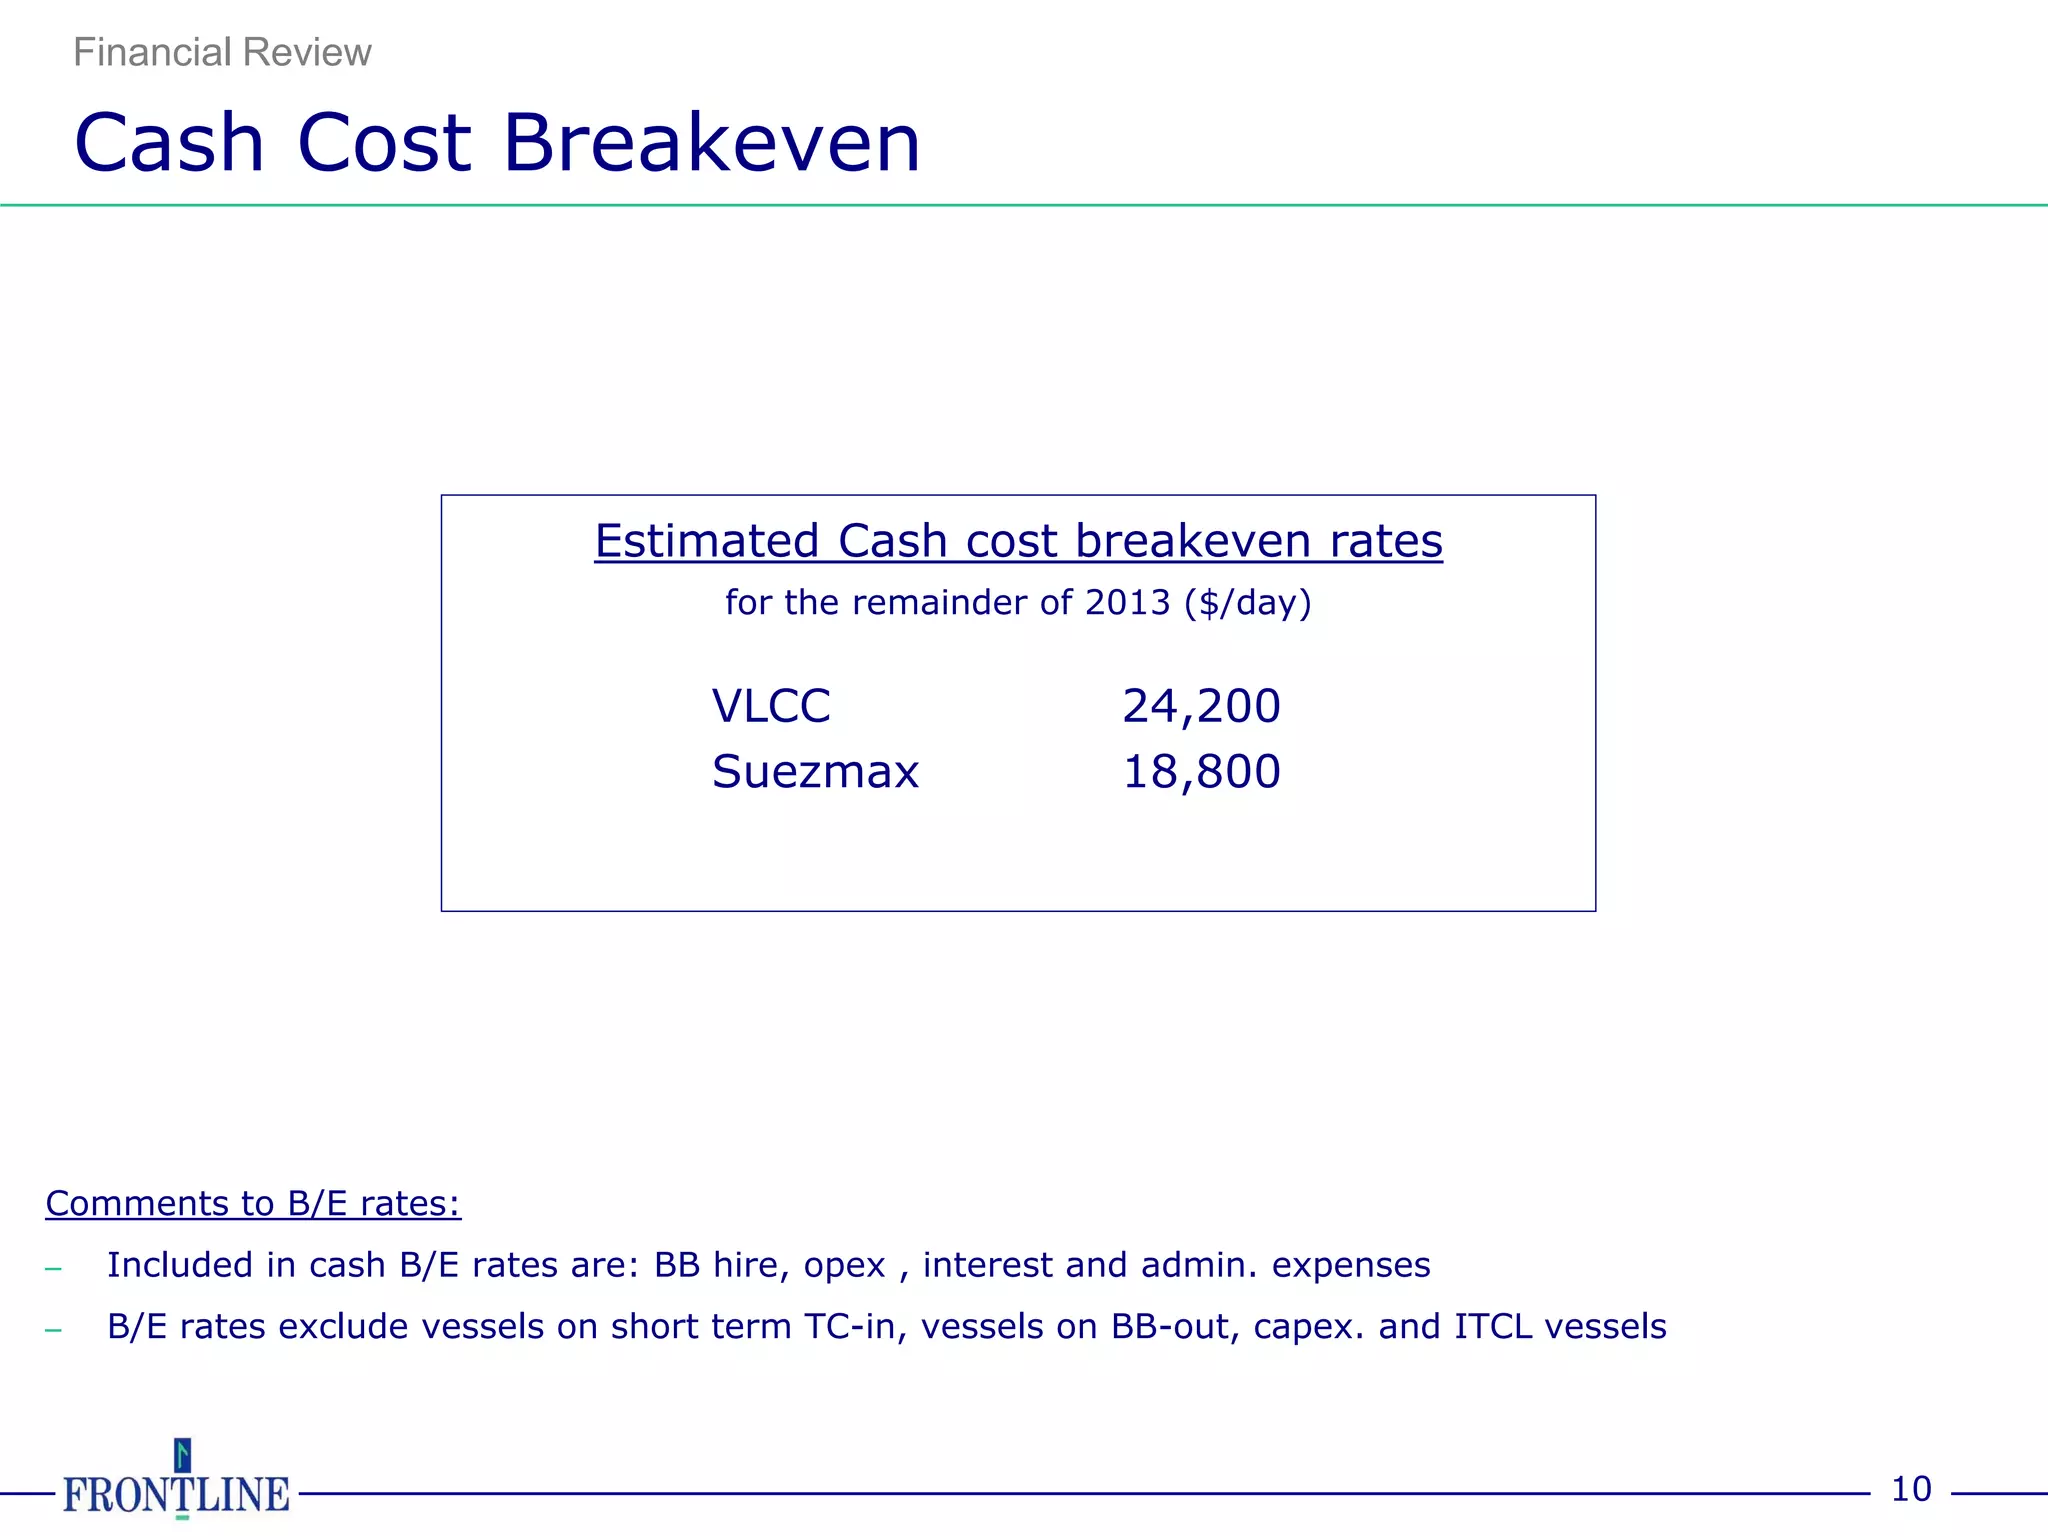
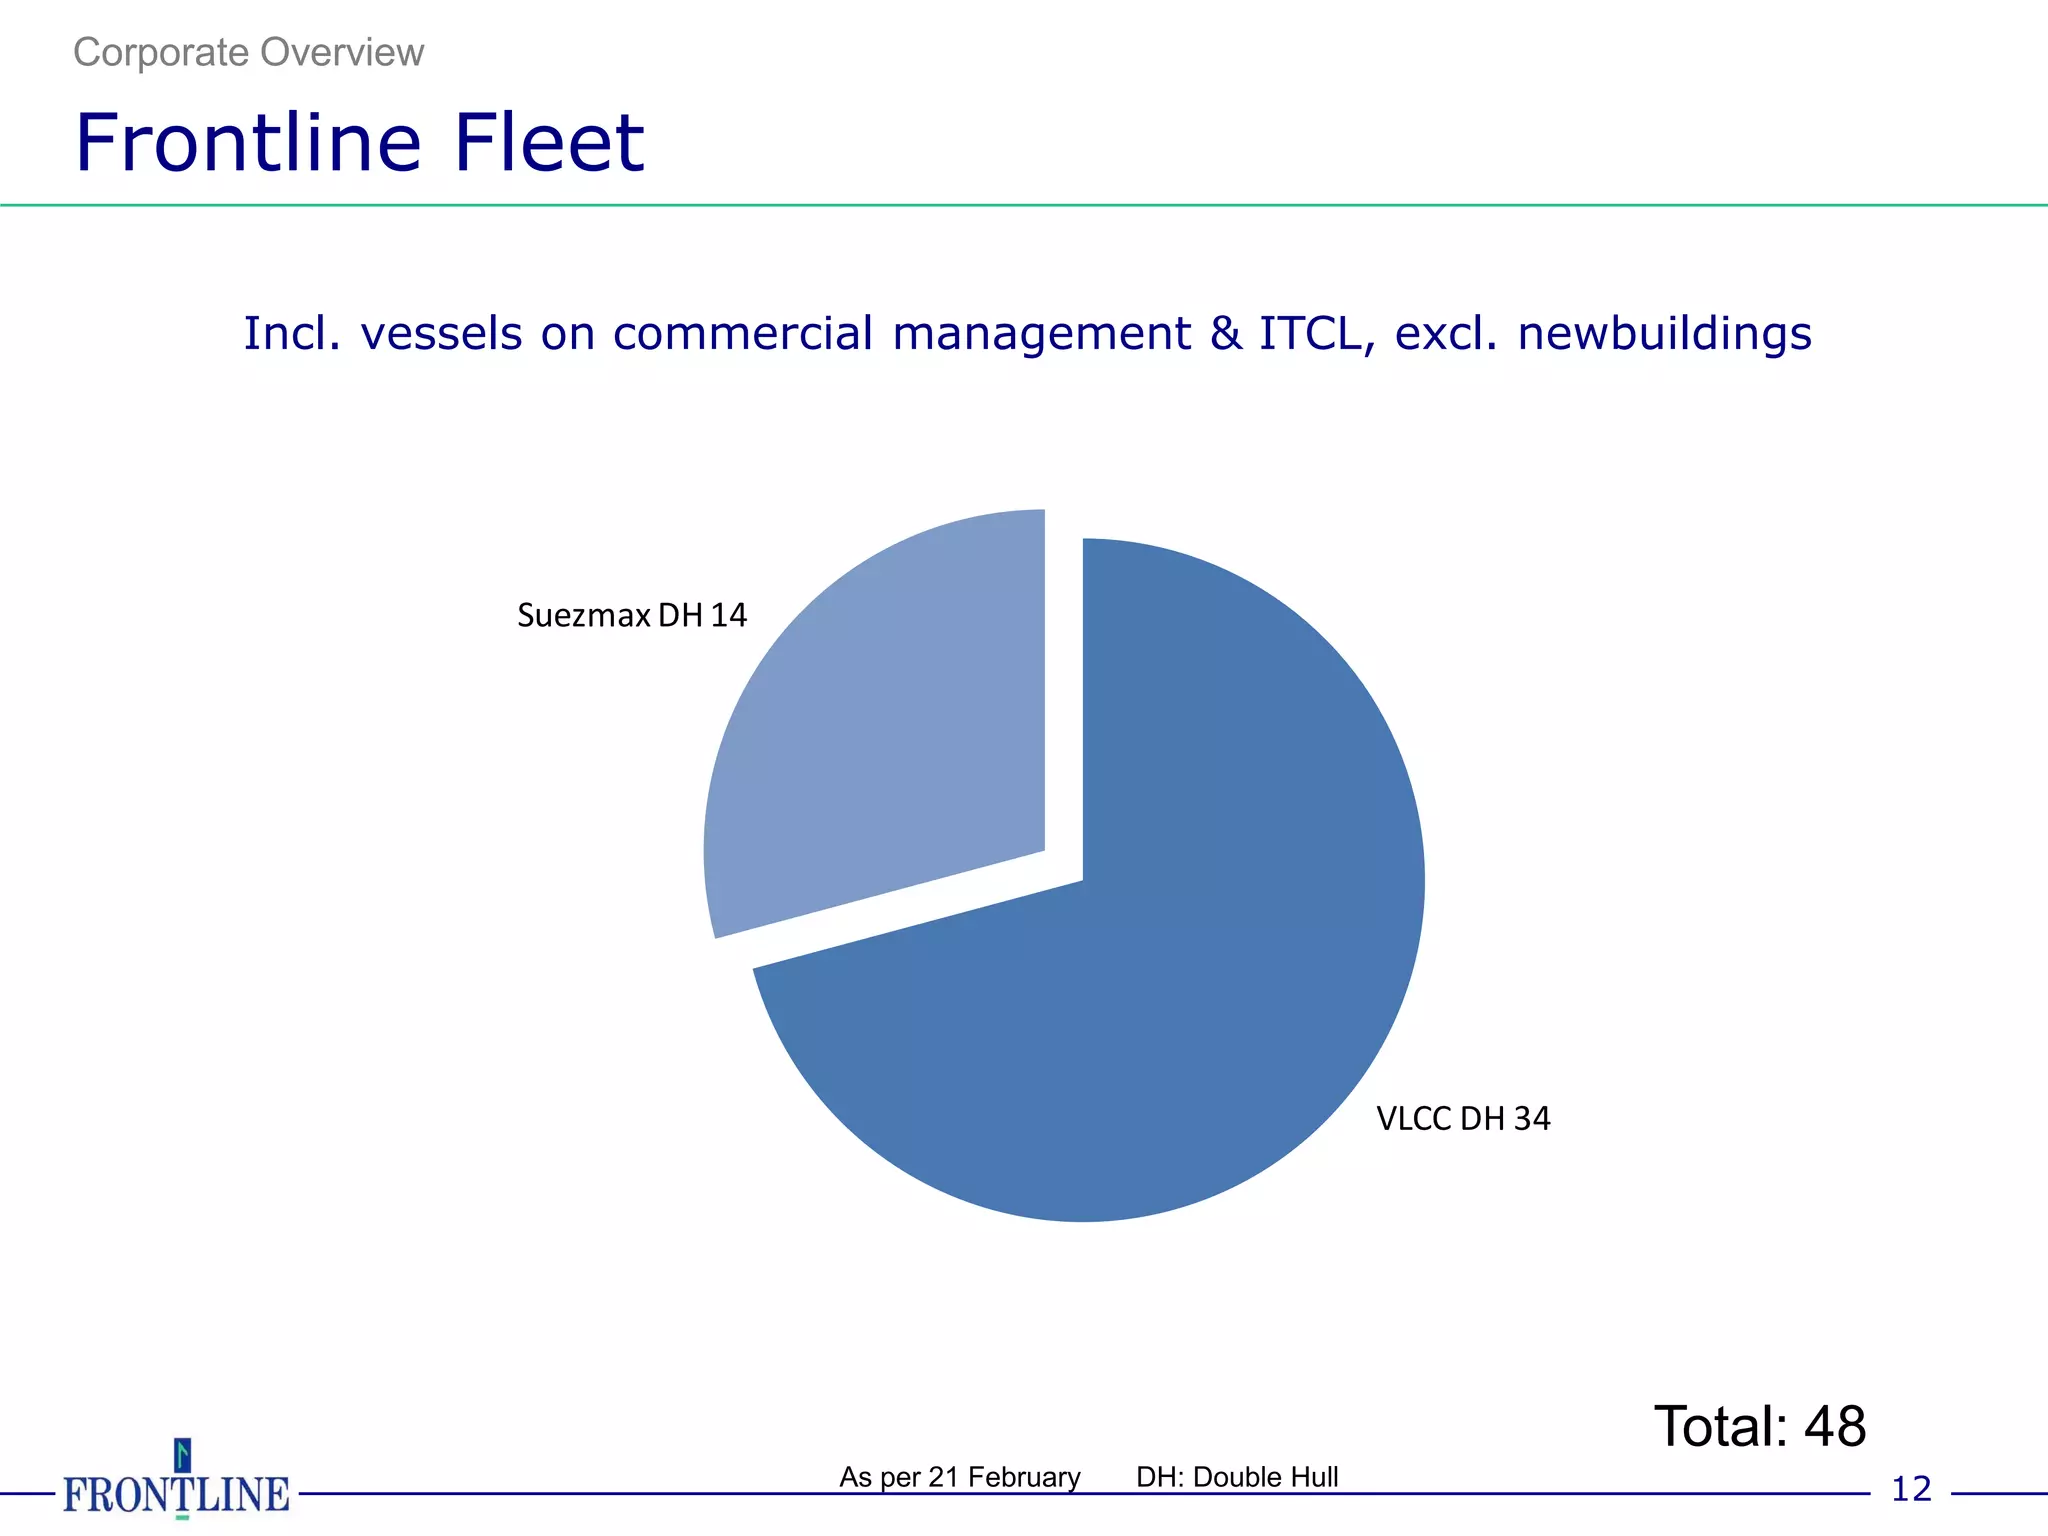
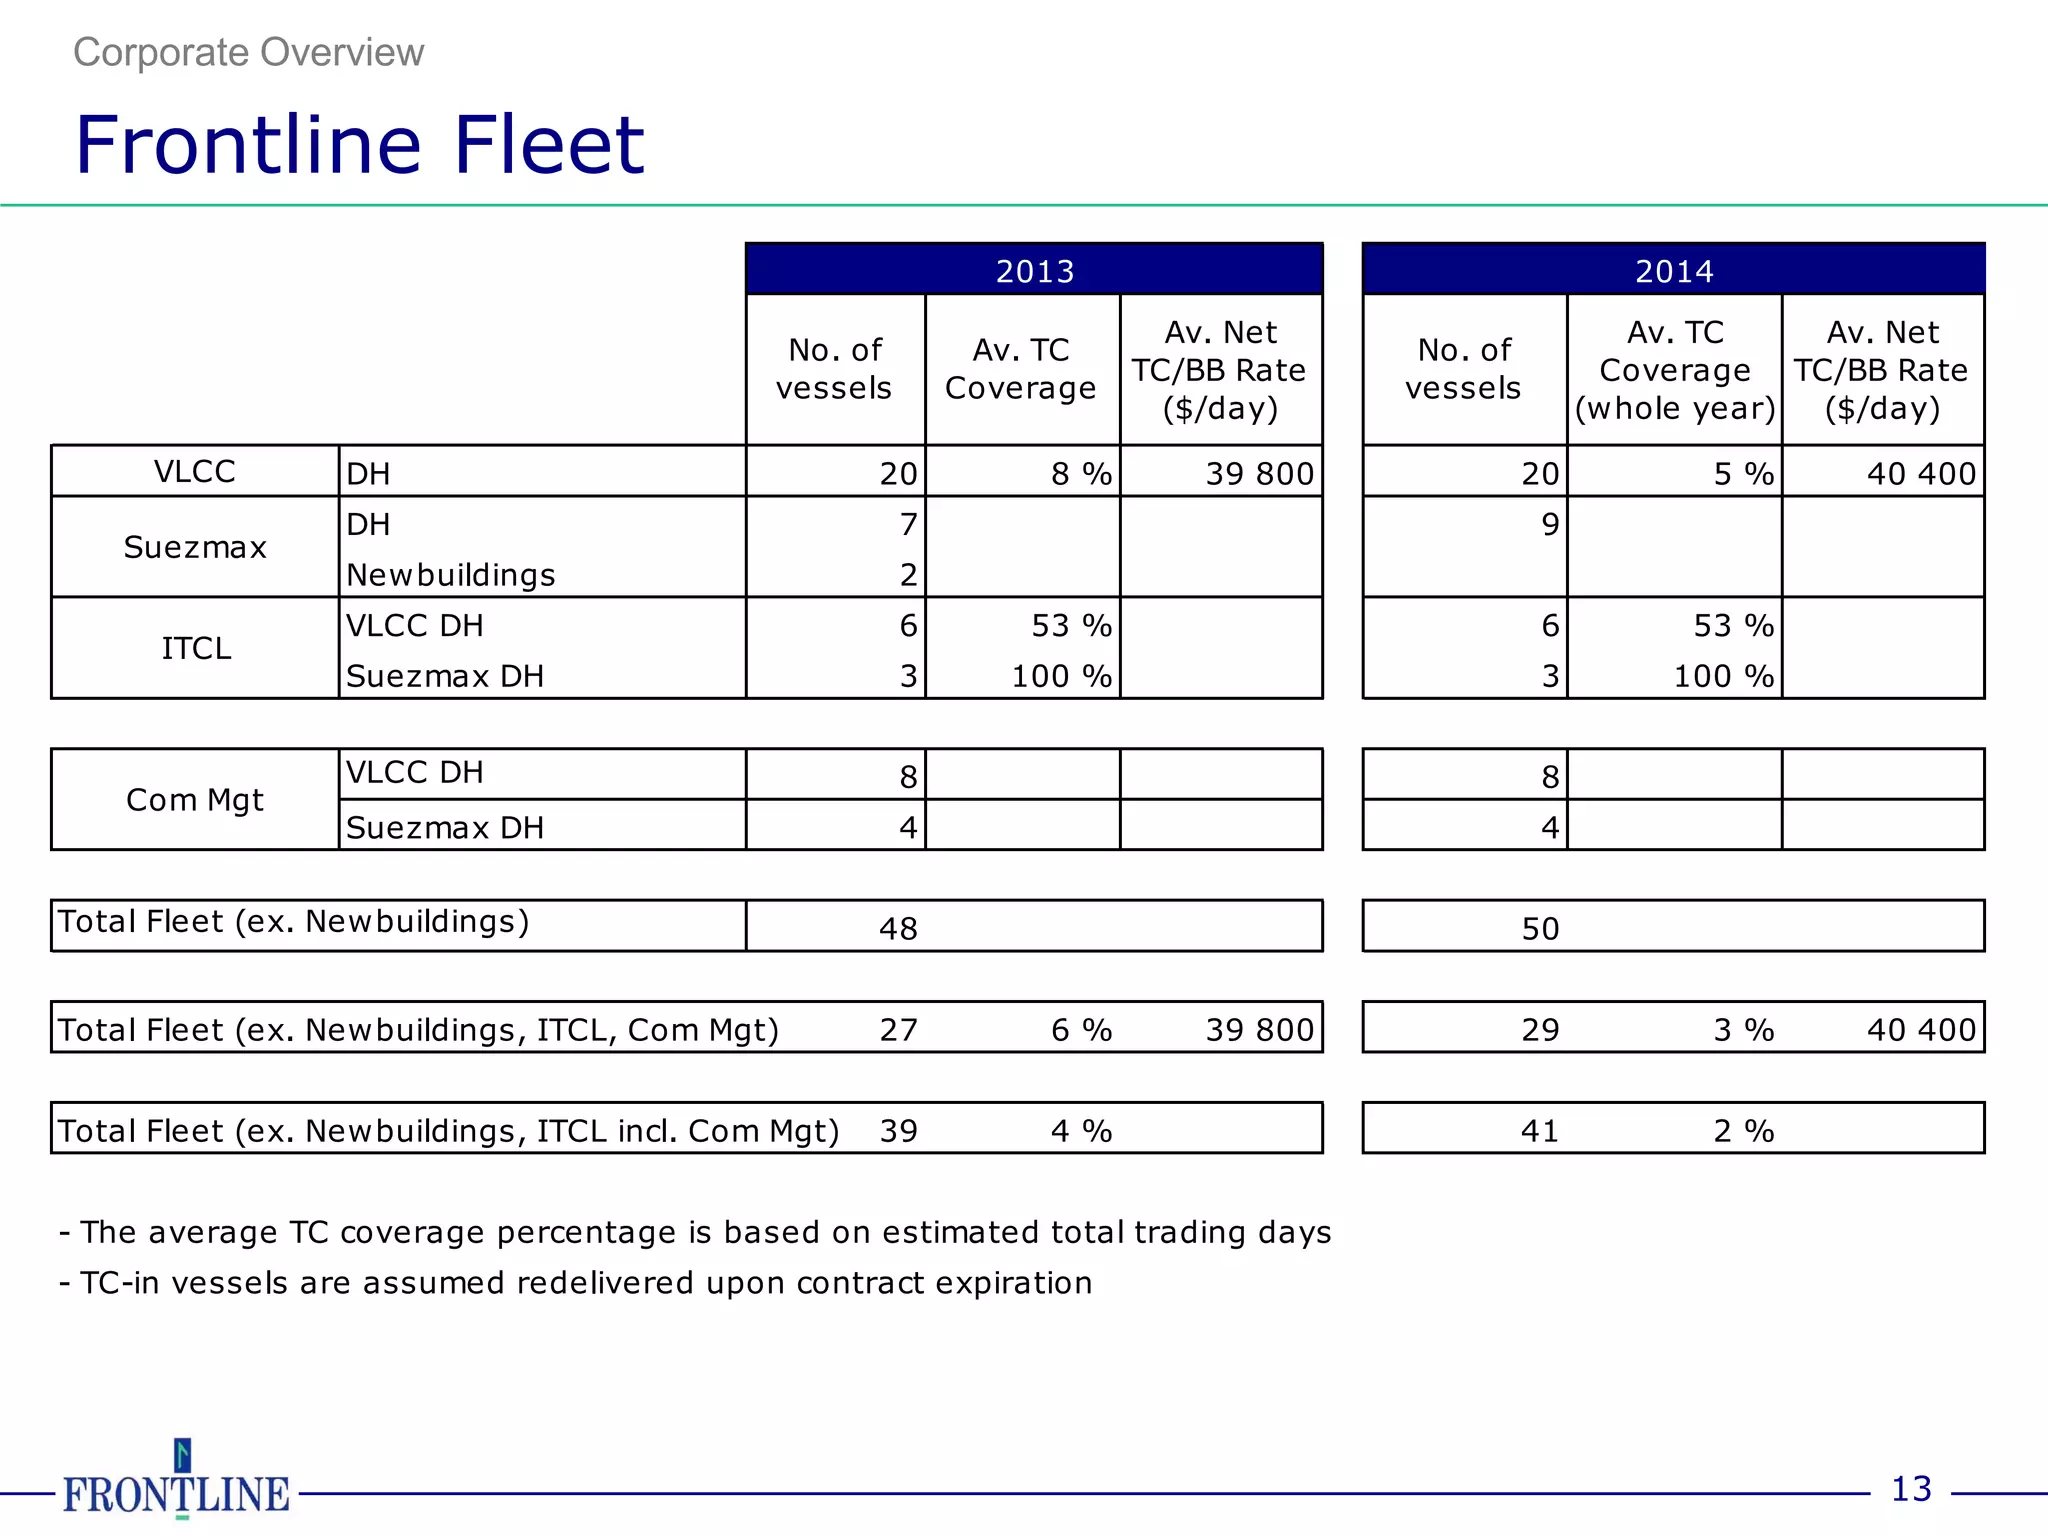
Q4 2012 Results


  February 22, 1
               2013
Forward looking statements
MATTERS DISCUSSED IN THIS DOCUMENT MAY CONSTITUTE FORWARD-LOOKING STATEMENTS. THE PRIVATE SECURITIES LITIGATION REFORM
ACT OF 1995 PROVIDES SAFE HARBOR PROTECTIONS FOR FORWARD-LOOKING STATEMENTS IN ORDER TO ENCOURAGE COMPANIES TO PROVIDE
PROSPECTIVE INFORMATION ABOUT THEIR BUSINESS. FORWARD-LOOKING STATEMENTS INCLUDE STATEMENTS CONCERNING PLANS,
OBJECTIVES, GOALS, STRATEGIES, FUTURE EVENTS OR PERFORMANCE, AND UNDERLYING ASSUMPTIONS AND OTHER STATEMENTS, WHICH ARE
OTHER THAN STATEMENTS OF HISTORICAL FACTS.


FRONTLINE DESIRES TO TAKE ADVANTAGE OF THE SAFE HARBOR PROVISIONS OF THE PRIVATE SECURITIES LITIGATION REFORM ACT OF 1995
AND IS INCLUDING THIS CAUTIONARY STATEMENT IN CONNECTION WITH THIS SAFE HARBOR LEGISLATION. THE WORDS “BELIEVE,”
“ANTICIPATE,” “INTENDS,” “ESTIMATE,” “FORECAST,” “PROJECT,” “PLAN,” “POTENTIAL,” “WILL,” “MAY,” “SHOULD,” “EXPECT” “PENDING” AND
SIMILAR EXPRESSIONS IDENTIFY FORWARD-LOOKING STATEMENTS.


THE FORWARD-LOOKING STATEMENTS IN THIS DOCUMENT ARE BASED UPON VARIOUS ASSUMPTIONS, MANY OF WHICH ARE BASED, IN TURN,
UPON FURTHER ASSUMPTIONS, INCLUDING WITHOUT LIMITATION, MANAGEMENT'S EXAMINATION OF HISTORICAL OPERATING TRENDS, DATA
CONTAINED IN FRONTLINE’S RECORDS AND OTHER DATA AVAILABLE FROM THIRD PARTIES. ALTHOUGH FRONTLINE BELIEVES THAT THESE
ASSUMPTIONS WERE REASONABLE WHEN MADE, BECAUSE THESE ASSUMPTIONS ARE INHERENTLY SUBJECT TO SIGNIFICANT UNCERTAINTIES
AND CONTINGENCIES WHICH ARE DIFFICULT OR IMPOSSIBLE TO PREDICT AND ARE BEYOND FRONTLINE’S CONTROL, YOU CANNOT BE ASSURED
THAT FRONTLINE WILL ACHIEVE OR ACCOMPLISH THESE EXPECTATIONS, BELIEFS OR PROJECTIONS. FRONTLINE UNDERTAKES NO DUTY TO
UPDATE ANY FORWARD-LOOKING STATEMENT TO CONFORM THE STATEMENT TO ACTUAL RESULTS OR CHANGES IN EXPECTATIONS.


IMPORTANT FACTORS THAT, IN FRONTLINE’S VIEW, COULD CAUSE ACTUAL RESULTS TO DIFFER MATERIALLY FROM THOSE DISCUSSED IN THE
FORWARD-LOOKING STATEMENTS INCLUDE, WITHOUT LIMITATION: THE STRENGTH OF WORLD ECONOMIES AND CURRENCIES, GENERAL MARKET
CONDITIONS, INCLUDING FLUCTUATIONS IN CHARTERHIRE RATES AND VESSEL VALUES, CHANGES IN DEMAND IN THE TANKER MARKET,
INCLUDING BUT NOT LIMITED TO CHANGES IN OPEC'S PETROLEUM PRODUCTION LEVELS AND WORLD WIDE OIL CONSUMPTION AND STORAGE,
CHANGES IN FRONTLINE’S OPERATING EXPENSES, INCLUDING BUNKER PRICES, DRYDOCKING AND INSURANCE COSTS, THE MARKET FOR
FRONTLINE’S VESSELS, AVAILABILITY OF FINANCING AND REFINANCING, ABILITY TO COMPLY WITH COVENANTS IN SUCH FINANCING
ARRANGEMENTS, FAILURE OF COUNTERPARTIES TO FULLY PERFORM THEIR CONTRACTS WITH US, CHANGES IN GOVERNMENTAL RULES AND
REGULATIONS OR ACTIONS TAKEN BY REGULATORY AUTHORITIES, POTENTIAL LIABILITY FROM PENDING OR FUTURE LITIGATION, GENERAL
DOMESTIC AND INTERNATIONAL POLITICAL CONDITIONS, POTENTIAL DISRUPTION OF SHIPPING ROUTES DUE TO ACCIDENTS OR POLITICAL
EVENTS, VESSEL BREAKDOWNS, INSTANCES OF OFF-HIRE AND OTHER IMPORTANT FACTORS. FOR A MORE COMPLETE DISCUSSION OF THESE
AND OTHER RISKS AND UNCERTAINTIES ASSOCIATED WITH FRONTLINE’S BUSINESS, PLEASE REFER TO FRONTLINE’S FILINGS WITH THE
SECURITIES AND EXCHANGE COMMISSION, INCLUDING, BUT NOT LIMITED TO, ITS ANNUAL REPORT ON FORM 20-F.


THIS PRESENTATION IS NOT AN OFFER TO PURCHASE OR SELL, OR A SOLICITATION OF AN OFFER TO PURCHASE OR SELL, ANY SECURITIES OF
FRONTLINE.


                                                                                                                          2
Agenda


■ Fourth Quarter 2012 Highlights and
  Transactions
■ Financial Review

■ Newbuildings

■ Market Update

■ Outlook

■ Q & A


                                       3
Fourth Quarter 2012

Highlights and Transactions

■   The company terminated a number of vessels in
    the recent period:
     ■   The OBO carriers Front Climber and Front Driver in
         October and November
     ■   The VLCC Ticen Ocean in November, 2012.
         Recognized a gain of $11.2m
     ■   The VLCC Titan Aries in January, 2013. Expects to
         recognize a gain of $7.5m in Q1-13.
     ■   The Suezmax Front Pride in February, 2013.
         Recorded an impairment loss of $4.7m in Q4-12.

■   Agreed to an early termination of the TC-out
    contracts on the OBO carriers Front Viewer and
    Front Guider in December.
     ■   Received compensation for loss of hire of $35m
     ■   Paid $23.5m in compensation to SFL as the long term
         charter parties on the vessels were terminated.

■   Re-delivered the chartered-in VLCC Gulf Eyadah in
    December


                                                               4
Fourth Quarter 2012

Financial Highlights
                                                              -16.6 -49.0                7.2                                -35.2 15.5
                                               0

                                            -100
Q4 - 2012 results                                    -82.8
                                                                               -24.3

                                            -200                                                                   -166.2
■   Net loss: $16.9m
■   Net loss per share: $0.21               -300

                                                                                                          -343.7
                                            -400


Preliminary full year 2012 results          -500
                                                                                                -529.6
■   Net loss: $82.8m                        -600
                                                      FY      Q4       Q3       Q2      Q1       FY         Q4      Q3      Q2       Q1
■   Net loss per share: $1.06
                                                                      2012                                         2011

                                                        Net Income/loss ex sales ($million)              Sales profit/loss ($million)

No dividend declared in Q4-2012
                                            1.00                                                                                   0.20
                                                            -0.21             -0.31    0.09       0.12                      0.02      0.10
                                            0.00

                                            -1.00                    -0.63
Share price NYSE February 21, 2013: $2.90           -1.06                                                                 -0.45
                                            -2.00
                                                                                                                 -2.13
    –   Market cap: $226m                   -3.00

                                            -4.00
                                                                                                         -4.41
                                            -5.00

                                            -6.00

                                            -7.00                                              -6.80
                                            -8.00
                                                      FY      Q4       Q3       Q2      Q1       FY        Q4      Q3       Q2       Q1

                                                                      2012                                         2011

                                                                    EPS ($)      Dividend per share reported ($)
                                                                                                                                    5
Financial Review

Income Statement
          2011        2012 CONDENSED CONSOLIDATED INCOME STATEMENTS                                2012        2011
        Oct-Dec     Oct-Dec (in thousands of $)                                                  Jan-Dec     Jan-Dec

        181,981    197,436 Total operating revenues                                             668,107     810,102
       (312,878)     (2,560) Gain (loss) on sale of assets and amortization of deferred gains     16,813    (307,894)
         67,673      84,607 Voyage expenses and commission                                       274,132     295,787
           (347)           - Profit share expense (income)                                             -         482
               -     11,981 Contingent rental expense                                             54,612            -
         39,098      29,174 Ship operating expenses                                              130,685     187,010
         14,758       6,362 Charter hire expenses                                                 37,461      65,601
          9,397       9,205 Administrative expenses                                               33,906      35,886
               -     18,901 Impairment loss on vessels                                            32,042     121,443
         44,057      27,953 Depreciation                                                         114,845     195,597
        174,636    188,183 Total operating expenses                                             677,683     901,806

      (305,533)       6,693 Net operating gain (loss)                                             7,723    (399,598)

             29           40 Interest income                                                         130       3,958
        (37,188)    (23,149) Interest expense                                                   (94,962)    (141,497)
           (189)       (171) Share of results from associated companies                              (4)        (600)
            (65)        (16) Foreign currency exchange gain (loss)                                    84         106
           (816)       (198) Other non-operating items                                             4,119       9,153
      (343,762)    (16,801) Net loss before taxes and non controlling interest                  (83,396)   (528,478)
           (349)       (122) Taxes                                                                 (379)        (532)
            445         357 Net loss (income) attributable to non controlling interest             1,021        (591)
      (343,666)    (16,566) Net loss attributable to Frontline Ltd.                             (82,754)   (529,601)


         (4.41)      (0.21) Basic loss per share attributable to Frontline Ltd. ($)               (1.06)       (6.8)


                                                                                                                        6
Financial Review

 Income on time charter basis

                                       2012                                          2011
$/day                FY       Q4       Q3        Q2       Q1       FY       Q4       Q3        Q2       Q1

VLCC Spot DH         22 400   18 500    13 300   31 500   25 400   20 200   16 800    12 600   23 900   27 400
VLCC w hole fleet    22 200   19 300    12 300   31 000   25 600   22 800   19 100    17 000   26 100   28 600


Suezm ax Spot DH     15 200   14 000    10 500   16 200   19 500   12 600   12 400     7 800   14 500   16 000
Orion Suezmax pool   15 500    9 000    11 100   17 400   19 200   13 600   12 000     7 600   16 200   17 700


OBO                  33 600   35 100    33 700   28 100   37 800   36 700   41 600    38 200   31 300   36 300


                                                                                                        7
Financial Review

 Ship operating expenses/Off-hire
                          Total fleet opex ($/day)                                                  Number of vessels drydocked
 13 000                                                                        12
                        11 800                                                          10
 12 000                                                                        10                                         9
                             11 100
 11 000 10 400                                                   10 800
                                                                      10 200    8
                9 700                       9 900
 10 000
                                    9 000        9 2009 300                     6                          5
  9 000                                                                                              4
                                                                                4                                                      3     3
  8 000
                                                                                                                                                       2
                                                                                2             1                                  1
  7 000

  6 000                                                                         0
           FY    Q4      Q3    Q2     Q1    FY       Q4   Q3      Q2    Q1              FY    Q4    Q3     Q2      Q1     FY     Q4   Q3     Q2        Q1

                        2012                              2011                                      2012                              2011


                                                                                                               Off hire (days)
                                                                               800
                                                                               700                                        677

 Tentative drydock schedule/no. of vessels                                    600
                                                                               500
   –      Q1-2013: 3 VLCCs                                                              368
                                                                               400
                                                                               300
                                                                                                                                             211       221
                                                                               200                   144   141                        159
                                                                                                                                 86
                                                                               100             42                   41
                                                                                    0
                                                                                         FY    Q4    Q3    Q2       Q1     FY    Q4    Q3    Q2        Q1
                                                                                                    2012                              2011


                                                                                                                                                   8
Financial Review

Balance Sheet

   Balance sheet
   (in $ million)                                2012      2012     2011
                                                Dec 31   Sept 30   Dec 31

   Cash                                           138       165      161
   Restricted cash                                 88        76      101
   Other Current assets                           167       149      149
   Long term assets:
   Vessels                                      1 176     1 222    1 334
   Newbuildings                                    27        20       13
   Other long term assets                          93        94       83
   Total assets                                 1 688     1 726    1 841

   Current liabilities                            187       191      167
   Long term liabilities                        1 370     1 387    1 460
   Noncontrolling interest                         11        12       12
   Frontline Ltd. stockholders' equity            120       136      201
   Total liabilities and stockholders' equity   1 688     1 726    1 841


                                                                           9
Financial Review

    Cash Cost Breakeven


                                Estimated Cash cost breakeven rates
                                        for the remainder of 2013 ($/day)


                                       VLCC                    24,200
                                       Suezmax                 18,800


Comments to B/E rates:
–    Included in cash B/E rates are: BB hire, opex , interest and admin. expenses
–    B/E rates exclude vessels on short term TC-in, vessels on BB-out, capex. and ITCL vessels


                                                                                                 10
Newbuilding

    Newbuilding Overview
■     Total newbuilding program as of December 31, 2012:
        –   Two Suezmax tankers
        –   Remaining installments to be paid approx. $87.9m


                                                               11
Corporate Overview

Frontline Fleet

        Incl. vessels on commercial management & ITCL, excl. newbuildings


                     Suezmax DH 14


                                                                            VLCC DH 34


                                                                                         Total: 48
                                     As per 21 February   DH: Double Hull                            12
Corporate Overview

Frontline Fleet
                                                             2013                                   2014

                                                                        Av. Net                     Av. TC    Av. Net
                                              No. of        Av. TC                  No. of
                                                                      TC/BB Rate                  Coverage TC/BB Rate
                                             vessels       Coverage                vessels
                                                                        ($/day)                  (whole year) ($/day)

      VLCC        DH                                 20         8%        39 800         20             5%     40 400
                  DH                                   7                                     9
    Suezmax
                  Newbuildings                         2
                  VLCC DH                              6       53 %                          6         53 %
      ITCL
                  Suezmax DH                           3      100 %                          3        100 %


                  VLCC DH                              8                                     8
    Com Mgt
                  Suezmax DH                           4                                     4


Total Fleet (ex. Newbuildings)                       48                                  50


Total Fleet (ex. Newbuildings, ITCL, Com Mgt)        27         6%        39 800         29             3%     40 400


Total Fleet (ex. Newbuildings, ITCL incl. Com Mgt)   39         4%                       41             2%


- The average TC coverage percentage is based on estimated total trading days
- TC-in vessels are assumed redelivered upon contract expiration


                                                                                                                 13
Market Update

          Earnings & Market Factors
          100 000
                                                         VLCC                                                    Q4 – Average Market earnings / Marex
                                                                                                             ■   VLCC (TD3)              : $9,000/day (current: $5/day)
           80 000
                                                                                                             ■   Suezmax (TD5)           : $11,500/day (current: 10,750/day)

           60 000

                                                                                                                 The Market:
$ / day


           40 000                                                                                            ■   IEA estimates world oil demand in the fourth quarter
                                                                                                                 averaged 91 mb/d in the fourth quarter, an increase of 0.8
                                                                                                                 mb/d compared to Q3. Parts of this increase might be
           20 000
                                                                                                                 “borrowed” demand from Q1 because of Chinese refinery
                                                                                                                 startups.
                0
                    Jan   Feb   Mar   Apr   May     June        July    Aug       Sept     Oct   Nov   Dec
                                                                                                             ■   High OPEC output through the first part of the quarter and
                                                                                                                 Chinese import with higher tonnage miles supported freight
                                                                                                                 rates
                                       Q4         2011          2012          Ave 2008 - 2012


          100 000
                                                    SUEZMAX
           90 000
                                                                                                             ■   Global refinery throughputs averaged 75.9 mb/d in Q4 with
           80 000
                                                                                                                 growth in activity concentrated in China, India and Russia.
           70 000                                                                                                Favorable refinery margins and cold snap in Asia supporting
           60 000
                                                                                                                 throughputs.
                                                                                                                 11 VLCC newbuilding and 14 Suezmax were delivered
$ / day


           50 000                                                                                            ■
           40 000
                                                                                                                 during the quarter
           30 000                                                                                            ■   6 VLCC and 8 Suezmax were removed during the quarter
           20 000

           10 000

               0
                    Jan   Feb   Mar   Apr   May     June        July    Aug      Sept      Oct   Nov   Dec

                                       Q4         2011           2012         Ave 2008 - 2012


                                                                                                                                                                     14
                                                                                                                  Source: MAREX, IEA. Graphs: Clarksons
Market Update

VLCC Fleet
                                 Fleet
 Current Fleet             622       Orderbook                       81
 DH Fleet                  605       Delivered 2012                  49
 SH (DS, DB, SS) Fleet      17       Estimated deliveries 2013       50


                     Current fleet & Orderbook                                           Delivery Schedule


                                                                                                        15
                                                        Source: Fearnleys January 2013
Market Update

Suezmax Fleet
                                                                    Fleet
Current Fleet                                     468                       Orderbook                                                                                          72
DH Fleet                                          463                       Delivered 2012                                                                                     47
SH (DS, DB, SS) Fleet                                5                      Estimated deliveries 2013                                                                          37


                                 Current fleet & Orderbook                                                                                                                           Delivery Schedule
80
                                                                                                                                                                               23
      # of vsls                                                                                                                                                            %
                                                                                                                                                                               20
                                                                                                                                                                               17
                                                                                                                                                                               14
                                                                                                                                                        55                     11
                                                                                                                            46                   47                            8
                                                                                                                                   38     35                          12
                                                                                       24     27    25     26   25                                              5              5
                                                         20         22           23
                                                              15           17
                           7     8     8      8     11                                                                14                                                       2
 0                        1                         -6   -6                                         -4     -6               -4            -6                                   -1
                          -12    -13   -9     -10                                                                                  -12                  -9
                                                                                 -15   -15    -15               -17   -18                        -17
                                                                    -20
                                                              -26          -29                                                                                                 -4
                                                                                                                                                                               -7
                                                                                                                                                                               -10
                                                                                                                                                                               -13
                                                                                                                                                                               -16
                                                                                                                                                                               -19
         1988


                  1990


                          1993


                                       1995


                                                                    2000


                                                                                                    2005


                                                                                                                            2009
                                                                                                                                   2010
                                                                                                                                          2011
                                                                                                                                                 2012
                                                                                                                                                        2013
                                                                                                                                                               2014
                                                                                                                                                                      2015
                                                                                                                                                                               -22
-80                                                                                                                                                                            -25


            FRO Assumptions on Phase Out / Deletions                                         Suezmax Deletions
            Orderbook                                                                        Suezmax DH


                                                                                                                                                                                                    16
                                                                                                                            Source: Fearnleys January 2013
M USD


                                                               50
                                                                    60
                                                                           70
                                                                                  80
                                                                                          90
                                                                                                100
                                                                                                           110
                                                                                                                  120
                                                                                                                                 130
                                                                                                                                       140
                                                                                                                                                      150
                                                                                                                                                            160
                                                                                                                                                                       170
                                                                                                                                                                             180
                                                     2006-02
                                                     2006-06
                                                     2006-10
                                                     2007-02


                                       VLCC NB
                                                                                                                                                                                                     Rates
                                                     2007-06
                                                                                                                                                                                                             Market Update


                                                     2007-10
                                                     2008-02
                                                     2008-06
                                                     2008-10
                                                     2009-02


                                       SMAX NB
                                                     2009-06
                                                     2009-10
                                                     2010-02
                                                     2010-06
                                                     2010-10
                                                                                                                                                                                       NEWBUILDING


                                                     2011-02
                                                     2011-06
                                                     2011-10
                                                     2012-02
                                                     2012-06
                                                     2012-10
                                                     2013-02


                                                                                                $ / DAY


                                                           10 000
                                                                                       30 000
                                                                                                                        50 000
                                                                                                                                                              70 000


                                                                         20 000
                                                                                                      40 000
                                                                                                                                             60 000
                                                                                                                                                                              80 000


                                                 0
                                    Feb-06
                                    Jun-06
                                    Oct-06
                                    Feb-07


Source: Clarksons
                                    Jun-07
                                    Oct-07
                                    Feb-08
                    3Y TC VLCC      Jun-08
                                    Oct-08
                                    Feb-09
                                    Jun-09
                                    Oct-09
                                    Feb-10
                                    Jun-10
                                                                                                                                                                                       TC MARKET


                                    Oct-10
                                    Feb-11
                    3Y TC SUEZMAX


                                    Jun-11
                                    Oct-11
                                    Feb-12
                                    Jun-12
                                    Oct-12
               17


                                    Feb-13
Market Update

    Outlook
    General                                                      Frontline
■   Market at rock bottom                                    ■   Reducing fleet:
■   Increased technical issues on ships observed in market         -   Continue to redeliver older and non core chartered
       –   less maintenance of ships                                   in tonnage

■   Last year with big newbuilding program                   ■   Outperformed our peers on VLCC’s and Suezmax earnings

■   Increased tonnage demand but not enough to offset        ■   Frontline will continue to remain cautious and focus its
    newbuilding program                                          resources on the present activities until a clearer sign of
                                                                 recovery can be seen in the tanker market
■   Some more interest in scrapping


                                                                                                                      18
Q   uestions?


                19

Frontline Q4 2012 results presentation

  • 1.
    Q4 2012 Results February 22, 1 2013
  • 2.
    Forward looking statements MATTERSDISCUSSED IN THIS DOCUMENT MAY CONSTITUTE FORWARD-LOOKING STATEMENTS. THE PRIVATE SECURITIES LITIGATION REFORM ACT OF 1995 PROVIDES SAFE HARBOR PROTECTIONS FOR FORWARD-LOOKING STATEMENTS IN ORDER TO ENCOURAGE COMPANIES TO PROVIDE PROSPECTIVE INFORMATION ABOUT THEIR BUSINESS. FORWARD-LOOKING STATEMENTS INCLUDE STATEMENTS CONCERNING PLANS, OBJECTIVES, GOALS, STRATEGIES, FUTURE EVENTS OR PERFORMANCE, AND UNDERLYING ASSUMPTIONS AND OTHER STATEMENTS, WHICH ARE OTHER THAN STATEMENTS OF HISTORICAL FACTS. FRONTLINE DESIRES TO TAKE ADVANTAGE OF THE SAFE HARBOR PROVISIONS OF THE PRIVATE SECURITIES LITIGATION REFORM ACT OF 1995 AND IS INCLUDING THIS CAUTIONARY STATEMENT IN CONNECTION WITH THIS SAFE HARBOR LEGISLATION. THE WORDS “BELIEVE,” “ANTICIPATE,” “INTENDS,” “ESTIMATE,” “FORECAST,” “PROJECT,” “PLAN,” “POTENTIAL,” “WILL,” “MAY,” “SHOULD,” “EXPECT” “PENDING” AND SIMILAR EXPRESSIONS IDENTIFY FORWARD-LOOKING STATEMENTS. THE FORWARD-LOOKING STATEMENTS IN THIS DOCUMENT ARE BASED UPON VARIOUS ASSUMPTIONS, MANY OF WHICH ARE BASED, IN TURN, UPON FURTHER ASSUMPTIONS, INCLUDING WITHOUT LIMITATION, MANAGEMENT'S EXAMINATION OF HISTORICAL OPERATING TRENDS, DATA CONTAINED IN FRONTLINE’S RECORDS AND OTHER DATA AVAILABLE FROM THIRD PARTIES. ALTHOUGH FRONTLINE BELIEVES THAT THESE ASSUMPTIONS WERE REASONABLE WHEN MADE, BECAUSE THESE ASSUMPTIONS ARE INHERENTLY SUBJECT TO SIGNIFICANT UNCERTAINTIES AND CONTINGENCIES WHICH ARE DIFFICULT OR IMPOSSIBLE TO PREDICT AND ARE BEYOND FRONTLINE’S CONTROL, YOU CANNOT BE ASSURED THAT FRONTLINE WILL ACHIEVE OR ACCOMPLISH THESE EXPECTATIONS, BELIEFS OR PROJECTIONS. FRONTLINE UNDERTAKES NO DUTY TO UPDATE ANY FORWARD-LOOKING STATEMENT TO CONFORM THE STATEMENT TO ACTUAL RESULTS OR CHANGES IN EXPECTATIONS. IMPORTANT FACTORS THAT, IN FRONTLINE’S VIEW, COULD CAUSE ACTUAL RESULTS TO DIFFER MATERIALLY FROM THOSE DISCUSSED IN THE FORWARD-LOOKING STATEMENTS INCLUDE, WITHOUT LIMITATION: THE STRENGTH OF WORLD ECONOMIES AND CURRENCIES, GENERAL MARKET CONDITIONS, INCLUDING FLUCTUATIONS IN CHARTERHIRE RATES AND VESSEL VALUES, CHANGES IN DEMAND IN THE TANKER MARKET, INCLUDING BUT NOT LIMITED TO CHANGES IN OPEC'S PETROLEUM PRODUCTION LEVELS AND WORLD WIDE OIL CONSUMPTION AND STORAGE, CHANGES IN FRONTLINE’S OPERATING EXPENSES, INCLUDING BUNKER PRICES, DRYDOCKING AND INSURANCE COSTS, THE MARKET FOR FRONTLINE’S VESSELS, AVAILABILITY OF FINANCING AND REFINANCING, ABILITY TO COMPLY WITH COVENANTS IN SUCH FINANCING ARRANGEMENTS, FAILURE OF COUNTERPARTIES TO FULLY PERFORM THEIR CONTRACTS WITH US, CHANGES IN GOVERNMENTAL RULES AND REGULATIONS OR ACTIONS TAKEN BY REGULATORY AUTHORITIES, POTENTIAL LIABILITY FROM PENDING OR FUTURE LITIGATION, GENERAL DOMESTIC AND INTERNATIONAL POLITICAL CONDITIONS, POTENTIAL DISRUPTION OF SHIPPING ROUTES DUE TO ACCIDENTS OR POLITICAL EVENTS, VESSEL BREAKDOWNS, INSTANCES OF OFF-HIRE AND OTHER IMPORTANT FACTORS. FOR A MORE COMPLETE DISCUSSION OF THESE AND OTHER RISKS AND UNCERTAINTIES ASSOCIATED WITH FRONTLINE’S BUSINESS, PLEASE REFER TO FRONTLINE’S FILINGS WITH THE SECURITIES AND EXCHANGE COMMISSION, INCLUDING, BUT NOT LIMITED TO, ITS ANNUAL REPORT ON FORM 20-F. THIS PRESENTATION IS NOT AN OFFER TO PURCHASE OR SELL, OR A SOLICITATION OF AN OFFER TO PURCHASE OR SELL, ANY SECURITIES OF FRONTLINE. 2
  • 3.
    Agenda ■ Fourth Quarter2012 Highlights and Transactions ■ Financial Review ■ Newbuildings ■ Market Update ■ Outlook ■ Q & A 3
  • 4.
    Fourth Quarter 2012 Highlightsand Transactions ■ The company terminated a number of vessels in the recent period: ■ The OBO carriers Front Climber and Front Driver in October and November ■ The VLCC Ticen Ocean in November, 2012. Recognized a gain of $11.2m ■ The VLCC Titan Aries in January, 2013. Expects to recognize a gain of $7.5m in Q1-13. ■ The Suezmax Front Pride in February, 2013. Recorded an impairment loss of $4.7m in Q4-12. ■ Agreed to an early termination of the TC-out contracts on the OBO carriers Front Viewer and Front Guider in December. ■ Received compensation for loss of hire of $35m ■ Paid $23.5m in compensation to SFL as the long term charter parties on the vessels were terminated. ■ Re-delivered the chartered-in VLCC Gulf Eyadah in December 4
  • 5.
    Fourth Quarter 2012 FinancialHighlights -16.6 -49.0 7.2 -35.2 15.5 0 -100 Q4 - 2012 results -82.8 -24.3 -200 -166.2 ■ Net loss: $16.9m ■ Net loss per share: $0.21 -300 -343.7 -400 Preliminary full year 2012 results -500 -529.6 ■ Net loss: $82.8m -600 FY Q4 Q3 Q2 Q1 FY Q4 Q3 Q2 Q1 ■ Net loss per share: $1.06 2012 2011 Net Income/loss ex sales ($million) Sales profit/loss ($million) No dividend declared in Q4-2012 1.00 0.20 -0.21 -0.31 0.09 0.12 0.02 0.10 0.00 -1.00 -0.63 Share price NYSE February 21, 2013: $2.90 -1.06 -0.45 -2.00 -2.13 – Market cap: $226m -3.00 -4.00 -4.41 -5.00 -6.00 -7.00 -6.80 -8.00 FY Q4 Q3 Q2 Q1 FY Q4 Q3 Q2 Q1 2012 2011 EPS ($) Dividend per share reported ($) 5
  • 6.
    Financial Review Income Statement 2011 2012 CONDENSED CONSOLIDATED INCOME STATEMENTS 2012 2011 Oct-Dec Oct-Dec (in thousands of $) Jan-Dec Jan-Dec 181,981 197,436 Total operating revenues 668,107 810,102 (312,878) (2,560) Gain (loss) on sale of assets and amortization of deferred gains 16,813 (307,894) 67,673 84,607 Voyage expenses and commission 274,132 295,787 (347) - Profit share expense (income) - 482 - 11,981 Contingent rental expense 54,612 - 39,098 29,174 Ship operating expenses 130,685 187,010 14,758 6,362 Charter hire expenses 37,461 65,601 9,397 9,205 Administrative expenses 33,906 35,886 - 18,901 Impairment loss on vessels 32,042 121,443 44,057 27,953 Depreciation 114,845 195,597 174,636 188,183 Total operating expenses 677,683 901,806 (305,533) 6,693 Net operating gain (loss) 7,723 (399,598) 29 40 Interest income 130 3,958 (37,188) (23,149) Interest expense (94,962) (141,497) (189) (171) Share of results from associated companies (4) (600) (65) (16) Foreign currency exchange gain (loss) 84 106 (816) (198) Other non-operating items 4,119 9,153 (343,762) (16,801) Net loss before taxes and non controlling interest (83,396) (528,478) (349) (122) Taxes (379) (532) 445 357 Net loss (income) attributable to non controlling interest 1,021 (591) (343,666) (16,566) Net loss attributable to Frontline Ltd. (82,754) (529,601) (4.41) (0.21) Basic loss per share attributable to Frontline Ltd. ($) (1.06) (6.8) 6
  • 7.
    Financial Review Incomeon time charter basis 2012 2011 $/day FY Q4 Q3 Q2 Q1 FY Q4 Q3 Q2 Q1 VLCC Spot DH 22 400 18 500 13 300 31 500 25 400 20 200 16 800 12 600 23 900 27 400 VLCC w hole fleet 22 200 19 300 12 300 31 000 25 600 22 800 19 100 17 000 26 100 28 600 Suezm ax Spot DH 15 200 14 000 10 500 16 200 19 500 12 600 12 400 7 800 14 500 16 000 Orion Suezmax pool 15 500 9 000 11 100 17 400 19 200 13 600 12 000 7 600 16 200 17 700 OBO 33 600 35 100 33 700 28 100 37 800 36 700 41 600 38 200 31 300 36 300 7
  • 8.
    Financial Review Shipoperating expenses/Off-hire Total fleet opex ($/day) Number of vessels drydocked 13 000 12 11 800 10 12 000 10 9 11 100 11 000 10 400 10 800 10 200 8 9 700 9 900 10 000 9 000 9 2009 300 6 5 9 000 4 4 3 3 8 000 2 2 1 1 7 000 6 000 0 FY Q4 Q3 Q2 Q1 FY Q4 Q3 Q2 Q1 FY Q4 Q3 Q2 Q1 FY Q4 Q3 Q2 Q1 2012 2011 2012 2011 Off hire (days) 800 700 677  Tentative drydock schedule/no. of vessels 600 500 – Q1-2013: 3 VLCCs 368 400 300 211 221 200 144 141 159 86 100 42 41 0 FY Q4 Q3 Q2 Q1 FY Q4 Q3 Q2 Q1 2012 2011 8
  • 9.
    Financial Review Balance Sheet Balance sheet (in $ million) 2012 2012 2011 Dec 31 Sept 30 Dec 31 Cash 138 165 161 Restricted cash 88 76 101 Other Current assets 167 149 149 Long term assets: Vessels 1 176 1 222 1 334 Newbuildings 27 20 13 Other long term assets 93 94 83 Total assets 1 688 1 726 1 841 Current liabilities 187 191 167 Long term liabilities 1 370 1 387 1 460 Noncontrolling interest 11 12 12 Frontline Ltd. stockholders' equity 120 136 201 Total liabilities and stockholders' equity 1 688 1 726 1 841 9
  • 10.
    Financial Review Cash Cost Breakeven Estimated Cash cost breakeven rates for the remainder of 2013 ($/day) VLCC 24,200 Suezmax 18,800 Comments to B/E rates: – Included in cash B/E rates are: BB hire, opex , interest and admin. expenses – B/E rates exclude vessels on short term TC-in, vessels on BB-out, capex. and ITCL vessels 10
  • 11.
    Newbuilding Newbuilding Overview ■ Total newbuilding program as of December 31, 2012: – Two Suezmax tankers – Remaining installments to be paid approx. $87.9m 11
  • 12.
    Corporate Overview Frontline Fleet Incl. vessels on commercial management & ITCL, excl. newbuildings Suezmax DH 14 VLCC DH 34 Total: 48 As per 21 February DH: Double Hull 12
  • 13.
    Corporate Overview Frontline Fleet 2013 2014 Av. Net Av. TC Av. Net No. of Av. TC No. of TC/BB Rate Coverage TC/BB Rate vessels Coverage vessels ($/day) (whole year) ($/day) VLCC DH 20 8% 39 800 20 5% 40 400 DH 7 9 Suezmax Newbuildings 2 VLCC DH 6 53 % 6 53 % ITCL Suezmax DH 3 100 % 3 100 % VLCC DH 8 8 Com Mgt Suezmax DH 4 4 Total Fleet (ex. Newbuildings) 48 50 Total Fleet (ex. Newbuildings, ITCL, Com Mgt) 27 6% 39 800 29 3% 40 400 Total Fleet (ex. Newbuildings, ITCL incl. Com Mgt) 39 4% 41 2% - The average TC coverage percentage is based on estimated total trading days - TC-in vessels are assumed redelivered upon contract expiration 13
  • 14.
    Market Update Earnings & Market Factors 100 000 VLCC Q4 – Average Market earnings / Marex ■ VLCC (TD3) : $9,000/day (current: $5/day) 80 000 ■ Suezmax (TD5) : $11,500/day (current: 10,750/day) 60 000 The Market: $ / day 40 000 ■ IEA estimates world oil demand in the fourth quarter averaged 91 mb/d in the fourth quarter, an increase of 0.8 mb/d compared to Q3. Parts of this increase might be 20 000 “borrowed” demand from Q1 because of Chinese refinery startups. 0 Jan Feb Mar Apr May June July Aug Sept Oct Nov Dec ■ High OPEC output through the first part of the quarter and Chinese import with higher tonnage miles supported freight rates Q4 2011 2012 Ave 2008 - 2012 100 000 SUEZMAX 90 000 ■ Global refinery throughputs averaged 75.9 mb/d in Q4 with 80 000 growth in activity concentrated in China, India and Russia. 70 000 Favorable refinery margins and cold snap in Asia supporting 60 000 throughputs. 11 VLCC newbuilding and 14 Suezmax were delivered $ / day 50 000 ■ 40 000 during the quarter 30 000 ■ 6 VLCC and 8 Suezmax were removed during the quarter 20 000 10 000 0 Jan Feb Mar Apr May June July Aug Sept Oct Nov Dec Q4 2011 2012 Ave 2008 - 2012 14 Source: MAREX, IEA. Graphs: Clarksons
  • 15.
    Market Update VLCC Fleet Fleet Current Fleet 622 Orderbook 81 DH Fleet 605 Delivered 2012 49 SH (DS, DB, SS) Fleet 17 Estimated deliveries 2013 50 Current fleet & Orderbook Delivery Schedule 15 Source: Fearnleys January 2013
  • 16.
    Market Update Suezmax Fleet Fleet Current Fleet 468 Orderbook 72 DH Fleet 463 Delivered 2012 47 SH (DS, DB, SS) Fleet 5 Estimated deliveries 2013 37 Current fleet & Orderbook Delivery Schedule 80 23 # of vsls % 20 17 14 55 11 46 47 8 38 35 12 24 27 25 26 25 5 5 20 22 23 15 17 7 8 8 8 11 14 2 0 1 -6 -6 -4 -6 -4 -6 -1 -12 -13 -9 -10 -12 -9 -15 -15 -15 -17 -18 -17 -20 -26 -29 -4 -7 -10 -13 -16 -19 1988 1990 1993 1995 2000 2005 2009 2010 2011 2012 2013 2014 2015 -22 -80 -25 FRO Assumptions on Phase Out / Deletions Suezmax Deletions Orderbook Suezmax DH 16 Source: Fearnleys January 2013
  • 17.
    M USD 50 60 70 80 90 100 110 120 130 140 150 160 170 180 2006-02 2006-06 2006-10 2007-02 VLCC NB Rates 2007-06 Market Update 2007-10 2008-02 2008-06 2008-10 2009-02 SMAX NB 2009-06 2009-10 2010-02 2010-06 2010-10 NEWBUILDING 2011-02 2011-06 2011-10 2012-02 2012-06 2012-10 2013-02 $ / DAY 10 000 30 000 50 000 70 000 20 000 40 000 60 000 80 000 0 Feb-06 Jun-06 Oct-06 Feb-07 Source: Clarksons Jun-07 Oct-07 Feb-08 3Y TC VLCC Jun-08 Oct-08 Feb-09 Jun-09 Oct-09 Feb-10 Jun-10 TC MARKET Oct-10 Feb-11 3Y TC SUEZMAX Jun-11 Oct-11 Feb-12 Jun-12 Oct-12 17 Feb-13
  • 18.
    Market Update Outlook General Frontline ■ Market at rock bottom ■ Reducing fleet: ■ Increased technical issues on ships observed in market - Continue to redeliver older and non core chartered – less maintenance of ships in tonnage ■ Last year with big newbuilding program ■ Outperformed our peers on VLCC’s and Suezmax earnings ■ Increased tonnage demand but not enough to offset ■ Frontline will continue to remain cautious and focus its newbuilding program resources on the present activities until a clearer sign of recovery can be seen in the tanker market ■ Some more interest in scrapping 18
  • 19.
    Q uestions? 19