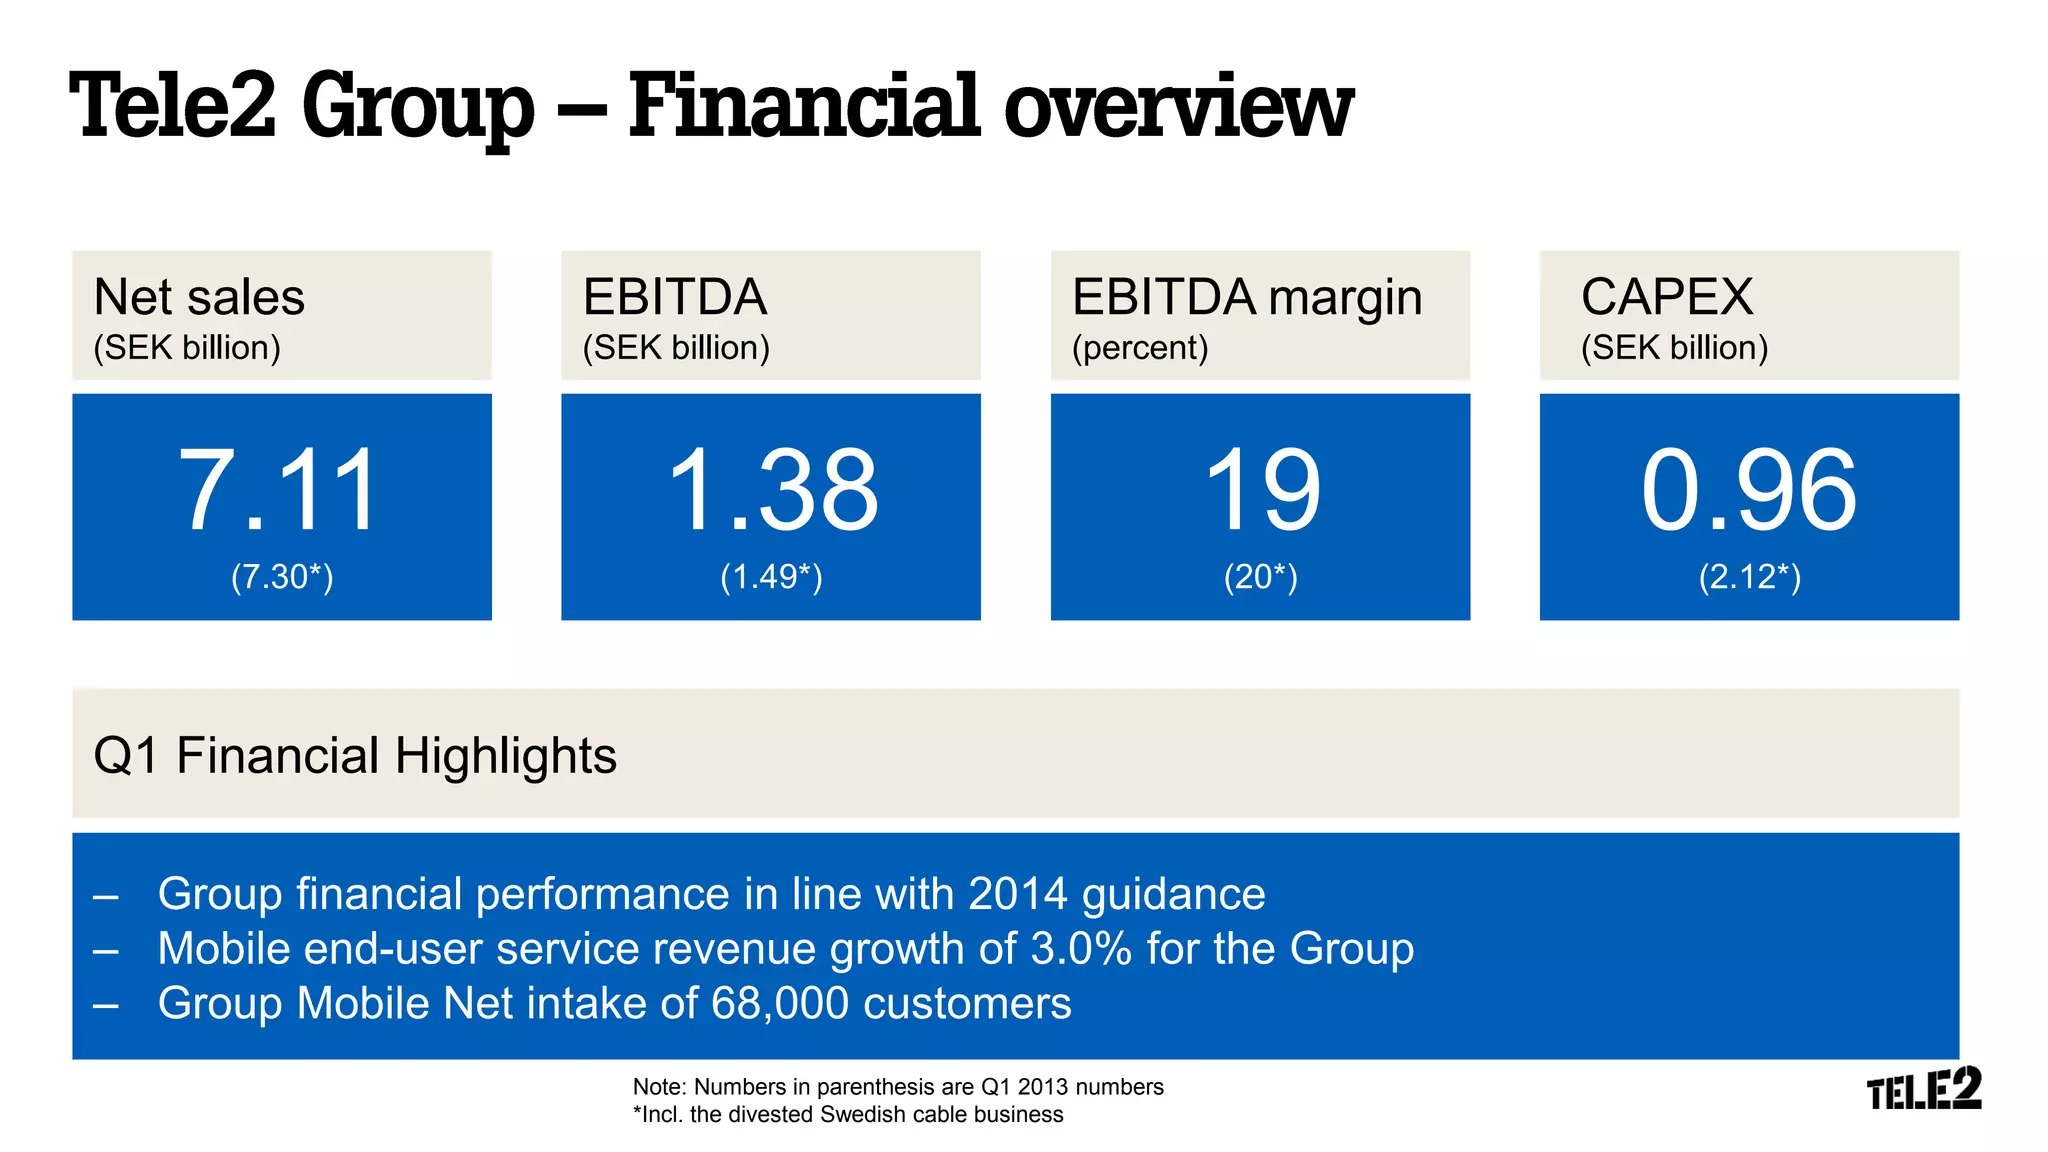
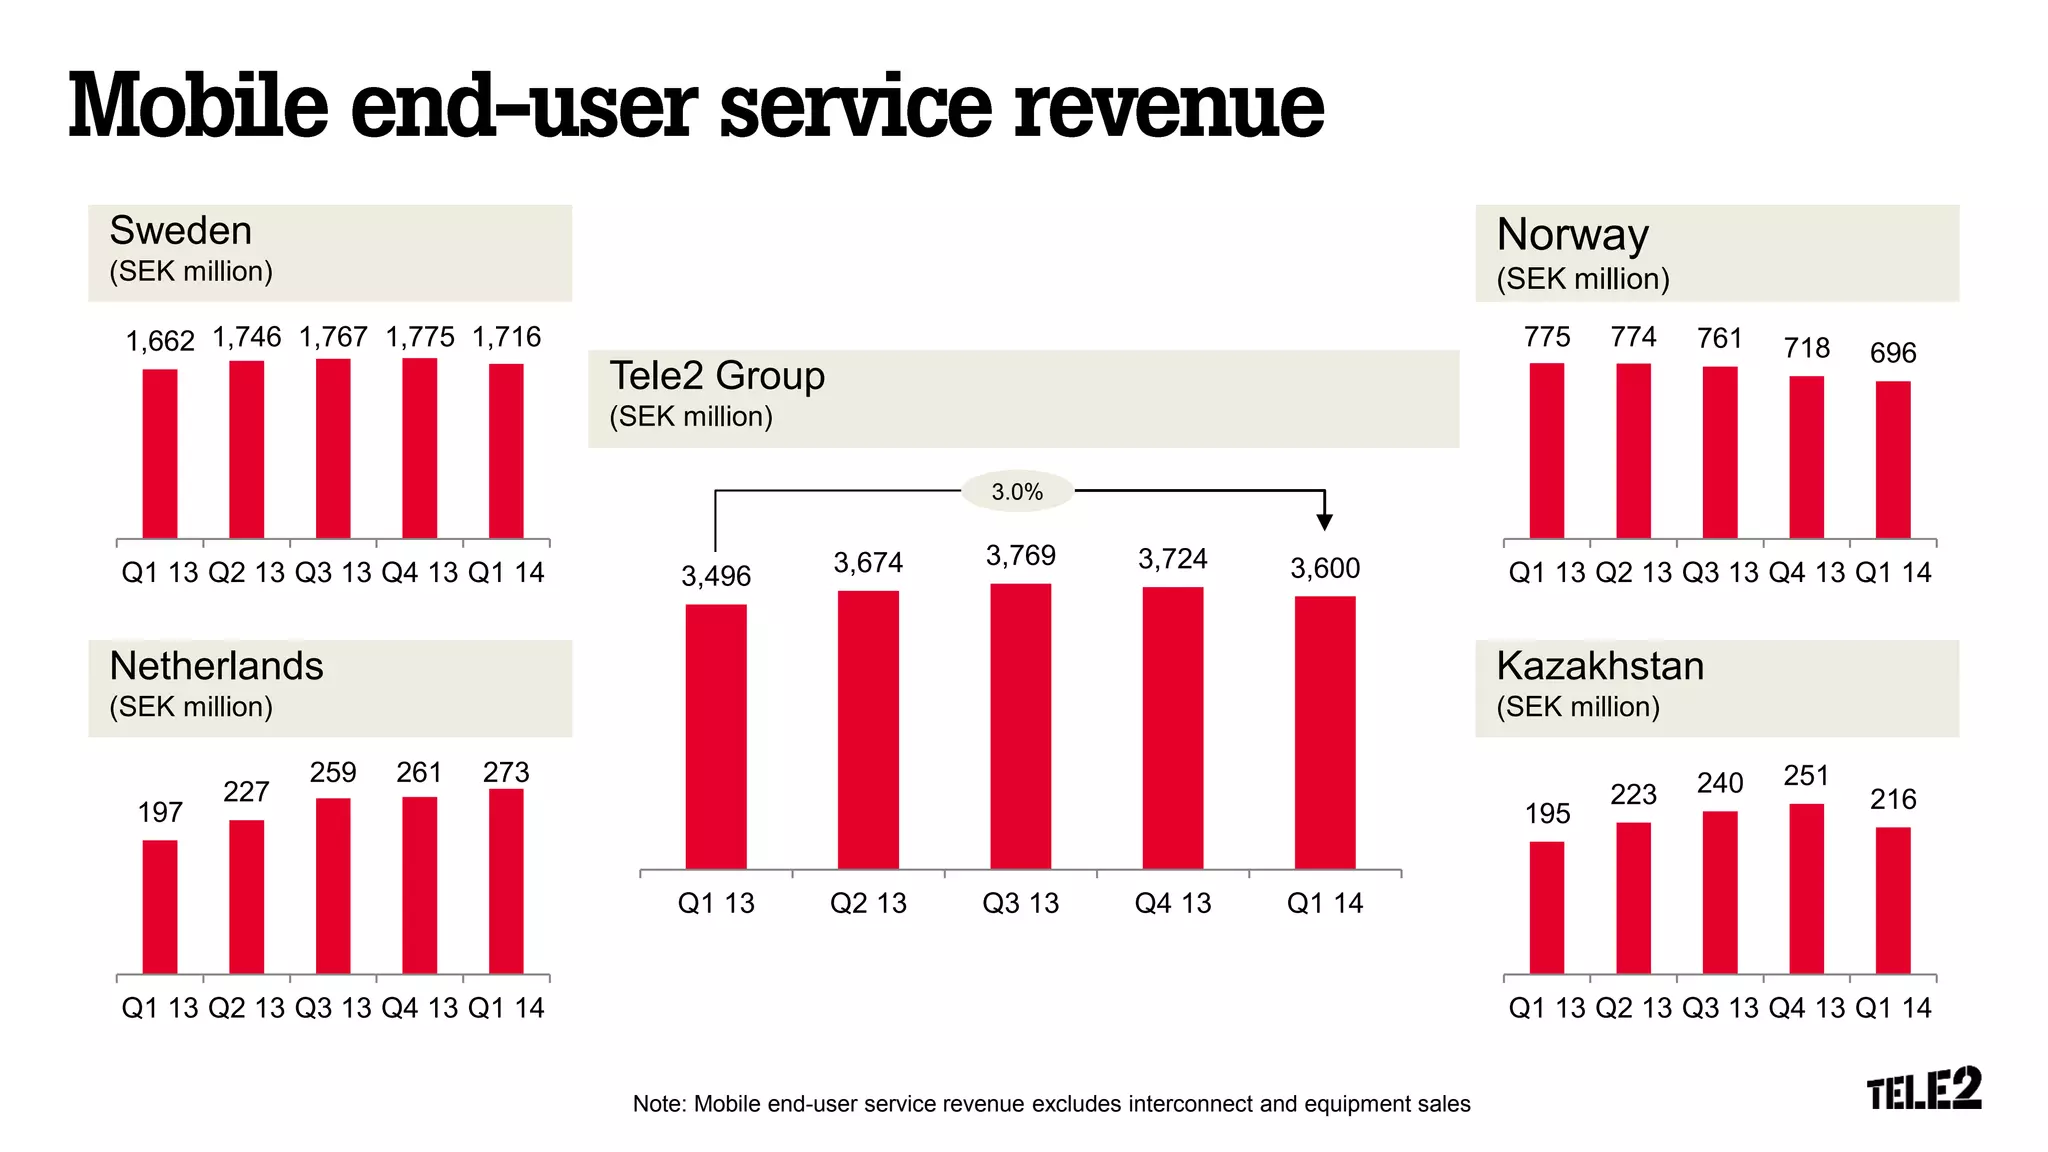
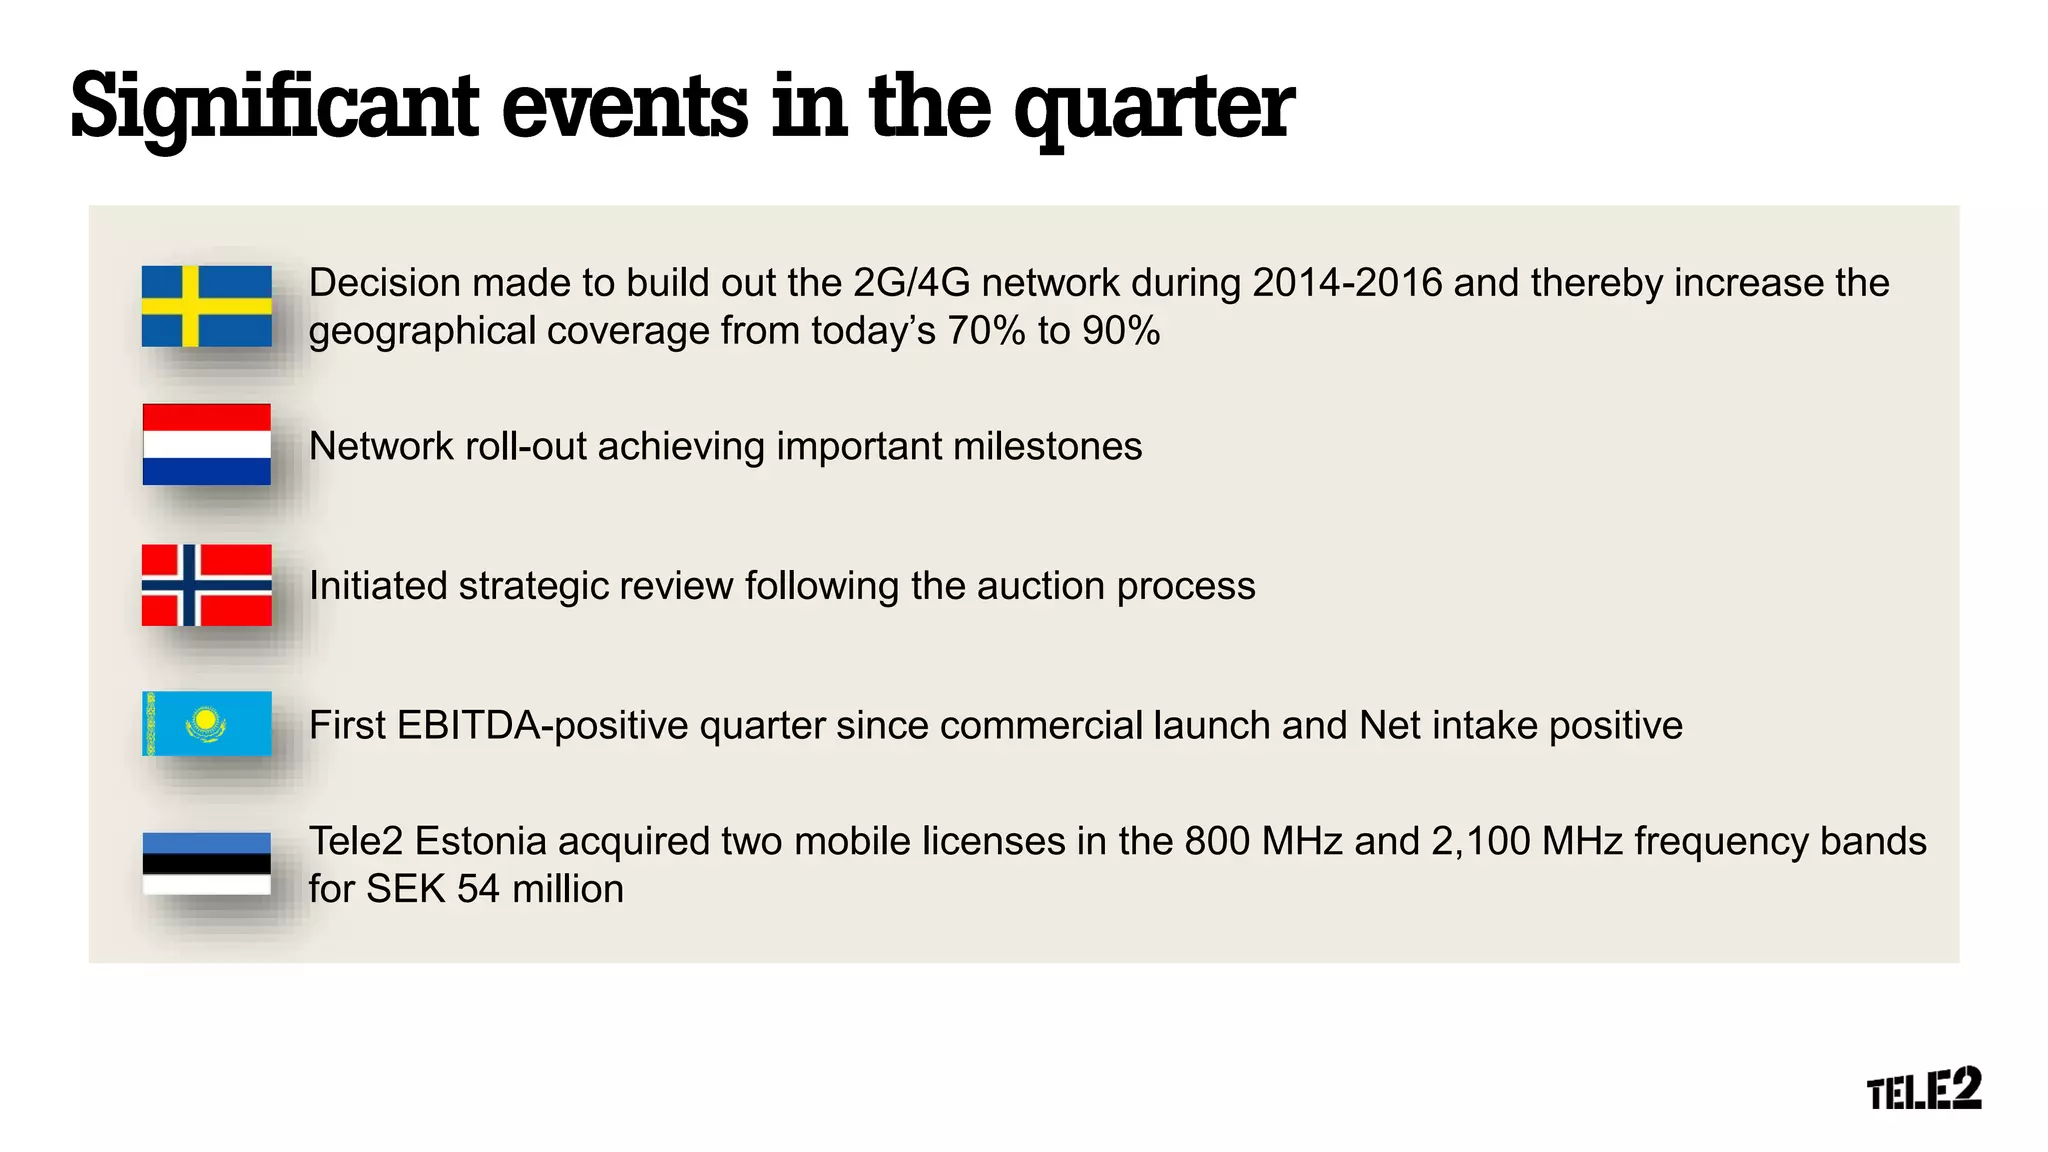
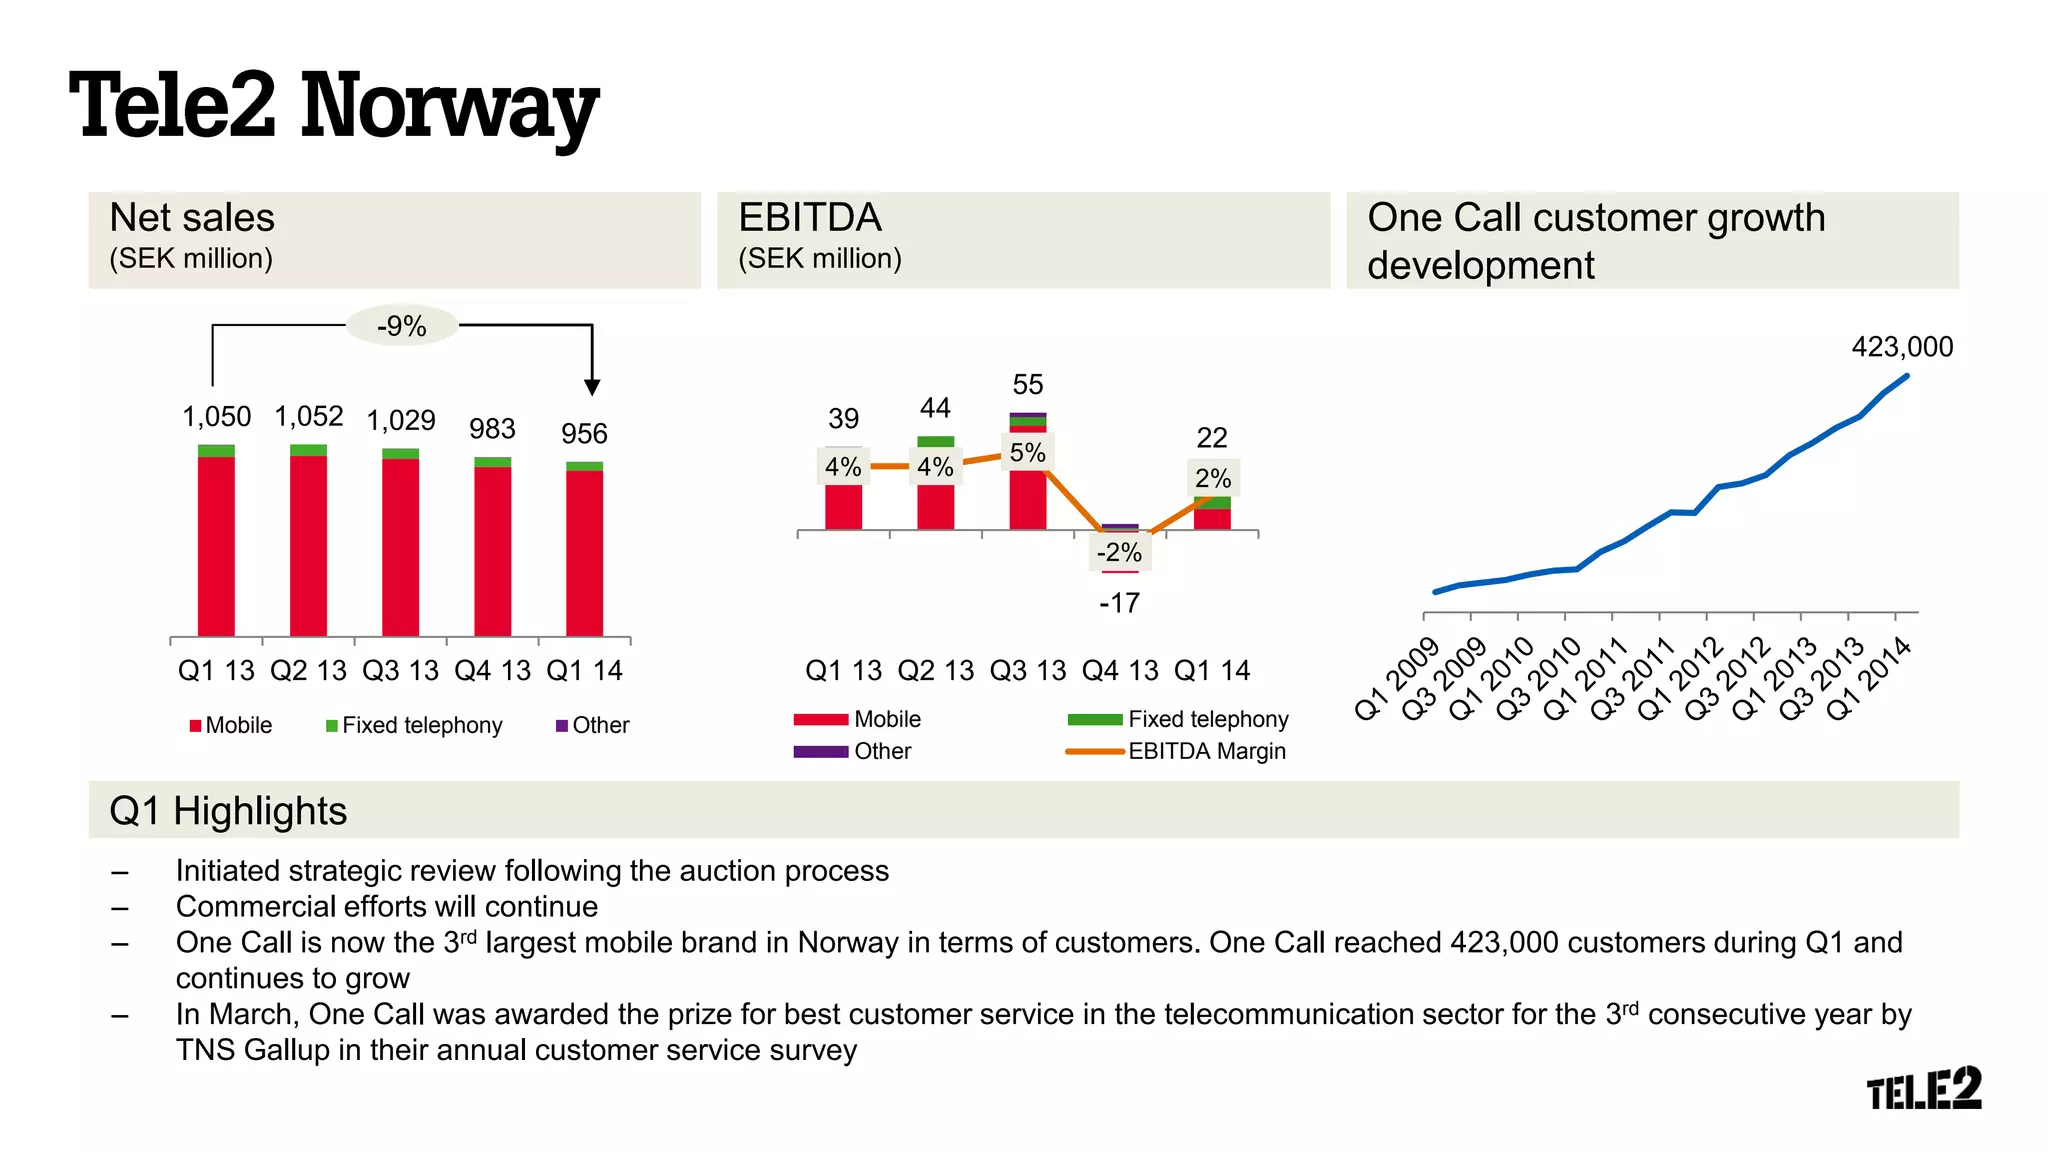
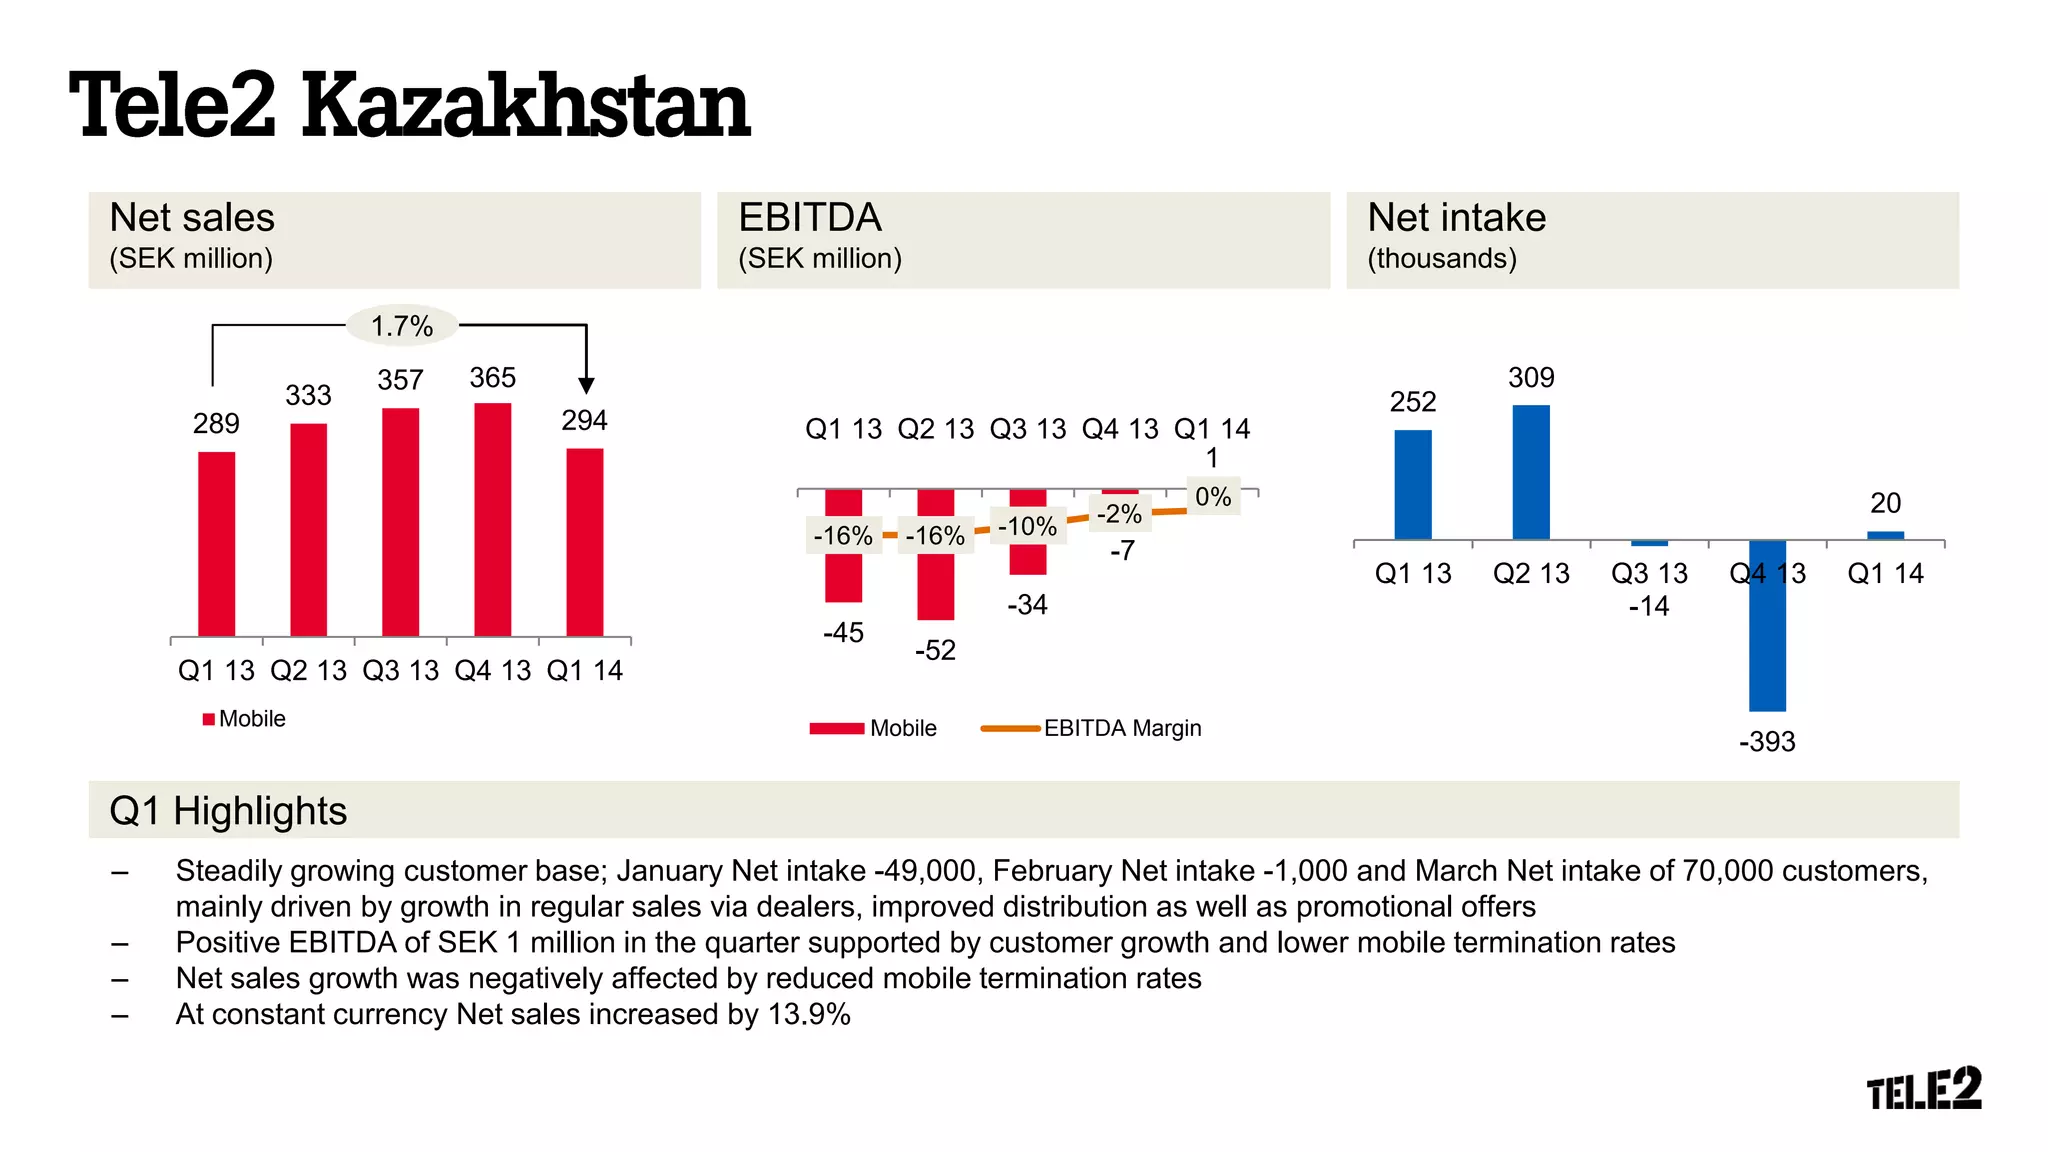
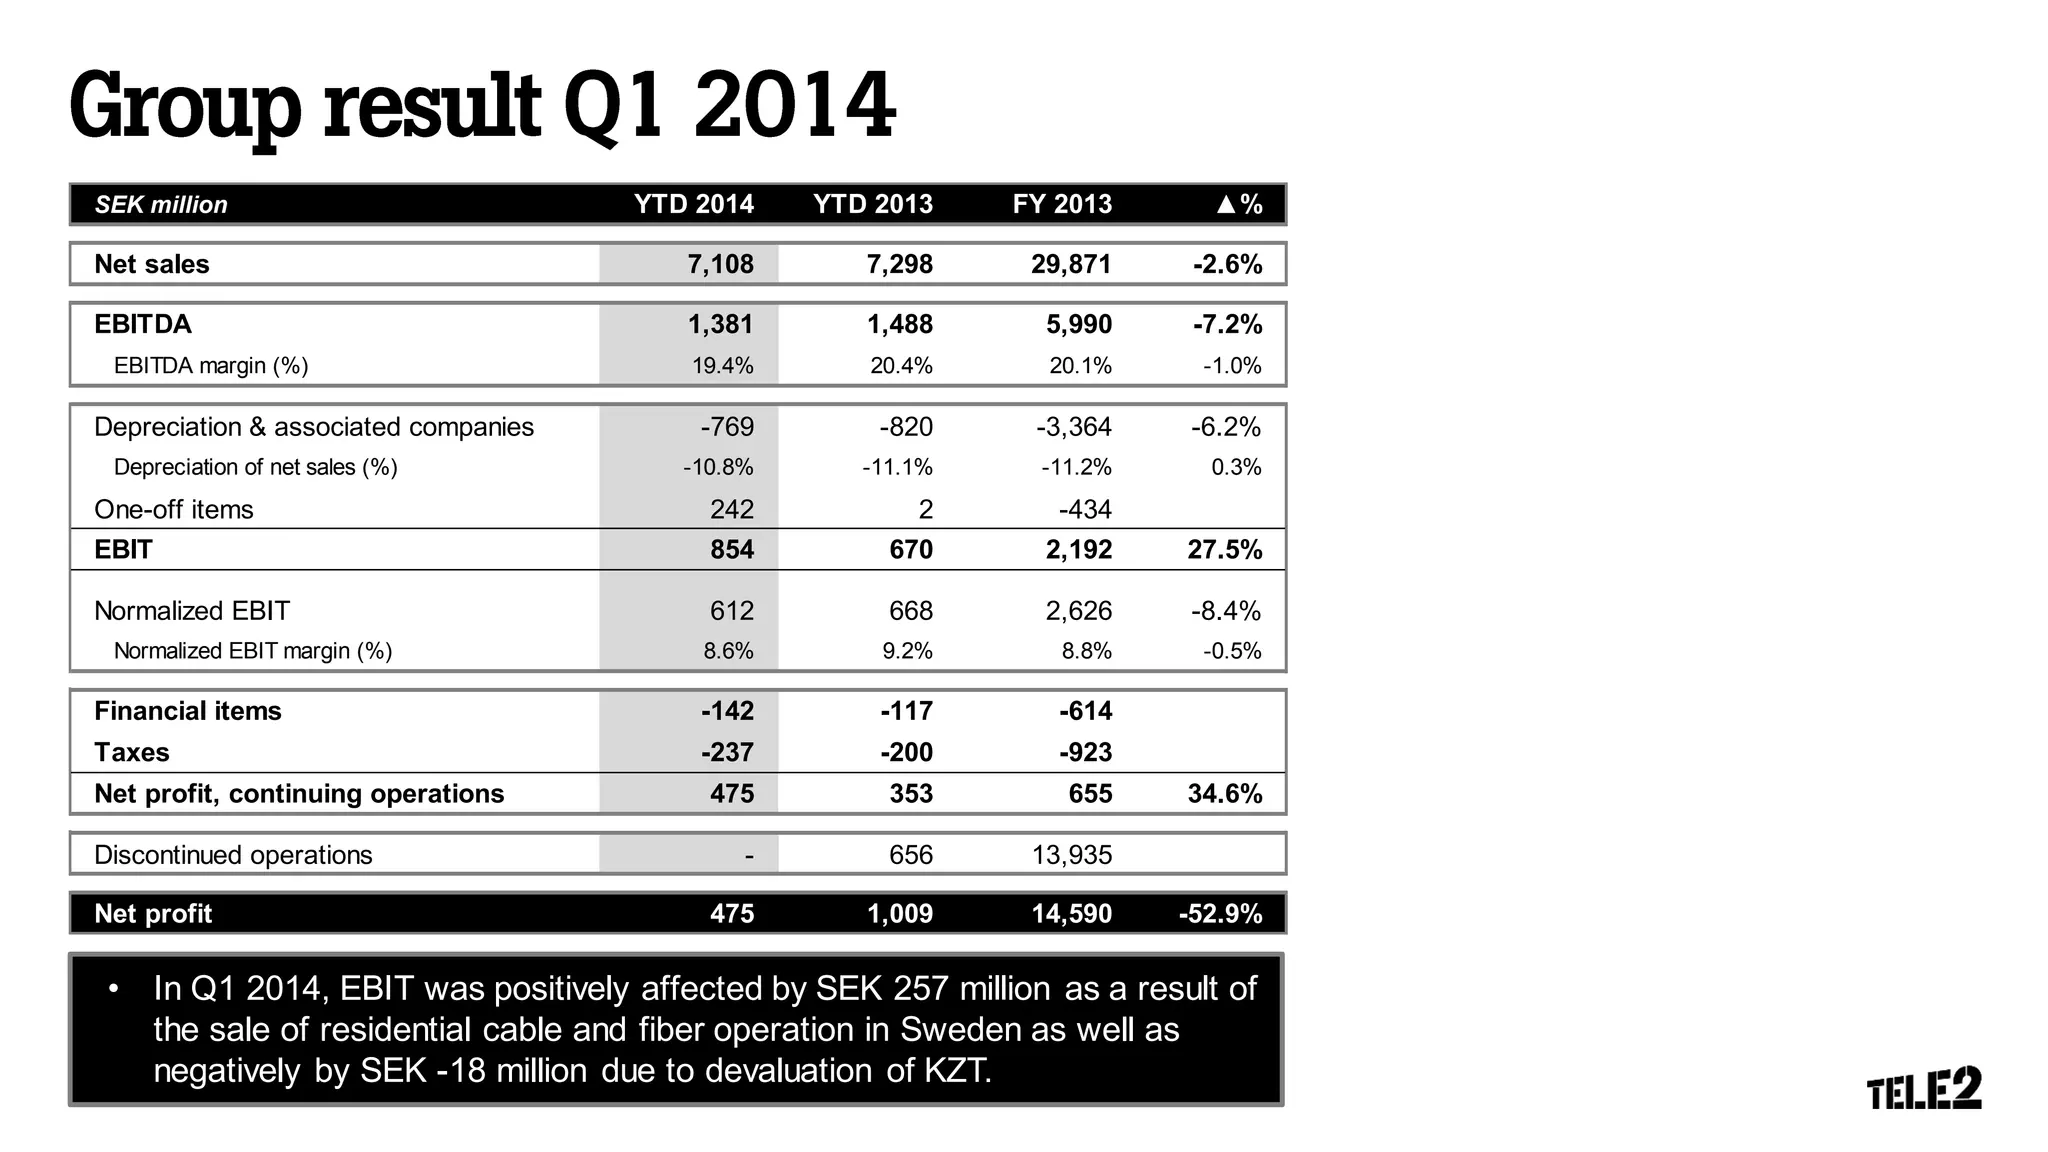
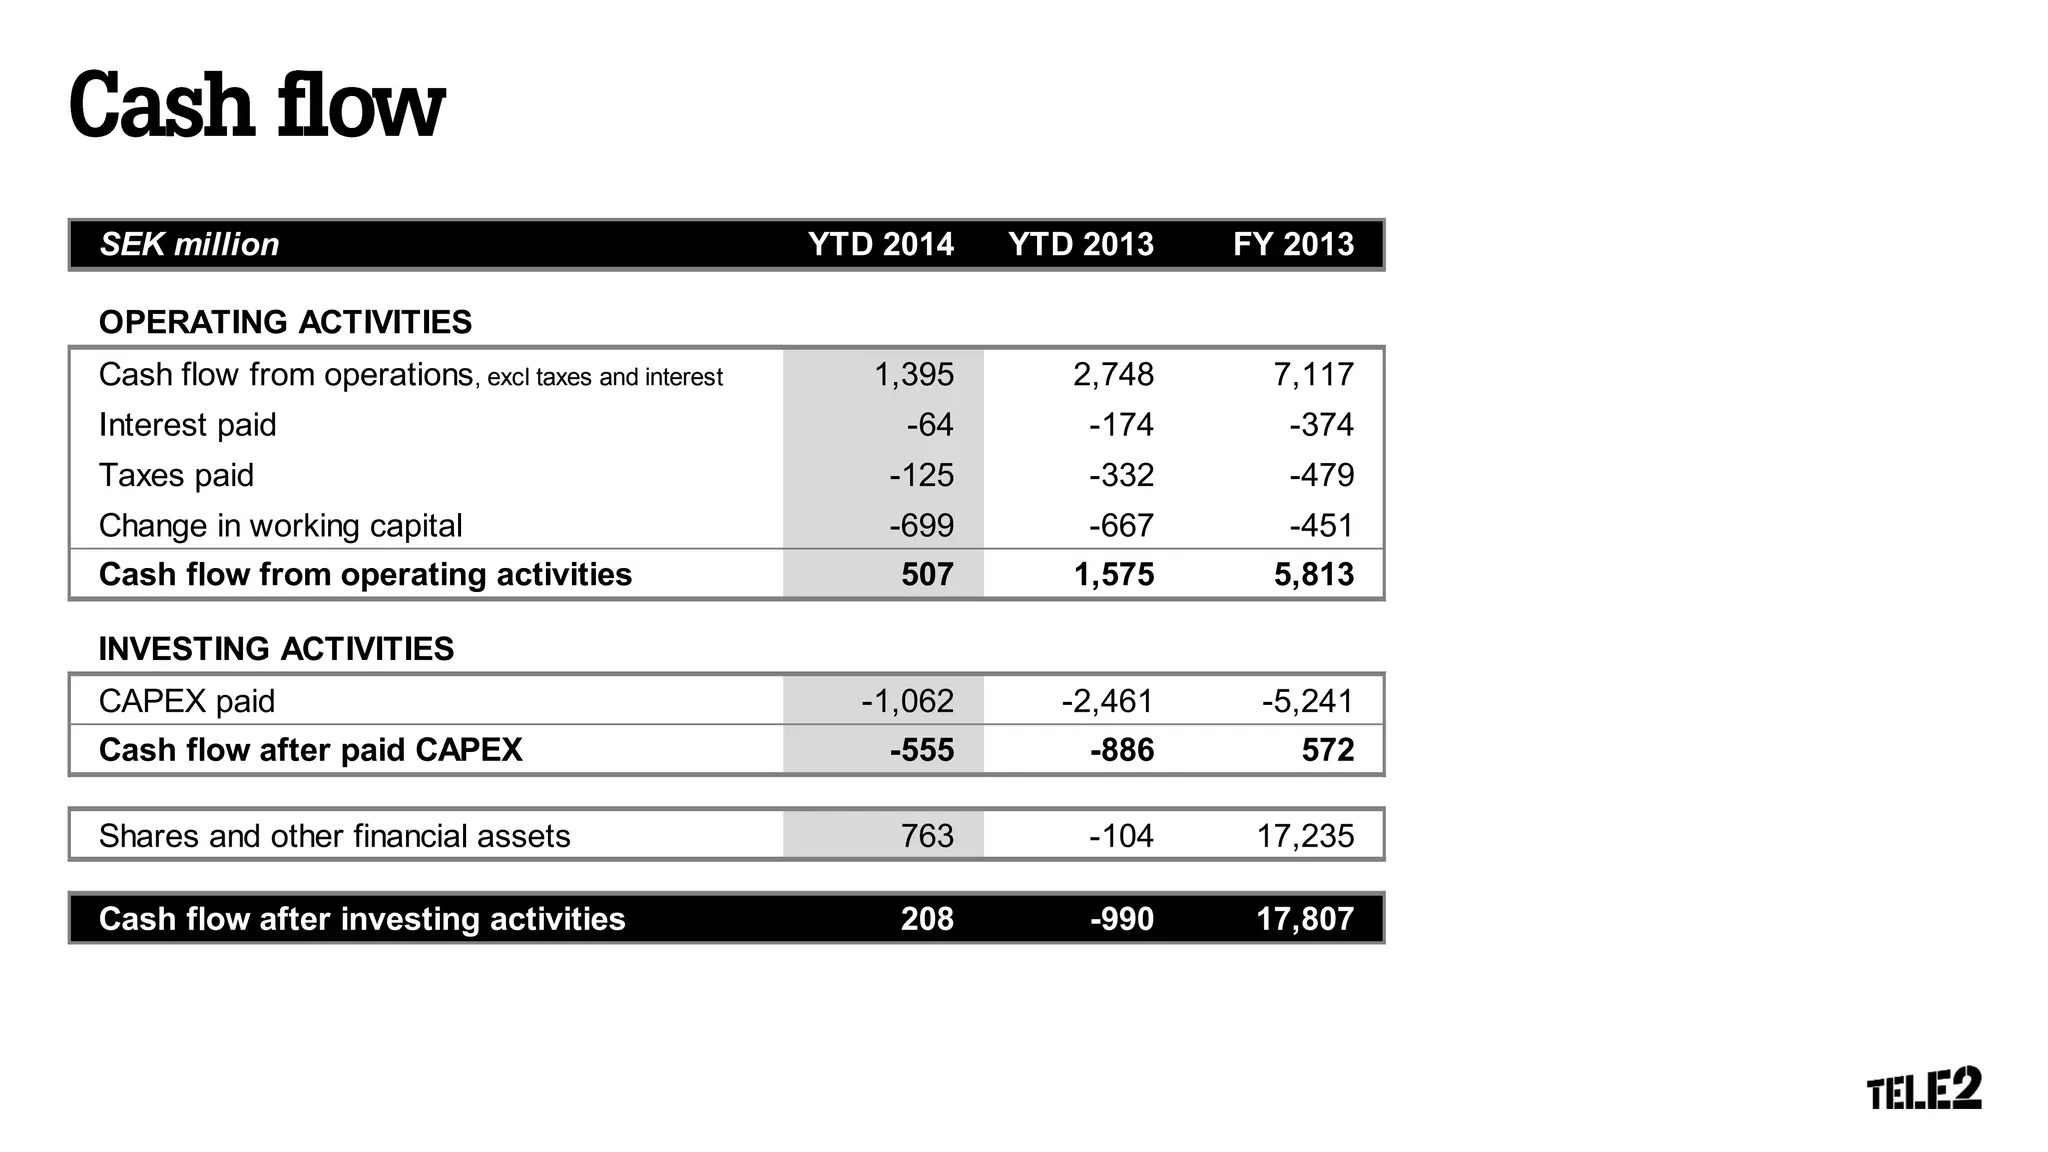
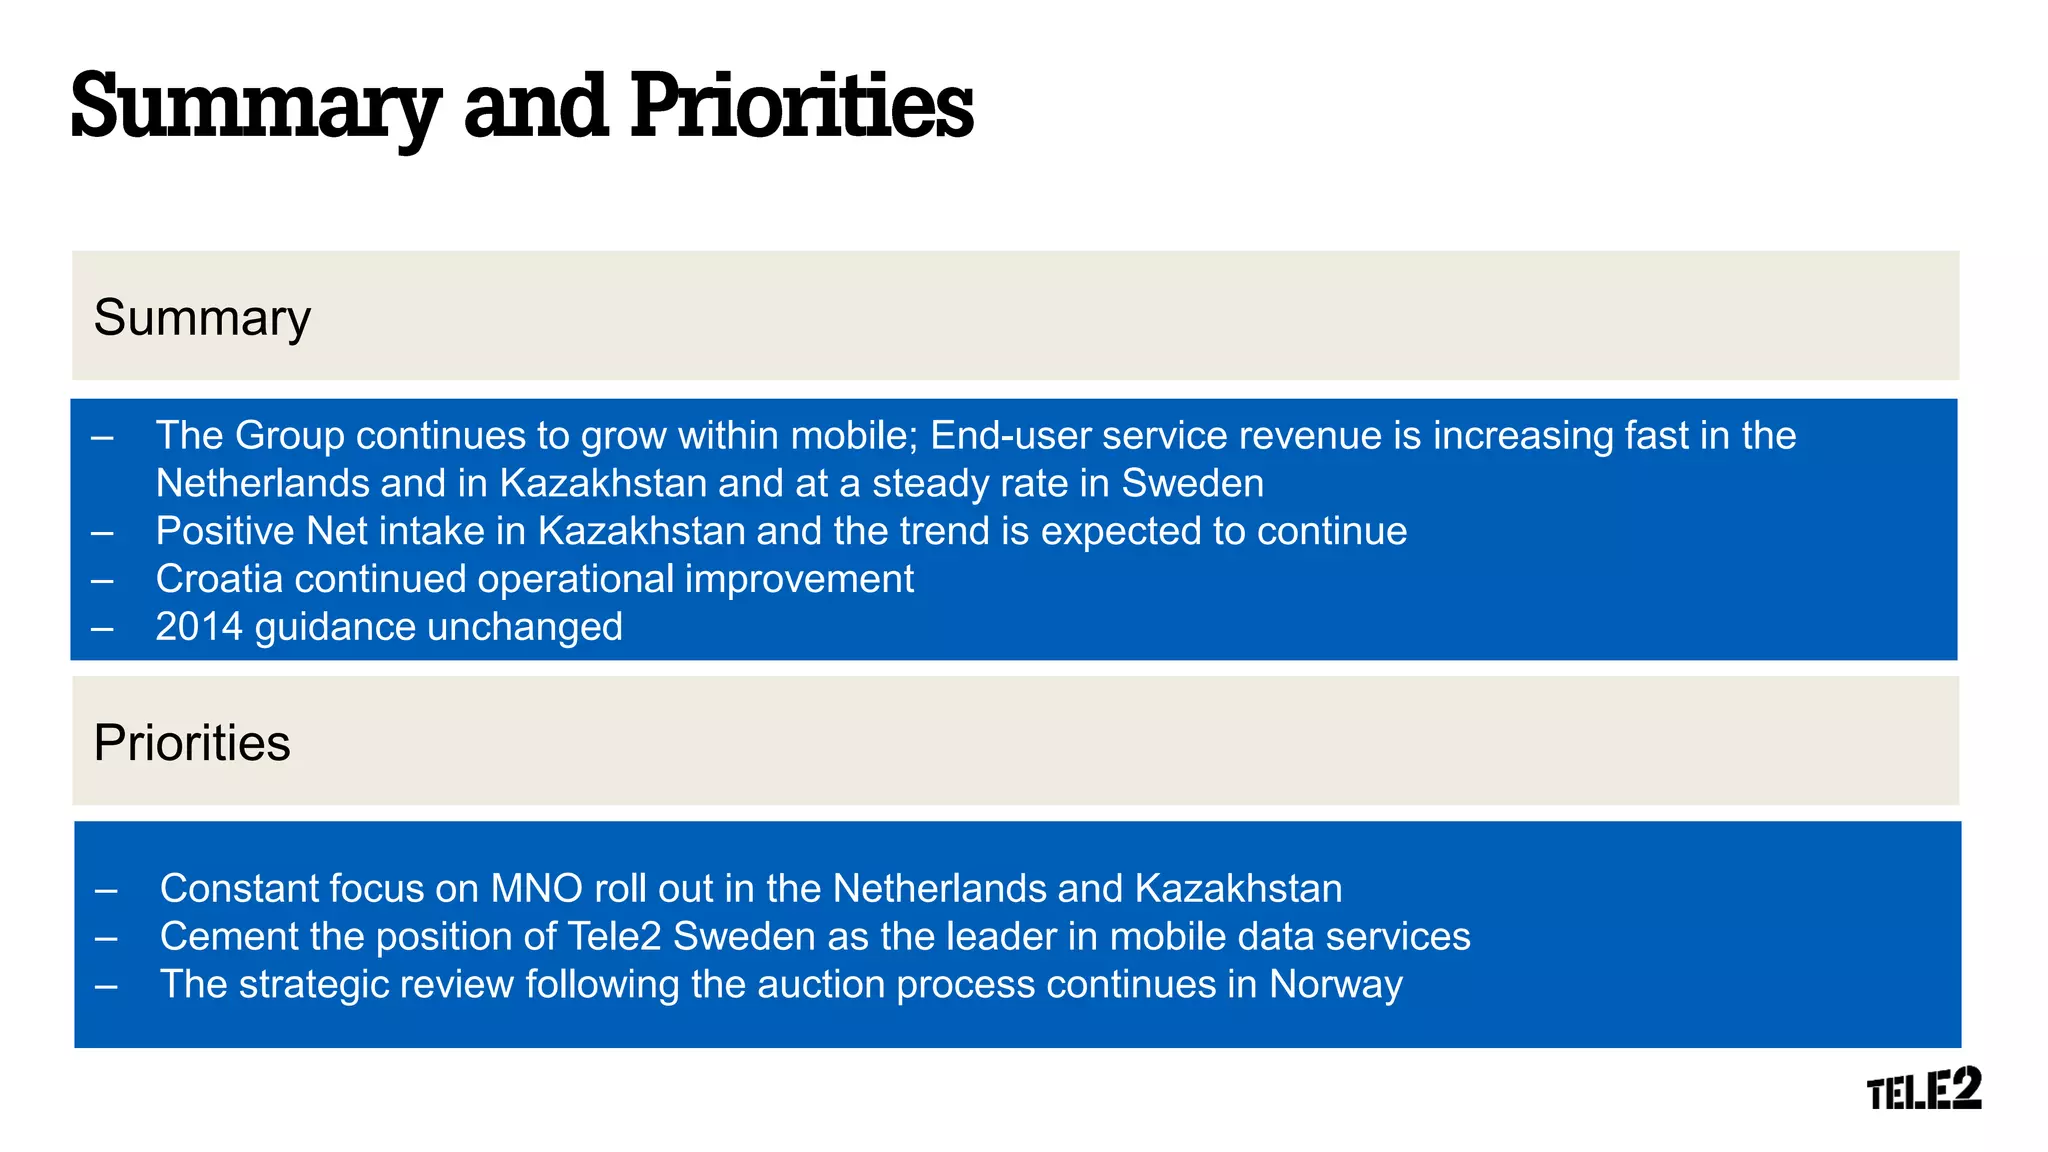
25th of April 2014
Tele2 AB
Note: Numbers in parenthesis are Q1 2013 numbers
*Incl. the divested Swedish cable business
Net sales
(SEK billion)
EBITDA
(SEK billion)
CAPEX
(SEK billion)
EBITDA margin
(percent)
7.11
(7.30*)
1.38
(1.49*)
19
(20*)
0.96
(2.12*)
Q1 Financial Highlights
– Group financial performance in line with 2014 guidance
– Mobile end-user service revenue growth of 3.0% for the Group
– Group Mobile Net intake of 68,000 customers
Note: Mobile end-user service revenue excludes interconnect and equipment sales
Sweden
(SEK million)
Tele2 Group
(SEK million)
Norway
(SEK million)
Netherlands
(SEK million)
Kazakhstan
(SEK million)
3.0%
3,496 3,674 3,769 3,724 3,600
Q1 13 Q2 13 Q3 13 Q4 13 Q1 14
1,662 1,746 1,767 1,775 1,716
Q1 13 Q2 13 Q3 13 Q4 13 Q1 14
775 774 761 718 696
Q1 13 Q2 13 Q3 13 Q4 13 Q1 14
197
227
259 261 273
Q1 13 Q2 13 Q3 13 Q4 13 Q1 14
195
223 240 251
216
Q1 13 Q2 13 Q3 13 Q4 13 Q1 14
Decision made to build out the 2G/4G network during 2014-2016 and thereby increase the
geographical coverage from today’s 70% to 90%
Network roll-out achieving important milestones
Initiated strategic review following the auction process
First EBITDA-positive quarter since commercial launch and Net intake positive
Tele2 Estonia acquired two mobile licenses in the 800 MHz and 2,100 MHz frequency bands
for SEK 54 million
Net sales
(SEK million)
EBITDA
(SEK million)
Tele2 Sweden has the best 4G
network in the world*
– Residential: The shift from pay as you go to bucket price plans has continued, with 56% of customer stock now on bucket price
plans. Also, 86% of handsets sold were 4G enabled further demonstrating the continued strong demand for mobile data
– Business: Continued mobile growth lead by increased ASPU in the SME segment as well as increased customer base overall.
Significant increase in demand for mobile data, via smartphones as well as mobile broad band products
– Comviq: A stable delivery from Customer Operations and successful marketing campaigns have resulted in a slowing rate of decline
in the prepaid segment. Also, the roll-out of the To Go concept has continued with 200 new pick-up locations during Q1
-1.9%
Q1 Highlights
3,080 3,139 3,078 3,156 3,021
Q1 13 Q2 13 Q3 13 Q4 13 Q1 14
Mobile Fixed broadband
Fixed telephony Other
834 856 900 858 825
27% 27%
29%
27% 27%
Q1 13 Q2 13 Q3 13 Q4 13 Q1 14
Mobile Fixed broadband
Fixed telephony Other
EBITDA Margin
*According to Open Signal - The State of LTE (February 2014)
93 91 90 86 85 85
77
TimeonLTE(%)
*Lycamobile switched from Vodafone to KPN to support their MVNO network. The patterned bars are therefore cut.
Net sales
(SEK million)
EBITDA
(SEK million)
Quarterly Net adds*
(x1000)
Q1 Highlights
-0.8%
– General: Successful launch of the new ‘value champion’ brand, resulted in an increased marketing performance
– Consumer Mobile: Fastest growing mobile provider in terms of subscribers for the 9th consecutive quarter
– MNO: Significant milestones reached for the 4G roll-out; new mobile core in place, agreement with Eurofiber signed to support
backhaul and successful testing of VoLTE and CSFB
– Consumer Broadband: Improved TV-product with new channels (HBO and three others) and 11 channels upgraded to HD quality
1,331 1,349 1,383 1,372 1,320
Q1 13 Q2 13 Q3 13 Q4 13 Q1 14
Mobile Fixed broadband
Fixed telephony Other
317 321
271
342
257
24% 24%
20%
25%
19%
Q1 13 Q2 13 Q3 13 Q4 13 Q1 14
Mobile Fixed broadband
Fixed telephony Other
EBITDA Margin
-200
-100
0
100
Q1 13 Q2 13 Q3 13 Q4 13 Q1 14
KPN Vodafone T-Mobile Tele2
674
-701
– Initiated strategic review following the auction process
– Commercial efforts will continue
– One Call is now the 3rd largest mobile brand in Norway in terms of customers. One Call reached 423,000 customers during Q1 and
continues to grow
– In March, One Call was awarded the prize for best customer service in the telecommunication sector for the 3rd consecutive year by
TNS Gallup in their annual customer service survey
Net sales
(SEK million)
EBITDA
(SEK million)
One Call customer growth
development
Q1 Highlights
-9%
1,050 1,052 1,029 983 956
Q1 13 Q2 13 Q3 13 Q4 13 Q1 14
Mobile Fixed telephony Other
39 44
55
-17
22
4% 4%
5%
-2%
2%
Q1 13 Q2 13 Q3 13 Q4 13 Q1 14
Mobile Fixed telephony
Other EBITDA Margin
423,000
289
333
357 365
294
Q1 13 Q2 13 Q3 13 Q4 13 Q1 14
Mobile
– Steadily growing customer base; January Net intake -49,000, February Net intake -1,000 and March Net intake of 70,000 customers,
mainly driven by growth in regular sales via dealers, improved distribution as well as promotional offers
– Positive EBITDA of SEK 1 million in the quarter supported by customer growth and lower mobile termination rates
– Net sales growth was negatively affected by reduced mobile termination rates
– At constant currency Net sales increased by 13.9%
Net sales
(SEK million)
EBITDA
(SEK million)
Net intake
(thousands)
Q1 Highlights
1.7%
-45
-52
-34
-7
1
-16% -16% -10% -2%
0%
Q1 13 Q2 13 Q3 13 Q4 13 Q1 14
Mobile EBITDA Margin
252
309
-14
-393
20
Q1 13 Q2 13 Q3 13 Q4 13 Q1 14
Croatia Net sales
(SEK million)
Croatia EBITDA
(SEK million)
Croatia Q1 Highlights
Lithuania Net sales
(SEK million)
Lithuania EBITDA
(SEK million)
Lithuania Q1 Highlights
– Net intake of 6,000 customers, still
growing despite a declining market
– Revenue market share above 20%
– Won the Best Buy Award 2014,
awarded by ICERTIAS (prepaid
category)
– Intense competition due to continued
price war and intensive media
pressure
– However, Tele2 Lithuania kept the
market leader position and grew with
a Net intake of 18,000 customers in
the quarter-2104
3
22
48
22 25
1%
7%
13%
6% 8%
Q1 13 Q2 13 Q3 13 Q4 13 Q1 14
Mobile EBITDA Margin
296
333
372 396
299
Q1 13 Q2 13 Q3 13 Q4 13 Q1 14
Mobile
117 133
109 102 108
40% 41%
33% 31% 36%
Q1 13 Q2 13 Q3 13 Q4 13 Q1 14
Mobile EBITDA Margin
293
326 334 327 304
Q1 13 Q2 13 Q3 13 Q4 13 Q1 14
Mobile
Latvia Net sales
(SEK million)
Latvia EBITDA
(SEK million)
Latvia Q1 Highlights
Estonia Net sales
(SEK million)
Estonia EBITDA
(SEK million)
Estonia Q1 Highlights
– Customers transitioning from prepaid
to postpaid
– EBITDA margin at 29% affected by
price pressure in the market
– Self-service initiatives, billing
improvements and introduction of 4G
– Tele2 Estonia acquired two mobile
licenses in the 800 MHz and 2,100
MHz frequency bands
– Key focus to improve Net sales and
customer intake
– New management team in place
79
69 72 72
62
33% 32% 31% 31% 29%
Q1 13 Q2 13 Q3 13 Q4 13 Q1 14
Mobile EBITDA Margin
236 219 230 230 213
Q1 13 Q2 13 Q3 13 Q4 13 Q1 14
Mobile
45
36
43
37 39
29%
22% 24% 22% 25%
Q1 13 Q2 13 Q3 13 Q4 13 Q1 14
Mobile Fixed telephony
Other EBITDA Margin
156 164 182 172 154
Q1 13 Q2 13 Q3 13 Q4 13 Q1 14
Mobile Fixed telephony Other
Austria Net sales
(SEK million)
Austria EBITDA
(SEK million)
Austria Q1 Highlights
Germany Net sales
(SEK million)
Germany EBITDA
(SEK million)
Germany Q1 Highlights
– Focus on growing the B2B customer
base
– Growth program with increased
marketing and sales activities is being
initiated to improve net intake
– Temporary EBITDA decline due to the
growth program
– Mobile Net intake was 20,000
– Mobile Net sales grew by 58% YoY
– Low EBITDA margin of 15%, affected
by investment in mobile growth
89 77 77
65
49
28%
25% 25%
21%
17%
Q1 13 Q2 13 Q3 13 Q4 13 Q1 14
Fixed broadband Fixed telephony
Other EBITDA Margin
314 311 313 306 291
Q1 13 Q2 13 Q3 13 Q4 13 Q1 14
Fixed broadband Fixed telephony Other
51 37 18
32
34
24%
17%
8%
14% 15%
Q1 13 Q2 13 Q3 13 Q4 13 Q1 14
Mobile Fixed broadband
Fixed telephony EBITDA Margin
214 214 213 226 229
Q1 13 Q2 13 Q3 13 Q4 13 Q1 14
Mobile Fixed broadband Fixed telephony
SEK million YTD 2014 YTD 2013 FY 2013 ▲%
Net sales 7,108 7,298 29,871 -2.6%
EBITDA 1,381 1,488 5,990 -7.2%
EBITDA margin (%) 19.4% 20.4% 20.1% -1.0%
Depreciation & associated companies -769 -820 -3,364 -6.2%
Depreciation of net sales (%) -10.8% -11.1% -11.2% 0.3%
One-off items 242 2 -434
EBIT 854 670 2,192 27.5%
Normalized EBIT 612 668 2,626 -8.4%
Normalized EBIT margin (%) 8.6% 9.2% 8.8% -0.5%
Financial items -142 -117 -614
Taxes -237 -200 -923
Net profit, continuing operations 475 353 655 34.6%
Discontinued operations - 656 13,935
Net profit 475 1,009 14,590 -52.9%
• In Q1 2014, EBIT was positively affected by SEK 257 million as a result of
the sale of residential cable and fiber operation in Sweden as well as
negatively by SEK -18 million due to devaluation of KZT.
Depreciation and
Depreciation as a percentage of net sales
SEK million
10.0%
11.0%
12.0%
13.0%
14.0%
0
300
600
900
1,200
Q1'13 Q2'13 Q3'13 Q4'13 Q1'14
Depreciation Depreciation of net sales (%)
SEK million
Financial items, expensed YTD 2014 YTD 2013 FY 2013
Interst income/costs -89 -130 -391
Exchange rate differences, external -20 15 -35
Exchange rate differences, intragroup -2 37 -33
Other financial items -31 -39 -155
Total -142 -117 -614
Financial items, paid YTD 2014 YTD 2013 FY 2013
Excluding Russia
Interst paid -64 -105 -305
Russia
Interst paid - -69 -69
TOTAL
Interst paid -64 -174 -374
SEK million
Taxes, expensed YTD 2014 YTD 2013 FY 2013
Normal -237 -200 -920
One-off - - -3
Total -237 -200 -923
Taxes, paid YTD 2014 YTD 2013 FY 2013
Excluding Russia
Normal -125 -155 -302
One-off - - -
-125 -155 -302
Discontinued operations
Russia - -177 -177
Total -125 -332 -479
• Deferred tax assets at year-to-date amounted to SEK 2.6 (Dec 2013:
2.8) billion
• Taxes expensed include tax costs in Luxembourg with no cash flow
effect of SEK -76 (-48) million for Q1
SEK million YTD 2014 YTD 2013 FY 2013
OPERATING ACTIVITIES
Cash flow from operations, excl taxes and interest 1,395 2,748 7,117
Interest paid -64 -174 -374
Taxes paid -125 -332 -479
Change in working capital -699 -667 -451
Cash flow from operating activities 507 1,575 5,813
INVESTING ACTIVITIES
CAPEX paid -1,062 -2,461 -5,241
Cash flow after paid CAPEX -555 -886 572
Shares and other financial assets 763 -104 17,235
Cash flow after investing activities 208 -990 17,807
SEK million YTD 2014 YTD 2013 FY 2013
OPERATING ACTIVITIES
Cash flow from operations, excl taxes and interest 1,395 1,563 5,932
Interest paid -64 -105 -305
Taxes paid -125 -155 -302
Change in working capital -699 -451 -235
Cash flow from operating activities 507 852 5,090
INVESTING ACTIVITIES
CAPEX paid -1,062 -2,145 -4,925
Cash flow after paid CAPEX -555 -1,293 165
Shares and other financial assets 767 -1 -17
Cash flow after investing activities 212 -1,294 148
• YTD working capital affetcted by SEK -47 (-98) million due to accrued handset sales
15.8
8.1 7.6 7.2 6.8
0.0
0.0 0.0 2.0
2.0
0.00
0.25
0.50
0.75
1.00
1.25
1.50
1.75
2.00
0.0
2.5
5.0
7.5
10.0
12.5
15.0
17.5
20.0
Mar 2013 Jun 2013 Sep 2013 Dec 2013 Mar 2014
Pro forma net debt/ EBITDA 12 m rolling
SEK billion / Ratio
Ordinary dividend, proposed/paid Pro forma net debt
Pro forma net debt to EBITDA Pro forma net debt to EBITDA, after suggested dividend
Summary
Priorities
– Constant focus on MNO roll out in the Netherlands and Kazakhstan
– Cement the position of Tele2 Sweden as the leader in mobile data services
– The strategic review following the auction process continues in Norway
– The Group continues to grow within mobile; End-user service revenue is increasing fast in the
Netherlands and in Kazakhstan and at a steady rate in Sweden
– Positive Net intake in Kazakhstan and the trend is expected to continue
– Croatia continued operational improvement
– 2014 guidance unchanged
Q1 presentation
Q1 presentation

Q1 presentation

  • 1.
    25th of April2014 Tele2 AB
  • 3.
    Note: Numbers inparenthesis are Q1 2013 numbers *Incl. the divested Swedish cable business Net sales (SEK billion) EBITDA (SEK billion) CAPEX (SEK billion) EBITDA margin (percent) 7.11 (7.30*) 1.38 (1.49*) 19 (20*) 0.96 (2.12*) Q1 Financial Highlights – Group financial performance in line with 2014 guidance – Mobile end-user service revenue growth of 3.0% for the Group – Group Mobile Net intake of 68,000 customers
  • 4.
    Note: Mobile end-userservice revenue excludes interconnect and equipment sales Sweden (SEK million) Tele2 Group (SEK million) Norway (SEK million) Netherlands (SEK million) Kazakhstan (SEK million) 3.0% 3,496 3,674 3,769 3,724 3,600 Q1 13 Q2 13 Q3 13 Q4 13 Q1 14 1,662 1,746 1,767 1,775 1,716 Q1 13 Q2 13 Q3 13 Q4 13 Q1 14 775 774 761 718 696 Q1 13 Q2 13 Q3 13 Q4 13 Q1 14 197 227 259 261 273 Q1 13 Q2 13 Q3 13 Q4 13 Q1 14 195 223 240 251 216 Q1 13 Q2 13 Q3 13 Q4 13 Q1 14
  • 5.
    Decision made tobuild out the 2G/4G network during 2014-2016 and thereby increase the geographical coverage from today’s 70% to 90% Network roll-out achieving important milestones Initiated strategic review following the auction process First EBITDA-positive quarter since commercial launch and Net intake positive Tele2 Estonia acquired two mobile licenses in the 800 MHz and 2,100 MHz frequency bands for SEK 54 million
  • 7.
    Net sales (SEK million) EBITDA (SEKmillion) Tele2 Sweden has the best 4G network in the world* – Residential: The shift from pay as you go to bucket price plans has continued, with 56% of customer stock now on bucket price plans. Also, 86% of handsets sold were 4G enabled further demonstrating the continued strong demand for mobile data – Business: Continued mobile growth lead by increased ASPU in the SME segment as well as increased customer base overall. Significant increase in demand for mobile data, via smartphones as well as mobile broad band products – Comviq: A stable delivery from Customer Operations and successful marketing campaigns have resulted in a slowing rate of decline in the prepaid segment. Also, the roll-out of the To Go concept has continued with 200 new pick-up locations during Q1 -1.9% Q1 Highlights 3,080 3,139 3,078 3,156 3,021 Q1 13 Q2 13 Q3 13 Q4 13 Q1 14 Mobile Fixed broadband Fixed telephony Other 834 856 900 858 825 27% 27% 29% 27% 27% Q1 13 Q2 13 Q3 13 Q4 13 Q1 14 Mobile Fixed broadband Fixed telephony Other EBITDA Margin *According to Open Signal - The State of LTE (February 2014) 93 91 90 86 85 85 77 TimeonLTE(%)
  • 8.
    *Lycamobile switched fromVodafone to KPN to support their MVNO network. The patterned bars are therefore cut. Net sales (SEK million) EBITDA (SEK million) Quarterly Net adds* (x1000) Q1 Highlights -0.8% – General: Successful launch of the new ‘value champion’ brand, resulted in an increased marketing performance – Consumer Mobile: Fastest growing mobile provider in terms of subscribers for the 9th consecutive quarter – MNO: Significant milestones reached for the 4G roll-out; new mobile core in place, agreement with Eurofiber signed to support backhaul and successful testing of VoLTE and CSFB – Consumer Broadband: Improved TV-product with new channels (HBO and three others) and 11 channels upgraded to HD quality 1,331 1,349 1,383 1,372 1,320 Q1 13 Q2 13 Q3 13 Q4 13 Q1 14 Mobile Fixed broadband Fixed telephony Other 317 321 271 342 257 24% 24% 20% 25% 19% Q1 13 Q2 13 Q3 13 Q4 13 Q1 14 Mobile Fixed broadband Fixed telephony Other EBITDA Margin -200 -100 0 100 Q1 13 Q2 13 Q3 13 Q4 13 Q1 14 KPN Vodafone T-Mobile Tele2 674 -701
  • 9.
    – Initiated strategicreview following the auction process – Commercial efforts will continue – One Call is now the 3rd largest mobile brand in Norway in terms of customers. One Call reached 423,000 customers during Q1 and continues to grow – In March, One Call was awarded the prize for best customer service in the telecommunication sector for the 3rd consecutive year by TNS Gallup in their annual customer service survey Net sales (SEK million) EBITDA (SEK million) One Call customer growth development Q1 Highlights -9% 1,050 1,052 1,029 983 956 Q1 13 Q2 13 Q3 13 Q4 13 Q1 14 Mobile Fixed telephony Other 39 44 55 -17 22 4% 4% 5% -2% 2% Q1 13 Q2 13 Q3 13 Q4 13 Q1 14 Mobile Fixed telephony Other EBITDA Margin 423,000
  • 10.
    289 333 357 365 294 Q1 13Q2 13 Q3 13 Q4 13 Q1 14 Mobile – Steadily growing customer base; January Net intake -49,000, February Net intake -1,000 and March Net intake of 70,000 customers, mainly driven by growth in regular sales via dealers, improved distribution as well as promotional offers – Positive EBITDA of SEK 1 million in the quarter supported by customer growth and lower mobile termination rates – Net sales growth was negatively affected by reduced mobile termination rates – At constant currency Net sales increased by 13.9% Net sales (SEK million) EBITDA (SEK million) Net intake (thousands) Q1 Highlights 1.7% -45 -52 -34 -7 1 -16% -16% -10% -2% 0% Q1 13 Q2 13 Q3 13 Q4 13 Q1 14 Mobile EBITDA Margin 252 309 -14 -393 20 Q1 13 Q2 13 Q3 13 Q4 13 Q1 14
  • 11.
    Croatia Net sales (SEKmillion) Croatia EBITDA (SEK million) Croatia Q1 Highlights Lithuania Net sales (SEK million) Lithuania EBITDA (SEK million) Lithuania Q1 Highlights – Net intake of 6,000 customers, still growing despite a declining market – Revenue market share above 20% – Won the Best Buy Award 2014, awarded by ICERTIAS (prepaid category) – Intense competition due to continued price war and intensive media pressure – However, Tele2 Lithuania kept the market leader position and grew with a Net intake of 18,000 customers in the quarter-2104 3 22 48 22 25 1% 7% 13% 6% 8% Q1 13 Q2 13 Q3 13 Q4 13 Q1 14 Mobile EBITDA Margin 296 333 372 396 299 Q1 13 Q2 13 Q3 13 Q4 13 Q1 14 Mobile 117 133 109 102 108 40% 41% 33% 31% 36% Q1 13 Q2 13 Q3 13 Q4 13 Q1 14 Mobile EBITDA Margin 293 326 334 327 304 Q1 13 Q2 13 Q3 13 Q4 13 Q1 14 Mobile
  • 12.
    Latvia Net sales (SEKmillion) Latvia EBITDA (SEK million) Latvia Q1 Highlights Estonia Net sales (SEK million) Estonia EBITDA (SEK million) Estonia Q1 Highlights – Customers transitioning from prepaid to postpaid – EBITDA margin at 29% affected by price pressure in the market – Self-service initiatives, billing improvements and introduction of 4G – Tele2 Estonia acquired two mobile licenses in the 800 MHz and 2,100 MHz frequency bands – Key focus to improve Net sales and customer intake – New management team in place 79 69 72 72 62 33% 32% 31% 31% 29% Q1 13 Q2 13 Q3 13 Q4 13 Q1 14 Mobile EBITDA Margin 236 219 230 230 213 Q1 13 Q2 13 Q3 13 Q4 13 Q1 14 Mobile 45 36 43 37 39 29% 22% 24% 22% 25% Q1 13 Q2 13 Q3 13 Q4 13 Q1 14 Mobile Fixed telephony Other EBITDA Margin 156 164 182 172 154 Q1 13 Q2 13 Q3 13 Q4 13 Q1 14 Mobile Fixed telephony Other
  • 13.
    Austria Net sales (SEKmillion) Austria EBITDA (SEK million) Austria Q1 Highlights Germany Net sales (SEK million) Germany EBITDA (SEK million) Germany Q1 Highlights – Focus on growing the B2B customer base – Growth program with increased marketing and sales activities is being initiated to improve net intake – Temporary EBITDA decline due to the growth program – Mobile Net intake was 20,000 – Mobile Net sales grew by 58% YoY – Low EBITDA margin of 15%, affected by investment in mobile growth 89 77 77 65 49 28% 25% 25% 21% 17% Q1 13 Q2 13 Q3 13 Q4 13 Q1 14 Fixed broadband Fixed telephony Other EBITDA Margin 314 311 313 306 291 Q1 13 Q2 13 Q3 13 Q4 13 Q1 14 Fixed broadband Fixed telephony Other 51 37 18 32 34 24% 17% 8% 14% 15% Q1 13 Q2 13 Q3 13 Q4 13 Q1 14 Mobile Fixed broadband Fixed telephony EBITDA Margin 214 214 213 226 229 Q1 13 Q2 13 Q3 13 Q4 13 Q1 14 Mobile Fixed broadband Fixed telephony
  • 15.
    SEK million YTD2014 YTD 2013 FY 2013 ▲% Net sales 7,108 7,298 29,871 -2.6% EBITDA 1,381 1,488 5,990 -7.2% EBITDA margin (%) 19.4% 20.4% 20.1% -1.0% Depreciation & associated companies -769 -820 -3,364 -6.2% Depreciation of net sales (%) -10.8% -11.1% -11.2% 0.3% One-off items 242 2 -434 EBIT 854 670 2,192 27.5% Normalized EBIT 612 668 2,626 -8.4% Normalized EBIT margin (%) 8.6% 9.2% 8.8% -0.5% Financial items -142 -117 -614 Taxes -237 -200 -923 Net profit, continuing operations 475 353 655 34.6% Discontinued operations - 656 13,935 Net profit 475 1,009 14,590 -52.9% • In Q1 2014, EBIT was positively affected by SEK 257 million as a result of the sale of residential cable and fiber operation in Sweden as well as negatively by SEK -18 million due to devaluation of KZT.
  • 16.
    Depreciation and Depreciation asa percentage of net sales SEK million 10.0% 11.0% 12.0% 13.0% 14.0% 0 300 600 900 1,200 Q1'13 Q2'13 Q3'13 Q4'13 Q1'14 Depreciation Depreciation of net sales (%)
  • 17.
    SEK million Financial items,expensed YTD 2014 YTD 2013 FY 2013 Interst income/costs -89 -130 -391 Exchange rate differences, external -20 15 -35 Exchange rate differences, intragroup -2 37 -33 Other financial items -31 -39 -155 Total -142 -117 -614 Financial items, paid YTD 2014 YTD 2013 FY 2013 Excluding Russia Interst paid -64 -105 -305 Russia Interst paid - -69 -69 TOTAL Interst paid -64 -174 -374
  • 18.
    SEK million Taxes, expensedYTD 2014 YTD 2013 FY 2013 Normal -237 -200 -920 One-off - - -3 Total -237 -200 -923 Taxes, paid YTD 2014 YTD 2013 FY 2013 Excluding Russia Normal -125 -155 -302 One-off - - - -125 -155 -302 Discontinued operations Russia - -177 -177 Total -125 -332 -479 • Deferred tax assets at year-to-date amounted to SEK 2.6 (Dec 2013: 2.8) billion • Taxes expensed include tax costs in Luxembourg with no cash flow effect of SEK -76 (-48) million for Q1
  • 19.
    SEK million YTD2014 YTD 2013 FY 2013 OPERATING ACTIVITIES Cash flow from operations, excl taxes and interest 1,395 2,748 7,117 Interest paid -64 -174 -374 Taxes paid -125 -332 -479 Change in working capital -699 -667 -451 Cash flow from operating activities 507 1,575 5,813 INVESTING ACTIVITIES CAPEX paid -1,062 -2,461 -5,241 Cash flow after paid CAPEX -555 -886 572 Shares and other financial assets 763 -104 17,235 Cash flow after investing activities 208 -990 17,807
  • 20.
    SEK million YTD2014 YTD 2013 FY 2013 OPERATING ACTIVITIES Cash flow from operations, excl taxes and interest 1,395 1,563 5,932 Interest paid -64 -105 -305 Taxes paid -125 -155 -302 Change in working capital -699 -451 -235 Cash flow from operating activities 507 852 5,090 INVESTING ACTIVITIES CAPEX paid -1,062 -2,145 -4,925 Cash flow after paid CAPEX -555 -1,293 165 Shares and other financial assets 767 -1 -17 Cash flow after investing activities 212 -1,294 148 • YTD working capital affetcted by SEK -47 (-98) million due to accrued handset sales
  • 21.
    15.8 8.1 7.6 7.26.8 0.0 0.0 0.0 2.0 2.0 0.00 0.25 0.50 0.75 1.00 1.25 1.50 1.75 2.00 0.0 2.5 5.0 7.5 10.0 12.5 15.0 17.5 20.0 Mar 2013 Jun 2013 Sep 2013 Dec 2013 Mar 2014 Pro forma net debt/ EBITDA 12 m rolling SEK billion / Ratio Ordinary dividend, proposed/paid Pro forma net debt Pro forma net debt to EBITDA Pro forma net debt to EBITDA, after suggested dividend
  • 23.
    Summary Priorities – Constant focuson MNO roll out in the Netherlands and Kazakhstan – Cement the position of Tele2 Sweden as the leader in mobile data services – The strategic review following the auction process continues in Norway – The Group continues to grow within mobile; End-user service revenue is increasing fast in the Netherlands and in Kazakhstan and at a steady rate in Sweden – Positive Net intake in Kazakhstan and the trend is expected to continue – Croatia continued operational improvement – 2014 guidance unchanged