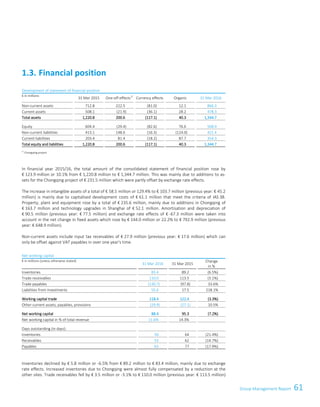
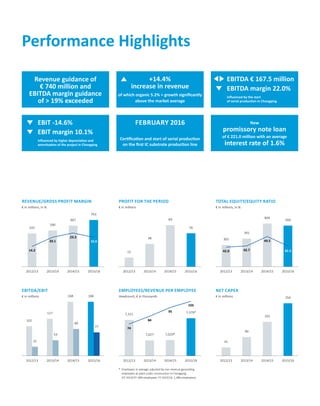
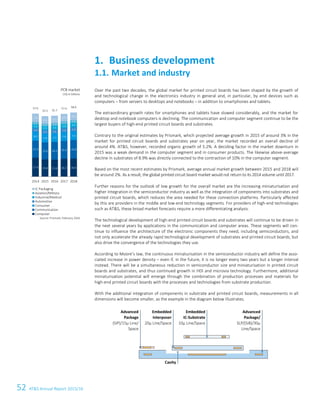
Key figures
IFRS Unit 2012/13 1)
2013/14 2014/15 2015/16 Change in %
EARNINGS DATA AND GENERAL INFORMATION
Revenue € in millions 541.7 589.9 667.0 762.9 14.4%
	 thereof in Asia % 73.9% 75.9% 79.0% 81.0% –
thereof in Europe % 26.1% 24.1% 21.0% 19.0% –
Cost of sales € in millions 464.6 471.1 511.6 611.2 19.5%
Gross profit € in millions 77.1 118.8 155.4 151.6 (2.4%)
Gross profit margin % 14.2% 20.1% 23.3% 19.9% –
EBITDA € in millions 102.4 127.2 167.6 167.5 (0.0%)
EBITDA margin % 18.9% 21.6% 25.1% 22.0% –
EBIT € in millions 31.4 53.9 90.1 77.0 (14.6%)
EBIT margin % 5.8% 9.1% 13.5% 10.1% –
Profit for the period € in millions 14.6 38.2 69.3 56.0 (19.3%)
Profit for the period attributable
to owners of the parent company € in millions 14.6 38.2 69.3 56.0 (19.2%)
Cash earnings € in millions 85.6 111.4 146.8 146.5 (0.2%)
ROE (Return on equity)2)
% 5.0% 11.0% 13.9% 9.5% –
ROCE (Return on capital employed)2)
% 5.6% 9.6% 12.0% 8.2% –
ROS (Return on sales) % 2.7% 6.5% 10.4% 7.3% –
IRR (Innovation revenue rate) % 19.2% 26.5% 29.2% 19.6% –
Cash flow from operating activities (OCF) € in millions 71.7 104.8 143.9 136.9 (4.8%)
Net CAPEX € in millions 40.5 90.3 164.8 254.3 54.3%
Employees (incl. leased personnel), end of reporting period – 7,011 7,129 8,120 9,116 12.3%
Employees (incl. leased personnel), average – 7,321 7,027 7,638 8,759 14.7%
BALANCE SHEET DATA
Total assets € in millions 726.7 916.1 1,220.8 1,344.7 10.1%
Total equity € in millions 304.8 390.7 604.4 568.9 (5.9%)
Equity attributable to owners of the parent company € in millions 304.9 390.7 604.3 568.9 (5.8%)
Equity ratio % 42.0% 42.7% 49.5% 42.3% –
Net debt € in millions 217.4 110.9 130.5 263.2 101.7%
Net gearing % 71.3% 28.4% 21.6% 46.3% –
Net working capital € in millions 102.7 91.7 95.3 88.4 (7.2%)
Net working capital as a percentage of revenues % 19.0% 15.6% 14.3% 11.6% –
STOCK EXCHANGE DATA
Shares outstanding end of reporting period – 23,322,588 38,850,000 38,850,000 38,850,000 –
Weighted average number of shares outstanding – 23,322,588 30,820,545 38,850,000 38,850,000 –
Earnings per share outstanding end of reporting period € 0.62 0.98 1.78 1.44 (19.1%)
Earnings per average number of shares outstanding € 0.62 1.24 1.78 1.44 (19.1%)
Cash earnings per average number of shares € 3.67 3.61 3.78 3.77 (0.3%)
Dividend per share3)
€ 0.20 0.20 0.36 0.36 –
Closing price € 6.79 8.75 14.62 12.90 (11.8%)
Dividend yield (at the closing price) 3)
% 2.9% 2.3% 2.5% 2.8% –
Market capitalisation, end of reporting period € in millions 158.4 339.9 568.0 501.2 (11.8%)
Market capitalisation per equity4)
% 51.9% 87.0% 94.0% 88.1% –
1) Adjusted taking into account IAS 19 revised.
2) Calculated on the basis of average values.
3) 2015/16: Proposal for the Annual General Meeting on 7 July 2016.
4) Equity attributable to owners of the parent company.
127
54
2012/13 2013/14 2014/15 2015/16
41
90
254
165
2012/13 2013/14 2014/15 2015/162012/13 2013/14 2014/15 2015/16
102
31
168
77
168
90
2012/13 2013/14 2014/15 2015/16 2012/13 2013/14 2014/15 2015/16 2012/13 2013/14 2014/15 2015/16
305
391
604
569
15
38
69
56542
590
667
763
74
84
95
103
7,321
7,027 7,029*
7,379*
EMPLOYEES/REVENUE PER EMPLOYEE
Headcount, € in thousands
NET CAPEX
€ in millions
EBITDA/EBIT
€ in millions
REVENUE/GROSS PROFIT MARGIN
€ in millions, in %
14.2
20.1
23.3
19.9
PROFIT FOR THE PERIOD
€ in millions
42.0 42.7
49.5
Performance Highlights
New
promissory note loan
of € 221.0 million with an average
interest rate of 1.6%
+14.4%
increase in revenue
February 2016
of which organic 5.2% = growth significantly
above the market average
Certification and start of serial production
on the first IC substrate production line
influenced by higher depreciation and
amortisation of the project in Chongqing
EBIT -14.6%
EBIT margin 10.1%
influenced by the start
of serial production in Chongqing
EBITDA € 167.5 million
EBITDA margin 22.0%
42.3
*	 Employees in average, adjusted by non-revenue generating
employees at plant under construction in Chongqing
(FY 2014/15: 609 employees; FY 2015/16: 1,380 employees).
TOTAL EQUITY/EQUITY RATIO
€ in millions, in %
Revenue guidance of
€ 740 million and
EBITDA margin guidance
of > 19% exceeded
We are working
on the solutions!
First choice
for advanced
applications
MISSION
VISION
2 AT&S Annual Report 2015/16
§	 We set the highest quality standards in our industry
§	 We industrialize leading-edge technology
§	 We care about people
§	 We reduce our ecological footprint
§	 We create value
TOP ON
COSTUMER’S MIND
§	 Clear USP for all the markets
we serve
§	 Best-in-class interface to the
customer
§	 Innovative, sustainable solutions
§	 Clear value proposition in the
high-end PCB industry
§	 Outstanding product range
WE PROVIDE LEADING-EDGE
TECHNOLOGY & SERVICES
§	 Identify and anticipate
key technological innovations
§	 Provide value-adding solutions
§	 Innovation and industrialisation are
essential parts of our culture
§	 We constantly strive to be best-in-class
in all of our processes
AT&S in Brief
AT&S is the leading manufacturer of printed circuit boards in Europe and globally
one of the technology leaders in the printed circuit board (PCB) industry. AT&S
concentrates on high-end technologies and applications in the segments Mobile
Devices & Substrates and Automotive, Industrial, Medical. AT&S is successful among
its ­mostly Asian competition because of its clear focus on the high-end, exceptional
process know-how, quality, efficiency, capacity utilisation and European governance.
AT&S has a cost-effective production footprint in close proximity to the customer, with
six production sites in Austria (Leoben, Fehring), India (Nanjangud), China (Shanghai,
Chongqing), and South Korea (Ansan). The average number of employees in the
financial year 2015/16 was 8,759. AT&S shares have been listed since 1999, first on
the Frankfurt Stock Exchange and, since 2008, on the Vienna Stock Exchange.
3Table of Contents
Table of Contents
	51	Group Management Report
	 52	 Business development
		52	 Market and industry
		57	 Profit situation
		61	 Financial position
	 68	 Significant events after the reporting period
	 69	 Plants and branch offices
	 70	 Business development by segments
	 73	Group
		73	Employees
		76	Sustainability
		79	 Research and development
	 81	 Risk and opportunities management
	 86	 Internal Control and Risk Management System
	 	 with regard to accounting
	 87	 Shareholder structure and disclosure on capital
		 (disclosures according to § 243a Austrian Commercial Code)
	 89	Outlook
	91	Consolidated Financial
		Statements 2015/16
	144	Statement of all
		Legal Representatives
	145	Auditor’s Report
	146	 Glossary
High-tech printed circuit
boards for high-end
applications
	 4	Management statement
	 4	 Andreas Gerstenmayer, CEO, discusses the business
	 	 performance in 2015/16 and the AT&S strategy
	 8	 Heinz Moitzi, COO, on the new plant in China and further
	 	 trends in research and development
	 10	 Karl Asamer, CFO, discusses ROCE, investments in
	 	 Chongqing and financial strategy
	12	Profile, strategy and influence
		& success factors
	 12	 Group profile
	 13	 Group sites
	 14	 Value creation chain
	 16	 Goals and strategy
	 21	 Influence and success factors
	23	Report of the Supervisory Board
	26	Investor Relations
	31	Corporate Governance Report
	 32	 Principles and Corporate Governance Declaration
	 34	 AT&S AG Management Board
	 36	 AT&S AG Supervisory Board
	 43	 Remuneration Report: Management and Supervisory Boards
	 47	 Directors’ Holdings & Dealings
	 48	 Other codes of conduct
4 AT&S Annual Report 2015/16
How to get smaller and bigger
at the same time.
Chongqing or advancing to a new league
Dear shareholders, customers
and partners of AT&S,
When I was recently asked by an interested
private investor, what’s the AT&S investment
story in a nutshell, this was my answer: we
invest early in technologies so that we profit
from market trends and create added value
for our customers. We do this continuously,
but at present we have a special focus: our
480 million euro investment in Chongqing,
China, in IC substrates and substrate-like
printed circuit boards.
The performance capacity of electronic prod-
ucts and components will continue to in-
crease dramatically in the future. This means
new dimensions for even smaller and more
reliable end devices that cannot be foreseen
today. The success factors for product genera-
tions will be structural density and function-
ality. AT&S has developed a clear strategy
and technology roadmap which will enable
it to continue meeting these requirements
at the forefront of technology in the future.
An essential part of this strategy are the new
plants for the production of IC substrates
and substrate-like printed circuit boards in
China. This, combined with proven tech-
nologies such as HDI any-layer and embed-
ding, gives us the ability to offer customers
a unique technology and solutions portfolio
bundled in this form.
We are planning further significant growth in
the high-end technology segment and there-
by achieve a new business dimension that
generates the operating cash flow needed to
finance our future investments even more
than before with self-generated funds. This
ensures our future! The commissioning of
the new plants in Chongqing supports us in
this endeavor.
Let’s look at the results for the reporting year.
Based on very good utilisation levels, we have
not only achieved our targets for revenue
and profitability announced in our outlook
for the year 2015/16, but exceeded them. In
addition to strong operating per­formance,
the development of foreign exchange rates
(primarily the U.S. dollar to the euro) and
the start of serial production of the first
production line in Chongqing only by mid-­
February contributed.
In terms of revenue, we achieved an ­increase
of 14.4% in 2015/16. After adjusting
for the special effects related to foreign
­exchange, we achieved an increase of 5.2%
The AT&S business model in 60 seconds
For our printed circuit boards, it’s all about smaller and smaller sizes. But when it comes
to our future technology portfolio and business size, AT&S is getting bigger. The printed
circuit boards of the future are becoming increasingly smaller, and the requirements
go beyond pure printed circuit boards to highly complex all-in interconnection solutions.
Facilities that can produce these technologies require considerable investments.
It’s a plus when a company can generate high enough cash flow to use for financing.
Make our customers successful – this is the
AT&S product
Printed circuit boards are the basis of all
electronic devices. As a production services
provider, AT&S enables its customers –
whether brand manufacturers or suppliers –
to produce unique products. Our success is
their success.
Anticipate the trends in high-end
interconnectivity solutions
Innovation is essential to this. We therefore
develop materials and processes for the most
advanced requirements ahead of time for
serial production. This is how we provide an
advantage to technology and global market
leaders.
Maximum production efficiency
The production of a printed circuit board
involves over 200 steps, in which efficiency
and productivity – and always delivering the
highest quality on time – are the AT&S success
factors. This means continuous investments in
technology and employees so as to generate
high profitability at the peak of technology.
6 AT&S Annual Report 2015/16
from an operational perspective. The prima-
ry growth driver was the Mobile Devices &
Substrates segment, which posted a revenue
increase of 18.6%. Revenue in the Auto­
motive, Industrial, Medical segment rose by
8.2%, mainly resulting from automotive ap-
plications such as driver assistance systems.
A very gratifying contribution was made
by the segment “Other”, which includes
­advanced packaging technology. Revenue in
this segment increased by 102.9%.
EBITDA remained at the level of the pre-
vious year based on a small increase in the
Mobile Devices & Substrates segment and
negative foreign exchange effects in the Au-
tomotive, Industrial, Medical segment. In
addition to revenue, EBITDA and EBIT,
we also include return on capital employed
(ROCE) and the innovation revenue rate
(IRR, share of total revenue generated
from technologically innovative products
introduced in the past three years) in our
five most important key performance in-
dicators. For IRR, we aim for a figure of
greater than 20%. In the reporting year, we
achieved 19.6%. Last year, this figure was
29.2%. The difference is attributable to the
maturity of certain generations of technolo-
gy during the financial year 2015/16. Due
to our commitment in Chongqing, ROCE
declined from 12.0% to 8.2%. Our CFO,
Karl Asamer, provides details about this in
following interview starting on page 10.
Capacity utilisation of our production sites
is one of the most important factors in­
fluencing our earnings development. In the
­financial year 2015/16, we kept this at a very
high level. The product mix in the ­reporting
year also matched our capacity and the tech-
nologies at each of our sites.
At this point I would like to briefly call to
mind, or introduce you to, the essential
points in our strategy.
Our strategy is to earn money at the peak
of technology. We therefore maintain a clear
focus on technologies that are at the high-
end of their respective application and on
applications with good rates of growth. We
are very well positioned in the segments that
will especially benefit in the future from
the trend of total connectivity: ­mobile end
­devices, automotive, industry and medical.
Our broad market coverage gives us the
­ability to take advantage of peak ­technology
in particular segments and then ­leverage
these technologies as needed to ­other
The “Gartner Hype Cycle” is a graphical representation
used worldwide in the IT industry. It shows the phases
of public visibility an innovation receives over the
course of time – from the flash of inspiration all the
way to industrial production. The chart includes only
those applications that are especially relevant for AT&S
with regard to current and future applications.
Plateau will be reached in 5 to 10 years.
TIME
Innovation
Trigger
Peak of
Inflated
Expectations
Trough of
Disillusionment
Plateau of
Productivity
Slope of Enlightenment
As of July 2015,
Source: AT&S, Gartner Inc.
expectations
Wearables
Autonomous Vehicles
Micro Data Centers
IoT Platform
Connected Home
Smart Robots
Internet of Things (M2M)
Augmented Reality
Virtual Reality
EXPECTATIONS
THE HYPE CYCLE IN THE ELECTRONICS INDUSTRY
7Management statement
­segments, generally staggered over time
(details on this can be found in the Strategy
section, beginning on page 16). We always
have to find the right balance when making
optimal use of existing technologies, and
when we step in new directions, evaluate
which competencies we can further develop.
The penetration of additional electronic
functionalities into our daily lives and the
total connectivity of many possible appli-
cations will provide us with opportunities
for further growth. We want to continue
to be the provider who recognises what the
market needs better and earlier than our
competitors. We want to impress the cus-
tomer with the corresponding solutions and
level of quality. We expect that the future of
electronics will be primarily dominated by
a large number of connected, smart ­devices
and the processing of enormous volumes
With the new plant in China and the existing high-end
technologies, we are able to offer a unique technology
and service portfolio to the market.
of data. These trends will fundamentally
change society. However, it is important
to be aware that the implementation and
introduction of various technologies will
take place over different periods of time (see
Gartner Hype Cycle). We therefore build
up our market intelligence on an ongoing
basis, and sharpen our strategy ­continuously.
But one thing is clear: there will always be a
connection platform that enables the func-
tionality of the future. The technological
limits have not yet been reached – but we
are always working on it. Because of the
market segments it targets and the technol-
ogies available, AT&S is best prepared to
support these trends and provide customers
with the right connection platforms.
In order to remain at the top of ­technology,
we work continuously to become even
more efficient. The key opportunity for
­improvement is in accelerating our business
­processes and further optimising our cost
structures. An important aspect of this is to
either ­reduce the complexity in our produc-
tion­processortobettercontrolit.Ultimately,
our customers are the ultimate beneficiaries
by receiving even more reliable quality with
shorter delivery times. For our share­holders,
we want to generate clear added value by
achieving a return on capital employed
(ROCE) which is higher than the weighted
average cost of capital in the printed circuit
board industry. For the medium term, we
have defined a key indicator of 12% ROCE.
Shareholders should also profit from the
success of our business performance in the
form of dividends. More on our dividend
policy in the interview with CFO, Karl
Asamer, on page 10.
Sincerely, Andreas Gerstenmayer, CEO
8 AT&S Annual Report 2015/16
»We now have the
technologies that
will help us drive the
further miniaturisation
and modularisation
required.«
9Management statement
Our Asian tiger
is ready to jump
Chongqing qualification completed within 17 months
Our new plant in China will be our biggest exclamation mark!
We are ready to work on the answers that the market is asking of us.
One thing is for certain: we will deliver. A report by COO Heinz Moitzi.
AT&S is working to develop the trendsetting
answers to the questions of the market. With
the AT&S core competences in research and
development: a profound knowledge of ma-
terials, exceptional process know-how, and a
true understanding of quality. With a grasp
of the general megatrends and for what the
market needs in the future, we work with
our customers to develop a view of where the
technological journey could go. From this
perspective and the knowledge of our cus-
tomers’ needs, we jointly develop the connec-
tion technologies for their future products.
The foundation of our operational success
lies in the optimal balancing of our produc-
tion facilities. It is therefore increasingly im-
portant to adopt state-of-the-art production
techniques such as MES (Manufacturing Ex-
ecution System) or Industry 4.0. As a result
of the cooperation between sales and produc-
tion, which has been successfully practised
for many years, AT&S has succeeded in the
highly efficient utilisation of its facilities by
means of an optimal product mix.
We will face this challenge in the financial
year 2016/17 at the IC substrate plant in
Chongqing. After completing the qualifica-
tion of the individual machines and processes
in record-breaking time, the plant is transi-
tioning step by step to full operation. I can
report that the ramp-up has gone smoothly
so far. This is surely an expression of our
expertise in bringing new technologies and
new processes to serial production readiness
quickly and efficiently.
The IC substrates that we produce for semi­
conductor manufacturers have raised new
technological­questions. These are related to
the important drivers of technology in our
industry: miniaturisation and modularisa-
tion. We currently produce printed circuit
boards with a space of 35 µm (micrometers)
between the individual conducting lines. For
IC substrates, which we now produce in
Chongqing, this space is only 12 µm. Within
the next five years, this trend is going towards
1–2 µm structures. As a result of entering the
new IC substrates segment, we now have
the technologies that will help us drive the
further miniaturisation and modularisation
required, based on our existing technology
tool box.
IC substrates offer us an enormous opportu-
nity – we can now provide the full range of
interconnection technology based on “organ-
ic materials” and use all of the technologies
in our toolbox. In order to create the produc-
tion processes we need in the future to push
miniaturisation towards of 1–2 µm struc-
tures, we are already developing the technol-
ogy needed for this jointly with our suppliers,
universities, and customers. We are learning
to speak the language of the semiconductor
industry as the standards that apply there
will also be required of us in the future. With
respect to basic research, we are part of a
consortium with international research insti-
tutions in the ANSET project. The project
involves the development of printed circuit
boards that cannot be hacked externally –
which is prevented by the hardware. A very
exciting project in times like these.
For research and development and for me in
particular, the subject of resource efficiency
holds great significance. In recent years –
including 2015/16 – we have been able to
steadily reduce water consumption. And
with regard to CO2 emissions, we are on the
right path. In the past financial year, we were
unable to achieve our target of a 5% reduc-
tion. In addition to the higher CO2 burden
»We understand
– and develop –
what the market
will need in the
future.«
resulting from changes in the product mix
and the qualification of new facilities, the
need for energy-intensive cooling increased
at all plants in the past financial year due to
the unusually long periods of extreme heat.
Technological megatrends are taking place
based on the emerging total connectivity –
the interconnection of key electronic devices
with one another. We are therefore working
on medium-term solutions in which AT&S
embedding technology and other features
make it possible to produce a cost-effective
all-in-one module. Applications include
electromobility and autonomous driving,
for example. Short-term R&D priorities
are the next generation of IC substrates and
the next evolution in our core business: sub-
strate-like printed circuit boards or PCBs
based on mSAP (modified semi-additive
process). And, of course, we are working in
our core business to make our manufacturing
and production processes more efficient and
qualitatively even more stable.
10 AT&S Annual Report 2015/16
Can you give us a brief review of the past
­financial year?
Financial year 2015/16 was very successful.
As a result of our concentration on high-end
applications in mobile devices and the au-
tomotive, industrial, and medical areas, we
participated in the further growth of these
segments. We grew at a faster pace than the
market as a whole, with revenue growth of
14.4% to € 762.9 million, and currency-ad-
justed organic sales growth of 5.2%.
Has Chongqing had an impact? What does
this revenue growth mean for the profitabil-
ity of AT&S?
In revenue terms there has been no nota-
ble impact yet. However, EBITDA and
EBIT were both affected by the costs of
the Chongqing project. Without the effects
from Chongqing, EBITDA of € 171.9 mil-
lion would have increased to € 180.2 million
and EBIT of € 98.2 million to € 103.2 mil-
lion. Foreign exchange, which had a consid-
erable positive effect on revenue, ultimately
had a minor impact on the result.
How do you explain this success?
The earnings improvement excluding the
effects from Chongqing is a result of the in-
crease in revenue optimised capacity utilisa-
tion and strict cost control in financial year
2015/16.
How did return on capital employed per-
form compared to the prior period?
ROCE of 8.2% was lower compared to the
prior-year period. The investment so far of
roughly € 290 million for the Chongqing
project, which did not make a contribution
to earnings in the past financial year, had a
negative impact on this key figure. Adjusted
for Chongqing, ROCE was 19.3%, which is
a significant increase over the prior-year fig-
ure of 18.5%. The gearing ratio also rose as
planned compared to last year, from 21.6%
to 46.3%.
On the gearing ratio – what effect has the en-
vironment of low interest rates had on your
financing costs?
We took advantage of both the low interest
rates and the profitability of the company to
issue a promissory note loan of € 221.0 mil-
lion, with a term of 5.6 years and an average
interest rate at the time of issue of 1.6%. We
refinanced the bond, which is to expire in
November 2016, repaid parts of the prom-
issory note loan granted in 2014 ahead of
schedule, and have not had to use the agreed
credit facilities. It is our goal to reduce our
financing costs further and to adjust the
maturities of our financial obligations to
the needs of the business. In selecting our fi-
nancing partners, the most important crite-
ria are the competitiveness of their offers and
their credit rating as well as their presence
in the relevant countries. We therefore work
with well-known international financial in-
stitutions in addition to partners in Austria.
Which business risks do you focus on in
­particular?
Of course, we have key risks on our radar,
and we present them as part of this report in
the Risk Report section. Because of our busi-
ness model, we pay great attention to market
risk so that we can recognise early whether
we are aligned with the correct trend with
respect to technologies, applications, and
markets. It is important that the risks are
also associated with sufficient opportunities.
What opportunities do you see?
AT&S is very innovative, and in the past
year it significantly enhanced its reputation
as a technology partner to the electronics
industry. As a result, we are involved earlier
and more frequently in development pro-
jects, which enables us to strengthen our
position in the market. We expect that, in
the future, this will lead to a rate of reve-
nue growth above that of market growth. By
means of further, constant improvement to
our processes, we can secure and raise the
competitiveness of the Group.
How do you assess the overall economic
­environment and any effects it has on AT&S?
We assume that the positive growth trend in
the USA and the still very robust, if weak-
ened, growth in Asia will have a positive
impact on AT&S and support our planned
growth. And with respect to interest rate de-
velopments, we are assuming little change.
Constant or slightly higher interest rates in
the USA tend to be balanced by constant or
On cash flow, ROCE and
increasing enterprise value
Take advantage of opportunities in turbulent times
Investments in China are the basis for future growth.
Advanced technology continues to be the main
strategic focus for positioning AT&S. A conversation
with CFO Karl Asamer.
»Our goal: reduce financing costs
to below 2%!«
falling rates in China and Europe. Exchange
rates are often defined by short-term trends
and changes could have a corresponding in-
fluence on our business. What is important
for our hedging strategy is that the Asian
currencies continue to be linked to the USD.
One last question – particularly important to
shareholders: What are your plans for a div-
idend for the past financial year?
With the start of the IC substrates invest-
ment project in Chongqing, the earlier
dividend policy was temporarily suspended
and replaced by a fixed amount of € 0.20
per share for the financial year 2013/14
and € 0.36 per share for the financial year
2014/15. At this time of high capital ex-
penditure, the Management Board will aim
for a moderate dividend policy. For the fi-
nancial year 2015/16, we will propose a divi-
dend of € 0.36 per share again to the Annual
General Meeting of Shareholders.
12 AT&S Annual Report 2015/16
Others
§	 Segment revenue: € 22.1 million*
§	 Share of Group revenue: < 1%
Characteristics
§	 Includes the Advanced Packaging
business unit and Group activities
Product portfolio
§	 Embedded component packaging
Group profile
AT&S is the leading manufacturer of printed circuit boards in Europe and globally one of the technology leaders in the printed circuit board (PCB)
industry. AT&S concentrates on high-end technologies and applications in the segments Mobile Devices & Substrates and Automotive, Industrial,
Medical. AT&S is successful among its mostly Asian competition because of its clear focus on the high-end, exceptional process know-how, quality,
efficiency, capacity utilisation and European governance. AT&S has a cost-effective production footprint in close proximity to the customer, with six
production sites in Austria (Leoben, Fehring), India (Nanjangud), China (Shanghai, Chongqing), and South Korea (Ansan). The average number of
employees in the financial year 2015/16 was 8,759. AT&S shares have been listed since 1999, first on the Frankfurt Stock Exchange and, since 2008,
on the Vienna Stock Exchange.
Automotive, Industrial, Medical
§	 Segment revenue: € 326.7 million*
§	 Share of Group revenue: approx. 40%
§	 EBITDA: € 30.1 million
§	 EBITDA margin: 9.2%
Characteristics Stable development due to longer product cycles
of up to 7 years
Application examples
§	 Automotive: advanced driver assistance systems (navigation,
lane change, safety, infotainment), lighting, transmission
control, etc.
§	 Industrial: control solutions (machine-2-machine
communication), etc.
§	 Medical technology: diagnostics, therapies
Product portfolio HDI microvia PCBs – multilayer PCBs –
double-sided PCBs – IMS PCBs – flexible PCBs – semiflexible PCBs –
rigid-flex PCBs – flexible PCBs on aluminium – 2.5D technology
platform
Mobile Devices & Substrates
§	 Segment revenue: € 539.7 million*
§	 Share of Group revenue: approx. 60%
§	 EBITDA: € 126.4 million
§	 EBITDA margin: 23.4%
Characteristics High-end technology driver, volatility due to
seasonal fluctuations, short product cycle of about 12–15 months
for high-end printed circuit boards
Application examples
§	 Communication: smartphones, wearables
§	 Computing: tablets, notebooks, PCs
§	 Consumer electronics: cameras, game consoles
Product portfolio IC substrates – HDI any-layer printed PCBs – HDI
PCBs – multilayer PCBs
ECP: embedded
component packaging
flexible PCBIC substrateHDI microvia PCBHDI any-layer PCB rigid-flex PCB flexible PCB on aluminium
* incl. intersegment revenues
13Group profile / sites
§	 Production in Europe: high product diversity, low volume
§	 Production in Asia: high volume, low product diversity
§	 Sales network spanning three continents
	AT&S plant
	Sales offices/representations
Nanjangud, India
1,160 employees
Leoben, Austria
Headquarters
918 employees
Shanghai, China
4,585 employees
Ansan, korea
275 employees
Chongqing, China
1,380 employees
Fehring, Austria
368 employees
Group sites
73 employees in other locations
14 AT&S Annual Report 2015/16
Value creation chain
Printed circuit board production 
Schematic illustration of the production process of a printed circuit board. Depending on the
number of layers, the production of a printed circuit board can have up to 150 steps.
Resources Production process
Purchase of
resources and
materials
(including copper foil,
cores, prepreg, gold,
tin, silver, laminate,
chemicals, etc.)
Energy
(electricity, heat,
compressed air, etc.)
Water
(for production,
cooling, cleaning)
Employees
(8,759 FTEs on average
in financial year
2015/16)
Extract of
determinants of
the value chain
Processing of
customer data
Core
1.	Insulation material: woven glass
fibers saturated with epoxy resin
2.	Copper foil
Repeat of the
laminate layers and
exposure processes
Up to 26 layers are possibleApplication of the
solder-resist mask
Protects against copper oxidation
on the surface and prevents short-
circuiting between the individual
circuit paths and solderable areas
Expose, develop,
and cure
All inactive areas are covered.
All active areas (soldering pads,
test surfaces, etc.) are cleared
of the solder resist
Contouring
(milling, scoring)
Production planning and
continuous optimisation
R&D basic development,
production processes,
material selection,
problem solving
Internal and external
recycling of waste
Efficient use of resources,
energy, and water
in production
Repetition of the
process steps of cleaning,
lamination, exposure,
development, and etching
Surface coating of the
pads with nickel/gold,
silver or immersion tin
As oxidation protection and to
form a layer that can be soldered
Cleaning the surface
and lamination with
photosensitive film
15Value creation chain
Installation into the end device
Applications of AT&S
printed circuit boards
Smartphones, tablets, digital
cameras, LED headlights, control
systems, driver assist systems,
diagnostic instruments, hearing
aids, pacemakers, robotics,
sensor technology, etc.
Development of the resist
and removal of unneeded
copper foil through etching
Chemical treatment of
the surface area
For better adhesion
Exposure with LDI
(Laser Direct Imaging)
A laser beam exposes all ­areas
that should be preserved after
the etching process
Lay-up and pressing
of core, prepreg and
copper foil at up to
40 bar and 220°C
Mechanical drilling
For connectivity of the
individual copper layers
Quality control
100% test of the electrical
capability, visual inspection
Quality control
Certification of facilities
and processes
Training and continuous
education of employees
Laser drilling
For connectivity
between individual layers
Copper plating
of the drill and laser holes
For electrical conductivity
Assembling the PCB with
semiconductors (microchips),
resistors, capacitors,
etc.
Printed circuit boards are
vacuum-packed (individually
or in trays) and delivered to
the customer
Next steps*
* Not part of the AT&S value chain
First choice
for advanced
applications
16 AT&S Annual Report 2015/16
From vision to strategy
VISION
TARGETS /
KEY PERFORMANCE INDICATORS
Creation of shareholder value
§	Medium-term ROCE of 12%
Expansion of technology
leadership
§	Leading provider in high-end core business
§	Medium term: leading provider in new business areas
§	Innovation revenue rate:  20%
Long-term profitable growth/
be one of the most profitable
providers in the industry
§	Medium-term EBITDA margin target of 18–20%
§	 Medium-term revenue target of € 1 billion
The best employees and
management team members
§	Talent programs
§	 Training and continuing development
§	 Leadership Excellence programme
17
Capital excellence
§	 Equity ratio:  40%
§	Financing costs of  2%
(in a corresponding interest rate environment)
§	 Payback period of debt  3 years
STRATEGY
Sustainable business development
with focus on ROCE
Stable dividend policy
Continuous innovation and focus
on high-end technologies and
applications
Developing and marketing new technologies for new applications
and requirements, and introduction of existing high-end technolo-
gies into developed market segments
Focus on innovative solutions
Industrialisation of new interconnection platforms
through a combination of existing and new high-end
technologies
Focus on applications and
technologies with above-average
growth and long-term profitability
Focus on the highest service level
and customer orientation
Operational excellence
Focus on cash flow generation
Sustainable
business leadership
Benchmark in the industry through reduction of:
§	5% in CO2 emissions p.a.
§	3% in fresh water consumption p.a.
Goals and strategy
18 ATS Annual Report 2015/16
Continuous innovation and focus on high-end technologies and applications:
In order to not only maintain, but also to expand our position at the top of technology – a requirement for
profitable growth – ATS continuously invests in innovative technologies and processes.
ATS uses a dual market strategy
Innovations: ATS develops and markets new technologies for new applications and requirements, such as
further miniaturisation, and therefore addresses the technological trends in the market segments.
One example is mSAP technology (“modified semi-additive Process”), where the printed circuit process is
combined with the substrate process in a new evolution of the printed circuit board. These are the basis for
system-in-board (SiB) solutions. With system-in-board solutions, semiconductors and other active and passive
components in the form of bare dies or packages are integrated into the printed circuit board.
Another example is “center core embedding” technology, which is the evolution of current technology
patented by ATS for embedding active and passive components into the printed circuit board. With center
core embedding, components can now be connected to both sides rather than just one. This is used in power
solutions primarily in the industrial and automotive segments.
Further development: existing technologies and processes undergo continuous further development. Around
€ 40–50 million, known as “maintenance capex” is spent annually on technology upgrades, in part to counter
any commodification of the technology (where the technology can be produced by many), but also to put
tested technologies to use in additional areas of application. An example of this is in the automotive area
where, as a result of its early focus on high-end applications, ATS was able to successfully position itself with
HDI  technology, which had previously been used only in the Mobile Devices segment.
ATS aims to continue as one of the top providers in the high-end business and to be among the most important
players in new technologies. ATS measures its innovative strength with the innovation revenue rate (IRR),
which indicates the percentage of total revenue achieved with new technologies that have been introduced
into the market within the last three years. ATS has defined a target for its Innovation Revenue Rate (IRR) of
over 20%.
Focus on innovative solutions
ATS is strongly focused on providing new interconnection solutions from its “technology toolbox” of existing
and new technologies, and industrialising them for serial production. Using this toolbox, which consists of HDI
any-layer, embedding, IC substrates, interposers, substrate-like printed circuit boards, and cavities (specially
recessed areas), ATS can offer entirely new interconnection platforms to a variety of customers (OEMs,
semiconductor manufacturers, tier 1, OSATs = outsourced semiconductor assembly and test) and reposition
itself as a total connections solutions provider.
Focus on applications and technologies with above-average growth
and long-term profitability
As one of the most profitable providers in the industry today, ATS can firmly support further profitable
growth through its continuous focus on high-end technologies and applications. Through a comprehensive and
meticulous process in the individual business units, current and future applications are chosen from among
hundreds based on their above average market growth (at least in the low double-digit range), their potential
for double-digit EBITDA margins, their need for technology-based high-end structures, and high barriers to
entry overall. ATS has defined a medium-term goal of € 1 billion in revenue and aims again for a medium-term
EBITDA margin in the range of 18–20%.
19Goals and strategy
Focus on the highest service level and orientation on customers
In its role as one of the leading providers of high-end production services, ATS competes primarily with Asian
providers. Our key point of differentiation and high customer loyalty comes not only from the level of our
technology but also from our absolute focus on the customer. These factors are also a major reason for our high
capacity utilisation. ATS’s perception of itself as a partner who can meet even the most complex, individualised
requirements in the widest range of lot sizes must be proven every day. This focus on the customer is ensured,
on one hand, through an extensive sales and engineering team on three continents that is also close to the
customer. In addition, through the introduction of a global Lean Six Sigma process customised for ATS, the
company focuses only on value-creating activities, enabling the highest possible customer orientation and
service.
Operational excellence
One of the major unique selling propositions (USP) that ATS offers customers and one that distinguishes it from
the competition is its sustained level of very high quality and its competitive cost structure. Over 200 individual
steps are needed to produce a high-end printed circuit board. This requires considerable process know-how in
all fields of production such as chemistry, electroplating, and mechanics. Mastering these complex production
processes with the highest degree of efficiency and productivity at all six production sites, while optimising
capacity utilisation, is a key characteristic of the outstanding ATS production management, and it becomes
ever better through continuous improvement. These parameters are measured in part by capacity utilisation,
which ATS measures across all facilities over a given period of time (asset-weighted capacity utilisation) as well
as by costs of quality and revenue per employee. ATS aims to set the benchmark for quality and productivity
in every customer segment.
Focus on cash flow generation
ATS competes in an industry that is shaped by a rapidly changing environment. These developments require
continuous investment for a position at the top of technology. Such investments are needed in rapid cycles
and cause a corresponding need for cash from the business operations. ATS therefore aims to generate
substantial operating cash flow based also on future investments, and thereby strengthen its internal financing
capacity.
Sustainable business development with a focus on ROCE
ATS is clearly committed to creating shareholder value and measures its business performance from the
investors’ point-of-view by means of return of capital employed (ROCE). ROCE shows the extent to which ATS
manages the capital it uses (tangible and intangible assets and net working capital) efficiently and profitably
(the calculation is found in the Management Report). ATS has defined a medium-term ROCE performance
indicator of 12%, which is above the weighted average cost of capital for comparable companies.
Stable dividend policy
Until fiscal year 2011/12, ATS dividend payments were linked to “cash earnings”, the pay-out ratio was on
average 10% of cash earnings.
With the start of the IC-substrates investment project in Chongqing, the earlier dividend policy was temporarily
suspended and replaced by a fixed amount of € 0.20 per share for the financial year 2013/14 and € 0.36 per
share for financial year 2014/15. At this time of high capital expenditure, the Management Board will aim for a
moderate and stable dividend policy for financial year 2016/17 and 2017/18.
20 ATS Annual Report 2015/16
The best employees and managers
As a global technology company in a constantly and profoundly changing environment, the best educated,
most flexible, and highly motivated employees are the key to long-term success. To ensure and continue to
develop expertise, ATS relies on a continuous training and education. It also recruits young, mobile graduates
of the highest calibre by means of its International Talent Programme, and focuses on positioning itself as an
attractive employer in order to recruit experts with relevant experience. A success-oriented and appreciative
corporate culture with clear leadership values derived from its vision and mission is defined as a key to employee
commitment and retention at ATS, and is reinforced through a global leadership program. Further details on
this are found in the Management Report in the employees section.
Sustainable business leadership
Sustainability at ATS does not only mean being a “good corporate citizen”. At ATS, sustainability is a clear
economic consideration. At all of its production sites, ATS has introduced European standards that exceed
local guidelines in many areas of environmental protection, occupational safety, and resource consumption.
These are expressed in clear key performance indicators: ATS has established the target of reducing its total
carbon footprint in kg CO2 per m2
of printed circuit board by 5% annually, and fresh water consumption per m2
of printed circuit board by 3% annually. Social responsibility is demonstrated at each of the individual sites in
the spirit of “think global, act local” in the form of numerous projects primarily in the area of education. The
goal of the ATS sustainability strategy is to unite economy, ecology, and social responsibility in a way that
benefits all stakeholders. Further information can be found in the section Sustainability in the Management
Report and in the Sustainability Report 2015/16.
Capital excellence
A balanced capital structure (equity and debt) embedded in the prevailing interest rate environment forms
the basis for the long-term growth of the Group. ATS has an equity ratio of over 40% as its target for the
corresponding credit standing. In the area of financing, ATS aims for a balanced financial structure with a
variety of financial instruments for the optimal management of financing cost and repayment period. ATS
targets financing costs of less than 2% in the current interest rate environment and a payback period of debt
(net debt/EBITDA) of less than three years. Detailed information can be found in the Management Report or
in the Notes.
21
Consistent portfolio management with
regard to market segments, applications,
customers, and technologies to take
advantage of various seasonalities and
volatilities
Long-term strategy with sufficient
flexibility to be able to anticipate market
developments and be able to respond to
market changes
Quick implementation of new high-end
technologies and processes on
competitive terms at the highest
level of quality
Greatest possible use of mature
technologies for new applications in
developed markets segments
Intelligent combination of different
technologies for new solutions for the
interconnection technology
Competitive production site selection
Maximum customer proximity and high
internal market intelligence for early
detection of trends that will define the
printed circuit board industry
Excellence at all levels of the value creation
chain, from procurement to production to
distribution
Influence and success factors
SUCCESS FACTORSINFLUENCE FACTORS
In a continuously changing environment, ATS has defined key influence and success factors
for sustainable success:
FURTHER ADVANCING OF
THE MINIATURISATION OF
INTERCONNECTION SOLUTIONS
HIGHER PERFORMANCE AND more
DENSE STRUCTURES AT THE SAME TIME
FURTHER COSTS REDUCTIONS
SPEED OF IMPLEMENTING NEW
TECHNOLOGIES INTO SERIAL
PRODUCTION (“INDUSTRIALISATION”)
Influence and success factors
23Report of the Supervisory Board 1
Dear shareholders,
The financial year 2015/16 was another successful year for ATS. Revenue increased further to
€ 762.9 million and the operating result before interest, tax, depreciation and amortisation (EBITDA), with
€ 167.5 million, matched the high level of the previous year, even though start-up effects for the project
Chongqing had an influence on earnings. This performance can be attributed to an unusually high demand in
the first half of the year for printed circuit boards used in mobile devices, and to continuing high demand in
automotive applications. However, ATS could not entirely decouple from the somewhat weaker demand
development in the high-end segment for mobile devices in the third quarter of financial year 2015/16. ATS
is planning to continue the growth path and its technological leadership in several segments in the competi-
tive environment dominated by Asian companies. This should be supported by the successful completion of
the qualification phase in February 2016 and the start of serial production of the new “IC substrate” technol-
ogy, which has now taken place, and expansion of the site in Chongqing, China, for the next generation of
printed circuit boards – the substrate-like printed circuit board. The official opening of the IC substrate plant
took place on 20 April 2016, attended by Chinese public officials including Chongqing's mayor, Huang Qifan,
Austrian officials, representatives from business and the media, customers, the Chairman and First Deputy
Chairman of the Supervisory Board and the Management of ATS.
COMPOSITION OF THE SUPERVISORY BOARD The Supervisory Board of ATS consists of twelve
members. During the financial year 2015/16, elections for the Supervisory Board were held and one change
was effected: At the 21st Annual General Meeting of ATS on 9 July 2015, Hannes Androsch, Willibald Dö-
rflinger, Karl Fink and Albert Hochleitner were re-elected to the Supervisory Board of the company in accord-
ance with the proposal made by the Supervisory Board. The additional members representing shareholder
interests on the Supervisory Board of ATS are Regina Prehofer, Gerhard Pichler, Georg Riedl and Karin
Schaupp.
At the Supervisory Board meeting directly following the Annual General Meeting, Hannes Androsch was
unanimously elected as Chairman of the Supervisory Board, Willibald Dörflinger as First Deputy Chairman,
and Regina Prehofer as Second Deputy Chairwoman.
Effective 28 January 2016, Siegfried Trauch was delegated by the Works Council as an employee representa-
tive on the Supervisory Board, taking the place of Franz Katzbeck. Thus Franz Katzbeck departed the Supervi-
sory Board on this date. The additional employee representatives delegated by the Works Council to the
Supervisory Board are Wolfgang Fleck, Günther Wölfler and Sabine Fussi.
ACTIVITIES OF THE SUPERVISORY BOARD The Supervisory Board met five times during the fi-
nancial year 2015/16, with the participation of the Management Board. Karl Fink and Franz Katzbeck were
excused from two Supervisory Board meetings. Supervising the construction, qualification, certification and
finally the commissioning of the IC substrate plant in Chongqing, as well as the further expansion of the
Chongqing site for the next generation of printed circuit boards, were also key areas of focus of the Super-
visory Board's activities in financial year 2015/16. Proceedings and decisions made by the Supervisory Board
in the past financial year were related to the financing of continued growth and, related to this, the
continuous improvement of the financing structure – as well as further strategic development of the Group:
With the launch of the IC substrate plant in the past financial year, ATS has set the course for further tech-
nological development, but is only just beginning this journey. ATS must not only continue to develop this
largest single investment and successfully bring it to market, but also profitably expand the existing business
and position ATS precisely and quickly in the value chain of the electronics industry that is changing with
ever greater speed and force, and in the appropriate customer segments.
The production site ATS Korea Co., Ltd. in Ansan (South Korea) has now been 100% integrated into the
Group with the acquisition of a remaining minority share.
Report of the Supervisory
Board
Report of the Supervisory Board
24 ATS Annual Report 2015/162 ATS Annual Report 2015/16
Again, in the financial year 2015/16, the Supervisory Board diligently exercised its tasks and duties as required
by law, the Articles of Association, the Austrian Corporate Governance Code (ÖCGK) and its rules and proce-
dures. In the financial year from 1 April 2015 to 31 March 2016, the Supervisory Board was regularly in-
formed by the Management Board through a continuous, open exchange of information and opinions, as well
as comprehensive oral and written reports about the market situation, strategy, operating and financial
position of the Group and its investments, staff situation and planned capital expenditures. The Supervisory
Board took the respective decisions accordingly. The Supervisory Board was able to confirm a functioning
Issuer Compliance system. Between meetings of the Supervisory Board, the Chairman of the Supervisory
Board and his Deputy were regularly informed by the Management Board of business developments.
SUPERVISORY BOARD COMMITTEES The Supervisory Board has established an Audit Committee
and a Nomination and Remuneration Committee as standing committees. In the 2014/15 financial year, the
Supervisory Board also established a “Financing” Project Committee. The respective committees established,
carried out detailed analyses of particular matters and reported their findings to the Supervisory Board:
The Audit Committee, consisting of Regina Prehofer (Chairwoman), Gerhard Pichler (finance expert), Georg
Riedl, Wolfgang Fleck and Günther Wölfler, focused primarily on the review of the annual and consolidated
annual financial statements for the year ended 31 March 2015 and on planning and preparation for the audit
of the annual and consolidated annual financial statements for the financial year 2015/16. Through
discussions with the Auditor, inspection of relevant documents and discussions with the Management Board,
it obtained a comprehensive view. The Audit Committee also monitored the effectiveness of the company-
wide internal control system and the Group's internal audit and risk management systems. The Audit
Committee reported to the full Supervisory Board with respect to this monitoring and found no deficiencies.
The Audit Committee convened twice in the past financial year. The meetings, both of which were attended
by all committee members, were chaired by Regina Prehofer, who also was regularly involved in quarterly
reporting in this function and reported on these matters to the Supervisory Board.
At the Supervisory Board meeting that took place following the Annual General Meeting on 9 July 2015, the
following members of the Supervisory Board were unanimously elected as members of the Nomination and
Remuneration Committee: Hannes Androsch (Chairman), Willibald Dörflinger (Deputy Chairman), Georg
Riedl, Wolfgang Fleck, Günther Wölfler; accordingly, Karl Fink and Albert Hochleitner departed from this
committee. The Nomination and Remuneration Committee met three times in the past financial year. At two
of these meetings, Hannes Androsch was represented by Willibald Dörflinger; employee representatives did
not take part in two meetings which were exclusively concerned with regulation of the relationship between
the company and its Management Board members. One focus of the activities of the Nomination and
Remuneration Committee's activities was the further development of the company's remuneration and
incentive systems in line with the market.
In financial year 2014/15, the Supervisory Board resolved to establish a Project Committee with respect to
the implementation of various measures for debt financing, including providing approval for implementation
of the relevant transactions. The Project Committee was empowered to grant all further approvals required
from the Supervisory Board for borrowings, as well as the precise terms and conditions in this respect. The
Project Committee consisted of Hannes Androsch (Chairman), Willibald Dörflinger, Regina Prehofer, Wolf-
gang Fleck and Günther Wölfler. The Project Committee met once during the financial year 2015/16, with all
committee members taking part, and discontinued its activities on 24 September 2015 – after the Super-
visory Board passed a resolution approving a number of debt financing measures as requested by the
Management Board and supported by the Project Committee. Subsequently, matters of financing were again
discussed exclusively by the full Supervisory Board.
SELF-EVALUATION OF THE SUPERVISORY BOARD The Supervisory Board annually performs
self-evaluation, as it did again in the financial year 2015/16, to ensure the continuous improvement of its
working practices and the fulfillment of its responsibilities to the shareholders and other stakeholders. The
25Report of the Supervisory BoardReport of the Supervisory Board 3
annual evaluation carried out by the Supervisory Board confirmed that its regular practices meet the re-
quirements of the Austrian Stock Corporation Act and the Austrian Corporate Governance Code (ÖCGK), and
that its organisation, work practices and orientation in the interest of the shareholders and all other stake-
holders are effective. The self-evaluation will continue to constitute an important component of critical re-
view by the Supervisory Board of its own activities.
ANNUAL FINANCIAL STATEMENT AND DIVIDENDS The Supervisory Board of ATS proposed
that PwC Wirtschaftsprüfung GmbH, Vienna be appointed Company and Group auditors for the financial year
2015/16. The proposal was approved by the Annual General Meeting of 9 July 2015.
The annual financial statements of AT  S Austria Technologie  Systemtechnik Aktiengesellschaft and the
consolidated financial statements for the year ended 31 March 2016 were both audited by PwC
Wirtschaftsprüfung GmbH, Vienna, and were awarded an unqualified audit report. The management report
and the Group Management Report for the financial year 2015/16 were consistent with the annual financial
statements and the consolidated financial statements. Based on the prior discussions of the Audit Commit-
tee, and following its own detailed discussions and examination, the Supervisory Board approved the Compa-
ny's annual financial statements for the year ended 31 March 2016 in accordance with Section 96 (4) Austrian
Stock Corporation Act (AktG). Also based on the prior discussions of the Audit Committee, and after its own
detailed consideration and examination, it approved the consolidated financial statements drawn up in ac-
cordance with Section 245a Austrian Commercial Code (UGB) and with IFRS, as well as the Management
Report, the Group Management Report and the Corporate Governance Report. The Supervisory Board re-
view, which included extensive discussions with the auditors, did not give rise to any objections. Pursuant to
the recommendation of the Audit Committee, the Supervisory Board of ATS will propose to the 22nd Annu-
al General Meeting that PwC Wirtschaftsprüfung GmbH, Vienna be appointed Company and Group auditors
for the financial year 2016/17.
The Supervisory Board adopts the Management Board's recommendation for the allocation of profits. Ac-
cordingly, from the reported net profit as at 31 March 2016 amounting to € 40,075,119.15 (whereof distrib-
utable: € 38,493,735.07), an amount of € 13,986,000.00, which corresponds to € 0.36 per share, should be
distributed as dividends. The remaining amount of € 26,089,119.15 should be carried forward.
THANKS TO THE MANAGEMENT BOARD AND ALL ATS EMPLOYEES The past financial
year was particularly challenging, marked by the requirements of the existing business as well as the contin-
ued construction, qualification, certification and commissioning of a highly modern new production site for
IC substrate technology, which is new for ATS. Finally, the Supervisory Board would like to express its
gratitude and acknowledgement to the entire Management Board and all employees for their outstanding
achievements and commitment in the past financial year.
On behalf of the Supervisory Board
Leoben-Hinterberg, 6 June 2016
Hannes Androsch m.p.
Chairman of the Supervisory Board
26 ATS Annual Report 2015/162 ATS Annual Report 2015/16
DEVELOPMENTS IN THE CAPITAL MARKET Persistent volatility with high short-term price fluctua-
tions was the defining characteristic of development in the global capital markets in the past financial year.
The first months of financial year 2015/16 were dominated by the continuing uncertainty of Greece remain-
ing in the Eurozone. Nevertheless, both the DAX and ATX as well as the Dow Jones Industrial (DJI) indexes
already reached their high for the year in the first quarter of the financial year 2015/16. Concerns about the
economic performance in China, which had been fed by a devaluation of the Chinese currency, resulted in
broad share price losses on all relevant capital markets. In December 2015, after the US central bank trig-
gered a positive reaction on the markets with its decision to raise interest rates for the first time in nearly a
decade, the drop in the price of crude oil in the last quarter of the financial year – temporarily falling to its
lowest point in 13 years – shaped the performance of the financial markets. Combined with renewed turbu-
lence on Chinese stock exchanges, this caused extensive price losses from which the markets were able to
recover to some extent during the final weeks of the financial year. In light of these events, the performance
of the Dow Jones Industrial in USA amounted to -0.5% in the period from April 2015 to March 2016. The
technology-focused NASDAQ 100 stock index gained 3.5% in the same period. After major fluctuations over
the course of the financial year, the key German index DAX closed at the end of March with a decline of
16.7% compared to the beginning of April 2015. The share index for Europe as a whole, the Euro Stoxx 50,
declined by 18.7%. In unison with international capital markets, the Viennese benchmark index, the ATX, as
well as the broader ATX Prime, partly recovered from their lows at the start of the 2016 calendar year, and
lost 9.5% and 7.6% respectively.
ATS SHARE PERFORMANCE AND LIQUIDITY The ATS share began the financial year 2015/16 at a
price of € 14.72 and reached its high for the reporting period of € 16.35 at the beginning of August 2015. In
line with events on international capital markets, there was a subsequent price correction until the low of
€ 10.12 was recorded in February 2016. The ATS share then performed well in the last weeks of the finan-
cial year and significantly recovered from its low point. The price at the end of the reporting period on 31
March 2016 was € 12.90. For financial year 2015/16, this corresponds to a decline of 11.8% (closing price on
31 March 2015: € 14.62). Compared to the ATX Prime Index of the Vienna Stock Exchange, which fell by 7.6%
in the past financial year, this represents a slightly below-average performance. The average daily trading
volume for 2015/16 was 65,400 shares (single-counted). ATS shares were traded for a total value of
€ 225.9 million in the reporting year, resulting in an average daily turnover of € 914,387 (prior year:
€ 693,255). The increase in trading volume was also essential for the first-time inclusion of ATS in the lead-
ing Austrian benchmark, the ATX, of which the ATS share has been a part since 21 March 2016. The ac-
ceptance criteria for the ATX are the average daily trading volume over the past twelve months and the free-
float capitalisation as of the end of February 2016. ATS has also been included since June 2015 in the Aus-
trian sustainability index, VÖNIX. This index consists of the shares of companies that stand out from their
peers with respect to ecological and social activities and performance.
Investor Relations
ATS share at a glance
Initial listing
16 July 1999
Frankfurt, “Neuer Markt”
starting 20 May 2008
Vienna, Prime Market
Number of ordinary shares
38,850,000
Securities Identification No.
969985
ISIN Code
AT0000969985
Ticker symbol
ATS
Reuters
ATS.VI
Bloomberg
ATS AV
Indices
ATX, ATX GP, WBI, VÖNIX
Investor Relations
120%
100%
80%
60%
ATS	 ATX Prime 	 Tec DAX
27
ANNUAL RESULTS
2014/15
§	Record year for ATS
§	Revenue: + 13.1%, EBITDA: +
31.8%, EBITDA margin: 25.1%,
earnings per share of €1.78
§	One of the most profitable
companies in the printed circuit
board industry
Q1 2015/16
§	Limited seasonality
§	Increase in revenue of 37.6%,
EBITDA margin 23.4%,
earnings per share rise by
159.2% to €0.50
§	Revenue guidance increase
to €725 million
H1 2015/16
§	Very high capacity utilisation
§	Increase in revenue of 28.2%,
EBITDA margin 24.1%, and
earnings per share rise to €1.08
§	Further revenue guidance
increase to €740 million
§	Revenues from advanced
packaging technology triple
and achieve positive earnings
Q1–Q3 2015/16
§	Growth significantly
stronger than the printed
circuit board market
§	Increase in revenue of
19.4%, EBITDA margin at
24.0%, and earnings per
share at €1.55
§	Slight weakening in
demand for mobile end
devices in the last months
of the 3rd quarter
APR MAY JUN JUL AUG SEP OCT NOV DEC JAN FEB MAR
EXTERNALEVENTSINTERNALEVENTS
§	Announcement of Chongqing expansion
§	Start of construction –
Chongqing Plant II
§	Capital Markets Day in Chongqing
§	21st Annual General Meeting
§	Listing in the VÖNIX sustainability index
§	Listing on
the ATX
index
§	ATS share price high of € 16.35
§	Conclusion of promissory note loan agreement
for around € 221.0 million
§	Roof topping-off ceremony for Chongqing II
§	ATS cooperation with Fairphone
§	Start serial
­production of
IC substrates
Qualification and certification of Chongqing plant I
§	Greek referendum on reform measures
§	The FED declines an increase in
interest rates
§	­VW scandal emerges
§	Euro Stoxx 50 falls to just under
3,000 points
§	ECB does not fulfill expectations of a further
loosening of monetary policy
§	The FED raises interest rates
§	Tec DAX reaches its high for the reporting
period of 1,889 points
§	Trading volume on the Vienna Stock Ex-
change rises by 24%
APRIL TO AUGUST 2015:
uncertainty over Greece remaining in the Eurozone
§	High for the year for the ATX at 2,681 points
§	New high for the Dow Jones at 18,351 points
§	DAX reaches new all-time high
of 12,391 points
§	Equity markets in China fall by more than 30%
§	Renminbi devalued
§	DAX below 10,000 points, Dow Jones below 16,000 points
§	Rising tensions between
Turkey and Russia
§	Turbulence on equity markets
in China
§	Share prices fall globally,
Dow Jones again below
16,000 points
§	Crude oil temporarily
falls to 13-year low
§	Tec DAX temporarily
falls to under 1,500
points
§	DAX falls below 9,000
points, ATX falls below
2,000 points
§	ATS Technology Forum
28 ATS Annual Report 2015/16
6 ATS Annual Report 2015/16
Key Stock figures Unit 2015/16 2014/15 2013/14
Closing price at 31 March € 12.90 14.62 8.75
High € 16.35 15.55 9.12
Low € 10.12 7.68 6.15
Market capitalisation, end of reporting period € in millions 501.2 568.0 339.9
Average share turnover per day € in thousands 914.4 693.3 496.6
Average number of shares traded per day Shares 65,400 67,000 50,200
Dividend per share1)
€ 0.36 0.36 0.20
Dividend yield (at the closing price) % 2.8% 2.5% 2.3%
Earnings per share € 1.44 1.78 1.24
Carrying value per share € 14.64 15.56 10.06
Price-earnings ratio per share - 8.96 8.21 7.06
1)
2015/16: Proposal to the Annual General Meeting on 7 July 2016.
DIVIDEND POLICY Through to the financial year 2011/12, the amount of the ATS dividend was linked to
“cash earnings”. On average, approximately 10% of cash earnings was distributed as dividends. With the start
of the IC substrates investment project in Chongqing, this dividend policy was temporarily suspended and
replaced by a fixed amount of € 0.20 per share for the financial years 2012/13 and 2013/14, and € 0.36 per
share for the financial year 2014/15. For the financial year 2015/16, the Management Board will propose a
dividend of € 0.36 per share to the Annual General Meeting on 7 July 2016.
SHAREHOLDER STRUCTURE Regional split as % of shares outstanding (free float)
ANALYSIS OF THE ATS SHARE As at 31 March 2016, the ATS share was analysed by the following
eight investment banks.
Investment bank Recommendation Investment bank Recommendation
Berenberg Bank Buy Kepler Cheuvreux Hold
Erste Group Buy Oddo Seydler Research Neutral
Hauck  Aufhäuser Hold Raiffeisen Centrobank Hold
HSBC Buy Wood  Company Buy
The names of the analysts and the respective analysis date and price target are available on the website
www.ats.net/investors.
65.9%
17.8%
16.3%
Free Float
Dörflinger Private Foundation*
Androsch Private Foundation* *including direct and indirect holdings
Regional Split as % of shares outstanding (Free Float)Shareholder structure
Other Investors:
5.2%
Free Float not identified:
14.9%
Private Investors:
36.9%
Institutional Investors
Continental Europe (excl. Austria): 8.9%
Institutional Investors
North America: 9.6%
Institutional Investors
UK  Ireland: 6.2%
Institutional Investors
Austria: 18.3%
Investor Relations 29Investor Relations 7
ROADSHOWS ATS continued its extensive programme of roadshows in financial year 2015/16, providing
information to existing and potential investors, both private and institutional, as well as analysts as part of
over 20 roadshows and investor conferences as well as numerous teleconferences and individual meetings
and a Capital Markets Day. The programme covered relevant capital market centres in Europe, Asia and the
USA. At the centre was information about development of the new plant for IC substrates in Chongqing and
the progress toward the certification as the start of serial production. In connection with this, the Capital
Markets Day was held in June 2015 in Chongqing to give the participants a first-hand view directly at the site.
A medium-term technology roadmap was also outlined. Further important topics in the dialogue with the
capital market participants were the current trends in the market and in technology as well as the develop-
ments in the customer segments.
CAPITAL MARKET COMMUNICATION The ATS investor relations team is committed to transparent,
proactive and continuous communication with all capital market participants on an equal basis. By means of
comprehensive dialogue and by providing information that is timely and relevant, we aim to reinforce long-
term confidence in ATS, its business model and the associated opportunities and risks. All relevant infor-
mation for capital market participants is available on our comprehensive Investor Relations website at
http://www.ats.net/investors, and information can also be sourced through the ATS Twitter page
(@ATS_IR_PR) and YouTube channel (ATundS). For greater transparency and the equal treatment of all
shareholders, ATS broadcasts its Annual General Meeting and twice-yearly press conferences on the Inter-
net. In connection with this, the Investor Relations team is also pleased to receive requests and feedback on
the Shareholders Hotline (see Contact). We cordially invite all shareholders to attend the next Annual General
Meeting on 7 July 2016. All current and complete information is published on the website. The resolutions
from the last Annual General Meeting as well as all information and documents are also available on the
website.
Financial Calendar
27 June 2016 Record date Annual General Meeting
07 July 2016 22nd
Annual General Meeting
26 July 2016 Ex-dividend day
27 July 2016 Record date dividend
28 July 2016 Dividend payment day
28 July 2016 Results for the first quarter 2016/17
03 November 2016 Results for the first half-year 2016/17
31 January 2017 Results for the first three quarters 2016/17
09 May 2017 Annual results 2016/17
CONTACT/SHAREHOLDER’S HOTLINE
Elke Koch
Phone.: +43 (0)3842 200-5925
Email: ir@ats.net
31Corporate Governance Report
Corporate Governance Report
TABLE OF CONTENTS
Principles and Corporate Governance Declaration   32
ATS AG Management Board   34
ATS AG Supervisory Board   36
	 Composition   37
	 Independence of Supervisory Board members   39
	Diversity   40
	 Agreements requiring approval   40
	 Committees   40
Remuneration Report: Management and Supervisory Boards   43
Directors’ Holdings  Dealings   47
Other codes of conduct   48
	 Code of Business Ethics and Conduct   48
	 Capital market compliance   48
	 Advancement of women in senior management   48
32 ATS Annual Report 2015/168 ATS Annual Report 2015/16
CORPORATE GOVERNANCE CODE In Austria, the Corporate Governance Code (ÖCGK) drawn up by the
Working Group for Corporate Governance under the guidance of the government authorities responsible for
the Austrian capital markets has been in force since 1 October 2002. Since then it has been reviewed annually
in light of national and international developments and amended where necessary.
The objective of the ÖCGK is the responsible management and control of enterprises for the purpose of
sustainable, long-term value creation, with a high level of transparency for all stakeholders.
Its basis is provided by the provisions of Austrian company, stock exchange and capital markets legislation,
the EU recommendations concerning the responsibilities of Supervisory Board members and the remunera-
tion of directors, and the principles of the OECD guidelines for corporate governance.
The rules of the ÖCGK are divided into three categories:
 L-Rules (legal requirements): rules based on mandatory statutory requirements
 C-Rules (comply or explain): rules from which any departure must be explained and justified
 R-Rules (recommendations): rules in the nature of recommendations, where non-compliance need neither
be disclosed nor explained.
The version of the ÖCGK currently in force can be downloaded from the Working Group's website at
www.corporate-governance.at. An English translation of the Code and interpretations of the Code prepared
by the Working Group are also available there.
ATS shares have been listed on the Vienna Stock Exchange since 20 May 2008. In order to qualify for inclu-
sion in the Prime Market, companies must provide an undertaking to comply with the ÖCGK. ATS has there-
fore expressly subscribed to the ÖCGK since its shares were listed.
AT  S Austria Technologie  Systemtechnik Aktiengesellschaft (ATS) declares its adherence to the Austrian
Corporate Governance Code (ÖCGK) as amended in January 2015, and submits this corporate governance
report in accordance with Section 243b Austrian Business Code (UGB). This report also forms part of the
Annual Report for the financial year 2015/16. It is also available on the company's website, www.ats.net,
under Company – Corporate Governance – Reports. With the following declarations of undertaking, ATS
complies as of 31 March 2016 with the provisions of the Code as amended in January 2015:
C-RULE 18A Internal Audit conducts regular group-wide reviews based on an audit plan approved by the
Audit Committee, which includes measures to fight corruption in the Group. It reports to the Audit Commit-
tee on this matter regularly and also if warranted by particular events.
C-RULES 27–28A AND ALL RELATED PROVISIONS These rules were amended in the course of the
review of the ÖCGK in December 2009 and came into force on 1 January 2010. Rules 27, 27a and 28 con-
tained in the version of January 2010 only apply to contracts concluded after 31 December 2009. C-rules 27-
28a were therefore not applicable with respect to the original agreement appointing Heinz Moitzi to the
Management Board and were also not applied in full when that agreement was extended in 2013. Due to the
short period between the most recent revision of the Austrian Corporate Governance Code and the appoint-
ment of Andreas Gerstenmayer as Chairman of the Management Board in mid-December 2009, and in order
to avoid any departure from the remuneration regulations applicable to the appointment of Mr Moitzi, the
new rules were not taken into account when the agreement with Andreas Gerstenmayer was signed in Janu-
ary 2010, nor when his Management Board appointment was renewed in 2013. This was not considered
necessary because the Group’s stock option scheme had already expired (see below). Furthermore, the Man-
agement Board and Supervisory Board work closely together on the long-term development of the Group.
The Supervisory Board and the Nomination and Remuneration Committee also regularly analyse the broader
Principles and Corporate
Governance Declaration
33Corporate Governance ReportCorporate Governance Report 9
long-term orientation of Management Board remuneration. The following deviations from the rules currently
require explanation:
The Group's now-expired stock option scheme did not require the beneficiaries to hold shares in the Group,
and provided only for a vesting period of two years before a part of the options acquired could be exercised.
The stock option scheme in question has expired, with the last allocation having been made on 1 April 2012.
Options granted under this scheme may still be exercised until 31 March 2017.
After extensive planning, a long-term incentive (LTI) programme for the Management Board and key staff
was implemented by resolution of the Supervisory Board on 3 July 2014 as a replacement for the stock option
scheme that expired with the last distribution on 1 April 2012. The new programme is based on stock appre-
ciation rights (SAR). The Management Board and Supervisory Board also work continuously to raise the
performance of ATS Group still further with respect to non-financial targets. However, in order to maintain
the transparency and traceability of target achievement as it relates to variable long-term remuneration, no
fixed non-financial criteria for remuneration under the long-term incentive programme are stipulated. Details
of this long-term incentive programme can be found in the section on Management Board remuneration.
The variable remuneration of the Management Board in financial year 2015/16 (not in the form of stock
options and SAR), which was accounted for in total remuneration and for which provisions have been estab-
lished until payout in financial year 2016/17, was dependent on the achievement of three performance indi-
cators defined in the budget for the respective financial year: return on capital employed (ROCE), cash earn-
ings, each with a 45% weighting, and the innovation revenue rate (IRR), with a 10% weighting. The basic
prerequisite for awarding this variable remuneration is positive EBIT for the Group as a whole for the financial
year and attainment of the target EBIT for the Group as a whole by at least 70% (the hurdle rate). If these
key performance indicators are exceeded, bonuses are restricted to a maximum of 200% of the annual bonus
set out in the contract of employment. The inclusion of IRR is of major importance in giving variable remu-
neration a long-term focus because innovation strength – the development of new technologies, products or
product types – is a crucial factor for the future business success of the Group. It can also be reliably
measured. IRR represents the share of total revenue generated from technologically innovative products
introduced in the past three years. The three-year reference period provides a long-term component of variable
remuneration.
Management Board members are contractually entitled to termination benefits in accordance with the Sala-
ried Employees Act (AngG), applied mutatis mutandis (“old system for severance pay”), if their appointments
are terminated. In the event of premature termination of a Management Board member's appointment by
the respective board member for reasonable cause, or where the function becomes obsolete for legal rea-
sons, remuneration is payable until the end of the appointment contract, and not necessarily for a maximum
of two years. Where a Management Board member resigns their appointment or is removed from office for
severe breach of duty, and in the event of death, payment of salary ceases at the end of the applicable
month. Subject to termination provisions in accordance with the Salaried Employees Act, compensation
payments in the case of premature termination of Management Board appointments, even if without good
cause, could exceed more than two years' total remuneration in exceptional cases.
34 ATS Annual Report 2015/16
As a collective executive body, the Management Board is jointly responsible for the management of the
company. Each member of the Management Board is also responsible for defined areas of the business, in
addition to their collective responsibility. Management Board members have a duty to keep each other in-
formed of all important business events and transactions. Fundamental issues of business policy and major
decisions require a joint decision by all Management Board members. Meetings of the Management Board
are characterised by a culture of open discussion. If unanimous agreement is not reached on such decisions,
the Chairman of the Supervisory Board must be informed without delay. The Supervisory Board must also be
informed of all proposed decisions with far-reaching consequences. The Management Board is required to
obtain the prior consent of the Supervisory Board for business transactions as stipulated by law and the
Articles of Association or rules and procedures issued by the Supervisory Board to the Management Board.
Internal Audit reports directly to the Management Board. The audit plan and any material outcomes must be
reported to the Audit Committee of the Supervisory Board at least once a year. The rules and procedures of
ATS's Management Board require the Board to meet at least once a month. In the past financial year there
were a total of 24 Management Board meetings. Written minutes of all Board meetings and decisions are
required.
As at 31 March 2016 and during the entire reporting period, the Management Board of ATS was composed
of Andreas Gerstenmayer as Chairman (CEO), Karl Asamer as Deputy Chairman and Chief Financial Officer
(CFO) and Heinz Moitzi as Chief Operating Officer (COO).
In addition to the statutory collective responsibility, functional responsibility is allocated to the members of
the Management Board as follows:
a) Andreas Gerstenmayer is Chairman of the Management Board (CEO) and responsible for:
 Sales and Marketing
 Human Resources
 Investor Relations, Public Relations and Internal
Communications
 Business Development  Strategy
 Compliance
 CSR  Sustainability
b) Karl Asamer is Deputy Chairman of the Management Board with responsibility as CFO for:
 Finance and Accounting, Treasury
 Controlling
 Legal Affairs, Risk Management and Internal Audit
 IT and Organisation
 Procurement
c) Heinz Moitzi is COO, with responsibility for:
 Research  Development (RD)
 Operations
 Quality Management
 Business Process Excellence
 Environment
 Safety
ATS AG Management Board
35Corporate Governance ReportCorporate Governance Report 11
Andreas Gerstenmayer was born on 18 February 1965 and is a German citizen. He is a
graduate of the Production Engineering programme at Rosenheim University of Applied
Sciences. In 1990, he joined Siemens in Germany, working first in lighting, and then hold-
ing various management positions in the Siemens Group. In 2003, he was appointed
Managing Director of Siemens Transportation Systems GmbH Austria and CEO of the
Drive Technology business unit in Graz (global headquarters). He was first appointed to
the Management Board on 1 February 2010 and his current term ends on 31 January
2018. Mr Gerstenmayer holds no supervisory board memberships or similar positions in
other companies in Austria or abroad that are not included in the consolidated financial
statements. On 26 January 2012, the Provincial Government of Styria passed a resolution appointing
Mr Gerstenmayer to the advisory committee of the Styrian Research Council (Forschungsrat Steiermark).
Karl Asamer was born on 19 January 1970. He has a degree in business administration
from Johannes Kepler University in Linz. Before joining ATS, he worked for the Geka
Group in Bechhofen, Germany, where he was managing partner. Prior to that, his respon-
sibilities included financial management at Sell GmbH, the leading manufacturer of air-
craft galleys for wide-body aircraft, and Magna Closures Europe, a division of automotive
components supplier Magna. Mr Asamer is managing partner of Asamer GmbH, located
in Ansbach, Germany. He became a member of the Management Board of ATS on
1 April 2014. His current term ends on 31 March 2017. Mr Asamer holds no supervisory
board memberships or similar positions in other companies in Austria or abroad that are
not included in the consolidated financial statements.
Heinz Moitzi, born on 5 July 1956, studied electrical installation with Stadtwerke Juden-
burg (Judenburg municipal utility company) from 1971 to 1975. From 1976 to 1981 he
attended the Austrian higher technical college (HTBL), where he completed his certificate
in electrical engineering. In 1981 he was a measurement engineer at the Leoben Universi-
ty of Mining and Metallurgy. Mr Moitzi has been with ATS since 1981, first as head of
the mechanics and electroplating department, then as production and plant manager at
Leoben-Hinterberg. From 2001 to 2004 he was project leader and COO of ATS in Shang-
hai. Upon his return, he assumed the position of Vice President of Production. He was
first appointed to the Management Board on 1 April 2005, and his current term ends on
31 March 2018. Mr Moitzi holds no supervisory board memberships or similar positions in other companies in
Austria or abroad that are not included in the consolidated financial statements.
36 ATS Annual Report 2015/1612 ATS Annual Report 2015/16
ATS AG Supervisory Board
Date of birth Date of first appointment End of current appointment
Independent
according to
ÖCGK rule
Hannes Androsch 18.04.1938 30.09.19951)
26th AGM 2020 -
Willibald Dörflinger 20.05.1950 05.07.2005 26th AGM 2020 53, 54
Regina Prehofer 02.08.1956 07.07.2011 22nd AGM 2016 53, 54
Karl Fink 22.08.1945 05.07.2005 26th AGM 2020 53, 54
Albert Hochleitner 04.07.1940 05.07.2005 26th AGM 2020 53, 54
Gerhard Pichler 30.05.1948 02.07.2009 25th AGM 2019 53
Georg Riedl 30.10.1959 28.05.1999 22nd AGM 2016 53
Karin Schaupp 23.01.1950 07.07.2011 22nd AGM 2016 53, 54
Wolfgang Fleck 15.06.1962 03.09.20082)
n.a.
Sabine Fussi 12.10.1969 14.09.20112)
n.a.
Franz Katzbeck 11.02.1964 15.10.20132) 3)
resigned3)
n.a.
Siegfried Trauch 30.08.1960 28.01.20162) 3)
n.a.
Günther Wölfler 21.10.1960 10.06.20092)
n.a.
1)
ATS was originally established as a private limited company (GmbH). The shareholders' meeting of 23 June 1995 passed a resolution to change the company
into a public limited company (AG), and appointed Supervisory Board members including Hannes Androsch. The AG was registered in the Register of Companies
on 30 September 1995.
2)
Appointed by the Works Council; date of first appointment in this case is either the date of the first Supervisory Board meeting attended or the date of notifica-
tion to the Supervisory Board of the appointment.
3)
Siegfried Trauch was appointed to the Supervisory Board by the Works Council effective 28 January 2016, replacing Franz Katzbeck.
The Supervisory Board monitors and supervises Management, and is responsible for decisions that are of
fundamental importance to, or involve the strategic focus of, the Group.
Throughout the financial year from 1 April 2015 to 31 March 2016, the Supervisory Board received written
and oral reports from the Management Board on the Group's policies and performance, and was closely
involved in all business issues. The Supervisory Board met five times during the financial year 2015/16, with
the participation of the Management Board.
In these meetings, the Management Board and the Supervisory Board discussed the economic position of
ATS Group in depth. As part of the Group's ongoing reporting process and at all board meetings, the Man-
agement Board gave the Supervisory Board comprehensive reports on the Group's operating and financial
position, and on its investments in other companies, the staff situation and planned capital expenditures. In-
depth discussions focused primarily on debt financing, progress on the entry into the IC substrate market and
the associated qualification for production and ramp-up of serial production, as well as the further expansion
and strategic direction of new site in Chongqing, China, and the Group as a whole.
ATS's commitment to the principles of good governance is reflected in the open discussions that take place
within and between the Management Board and the Supervisory Board. In the financial year 2015/16, the
Supervisory Board again carried out its annual self-evaluation to ensure the continuing improvement of its
working practices and the fulfilment of its responsibilities to the shareholders and other stakeholders. The
annual evaluation carried out by the Supervisory Board confirmed that its regular practices meet the re-
quirements of the Austrian Stock Corporation Act and the Austrian Corporate Governance Code (ÖCGK), and
that its organisation, work practices and orientation in the interest of the shareholders and all other stake-
holders are effective. The self-evaluation will continue to constitute an important component of the Supervi-
sory Board's critical review of its own activities.
ATS AG Supervisory Board
37Corporate Governance ReportCorporate Governance Report 13
COMPOSITION
SHAREHOLDER REPRESENTATIVES
Hannes Androsch, Chairman of the Supervisory Board, was first appointed on 30 September 1995. His cur-
rent appointment runs until the 26th Annual General Meeting in 2020.
Mr Androsch is an industrialist who, from 1970 to 1981, was Austrian Federal Minister of Finance. Between
1976 and 1981 he was also Vice Chancellor of the Republic of Austria. From July 1981 until 1988 he was
Managing Director of Creditanstalt-Bankverein. In 1994, together with Willibald Dörflinger and Helmut Zoidl,
he carried out a management buyout of ATS. Hannes Androsch holds interests in a number of well-known
Austrian businesses.
Willibald Dörflinger, First Deputy Chairman of the Supervisory Board, was initially appointed to the Board on
5 July 2005. His current appointment runs until the 26th Annual General Meeting in 2020.
Mr Dörflinger began his professional career in 1972 at M. Schmid  Söhne, before moving to Honesta, Holz-
und Kunststoffwarenindustrie in 1974. In 1978 he became head of technical procurement at EUMIG Elektri-
zitäts- und Metallwaren Industrie GesmbH; from 1980 he was head of the department for circuit boards and
surface technology, and Managing Director from 1986 to 1990. From 1990 to 1994 Mr Dörflinger was
Managing Director of ATS as well as of EUMIG Fohnsdorf Industrie GmbH. In 1994 he joined Hannes
Androsch and Helmut Zoidl in the management buyout of ATS. Until 2005, he served first as Managing
Partner, then became a member and finally Chairman of the Management Board. In 2005 he joined ATS's
Supervisory Board.
Other supervisory board or similar positions held by Mr Dörflinger at listed companies:
 HWA AG
Regina Prehofer, Second Deputy Chairwoman of the Supervisory Board, was first appointed to the Board on
7 July 2011. Her current appointment runs until the 22nd Annual General Meeting in 2016.
Ms Prehofer studied commerce and law in Vienna. She started her career in 1981 at Österreichische
Kontrollbank. In 1987 she joined Creditanstalt, where she held various managerial positions in the bank's
corporate customer segment. In 2003 she was appointed to the Management Board of Bank Austria
Creditanstalt AG, where she was responsible for corporate customers and Eastern European markets. From
2006 to 2008 she was CEO of UniCredit Global Leasing, in addition to her Management Board responsibilities
in Austria. This appointment gave her overall responsibility for UniCredit Group's leasing operations. In Sep-
tember 2008 she moved to the Management Board of BAWAG P.S.K. where she headed the bank's retail and
corporate customer activities. From 2011 to 2015 she was Vice Rector with responsibility for finance and
infrastructure at the Vienna University of Economics and Business Administration.
Other supervisory board or similar positions held by Ms Prehofer in listed companies:
 Wienerberger AG (Chairwoman of Supervisory Board since December 2013)
Karl Fink was first appointed on 5 July 2005. His current appointment runs until the 26th Annual General
Meeting in 2020.
Mr Fink graduated in business studies from the Vienna University of Economics and Business in 1971. From
1971 to 1975 he worked for Marubeni Corporation in international commodities trading before moving to
Wiener Städtische Wechselseitige Versicherungsanstalt in Vienna. Between 1979 and 1987 he was Chairman
of the Management Board of Interrisk - Internationale Versicherungs-Aktiengesellschaft. In 1987 he became a
member of the Management Board of Wiener Städtische Allgemeine Versicherungs AG and Deputy Managing
38 ATS Annual Report 2015/1614 ATS Annual Report 2015/16
Director in July 2004. In October 2007 he was appointed Managing Director of Wiener Städtische Versicher-
ung AG, Vienna Insurance Group. Mr Fink retired from the Vienna Insurance Group Managing Board on 30
September 2009. He is a member of the Management Board of Wiener Städtische Versicherungsverein, the
principal shareholder in Vienna Insurance Group, holds a number of supervisory positions and consultative
positions within that Group. He is also honorary consul of Montenegro.
Albert Hochleitner was first appointed on 5 July 2005. His current appointment runs until the 26th Annual
General Meeting in 2020.
Mr Hochleitner completed his studies in engineering physics at Vienna University of Technology in 1965. In
the same year, he joined the Siemens Group's low voltage works in Vienna. In 1984 he was appointed Chair-
man of the Management Board of Uher AG. In 1988 he joined Siemens AG, where he was head of the electric
motors business in the automotive technology sector based in Wurzburg. In October 1992 he became a
member of the Management Board of Siemens AG Austria. From 1994 he was Chairman of the Management
Board, before becoming a member of the Supervisory Board of Siemens AG in 2005, which he left in 2010
because of reaching the applicable age limit for members of the Supervisory Board.
Gerhard Pichler was first appointed on 2 July 2009. His current appointment runs until the 25th Annual Gen-
eral Meeting in 2019.
Mr Pichler studied business administration at the Vienna University of Economics and Business. A certified
auditor and tax adviser, he has been Managing Director of CONSULTATIO Wirtschaftsprüfungsgesellschaft
m.b.H. since 1986, and Managing Partner of the Group since 1995.
Georg Riedl was first appointed on 28 May 1999. His current appointment runs until the 22nd Annual General
Meeting in 2016.
Mr Riedl acquired his doctorate in law in 1984 from the University of Vienna. In 1991 he commenced inde-
pendent practice at Riedl  Ringhofer. He has been in independent practice since 2013 at the law office of
Frotz Riedl Rechtsanwälte. He specialises in business, commercial, corporate, foundation and tax law, mer-
gers and acquisitions, and contract law.
Other Supervisory Board or similar positions held by Mr Riedl in listed companies:
 VIENNA INSURANCE GROUP AG Wiener Versicherung Gruppe
Karin Schaupp was first appointed on 7 July 2011. Her current appointment runs until the 22nd Annual Gen-
eral Meeting in 2016.
Ms Schaupp earned her doctorate at the Karl Franzens University in Graz in 1978 and began her career as a
university research assistant at the Institute of Pharmaceutical Chemistry. In 1980 she started her career in
industry as Head of Analytics at Leopold Pharma GmbH. After holding various research, development and
product management posts in the international pharmaceuticals industry she was appointed CEO of Frese-
nius Kabi Austria GmbH in 1997. In 1999 she became regional manager for Austria and Southeastern Europe.
In 2000 she was appointed to the management board of Fresenius Kabi AG, Bad Homburg, with responsibility
for worldwide operations. She has been an independent consultant since 2003, with a focus on strategic
business development and innovation transfer.
Other Supervisory Board or similar positions held by Ms Schaupp at listed companies:
 BDI – BioEnergy International AG
39Corporate Governance ReportCorporate Governance Report 15
EMPLOYEE REPRESENTATIVES
Employee participation in supervisory boards and their committees is mandated by law, and forms part of the
Austrian corporate governance system. Employee representatives are entitled to delegate one representative as
a Supervisory Board member for every two Supervisory Board members elected by the General Meeting. If there
is an odd number of shareholders' representatives, the number of employee representatives is rounded up. This
one-third representation also applies to all Supervisory Board committees, with the exception of meetings and
votes concerning the relationship between the company and its management board members. Resolutions
appointing or dismissing a management board member and the granting of stock options in the company are
also excepted. The Group Works Council meets regularly with the Management Board. These meetings facilitate
the exchange of information on developments in the Group which have a direct bearing on employees.
Wolfgang Fleck, Sabine Fussi, Franz Katzbeck and Günther Wölfler have been appointed to the Supervisory
Board by the Works Council. Effective 28 January 2016, Siegfried Trauch was appointed by the Works Council
to the Supervisory Board, replacing Franz Katzbeck. Thus, Franz Katzbeck resigned from the Supervisory
Board on this date.
Additional information on the Supervisory Board and its composition is available online at
www.ats.net/company/supervisory-board/.
INDEPENDENCE OF SUPERVISORY BOARD MEMBERS The ÖCGK specifies that the majority of
Supervisory Board members representing the shareholders must be independent. In accordance with C Rule
53, the Supervisory Board has established the following criteria to be used in determining the independence
of its members. Supervisory Board members are to be regarded as independent if they have no business or
personal relationships with the Company or its Management Board which could be cause for material con-
flicts of interest and therefore liable to influence the behaviour of the member in question. The following
criteria are applied in determining the independence of Supervisory Board members:
 The Supervisory Board member was neither a member of the Management Board nor a senior manager of
the Company or one of its subsidiaries in the past five years.
 The Supervisory Board member neither had during the last financial year nor currently has a business
relationship with the Group or any of its subsidiaries of material significance to that member. This also ap-
plies to business relationships between ATS Group and enterprises in which the Supervisory Board mem-
ber has a significant economic interest.
 During the last three years, the Supervisory Board member was neither a statutory auditor of the Group,
nor a person with an interest in the audit firm, nor an employee of any such firm.
 The Supervisory Board member is not a member of a management board of another company where a
member of ATS's Management Board is a member of that company's Supervisory Board.
 The Supervisory Board member has not been a member of the Supervisory Board for longer than 15 years.
This does not apply to Supervisory Board members who are shareholders with entrepreneurial interests in
the Group, or who represent the interests of such shareholders.
 The Supervisory Board member is not a close family relative (direct descendant, spouse, life partner, par-
ent, uncle, aunt, sibling, nephew or niece) of a Management Board member or of any person in a position
described in the foregoing points.
In the meeting of 17 March 2016, the members of the Supervisory Board representing shareholder interests
each declared whether they were independent as determined by the above criteria. Seven of the eight mem-
bers of the ATS AG Supervisory Board representing shareholder interests declared that they were inde-
pendent. Mr Androsch declared that he was not independent.
C Rule 54 specifies that for companies with a free float in excess of 50%, at least two Supervisory Board
members who are independent should also not be shareholders with interests in excess of 10%, or
40 ATS Annual Report 2015/1616 ATS Annual Report 2015/16
representatives of such interests. Five of the eight Supervisory Board members representing the shareholders
– Regina Prehofer, Karin Schaupp, Willibald Dörflinger, Karl Fink and Albert Hochleitner – declared themselves
independent within the meaning of this rule.
DIVERSITY Expertise and management experience are vital considerations when selecting members of the
Supervisory Board. Diversity is also a consideration in its composition. Three members of the Supervisory
Board are women, representing a proportion of female members of 25% – significantly above the Austrian
average. The age of Supervisory Board members ranges from 46 to 78. All members of the Supervisory Board
representing shareholder interests have extensive experience in international business.
AGREEMENTS REQUIRING APPROVAL In connection with various projects, the Group obtained
the services from consulting companies where the Chairman of the Supervisory Board Hannes Androsch, as
member of the Management Board, has full authority to act on behalf of the company (AIC Androsch Interna-
tional Management Consulting GmbH) and where the First Deputy Chairman of the Supervisory Board Wil-
libald Dörflinger, as Managing Director, has full authority to act on behalf of the company (Dörflinger Man-
agement  Beteiligungs GmbH). The Group obtained legal services from Frotz Riedl Rechtsanwälte, where
member of the Supervisory Board Georg Riedl works as an independent attorney.
€ in thousands 2015/16 2014/15
AIC Androsch International Management Consulting GmbH 395 380
Dörflinger Management  Beteiligungs GmbH 5 8
Frotz Riedl Rechtsanwälte - 3
Total 400 391
COMMITTEES In order to provide effective support and to properly address complex technical matters,
the Supervisory Board has established two permanent committees for in-depth analysis of particular issues
and regular reporting to the Supervisory Board. In the financial year 2014/15, the Supervisory Board also
established a Project Committee to review matters related to debt financing. This committee continued its
mandate in financial year 2015/16 and was discontinued upon resolution of these matters.
AUDIT COMMITTEE In the financial year under review, the Audit Committee comprised:
 Regina Prehofer (Chairwoman)
 Gerhard Pichler (finance expert)
 Georg Riedl
 Wolfgang Fleck
 Günther Wölfler
These members were confirmed in the extraordinary (constitutive) meeting of the Supervisory Board that
took place in connection with this after the Annual General Meeting on 9 July 2015.
The Audit Committee monitors the accounting process and the work of the statutory auditor, monitors and
reviews the statutory auditor's independence, reviews the preparation and audit of the annual financial
statements, and reviews the proposed distribution of profits, the Management Report and the Corporate
Governance Report. The Committee is responsible for reporting on the results of its reviews to the Super-
visory Board. The Audit Committee also carries out preparatory work for the Supervisory Board on all issues
in connection with the audit of the consolidated financial statements, consolidated management report and
the consolidated accounting process. It also submits a proposal for the appointment of the statutory auditors
and reports on this matter to the Supervisory Board. The Audit Committee is responsible for monitoring the
effectiveness of the Group-wide internal control system and, where appropriate, the Group’s internal audit
41Corporate Governance ReportCorporate Governance Report 17
and risk management systems. The Audit Committee convened twice in the last financial year. Its activities
focused primarily on the discussion and review of the annual and consolidated annual financial statements
for the year ended 31 March 2015, the planning and preparation for the audit of the annual and consolidated
annual financial statements for the financial year 2015/16, and the discussion of the risk management, inter-
nal control and internal audit systems. The chairwoman of the Audit Committee was also involved in the
quarterly reporting in the financial year 2015/16.
NOMINATION AND REMUNERATION COMMITTEE Until 9 July 2015, this committee comprised:
 Hannes Androsch (Chairman)
 Karl Fink
 Albert Hochleitner
 Wolfgang Fleck
 Günther Wölfler
Since the election in the extraordinary (constitutive) meeting of the Supervisory Board that took place after the Annual
General Meeting on 9 July 2015, the Nomination andRemuneration Committee comprised the following members:
 Hannes Androsch (Chairman)
 Willibald Dörflinger (Deputy Chairman)
 Georg Riedl
 Wolfgang Fleck
 Günther Wölfler
The Nomination and Remuneration Committee submits proposals to the Supervisory Board for appointments
to fill vacancies on the Management Board whenever necessary. It deals with succession planning issues and
the remuneration of Management Board members. The committee met three times for these purposes in the
financial year 2015/16.
The Nomination and Remuneration Committee is authorised to make decisions in urgent cases. All of the commit-
tee members representing shareholders possess knowledge of and experience in the area of remuneration policies.
PROJECT COMMITTEE In financial year 2014/15, the Supervisory Board – in connection with a policy
resolution of the same date concerning the implementation of various measures for debt financing – resolved
under Section 17 of the Articles of Association to create a Project Committee made up of Supervisory Board
members to oversee further progress, including giving approval for implementation of the relevant transac-
tions. The Project Committee comprised the following members:
 Hannes Androsch (Chairman)
 Willibald Dörflinger
 Regina Prehofer
 Wolfgang Fleck
 Günther Wölfler
The Project Committee was authorised by the Supervisory Board to provide all further approvals required for
issuing bonds, or assuming another form of debt, and the precise terms and conditions with respect to this.
The Project Committee, which was formed on 19 March 2015, and thus at the end of the financial year, met
once during the financial year 2015/16, with all committee members taking part, and dissolved on 24 Sep-
tember 2015 after the Supervisory Board passed a resolution approving a number of debt financing measures
as requested by the Management Board with the support of the Project Committee. Subsequently, matters of
financing were discussed solely by the full Supervisory Board.
43Corporate Governance Report
Corporate Governance Report
19
The following report presents the remuneration of ATS's Management and Supervisory Board members. It
should be read in conjunction with the explanations in the notes to the 2015/16 annual and consolidated
financial statements.
MANAGEMENT BOARD REMUNERATION Total remuneration paid to members of the Management Board
in the financial year:
Financial year 2015/16 Financial year 2014/15
€ in thousands Fixed Variable Total Fixed Variable Total
Andreas Gerstenmayer 430 457 887 429 506 935
Karl Asamer 376 277 653 3741)
301 675
Heinz Moitzi 360 289 649 359 361 720
Total 1,166 1,023 2,189 1,162 1,168 2,330
1)
Last year’s figure was slightly adjusted for a proportionate 13th and 14th salary, based on the assignment as of 1 April 2014.
The fixed element represented 48.48% of Mr Gerstenmayer's total remuneration, and the variable element
51.52%. The fixed element represented 57.58% of Mr Asamer's total remuneration, and the variable element
42.42%. The fixed element represented 55.47% of Mr Moitzi's total remuneration, and the variable element
44.53%. For the Management Board as a whole, the fixed element represented 53.27% of total remunera-
tion, and the variable element 46.73% in the financial year 2015/16.
The stock option based system of Management Board remuneration at ATS is based on the Stock Option
Scheme 2009-2012, in which allocations were made from 1 April 2009 to 1 April 2012. The number of stock
options allocated to members of the Management Board was as follows:
Allocated on 1 April of every year
Total 2012 2011 2010 2009
Andreas Gerstenmayer 120,000 40,000 40,000 40,000 –
Heinz Moitzi 120,000 30,000 30,000 30,000 30,000
Exercise Price (€) 9.86 16.60 7.45 3.86
The options granted may be exercised in tranches: up to 20% after two years, up to an additional 30% after
three years, and up to an additional 50% after four years (from the allotment date). Stock options may be
exercised in whole or in part after completion of the vesting period, although not during a restricted period.
Allotted options not exercised within five years of the date of granting expire without compensation. If the
end of the five-year period falls within a restricted period, however, the restricted period will interrupt that
five-year period. Options can be exercised again after the restricted period for the length of time the inter-
ruption occurred. The five-year period is extended in this special case. Options not exercised by the end of
any five-year period extended in this manner become invalid and lapse without compensation. The stock
option scheme in question ended with the last allotment made on 1 April 2012. Options allotted on 1 April
2012 and not yet exercised (see Directors' holdings and dealings, including changes in the financial year
2015/16) may still be exercised until 31 March 2017.
By resolution of the Supervisory Board on 3 July 2014, a long-term incentive (LTI) programme for the Man-
agement Board and key staff was implemented as a replacement for the stock option scheme that expired
with the last distribution on 1 April 2012. The new programme is based on stock appreciation rights (SAR).
SAR are rights to appreciation in value based on share performance over a defined period of time. As with
Remuneration Report:
Management
and Supervisory Boards
44 ATS Annual Report 2015/1620 ATS Annual Report 2015/16
stock options, but without a granting of actual shares or an option for such granting, the recipient receives
financial remuneration only if the performance of the share price is positive. In particular, the conditions
include long-term and multiple-year performance criteria, a minimum vesting period of three years (with a
subsequent exercise period of no more than two years), a minimum own investment by the recipient, and an
upper limit on the potential financial benefits.
 Earnings per share (EPS) determines how many of the SAR allotted may actually be exercised once the
vesting period ends. The EPS established by the medium-term plan for the reporting date of the third year
following the allotment applies as the target. If, at the end of the vesting period, less than 50% of the EPS
target has been achieved, the allotted SAR are forfeited. If 100% or more of the EPS target has been
achieved at the end of the vesting period, all of the allotted SAR may be exercised. If achievement of the
target is between 50% and 100%, the allotted SAR may be exercised in linear proportion to the percentage
achieved.
 Own investment is a mandatory prerequisite for exercising SAR. The own investment is made by purchasing
shares corresponding to 20% of the total allotment amount in SAR for a given year (e.g. for an allotment of
5,000 SAR, the own investment is 1,000 shares). If the own investment has not been made in full by the
end of the vesting period (after three years), SAR are forfeited in a corresponding amount. The own in-
vestment must be held for the entire period of participation in the LTI programme.
 The exercise price is determined on the allotment date and is equal to the average closing price of ATS
shares on the Vienna Stock Exchange during the six months preceding the respective allotment date.
 The performance of the share price determines the amount of the LTI awarded to the recipient: The differ-
ence between the exercise price of the relevant virtual allotment and the closing price of the ATS share
on the Vienna Stock Exchange on the exercise date is multiplied by the number of SAR. There are no pre-
miums on the exercise price and payouts are made in cash. In the event of extraordinary positive perfor-
mance, the payout amount per SAR is limited to the amount represented by 200% of the respective exer-
cise price. (Example: for an exercise price of € 8.00, the maximum value per SAR is € 16.00, which means
that any share closing price above € 24.00 produces no associated increase in the value per SAR.)
In this LTI Programme for 2014 – 2016, three allotment tranches were possible between 1 April 2014 and
1 April 2016. To date, the following number of SAR has been allotted to members of the Management Board
at the exercise price indicated:
Allocated on 1 April of each year
Total 2015 2014
Andreas Gerstenmayer 80,000 40,000 40,000
Karl Asamer 60,000 30,000 30,000
Heinz Moitzi 60,000 30,000 30,000
Exercise Price (€) 10.70 7.68
The variable remuneration of the Management Board in financial year 2015/16 (not in the form of stock
options and SAR), which was accounted for in total remuneration and for which provisions have been estab-
lished until payout in financial year 2016/17, was dependent on the achievement of three performance indi-
cators defined in the budget for the respective financial year: return on capital employed (ROCE), cash earn-
ings, each with a 45% weighting, and the innovation revenue rate (IRR), with a 10% weighting. The basic
prerequisite for awarding this variable remuneration is positive EBIT for the Group as a whole for the financial
year and the attainment of the target EBIT for the Group as a whole by at least 70% (the hurdle rate). If
these key performance indicators are exceeded, bonuses are restricted to a maximum of 200% of the annual
bonus set out in the contract of employment. The inclusion of IRR is of major importance in giving variable
remuneration a long-term focus. Innovative strength – the development of new technologies, products or
45Corporate Governance Report
Corporate Governance Report
21
product types – is a crucial factor for the future business success of the Group. It can also be reliably meas-
ured: IRR represents the share of total revenue generated by technologically innovative products introduced
in the past three years. The three-year reference period provides a long-term component of variable remu-
neration. Management Board members are contractually entitled to termination benefits in accordance with
the Salaried Employees Act (AngG), applied mutatis mutandis (“old system for severance pay”), if their ap-
pointments are terminated. In the event of premature termination initiated by a Management Board mem-
ber for reasonable cause, or if the function is eliminated for legal reasons, remuneration is payable until the
end of the appointment contract. Where a Management Board member resigns the appointment or is re-
moved from office for severe breach of duty, and in the event of death, payment of salary ceases at the end
of the applicable month. There are no other rights or entitlements arising from the termination of appoint-
ments.
Mr Gerstenmayer and Mr Moitzi have pension entitlements in the form of defined benefit or defined contri-
bution plans agreed individually. For Andreas Gerstenmayer, a contribution of 10% of monthly gross salary is
paid into a pension fund. Mr Moitzi's pension entitlement is 1.2% of his most recent salary for each year of
service, up to a maximum of 40%. The amount of the occupational pension is based on the capital accumu-
lated in the pension fund; the annuitisation is determined by the pension fund's rules.
Members of the Management Board are entitled to a company car (the respective non-monetary taxable
remuneration is considered when calculating the net salary), and are covered by accident insurance. Health
insurance is limited to what is provided under the Austrian statutory social security system.
SUPERVISORY BOARD REMUNERATION Remuneration for the members of the Supervisory Board is de-
termined retrospectively for the past financial year by means of a resolution at the Annual General Meeting.
Remuneration paid to members of the Supervisory Board in the financial year 2015/16 for the previous finan-
cial year was in accordance with the resolution passed at the 21st Annual General Meeting of 9 July 2015.
in €
Member Fixed fee
Committee
fee
Variable
remuneration
Attendance
fee Total
Hannes Androsch 30,000 3,000 18,700 2,400 54,100
Willibald Dörflinger 25,000 – 9,350 2,400 36,750
Regina Prehofer 20,000 3,000 9,350 2,000 34,350
Karl Fink 20,000 2,000 9,350 2,000 33,350
Albert Hochleitner 20,000 2,000 9,350 2,400 33,750
Gerhard Pichler 20,000 2,000 9,350 2,400 33,750
Georg Riedl 20,000 2,000 9,350 2,400 33,750
Karin Schaupp 20,000 – 9,350 2,000 31,350
Total 175,000 14,000 84,150 18,000 291,150
The Chairman of the Supervisory Board receives fixed remuneration of € 30,000 per financial year, the First
Deputy Chairman € 25,000 and all other elected members € 20,000. Chairmanship of a standing committee
(Nomination and Remuneration Committee, Audit Committee) is remunerated with a fixed amount of € 3,000
per financial year, and membership of a standing committee with € 2,000. The attendance fee is € 400 per
Supervisory Board meeting and all cash expenses are reimbursed. Members of the Supervisory Board also
receive variable remuneration based on the short-term achievement of defined targets for the performance
indicators cash earnings (with a weighting of 45%), ROCE (return on capital employed; also with a weighting
of 45%) and the innovation revenue rate (IRR) with a weighting of 10%. If the targets are achieved 100%, the
Chairman receives € 10,000 and other members € 5,000. If the key performance indicators for ROCE, Cash
46 ATS Annual Report 2015/1622 ATS Annual Report 2015/16
Earnings and IRR are exceeded, variable remuneration of a maximum of 200% of the base described above is
paid. Members of the Supervisory Board do not receive stock options in the Group. Since the targets estab-
lished for variable remuneration in the budget for financial year 2014/15 were achieved, variable remunera-
tion accrued for that year and was subsequently paid out in accordance with the resolution by the 21
st
Annual
General Meeting of 9 July 2015.
The employee representatives perform their duties on the Supervisory Board voluntarily and therefore re-
ceive no separate remuneration for their position.
DIRECTORS AND OFFICERS LIABILITY INSURANCE (DO INSURANCE) The DO insurance at ATS
covers all past, present and future members of the Company's and its subsidiaries' managing and supervisory
bodies and selected other senior staff. The insurance covers court and all other costs of defence against
unwarranted claims, together with the satisfaction of warranted claims for pure financial loss arising from
breaches of duty by the insured in their managerial or supervisory activities. The insurance provides global
cover and the annual premium is paid by ATS.
47Corporate Governance Report
Corporate Governance Report
23
The members of the Supervisory Board and the Management Board have voluntarily undertaken to disclose
publicly the number of shares in AT  S Austria Technologie  Systemtechnik Aktiengesellschaft held by
them. The holdings of individuals with close personal relationships with members of the Supervisory Board or
Management Board are not disclosed.
Shares Options (Stock Option Scheme)
As of
31 Mar 2015 Change
As of
31 Mar 2016 % capital1)
As of
31 Mar 2015
Exercised/
lapsed
As of
31 Mar 2016
Andreas Gerstenmayer 10,000 – 10,000 0.03% 80,000 20,000 60,000
Karl Asamer 4,000 5,000 9,000 0.02% – – –
Heinz Moitzi 2,786 2,214 5,000 0.01% 60,000 – 60,000
Hannes Androsch 599,699 – 599,699 1.54% – – –
Androsch Privatstiftung 6,339,896 – 6,339,896 16.32% – – –
Willibald Dörflinger – – – – – – –
Dörflinger Privatstiftung 6,902,380 – 6,902,380 17.77% – – –
Karl Fink – – – – – – –
Albert Hochleitner – – – – – – –
Gerhard Pichler 26,768 – 26,768 0.07% – – –
Regina Prehofer – – – – – – –
Georg Riedl 15,482 – 15,482 0.04% – – –
Karin Schaupp – – – – – – –
Wolfgang Fleck – – – – – – –
Sabine Fussi – – – – – – –
Franz Katzbeck – – – – – – –
Siegfried Trauch – – – – – – –
Günther Wölfler – – – – – – –
1)
The indicated number of shares held in AT  S Austria Technologie  Systemtechnik Aktiengesellschaft includes all direct and indirect investments. Thus, for the
Androsch Private Foundation, this information also includes those shares held by AIC Androsch International Management Consulting GmbH, which is owned by
the Androsch Private Foundation. For the Dörflinger Private Foundation, it also includes those shares held by Dörflinger Management  Beteiligungs GmbH,
whose majority owner is the Dörflinger Private Foundation.
The individual directors' dealings notifications can be viewed in and downloaded from the FMA Directors'
Dealings Database, at https://www.fma.gv.at/en/companies/issuers/directors-dealings/directorsdealings-
database.html.
Directors’ Holdings  Dealings
48 ATS Annual Report 2015/1624 ATS Annual Report 2015/16
CODE OF BUSINESS ETHICS AND CONDUCT ATS has established its own code of ethics and conduct,
which describes how ATS conducts its business in an ethical and socially responsible way. These principles
apply to all ATS's activities worldwide, to all ATS segments, and to all companies that are part of the ATS
Group. The ATS Code of Business Ethics and Conduct is based on the ethics standard SA8000. ATS is com-
mitted to meeting the requirements of the Electronic Industry Citizenship Coalition (EICC). Integrity and
compliance with both legal and ethical principles are essential for maintaining the credibility, trustworthiness
and authenticity of the Group. Stricter or more detailed guidelines may be established for specific regions,
countries or functions, but they must be consistent with this corporate policy. Under one of the main provi-
sions of the Code, ATS does not tolerate any form of discrimination, for example on the basis of gender,
age, religion, or ethnic origin, in activities such as recruitment, remuneration and promotion.
CAPITAL MARKET COMPLIANCE As a company listed on the Vienna Stock Exchange, ATS acknowledges
its responsibility to prevent the abuse of compliance-related information and insider information through
appropriate measures and in accordance with applicable laws and regulations. ATS attaches great im-
portance to the equal treatment of all investors and the provision of comprehensive information. ATS also
complies with laws related to third parties such as customers and suppliers. All employees are therefore
required to conduct themselves with due care in this respect. ATS supports the aim of the ÖCGK to raise
Austrian and foreign investors' confidence in the Austrian financial market by enhancing transparency and
reinforcing standard principles.
For the purpose of preventing insider trading and ensuring compliance with other relevant capital market
regulations, the Group has adopted a Compliance Code (Corporate Directive Issuer Compliance) that also
applies to all Supervisory Board members. The Corporate Directive Issuer Compliance was most recently
updated in the financial year 2015/16, and the amended version entered into force on 15 October 2015.
These guidelines apply to all companies in the ATS Group, and all employees and governing bodies, includ-
ing the Supervisory Board. It applies in particular to certain persons working in sensitive areas and contains
detailed instructions, guidelines and aids to ensure compliance with the relevant regulations.
ADVANCEMENT OF WOMEN IN SENIOR MANAGEMENT ATS has no explicitly formulated plan for
increasing the number of women on the Management or Supervisory Boards or in senior management posi-
tions in the Company or its subsidiaries. The selection of candidates to fill open positions is based on the
principle of the best possible person for the job – regardless of gender, age, religion or ethnic origin.
There are women in various senior management positions at ATS and its subsidiaries. Although no women
are represented on the Management Board of ATS, two of the eight members of the ATS Supervisory
Board representing shareholder interests and one of the employee representatives are women. At 25%, the
proportion of female Supervisory Board members is above the average for Austrian companies. At the end of
the financial year, the proportion of female employees at ATS was 35%. The female proportion in Europe at
43% and the United States at 37% are still significantly higher than in Asia, where the proportion of females
employed by ATS is 33%. Women constitute 10% of the employees reporting directly to the Management
Board of the ATS Group. The Group continues to try to increase female representation at board and senior
management level. Proactive efforts are made, particularly when staff return from maternity leave, to ensure
that careers and family life are compatible.
Management Board
Andreas Gerstenmayer m.p. Karl Asamer m.p. Heinz Moitzi m.p.
Other codes of conduct
51Group Management Report
TABLE OF CONTENTS
1.	Business development   52
	 1.1. Market and industry   52
	 1.2. Profit situation   57
	 1.3. Financial position   61
2.	Significant events after the reporting period   68
3.	Plants and branch offices   69
4.	Business development by segments   70
5.	Group   73
	 5.1. Employees   73
	 5.2. Sustainability   76
	 5.3. Research and development   79
6.	Risk and opportunities management   81
7.	Internal Control and Risk Management System with regard to accounting   86
8.	Shareholding structure and disclosures on capital
	 (disclosures according to § 243a Austrian Commercial Code)   87
9.	Outlook   89
Group Management Report 2015/16
52 ATS Annual Report 2015/1626 ATS Annual Report 2015/16
Over the past two decades, the global market for printed circuit boards has been shaped by the growth of
and technological change in the electronics industry in general and, in particular, by end devices such as
computers – from servers to desktops and notebooks – in addition to smartphones and tablets.
The extraordinary growth rates for smartphones and tablets have slowed considerably, and the market for
desktop and notebook computers is declining. The communication and computer segment continue to be the
largest buyers of high-end printed circuit boards and substrates.
Contrary to the original estimates by Prismark, which projected average growth in 2015 of around 3% in the
market for printed circuit boards and substrates year on year, the market recorded an overall decline of
around 4%. ATS, however, recorded organic growth of 5.2%. A deciding factor in the market downturn in
2015 was a weak demand in the computer segment and in consumer products. The likewise above-average
decline in substrates of 8.9% was directly connected to the contraction of 10% in the computer segment.
Based on the most recent estimates by Prismark, average annual market growth between 2015 and 2018 will
be around 2%. As a result, the global printed circuit board market would not return to its 2014 volume until 2017.
Further reasons for the outlook of low growth for the overall market are the increasing miniaturisation and
higher integration in the semiconductor industry as well as the integration of components into substrates and
printed circuit boards, which reduces the area needed for these connection platforms. Particularly affected
by this are providers in the middle and low-end technology segments. For providers of high-end technologies
such as ATS, these broad market forecasts require a more differentiating analysis.
The technological development of high-end printed circuit boards and substrates will continue to be driven in
the next several years by applications in the communication and computer areas. These segments will con-
tinue to influence the architecture of the electronic components they need, including semiconductors, and
not only accelerate the already rapid technological development of substrates and printed circuit boards, but
also drive the convergence of the technologies they use.
According to Moore’s law, the continuous miniaturisation in the semiconductor industry will define the asso-
ciated increase in power density – even if, in the future, it is no longer every two years but a longer interval
instead. There will be a simultaneous reduction in semiconductor size and miniaturisation in printed circuit
boards and substrates, and thus continued growth in HDI and microvia technology. Furthermore, additional
miniaturisation potential will emerge through the combination of production processes and materials for
high-end printed circuit boards with the processes and technologies from substrate production.
With the additional integration of components in substrate and printed circuit boards, measurements in all
dimensions will become smaller, as the example in the diagram below illustrates.
Business development1.
1.1. Market and industry
PCB market
US$ in billions
Source: Prismark, February 2016
17.4 15.8 15.6 16.3 16.6
15.5
15.6 16.2 16.4 16.8
8.0
7.8 7.7 7.9 7.9
3.4
3.5 3.6 3.8 4.0
3.5
3.5 3.6 3.8 4.0
2.2
2.2 2.3
2.3 2.4
7.6
6.9 6.7
6.9 6.9
57.6
55.3 55.7
57.4 58.6
2014 2015 2016 2017 2018
IC Packaging
Aviation/Military
Industrial/Medical
Automotive
Consumer
Communication
Computer
Advanced
Package
(SiP)/15µ Line/
Space
Embedded
Interposer
20µ Line/Space
Cavity
Advanced
Package/
SLP/(SiB)/30µ
Line/Space
Embedded
IC-Substrate
10µ Line/Space
53Group Management ReportGroup Management Report 27
The opportunities that arise from the intelligent combination of various technologies also mean new growth
potential for the printed circuit board industry. Thus the assembly service market, which today is controlled
exclusively by electronic manufacturing services and original device manufacturing companies, opens up for
manufacturers of high-end printed circuit boards and substrates through embedding technologies, as does
the packaging market currently dominated by the semiconductor industry.
TRENDS AND TECHNOLOGIES The world is becoming more digital. The driving forces are the availa-
ble and nearly omnipresent possibilities for connection, the ever-declining costs of data transmission and
sensors, and use of the internet to support communication between electronic devices.
As such, society is poised at the start of the Internet of Things (IoT) – a logical technological development
based on how internet-connected devices are used to improve the exchange of data, automate complex
industrial processes, and generate valuable information. The potential of the Internet of Things as the next
big thing is most often assessed based on the growth in devices connected through the internet.
However, the latest studies by Yole forecast that the strongest areas of growth in connection with IoT will not
be end devices such as wearables and sensors or smartphones and tablets, but rather the necessary infra-
structure such as base stations for the transmission of data as well as powerful computers and data centres
to process and store the rapidly increasing volume of data.
Source: Yole, April 2016
This development will significantly influence further growth of the entire electronics industry in all segments.
Servers and storage media show the greatest growth potential in the computer segment, with average annual
increases of 5.7% until 2018, end devices in the consumer segment at 5.8%, electronics for automobiles at
7.9%, industrial electronics at 8.0% and the market for medical electronics at 5.4%.
A printed circuit board is a connection platform for electrical, electronic and mechanical components. It
enables the mechanical attachment and the electrical connection of resistors, capacitors, microprocessors,
memory chips, sensors, connectors and many other components that are required for a fully functioning
electronic system. Since nearly every electronic device contains one or more printed circuit boards, they are
an indispensable part of our daily life.
Printed circuit boards consist of electrically insulating carrier material (usually fibreglass mats saturated in
epoxy resin) with conductive connections attached to them (normally made of etched copper layers). There
are countless types of printed circuit boards, ranging from single-layer to highly complex multilayer models.
The complexity of printed circuit boards and the related requirements for the different production processes
are determined by several factors. These factors are the number of layers, the vertical connections of the
individual layers and their minimum hole diameter, line width and spacing as well as the surface finish. Pro-
gressive miniaturisation of electronic components in end devices while simultaneously enlarging their power
density increases the requirements for and the complexity of printed circuit boards. For many years, ATS
Electronics market by
segment
US$ in billions
Source: Prismark, February 2016
487 467 476 486 506
535 561 586 600 641
154 152 152 165
180186 171 181 192
215129 124
130
139
156
99 99
105
110
116
138 139
143
150
1621,728 1,713
1,773
1,842
1,976
2014 2015 2016 2017 2018
Aviation/Military
Medical
Industrial
Automotive
Consumer
Communication
Computer
Cloud Network connectivity End device
APPLICATIONS Base stations Small area
networks (WiFi)
Servers,
datacenters
Smartphones, tablets Wearables, ­environmental
control sectors etc.
HUB / Gateway Connected Devices
54 ATS Annual Report 2015/1628 ATS Annual Report 2015/16
has placed its focus on the production of highly complex printed circuit boards for the most sophisticated
applications. Over 75% of revenue is now generated in this top category of technology.
IC substrates represent cutting edge technology for connection platforms. The most important difference
compared with printed circuit boards are the achievable structures – a minimum of less than 10µm is possi-
ble. Unlike in the production of printed circuit boards, however, the clean room requirements that must be
met are far more complex, and alternative plating processes are required to form vertical connections. Other
than traditional printed circuit boards, IC substrates may also consist of ceramic or glass materials.
INTERNATIONAL MARKET DEVELOPMENT The global printed circuit board market is strongly
influenced by the highly developed but increasingly difficult to predict electronics industry. As a result of
rapidly changing customer needs and the shifting global economic climate, the markets for end devices and
semiconductors are subject to increasingly greater fluctuations. The printed circuit board industry is also
subject to these macro trends which determine the demand for electronic devices and systems. Additionally,
the imbalance between supply and demand, the progressing geographic migration, the price decline and the
fierce competition exert an influence over this highly fragmented market. Globally, there were around
2,400 producers in 2014 (source: NTI, August 2015). The top 30 companies have a combined market share of
around 60%. (source: Prismark, February 2016).
Independent market analysts predict an average annual growth of about 2% for the global printed circuit
board market until 2018 (source: Prismark, February 2016), expecting above-average growth rates of 5.8%
for more advanced technologies such as any-layer printed circuit boards (source: Prismark, June 2015).
In 2015, global demand for printed circuit boards stood at US$ 55.3 billion (source: Prismark, February 2016),
representing a decline of 4% from the previous year.
COMMUNICATION: SMARTPHONES REMAIN THE TECHNOLOGICAL GROWTH
DRIVER IN THE ELECTRONICS INDUSTRY With about 1.429 billion devices sold, the smartphone
market was by far the largest segment of the global electronics industry in 2015, and also the fastest growing
(10% growth) year-on-year. Even if independent market analysts predict significantly lower average growth
rates of about 6.6% for the coming years (source: IDC, December 2015), smartphones will remain the largest
segment of the electronics industry.
The market for communications infrastructure will become more important again in the next several years as
a result of the IoT and, beginning in 2019, with the introduction of fifth generation networks (5G). Based on
the most recent forecasts, it should grow by 2.6% annually (source: Prismark, February 2016).
COMPUTERS: THE “INTERNET OF THINGS” WILL GENERATE NEW GROWTH IN
SERVERS AND STORAGE MEDIA The market for computers – desktops, notebooks and tablets – re-
corded a decline of around 9% in 2015. Contrary to original forecasts, even the tablet computer market, for
which average growth of 13% p.a. had been expected (source: IDC, January 2014), declined for the first time
in 2015, by around 11.4% from 2014 (source: Prismark, February 2016). For the coming years, steady demand
is projected with different growth rates for the various end devices.
For server and storage computing devices, solid and sustained growth of about 5% is anticipated in the next
several years due to continuing digitalisation and thus the rising volume of data, which must be analysed and
stored (source: Prismark, February 2016).
CONSUMER The consumer market, which has significant demand for high-end printed circuit boards in
products such as digital cameras, TVs and so-called smart devices like smart watches and fitness trackers, also
experienced a decline in 2015, of 1.3%, as wearable applications did not break through on the market and
digital cameras are being replaced by smartphones.
Sales volume
smartphones
units sold in millions
Source: IDC, December 2015
Sales volume
computer market
units sold in millions
Source: Prismark, February 2016
1,302
1,429 1,499
1,610 1,729
2014 2015 2016 2017 2018
220
195 190 187 184
185
172 170 170 170
128
118 115 113 112
9 11 11 12 13
2014 2015 2016 2017 2018
Tablets
Notebooks
Desktops
Servers
55Group Management ReportGroup Management Report 29
According to Prismark, there will be no growth in this market again in 2016 but will begin to grow again in
2017 at an average rate of around 5.8%. Growth will be driven primarily by 4K TVs, smart watches, consumer
robots and handheld projectors
AUTOMOTIVE ELECTRONICS: ABOVE-AVERAGE GROWTH THROUGH NEW DEVICES
The share of the automotive market in electronic systems declined in value in 2015 by 8.1% on a US$ basis. It
is expected to grow by 7.9% annually until 2018 (source: Prismark, March 2016). Demand for printed circuit
boards for automotive electronics is anticipated to grow by an annual average of 4.6% (source: Prismark,
February 2016). Thus the growth rates for electronic systems for the automotive market as well as for printed
circuit boards in this segment are significantly higher than the average overall figures for the global electron-
ics industry.
In this segment, applications in the area of safety and information also drive the demand and the use of HDI
and microvia printed circuit boards. The applications in which HDI and microvia printed circuit boards are
now used extend from navigation, multimedia and infotainment systems to emergency calling and camera
systems and electronic transmission control.
The concept of autonomous driving has sparked the development of central systems to collect the data and
information from camera systems, radar and ultrasound sensors, analyse them, and ultimately control the
relevant actuators for braking, stability and steering systems. These new central computers also need HDI
technology because of the large volumes of data and the required data transfer speed.
INDUSTRIAL ELECTRONICS The industrial electronics systems market declined from 2014 to 2015 by
3.9%. In 2016, independent market analysts expect a growth rate of 4.8% (Source: Prismark, February 2016).
The correlated growth in printed circuit boards for this segment is expected to about 3% for the same time
period. (Source: Prismark, February 2016).
The industrial electronics segment continues to be heavily influenced by applications in the areas measure-
ment and control technology, power electronics, lighting systems as well as diagnostic instruments, RFID
readers and also railway technology. In the future, M2M (machine-to-machine and machine-to-man) com-
munication modules driven by Industry 4.0 activities will enable further growth in this segment.
MEDICAL ELECTRONICS The global market for medical electronics systems had a value of US$ 99
billion in 2015 (source: Prismark, February 2016), representing stagnation year on year. The medical electron-
ics market is characterised by a high level of complexity with regard to applications such as diagnostic and
imaging devices, therapy applications and patient monitoring. Further application areas are surgical lighting,
analytical instruments and molecular diagnostics. Prices for medical technology, devices and systems range
from low two-digit US$ amounts for fitness trackers to several 100,000 US$ for a computer tomography
system. Average annual growth of around 5.4% is expected until 2018.
Sales volume
automotive market
vehicles sold in millions
Source: Prismark, February 2016
Sales volume
industrial electronics systems
market
US$ in billions
Source: Prismark, February 2016
Sales volume
medical electronics systems
market
US$ in billions
Source: Prismark, February 2016
90 93 96 99 102
2014 2015 2016 2017 2018
129 124 130 139 147
2014 2015 2016 2017 2018
99 99 105 110 116
2014 2015 2016 2017 2018
56 ATS Annual Report 2015/1630 ATS Annual Report 2015/16
THE MARKET FOR IC SUBSTRATES Independent market analysts calculate the volume of surface
produced for 2014 of 7.5 million m² (Yole) or 7.4 million m² (Prismark), and the volume for 2015 of
8.7 million m² (Yole) or 7.5 million m² (Prismark). Based on the Yole calculation, this represents growth of
around 16%, and based on Prismark, growth of 1.2%. The forecasts for 2016 amount to 9.6 million m² (Yole)
and 7.5 million m² (Prismark).
These differing estimates arise from diverging ways of defining the market for substrates, i.e. the inclusion of
different substrate technologies such as wire-bond substrates versus flip-chip substrates or even chip-on-
board and chip-on-flex interconnection platforms. The different estimates are also related to the prediction
of demand for end uses and applications, which is becoming increasingly difficult.
The substrates market in recent years has been shaped primarily by growth in the smartphone industry and
decline in the computer market. In the next several years, the Internet of Things will have a significant influ-
ence on further growth in the semiconductor industry and the associated demand for substrates. IoT is not a
single application but rather the connection of end devices such as wearables and sensors with gateways
such as smartphones or tablets. These gateways are connected through base stations via WiFi networks and
process the data through servers and data centres in the cloud. Differing growth forecasts result from how
certain factors are assessed, such as the demand for end devices or the required expansion of networks and
data centres as the engine of IoT.
IC substrates are used in all segments of the electronics industry, and more than 80% of them in
smartphones, desktop and notebook computers, tablets, servers and storage systems (source: Prismark, July
2014). In contrast to the large number of printed circuit board producers, there are only a few manufacturers
of IC substrates, among which the top 10 providers jointly lay claim to more than 80% of the market (source:
Prismark, July 2014). This environment presents ATS with the opportunity in the coming years to establish
itself as a leading provider to this high-tech segment.
MINIATURISATION, FUNCTIONAL INTEGRATION AND MODULARISATION DETER-
MINE THE MARKET FOR EMBEDDED COMPONENT PACKAGING (ECP) AND EM-
BEDDED DIE PACKAGING Embedded die packaging technology is still in the market introductory
phase. Yole analysts estimate the total market volume for 2015 to be US$ 27 million and predict a market
increase until 2018, reaching a total volume of about US$ 142 million. This corresponds to an average annual
growth rate of about 73% (source: Yole, March 2015).
Paramount to ECP technology is miniaturisation by integrating components – and thus functionality – into the
printed circuit board, as well as improved reliability of the interconnection technology between components
and printed circuit board. Further challenges include increasing mechanical stability and improving thermal
and electrical properties for applications in the high frequency area, for power electronics but also for audio
applications and high-speed data transfer.
ECP technology focuses on two different areas. So-called packages or system-in-package (SiP) modules cur-
rently represent the largest part. Typical examples for application include power modules, MOSFET and IGBT
applications, MEMS modules, sensor and camera modules, audio and radio modules as well as DC/DC con-
verters.
The second area relates to motherboards (main boards), including applications such as highly reliable printed
circuit boards for tough environmental conditions (e.g. engine control), notebooks, mobile internet devices,
smartphones, hearing aid devices and integrated RFID solutions.
Production volume
IC substrates
in million sqm
Source: Prismark, February 2016
Yole, April 2016
Sales volume of embedded die
packaging market
US$ in millions
Source: Yole, March 2015
7.5
8.7
9.6
11.1
12.8
7.4 7.5 7.5 7.9 8.1
2014 2015 2016 2017 2018
Yole Prismark
14
27
52
90
142
2014 2015 2016 2017 2018
57Group Management ReportGroup Management Report 31
In financial year 2015/16, ATS once again significantly exceeded the record revenue level of 2014/15 de-
spite the printed circuit board industry and the customer segments addressed by ATS showing uneven
performance compared to financial year 2014/15 and increasing price pressure in the core business. Overall,
ATS increased Group revenue by € 95.9 million or 14.4% to € 762.9 million (previous year: € 667.0 million).
This positive development was due to strong demand in all segments, with revenue increasing organically by
€ 34.4 million or 5.2%. Alongside this strong organic growth, positive currency effects of € 58.9 million or
8.8% contributed to this revenue growth in the reporting period. Initial revenues from the Chongqing project
increased revenue by € 2.6 million or 0.4%. Around 73.3% of revenue in 2015/16 was invoiced in foreign
currencies. The revenue share of products manufactured in Asia rose from 79.0% in the previous year to
81.0% in the reporting year. The regional revenue structure based on the customer’s headquarters shows a
share of 56.1% for Americas, compared to 53.4% in the previous year. The revenue share of the remaining
regions shifted accordingly.
Due to the high importance of mobile devices, ATS revenue shows a certain seasonality. The first quarter of
the financial year is typically weaker than the second and third quarters, which generally show very high
demand due to preparations for the Christmas trade, and is characterised by the launches of the latest
product generations. The fourth quarter normally has weaker customer demand and is characterised by
production breaks in our largest plant in Shanghai (and, in the future, also in Chongqing) due to Chinese New
Year. In the current year, the seasonality was not very distinct, as demand from the Mobile Devices  Sub-
strates segment was unusually strong in the first few months of the financial year. Furthermore, ATS bene-
fited from a very strong US dollar compared to the previous year. Growth rates decreased mid-year, as the
comparable periods in the previous year where already unusually strong, the available production capacity
was almost all at full utilisation in the previous year and exchange rates showed no significant changes. The
production break caused by Chinese New Year was on a normal level compared to the previous year (when
the plant closure was reduced to the minimum) and was offset by the stable high level of demand from the
Automotive, Industrial, Medical segment throughout the year.
Result key data
€ in millions (unless otherwise stated)
2015/16 2014/15
Change
in %
Revenue 762.9 667.0 14.4%
Operating result before interest, tax,
depreciation and amortisation (EBITDA) 167.5 167.6 0.0%
EBITDA margin (%) 22.0% 25.1%
Operating result (EBIT) 77.0 90.1 (14.6%)
EBIT margin (%) 10.1% 13.5%
Profit for the year 56.0 69.3 (19.3%)
Earnings per share (€) 1.44 1.78 (19.1%)
Additions to fixed assets 303.0 154.5 96.1%
Average number of staff (incl. leased personnel) 8,759 7,638 14.7%
1.2. Profit situation
Development of revenue
€ in millions
Revenue by quarter
€ in millions
Revenue by region
(Customer headquarters)
in %
541.7
589.9
667.0
762.9
12/13 13/14 14/15 15/16
141.3
160.8
187.3
177.6
194.4
192.7
197.2
178.5
Q1 Q2 Q3 Q4
2014/15 2015/16
F
E
D
C
B
A
2014/15 2015/16
A - Austria
B - Germany
C - Other European countries
D - China
E - Other Asian countries
F - Americas
2.9%
21.3%
6.2%
4.1%
12.1%
53.4%
2.3%
21.4%
6.0%
4.3%
9.9%
56.1%
58 ATS Annual Report 2015/1632 ATS Annual Report 2015/16
The Mobile Devices  Substrates segment (MS) achieved a revenue of € 539.7 million in the reporting year,
an increase of € 84.5 million or 18.6% compared to the previous year’s figure of € 455.2 million. The segment
benefited from very strong demand in the first two quarters of the reporting year and positive currency
effects, whereas the fourth quarter in particular showed the normal seasonality for this segment. The Auto-
motive, Industrial, Medical segment (AIM) increased its revenue by € 24.9 million or 8.2% to € 326.7 million
(previous year: € 301.8 million). This development was mainly driven by the ongoing trend towards more
electronics in motor vehicles and the stronger demand for mobile applications in the patient monitoring area.
The industrial area showed stable development and repeated the previous year’s good figures. The Advanced
Packaging business unit, which is included in the Others segment (OT), showed a further strong advancement
and achieved a revenue increase of € 11.2 million or 102.9% to € 22.1 million (previous year: € 10.9 million) in
the reporting year. The increase was due both to the successful acquisition of new customers and the ongo-
ing implementation of the embedding technology with existing customers from the other segments. In the
current year, the significance of the Mobile Devices  Substrates segment increased further as the growth
rates in this segment were higher than in the Automotive, Industrial, Medical segment.
The Group's EBITDA of € 167.5 million was at the previous year’s level of € 167.6 million. The result already
recflects the first negative impacts of the start of the serial production of the Chongqing project. The startup
costs of the Chongqing project burdened EBITDA by € 12.7 million in the reporting period (previous year:
€ 4.3 million). The increase of € 8.4 million comprised € 6.9 million from the planned start of serial production
and € 1.5 from exchange rate effects. Group-wide, exchange rate effects increased EBITDA by € 13.0 million
or 7.7%. The results in the first two quarters were in line with the very positive revenue development, while
the last quarter was heavily impacted by the startup costs.
Development of profit
€ in millions
2014/15 One-off effects1)
Currency effects2)
Organic 2015/16
Revenue 667.0 2.6 58.9 34.4 762.9
Cost of sales (511.6) (13.2) (50.2) (36.3) (611.2)
Gross profit 155.4 (10.6) 8.7 (1.9) 151.6
Distribution costs (31.6) (0.3) (1.8) (1.0) (34.6)
General and administrative costs (28.0) (0.7) (0.9) 0.2 (29.4)
Other operating result (5.7) (3.8) (2.1) 0.9 (10.7)
Operating result before deprecia-
tion and amortisation (EBITDA) 167.6 (6.9) 13.0 (6.2) 167.5
Operating result (EBIT) 90.1 (15.3) 3.9 (1.8) 77.0
Finance costs - net (5.1) (0.3) (2.1) (0.7) (8.1)
Profit before tax 85.0 (15.5) 1.8 (2.5) 68.8
Income taxes (15.6) 3.7 (1.3) 0.4 (12.9)
Profit for the year 69.3 (11.8) 0.5 (2.0) 56.0
1)
Chongqing project
2)
Translation and valuation effects included in the consolidated financial statements
Compared to the previous year, the EBITDA margin decreased by 3.1 percentage points from 25.1% to 22.0%.
This development is mainly due to the start-up costs in connection with the start of serial production for the
Chongqing project. After deducting one-off effects from both years, the decrease amounts to 2.1 percentage
points, from 25.8% in the previous year to 23.7% in the reporting year. This decrease is mainly due to a com-
pensation payment by a supplier included in the previous year, changes to the payroll-related costs in our
biggest factory in Shanghai and the temporary discontinuation of an export promotion in India. However, the
EBIDTA margin remained above our long-term target of 18-20%.
Revenue from external
customers by segment
in %
2015/16
2014/15
Development of EBITDA
€ in millions
EBITDA by quarter
€ in million
OT
AIM
MS
OT
59.3%
40.2%
0.5%
MS
2013/14
57.3%
42.4%
0.3%
OT
AIM
MS
102.4
127.2
167.6
167.5
12/13 13/14 14/15 15/16
29.1
43.2
55.0
40.3
45.5
47.7
47.0
27.3
Q1 Q2 Q3 Q4
2014/15 2015/16
59Group Management ReportGroup Management Report 33
Cost of materials increased from 34.1% in the previous year to 35.1% in the reporting year, reflecting the
development towards superior quality, complex products as well as the startup-costs. The ratio of staff costs
to revenue amounted to 21.1%, slightly above the previous year’s figure of 20.0%. This can be explained by
payroll-related costs in Shanghai as well as the start-up costs. The absolute increase in administrative and
distribution costs resulted from exchange rate effects, the setup of the Chongqing organisation according to
plan and the further enhancement of distribution activities, which, however, increased at a lower rate com-
pared to revenue. Other operating incomes and expenses includes non capitaliseable development costs for
the Chongqing project of € 10.7 million (previous year: € 8.7 million), positive currency differences resulting
from the measurement of foreign currency receivables and liabilities of € 0.1 million (previous year:
€ 0.7 million) and impairments of € 3.1 million (previous year: € 6.0 million).
Amortisation of intangible assets and depreciation of property, plant and equipment of € 87.4 million or
11.0% of non-current assets (previous year: € 71.5 million or 11.0% of non-current assets) reflect ATS's high
technical standards as well as its investment ratio and have increased particularly due to currency exchange
effects and the start of depreciation of the technical equipment and development costs for Chongqing. In
addition to scheduled depreciation and amortisation, lower impairments were incurred compared to the
previous year of € 3.1 million or 0.4% of non-current assets (previous year: € 6.0 million or 0.9% of non-
current assets) resulting from the impairment of technical equipment in China no longer in use. Impairments
are made when there is no longer a potential for use in ongoing operations and the amount recoverable
through a disposal falls below the carrying amount.
The operating result (EBIT) decreased by € 13.1 million or -14.6% to € 77.0 million (previous year:
€ 90.1 million). Adjusted for the Chongqing project, ATS achieved an increase of € 5.0 million or 5.1% to
€ 103.2 million (previous year: € 98.2 million). The EBIT margin decreased by 3.4 percentage points to 10.1%
(previous year: 13.5%), or, adjusted by the Chongqing project, by 1.1 percentage points from 14.7% in the
previous year to 13.6% in the current year.
Finance costs – net declined from € -5.1 million to € -8.1 million. Interest expenses on financial liabilities
reduced from € 11.3 million to € 8.9 million. This was mainly due to an increase in the capitalised interest
costs to € 6.6 million (previous year: € 2.8 million) relating to the purchase of qualified assets in Chongqing.
Gross interest expenses rose only slightly by € 1.4 million from € 14.1 million to € 15.5 million due to effected
optimising measures, although gross debt rose from € 405.3 million to € 523.0 million. These optimisations,
however, resulted in hedging instruments, that swapped variable into fixed interest, becoming ineffective,
because the duration and amount no longer matched with the primary secured debts, and the requirements
for hedge accounting were no longer met. Due to these necessary changes in the accounting, € 3.8 million
was included as a one-time expense in the profit and loss statement for the reporting period.
Lower social capital interest costs of € 0.4 million (previous year: € 1.3 million) and – although the environ-
ment was unfavourable for placing funds – a higher return on financial investments of € 3.0 million (previous
year: € 2.2 million) resulted in a decline in finance costs – net. In the reporting year, finance costs – net in-
cluded positive foreign exchange differences resulting from the measurement of liquid foreign currency funds
and debts and realised exchange gains from financial instruments were recognised as income of € 3.9 million
(previous year: € 6.7 million). In principle, finance costs – net are influenced by currency effects only to a
limited extent, as the main part of the loans from credit institutions is made up of liabilities in euros. The
main intra-group loans are long-term by nature and their repayment is neither scheduled nor probable in the
foreseeable future. These loans are therefore recorded directly in equity through the statement of compre-
hensive income.
The Group's tax expense decreased in relation to the profit for the year before tax and amounted to
€ 12.9 million (previous year: € 15.6 million). Compared to the prior year, the effective tax rate rose slightly
from 18.4% to 18.7%. Compared to the previous year, there were no significant tax-related changes. It will
only be possible to assess the impacts of the OECD BEPS project on ATS after implementation into the tax
EBITDA margin
in %
Development of EBIT
€ in millions
EBIT margin
in %18.9
21.6
25.1
22.0
12/13 13/14 14/15 15/16
31.4
53.9
90.1
77.0
12/13 13/14 14/15 15/16
5.8
9.1
13.5
10.1
12/13 13/14 14/15 15/16
60 ATS Annual Report 2015/1634 ATS Annual Report 2015/16
laws of the individual countries. Current assessments however show, that this will lead to significantly higher
reporting and documentation requirements (country by country reporting) and to higher administrative costs
in order to ensure tax compliance in all Group companies and to minimise the risk of double taxation.
The profit for the year decreased from € 69.3 million in the previous year by € 13.3 million or -19.3% to
€ 56.0 million, and earnings per share decreased by € 0.34 or -19.1% from € 1.78 to € 1.44 with same number
of outstanding shares.
Earnings per share
in €
0.62
1.24
1.78
1.44
12/13 13/14 14/15 15/16
61Group Management ReportConsolidated Financial Statements 35
Development of statement of financial position
€ in millions
31 Mar 2015 One-off effects1)
Currency effects Organic 31 Mar 2016
Non-current assets 712.8 222.5 (81.0) 12.1 866.3
Current assets 508.1 (21.9) (36.1) 28.2 478.3
Total assets 1,220.8 200.6 (117.1) 40.3 1,344.7
Equity 604.4 (29.4) (82.6) 76.6 568.9
Non-current liabilities 413.1 148.6 (16.3) (124.0) 421.4
Current liabilities 203.4 81.4 (18.2) 87.7 354.3
Total equity and liabilities 1,220.8 200.6 (117.1) 40.3 1,344.7
1)
Chongqing project
In financial year 2015/16, the total amount of the consolidated statement of financial position rose by
€ 123.9 million or 10.1% from € 1,220.8 million to € 1,344.7 million. This was mainly due to additions to as-
sets for the Chongqing project of € 231.5 million which were partly offset by exchange rate effects.
The increase in intangible assets of a total of € 58.5 million or 129.4% to € 103.7 million (previous year: € 45.2
million) is mainly due to capitalised development costs of € 61.1 million that meet the criteria of IAS 38.
Property, plant and equipment rose by a total of € 235.6 million, mainly due to additions in Chongqing of
€ 163.7 million and technology upgrades in Shanghai of € 52.1 million. Amortisation and depreciation of
€ 90.5 million (previous year: € 77.5 million) and exchange rate effects of € -67.3 million were taken into
account in the net change in fixed assets which rose by € 144.0 million or 22.2% to € 792.9 million (previous
year: € 648.9 million).
Non-current assets include input tax receivables of € 27.9 million (previous year: € 17.6 million) which can
only be offset against VAT payables in over one year's time.
Net working capital
€ in millions (unless otherwise stated)
31 Mar 2016 31 Mar 2015
Change
in %
Inventories 83.4 89.2 (6.5%)
Trade receivables 110.0 113.5 (3.1%)
Trade payables (130.7) (97.8) 33.6%
Liabilities from investments 55.6 17.5 218.1%
Working capital trade 118.4 122.4 (3.3%)
Other current assets, payables, provisions (29.9) (27.1) 10.5%
Net working capital 88.4 95.3 (7.2%)
Net working capital in % of total revenue 11.6% 14.3%
Days outstanding (in days):
Inventories 50 64 (21.4%)
Receivables 53 62 (14.7%)
Payables 63 77 (17.9%)
Inventories declined by € 5.8 million or -6.5% from € 89.2 million to € 83.4 million, mainly due to exchange
rate effects. Increased inventories due to Chongqing were almost fully compensated by a reduction at the
other sites. Trade receivables fell by € 3.5 million or -3.1% to € 110.0 million (previous year: € 113.5 million)
1.3. Financial position
62 ATS Annual Report 2015/1636 ATS Annual Report 2015/16
due to exchange rate effects. Days of receivables outstanding decreased by 16.3% to 53 days (previous year:
62 days) due to higher revenue. Trade payables increased by € 32.9 million or 33.6% from € 97.8 million to
€ 130.7 million. This increase was due to an increase of € 38.1 million in payables of investments for
€ 55.6 million (previous year: € 17.5 million).
Equity decreased by € 35.5 million or -5.9% from € 604.4 million to € 568.9 million. The positive contribution
from the Group result increased equity by € 56.0 million (previous year: € 69.3 million), however, negative
currency differences from the translation of subsidiaries' net asset positions and from the translation of long-
term loans to subsidiaries decreased equity by € 82.5 million. The decrease results from devaluations of the
Chinese yuan renminbi, the Indian rupee and the South Korean won compared to the euro. Actuarial gains,
mainly resulting from the higher interest rates applied in calculating personnel provisions, increased equity by
€ 2.7 million (previous year: reduction of € 6.8 million).
Non-current financial liabilities increased by € 2.3 million or 0.6% from € 359.3 million to € 361.6 million and
thus maintained the level of the previous year. Current financial liabilities increased from € 46.0 million to
€ 161.4 million. These included the reclassification of the bond due on 18 November 2016 with a residual
carrying amount of € 76.8 million.
Net debt
€ in millions (unless otherwise stated)
31 Mar 2016 31 Mar 2015
Change
in %
Financial liabilities, current 161.4 46.0 250.6%
Financial liabilities, non-current 361.6 359.3 0.6%
Gross debt 523.0 405.3 29.0%
Cash and cash equivalents (171.9) (273.9) (37.3%)
Financial assets (87.9) (0.9) 9,890.9%
Net debt 263.2 130.5 101.7%
Operating result before interest, tax, depreciation and amortisation
(EBITDA) 167.5 167.6 (0.0%)
Net debt/EBITDA ratio 1.6 0.8
Equity 568.9 604.4 (5.9%)
Total consolidated statement of financial position 1,344.7 1,220.8 10.1%
Equity ratio (%) 42.3% 49.5%
Net gearing (Net debt/Equity) (%) 46.3% 21.6%
Despite high cash flows from operating activities, net debt increased by € 132.7 million or 101.7% to
€ 263.2 million (previous year: € 130.5 million) due to the high capital expenditures and the dividend paid.
The gearing ratio increased to 46.3% and was thus significantly above the previous year's level of 21.6%. The
indicator net debt/EBITDA, which represents a theoretical payback period for debts, declined from 0.8 years
to 1.6 years due to the higher net debt.
Net debt/EBITDA
Multiple
Net gearing
in %
2.1
0.9
0.8
1.6
12/13 13/14 14/15 15/16
71.3
28.4
21.6
46.3
12/13 13/14 14/15 15/16
63Group Management ReportConsolidated Financial Statements 37
TREASURY ACTIVITIES In financial year 2015/16, Group Treasury set essential strategic directions for the
coming years. With the aim of securing the current extremely favourable market conditons in the financing
sector over the long term, reducing the costs of interest within the next years, refinancing the bond due on
18 November 2016 and extending the maturity date, ATS successfully placed promissory note loans with a
total volume of € 221.0 million on the market on 23 October 2015. Additionally, a bilateral promissory note
loan of € 100.0 million was signed at the beginning of March 2016, which was disbursed in April 2016. Along-
side the general financing of the Group, received funds were used for the partial, premature buyback of the
bond with a nominal value of € 24.5 million and for the early redemption of the variable part of the promisso-
ry note loan with a volume of € 92.0 million that had been placed in 2014.
The financing of ATS is based on a four-pillar strategy that minimises dependence on individual financing
instruments. Based on the prevailing financial market conditions, individual areas can be expedited more
strongly or, as the case may be, not used at times.
The starategy is based on long-term, fixed interest bearing retail bonds. Their advantage lies in their high
predictability and security for the Company as they bear fixed interest rates and are non-redeemable. How-
ever, their higher placement costs are a disadvantage. The current retail bond, which has a carrying amount
of € 76.8 million, matures on 18 November 2016. On 22 October 2015, bonds with a nominal value of
€ 18.0 million and on 25 February 2016 bonds with a nominal value of € 6.5 million, were bought back early
from institutional investors. The aim of this measure was to use existing liquidity to yield a return. The current
point of view is, that the maturing bonds will not be replaced for the time being.
Promissory note loans provided the the key support for the financing strategy in financial year 2015/16: Their
key feature is also their high level of predictability – however, their placement costs were far lower. In March
2014, € 156.5 million and US$ 2.0 million with maturities of 5, 7 and 10 years, were placed. An interest rate
swap was used to convert future variable euro interest obligations into fixed interest payments. The variable
tranche of the promissory note loan placed in 2014 of € 92.0 million was partially reimbursed in October
2015, the remaining part was reimbursed in February 2016 in order to optimise financing costs. The
concluded interest rate swaps continue to be used as security against the promissory note loan placed in
October 2015 in order to hedge the variable interest payables in euros over a major part of the term. Howev-
Development of net debt
€ in millions
gearing in %
21,6 %
28,4 %
CAPEX
project
Chongqing
CAPEX
others
Cash
flow
from
operatingactivities
before
changesin
W
C
Dividend
Changesin
networkingcapital
and
other
Netdebtand
netgearing
asof31.3.2016
Netdebtand
netgearing
asof31.3.2015
130.5
21.6%
46.3%
+190.3
+64.5
+14.0
-145.9
+9.8
263.2
64 ATS Annual Report 2015/1638 ATS Annual Report 2015/16
er, the effectiveness criteria of hedge accounting in accordance with IFRS are no longer being met and the
evaluation is therefore recognised in the statement of profit or loss.
On 23 October 2015, a promissory note transaction with a total volume of € 221.0 million was closed success-
fully. The emission volume originally aimed for € 100 million was increased to € 221.0 million due to the high
demand. The promissory note loan consists of tranches with terms of five and seven years at fixed and varia-
ble interests rates in euros and US dollars with an average interest rate at issue of around 1.6%. On 4 March
2016, a bilateral promissory note loan of € 100.0 million and a term of seven years, which will be paid out in
April 2016, was signed. In the financial year 2015/16, the amount will be shown as unused credit lines. Due to
the above-mentioned advantages, ATS is planning to focus also on this type of financing in the future.
Bank loans are used as the third pillar. € 122.3 million in loans was taken out from several national and inter-
national banks. These loans mainly bear variable interest rates and have maturities of between one and six
years.
The fourth pillar consists of credit lines serving to cover liquidity fluctuations. At the reporting date, ATS
reported more than € 247.4 million in unused credit lines in the form of loans commitments from banks or
promissory note loans already concluded.
The most important task of the treasury function at ATS is to secure sufficient liquidity reserves. It also
monitors covenants defined in the credit agreements in order to ensure compliance with them.
The notional payback period for debts, defined as net debt/EBITDA, of 1.6 years was significantly below the
covenant of 4.0 and the Group’s own target value of 3.0, and has worsened due to the high level of invest-
ment activity (previous year: 0.8 years). The equity ratio decreased from 49.5% in the previous year to 42.3%
in the reporting year and thus continued to be significantly above the target value and the covenant. The
equity ratio is negatively impacted by the higher gross debt resulting from the early financing. For further
information regarding capital risk management, please refer to Note 20 “Additional disclosures on financial
instruments“ – sub-section Capital Risk Management – in the notes to the consolidated financial statements.
Treasury keydata
Covenant1)
Target2)
31 Mar 2016 31 Mar 2015
Net debt/EBITDA ratio  4.0  3.0 1.6 0.8
Equity ratio 35% 40% 42.3% 49.5%
1)
Covenants are limits included in old credit agreements which the actual figures should not exceed (Net debt/EBITDA) or undercut (equity ratio).
2)
Target values are limits defined by ATS which the actual figures, under normal circumstances, should not exceed (Net debt/EBITDA) or undercut (equity ratio).
ATS pursues a financing structure that is as balanced as possible, with an average duration that is con-
sistent with the investment programme. At the reporting date, the duration was 3.9 years (previous year:
3.8 years). This slight increase is due to the placement of the promissory note loan in October 2015 which
reimbursed part of the promissory note loan from 2014 that had a higher interest rate and is intended to
redeem the bond due on 18 November 2016.
As a result of the repayment of the bond and bank loans of € 158.3 million in 2016/17 and the repayment of
parts of the promissory note loan and bank loans of € 167.8 million in 2020/21, the financing structure shows
a high amount in both years.
Redemption
€ in millions
76.6
167.8
29.1
79.2
19.8
158.3
 20/21
20/21
19/20
18/19
17/18
16/17
65Group Management ReportConsolidated Financial Statements 39
Carrying amount of financial liabilities by maturity
€ in millions
31 Mar 2016 in % 31 Mar 2015 in %
Remaining maturity
Less than 1 year 161.4 30.9% 46.0 11.4%
Between 1 and 5 years 285.3 54.5% 321.6 79.3%
More than 5 years 76.3 14.6% 37.7 9.3%
Total financial liabilities 523.0 100.0% 405.3 100.0%
A further aim was to minimise the interest rate risk by predominantly using fixed interest rates. 73.9% (previ-
ous year: 78.3%) of financing is conducted at or was swapped to fixed interest rates, and only 26.1% (previ-
ous year: 21.7%) is based on variable interest rates. These strategies for securing interest rates are being
continuously adapted based on expectations of interests rates.
ATS also intends to invest available liquid funds profitably but risk-sensitively: As at 31 March 2016 ATS
had total financial resources of € 259.8 million (previous year: € 274.8 million). By optimising the terms of
investment and early conversion of liquid funds into currencies with higher interest rates and which are also
continually required by ATS, the highest possible yields should be achieved in a currently very challenging,
from an investor-perspective, environment.
This early conversion into foreign currencies serves as a natural currency hedge and a reduction of the expo-
sure to foreign currencies. In addition to this natural hedging and the above-mentioned instruments for
interest rate hedging, ATS occasionally hedges foreign currency transaction risks in the short-term (less than
one year). At the reporting date, there were no such hedging instruments in place. Currency translation risks
resulting from the conversion of subsidiaries with different local currencies are not hedged.
The final treasury aim consists of an optimised debtor relationship management. ATS considers these to be
defining banks for national and international cooperation and setting up and maintaining the communication
that is needed on both sides. The aim is to create transparency across the opportunities and risks of ATS in
order to strengthen a long-term partnership with the financing institutions, that is profitable for both sides.
The annual and quarterly reports act as the basis for this. In addition, meetings with our financing bank part-
ners take place at least once a year in which the opportunities for cooperation are discussed.
ATS adopts an active approach to financial management in order to achieve the above-mentioned treasury
aims as cost-effectively as possible. The measures taken in financial year 2015/16 will reduce both the aver-
age financing costs and, from a current perspective, the total financing costs for the next year, even though
the gross debts are expected to rise. For financial year 2016/17, ATS must take advantage of current low
interest rates in order to conclude further long-term financing contracts.
CASH FLOW Cash flow from operating activities before changes in working capital increased slightly from
€ 145.0 million to € 145.9 million. The decrease in profit for the year from € 69.3 million to € 56.0 million and
the increase in interest payments increased from € 14.5 million to € 15.5 million were offset by higher depre-
ciation and amortisation and by a reduction in tax payments (from € 16.4 million to € 10.3 million).
Cash flow from operating activities decreased from € 143.9 million by € 7.0 million or -4.8% to € 136.9 million.
While cash flow from operating activities before changes in working capital increased by € 0.9 million or 0.7%
to € 145.9 million, cash used in working capital rose by € 6.5 million. There was a lower inflow from other
provisions of € 1.3 million.
Maturities of
financial liabilities
in %
Average financing costs
in %
 5 years  1 year
1 – 5 years
54.5%
14.6%
30.9%
4.6
3.7 3.6 3.3
12/13 13/14 14/15 15/16
66 ATS Annual Report 2015/1640 ATS Annual Report 2015/16
Due to investment activities in Chongqing and Shanghai, various technological reinvestments at the other
sites and the placing of liquid funds with terms of over 3 months, cash flow from investing activities amount-
ed to € 342.2 million. Capital expenditures on property, plant and equipment and intangible assets amounted
to € 254.8 million and was thus € 89.5 million above very high previous year’s level of € 165.3 million.
At € 111.1 million, cash flow from financing activities was exceptionally higher at € 99.2 million above the
previous year’s figure, due to the placing of promissory note loans with a volume of € 221.0 million.
Free cash flow, i.e. cash flow from operating activities plus cash flow from investing activities, was negative at
€ 205.3 million due to the high investment activities and was € 184.4 million below the previous year's figure
of € -20.9 million. € 87.7 million of this change resulted from the investing of cash and cash equivalents and
€ 0.3 million from payments for the acquisition of minority interests.
Cash flow statement (short version)
€ in millions
2015/16 2014/15
Change
in %
Cash flow from operating activities
before changes in working capital 145.9 145.0 0.7%
Cash flow from operating activities 136.9 143.9 (4.8%)
Cash flow from investing activities (342.2) (164.8) 107.7%
Free cash flow (205.3) (20.9) 881.9%
Cash flow from financing activities 111.1 11.9 830.2%
Change in cash and cash equivalents (94.2) (9.0) 950.6%
Currency effects on cash and cash equivalents (7.8) 22.8 (134.3%)
Cash and cash equivalents at end of the year 171.9 273.9 (37.3%)
Due to the high level of investments, cash and cash equivalents decreased from € 273.9 million to
€ 171.9 million, despite the very strong cash flow from operating activities and the above-mentioned financ-
ing and investment measures. In addition, ATS disposes of current financial assets of € 87.8 million (previ-
ous year: € 0.8 million). This amount, which currently remains very high, is being used to secure the financing
of the new plant in Chongqing and the repayment of the bond that matures on 18 November 2016.
ATS PERFORMANCE SYSTEM In addition to revenue and EBITDA, ATS uses a further three key
figures as primary reference values for performance measurement in internal strategic corporate manage-
ment: ROCE, cash earnings and IRR. They describe and control performance in respect of investors, opera-
tional performance and performance in respect of customers.
ATS uses return on capital employed (ROCE) to measure its performance from the point of view of inves-
tors, using the ratio of the result adjusted for finance costs – net and average capital employed. This illus-
trates the extent to which ATS fulfills its investors' interest requirements. Average capital costs are derived
from the minimum return expected by investors to provide equity or borrowings. The weighted average cost
of capital (WACC) for the printed circuit board industry is around 8.9%. At a ROCE of 8.2%, ATS was not able
to achieve the WACC figure in the reporting year due to the expenditure in Chongqing and the associated
average capital employed. After adjustments, ROCE was 19.3% (previous year: 18.5%). The return on capital
employed in the core business was thus significantly higher than the return expected by investors.
67Group Management ReportConsolidated Financial Statements 41
ROCE declined year-on-year due to the decrease in EBIT. However, as a result of the considerable investment
activities in the Chongqing project, the average capital employed rose to € 783.5 million (previous year:
€ 618.2 million).
Return on capital employed (ROCE)
€ in millions
2015/16 2014/15
Change
in %
Operating result (EBIT) before non-recurring items 77.0 90.1 (14.6%)
Income taxes (12.9) (15.6) (17.6%)
Operating result after tax (NOPAT) 64.1 74.5 (13.9%)
Equity - average 586.7 497.5 17.9%
Net debt - average 196.9 120.7 63.1%
Capital employed - average 783.5 618.2 26.7%
ROCE 8.2% 12.0%
In addition to the investor-oriented key figure of ROCE, ATS uses cash earnings as a control reference. This
indicator describes a company's operational financial performance.
Cash earnings fell only slightly by € 0.3 million or -0.2% to € 146.5 million (previous year: € 146.8 million). The
decline in profit for the year was mainly due to higher depreciation and amortisation which are non-cash
costs and thus do not affect cash earnings.
Cash earnings
€ in millions (unless otherwise stated)
2015/16 2014/15
Change
in %
Profit for the year attributable to owners of the parent company 56.0 69.3 (19.2%)
Depreciation and amortisation and impairments of property, plant
and equipment and intangible assets 90.5 77.5 16.8%
Cash earnings 146.5 146.8 (0.2%)
Cash earnings per share (€) 3.77 3.78 (0.3%)
The third performance indicator relates to the ability to implement innovations in a timely manner and in
response to the market. ATS measures this ability by using the innovation revenue rate (IRR), which ex-
presses the revenue share of products that feature new and innovative technologies and which were
launched on the market in the last three years. For financial year 2015/16, the IRR is 19.6% (previous year:
29.2%). ATS aims to achieve an IRR of at least 20%. This decline was due to the maturity of certain genera-
tions of technology in 2015/16.
Innovation Revenue Rate (IRR)
€ in millions
2015/16 2014/15
Change
in %
Main revenue 762.7 666.7 14.4%
Main revenue generated by innovative products 149.2 194.7 (23.4%)
IRR 19.6% 29.2%
ROCE
in %
Cash earnings
€ in millions
Innovation Revenue Rate (IRR)
in %
5.6
9.6
12.0
8.2
12/13 13/14 14/15 15/16
85.6
111.4
146.8
146.5
12/13 13/14 14/15 15/16
19.2
26.5
29.2
19.6
12/13 13/14 14/15 15/16
68 ATS Annual Report 2015/1642 ATS Annual Report 2015/16
Until 9 May 2016, no events or developments came to ATS' attention that would have resulted in significant
changes in the disclosure or measurement of the individual asset and liability items as at 31 March 2016.
Significant events after the reporting2.
period
69Group Management ReportGroup Management Report 43
The ATS group currently operates the following six active production plants specialising in different technologies.
LEOBEN AND FEHRING The Austrian plants mainly deliver to the European and, to an increasing ex-
tent, American markets. Short turnaround times, special applications and proximity to customers are particu-
larly important in Europe. The plant in Leoben successfully continued with the niche and prototype produc-
tion which was launched in recent years. Despite the high production capacity utilisation at the Leoben site,
the flexibility to handle short-term requests was maintained. Production for the future market of Advanced
Packaging is also operated in Leoben. The production capacity utilisation of the plant in Fehring showed a
satisfying development in the reporting year. Synergies with other sites (Leoben and Nanjangud) are utilised
in the outer layer manufacturing of multilayers. The decline in the original core business (double-layer printed
circuit boards) was compensated by these measures.
SHANGHAI The plant in Shanghai produces HDI (high density interconnection) high-tech printed circuit
boards in serial production for the Mobile Devices  Substrates segment and has customers all over the
world. Capacity was well utilised in the financial year 2015/16 and, in some months, this plant was running at
maximum capacity. Moreover, demand for HDI printed circuit boards for the automobile industry remained
further on a very high level in 2015/16, which were produced for the Automotive, Industrial, Medical seg-
ment. The trend towards thinner line space was proactively used by the site to secure its leading technologi-
cal position for the upcoming years.
CHONGQING ATS sets another technological milestone at this new plant in China with the production of
IC substrates (integrated circuit substrates). The certification of the first products was achieved in February
2016 and the serial production then started. The second substrate line is intended to start operations in the
financial year 2016/17. The buildup of the second plant for substrate-like PCBs is on schedule, the installation
of the first line should be completed by the middle of the year, and the start of production and initial reve-
nues are expected in the second half of the financial year.
ANSAN The positive performance of the Korean plant continued in the financial year 2015/16. In addition
to the still very good utilisation of production capacities in the area of medical products for European and
American customers, substantial volumes for the Mobile Devices  Substrates segment were also produced.
The minority shares were acquired in the last financial year and, with SAP implementation, the plant also
made progress in organisational terms.
NANJANGUD Revenue and the operating result showed a negative trend due to exchange rate effects.
Manufacturing efficiency (material and energy consumption as well as maintenance costs) was improved
through targeted measures. The plant's capacity was continuously at a very high level.
HONG KONG The company ATS Asia Pacific, which is based in Hong Kong, is the holding company for
the Mobile Devices  Substrates segment and the headquarters of Group-wide procurement for to this seg-
ment. The proximity to the CEMs of customers and to suppliers is another locational advantage which the
business partners highly appreciate. About 60% of the Group’s revenue is carried out via this company.
The sales offices in America, Germany, Japan and Taiwan continued to guarantee good and close contact with
customers in the financial year 2015/16.
Plants and branch offices3.
Austria
China
China
South Korea
India
China
Sales offices
70 ATS Annual Report 2015/1644 ATS Annual Report 2015/16
The ATS Group divides its operating activities into three segments: Mobile Devices  Substrates, Automo-
tive, Industrial, Medical and Others. The Mobile Devices  Substrates segment mainly comprises the applica-
tions of smartphones, tablets, notebooks and consumer products such as digital cameras. At the beginning of
the financial year, the Industrial  Automotive segment was renamed Automotive, Industrial, Medical. This
change was made to underline the growing significance of business with medical devices in both therapy and
diagnosis. The segment includes the industrial electronics, automotive, aviation  security, and medical appli-
cations. The Others segment covers the activities of the Advanced Packaging business unit (which is in the
development phase) as well as higher-level Group activities. The Advanced Packaging business unit neither
reaches the quantitative thresholds, nor are its opportunities and risks material to the Group as a whole. It is
therefore not presented as a segment of its own in segment reporting.
MOBILE DEVICES  SUBSTRATES SEGMENT The applications of the Mobile Devices  Substrates
segment require technologically sophisticated printed circuit boards and permanent process and product
innovations. The ongoing growth in demand for smartphones all over the world is the key growth driver. The
growing performance of these devices would not be possible without HDI (high density interconnection)
printed circuit boards. ATS is one of the leading suppliers of HDI technology around the world and ranked
third in 2014 (source: Prismark, August 2015). With a revenue share of 59.3% (previous year: 57.3%), the
Mobile Devices  Substrates segment still remains the largest segment of the ATS Group.
Mobile Devices  Substrates segment – overview
€ in millions (unless otherwise stated)
2015/16 2014/15
Change
in %
Segment revenue 539.7 455.2 18.6%
Revenue from external customers 452.5 382.1 18.4%
Operating result before depreciation and amortisation (EBITDA) 126.4 127.5 (0.8%)
EBITDA margin (%) 23.4% 28.0%
Operating result (EBIT) 48.3 60.1 (19.7%)
EBIT margin (%) 8.9% 13.2%
Additions to fixed assets 271.8 126.8 114.3%
Employees (incl. leased personnel), average (no.) 5,990 5,017 19.4%
At € 539.7 million, revenue generated exceeded the previous year's figure of € 455.2 million by € 84.5 million
or 18.6%. The very high demand from high-value mobile devices such as smartphones also continued in the
first quarter of the current financial year and, combined with favourable exchange rates for ATS, led to
significant revenue increases. The second quarter, however, benefited from the ongoing strong demand, the
product launches in the mobile industry and the favourable exchange rates. The third quarter was character-
ised by a return to normal growth rates and revenue managed to maintain the exceptionally strong level of
the previous year. The fourth quarter, which is usually weaker as a result of plant closures due to the Chinese
New Year, instead showed stable demand in the reporting period and was only slightly lower than the
exceptionally strong level of the previous year.
In terms of geography, there was a further revenue increase from our American customers. Furthermore, the
segment’s revenue was positively affected by sustained high demand from the Automotive, Industrial, Medi-
cal segment. The plant in Shanghai, which is allocated to the Mobile Devices  Substrates segment, achieved
significantly higher revenues with the Automotive, Industrial, Medical segment.
At € 126.4 million, segment EBITDA was € 1.1 million or -0.8% below on the previous year’s figure of
€ 127.5 million and was negatively impacted in the fourth quarter by startup costs for the new site in Chong-
qing. Given the stable and high demand throughout the year, very high utilisation could be achieved.
Business development by segments4.
Mobile Devices  Substrates
Development of revenue
€ in millions
Mobile Devices  Substrates
Revenue from external
customers by quarters
€ in millions
Mobile Devices  Substrates
EBITDA Development
€ in millions
Mobile Devices  Substrates
EBITDA by quarters
€ in millions
334.7
378.3
455.2
539.7
12/13 13/14 14/15 15/16
68.0
88.7
120.9
104.5
115.9
112.2
123.4
101.0
Q1 Q2 Q3 Q4
2014/15 2015/16
82.0
106.8
127.5
126.4
12/13 13/14 14/15 15/16
21.5
30.5
43.9
31.6
33.3
34.4
41.5
17.3
Q1 Q2 Q3 Q4
2014/15 2015/16
71Group Management ReportGroup Management Report 45
Furthermore, the ongoing good product mix and positive exchange rate effects led to an improved result that
almost offset the higher startup costs at the Chongqing site. At 23.4%, the EBITDA margin for the Mobile
Devices  Substrates segment was 4.6 percentage points down on the previous year’s figure of 28.0%. Ad-
justed for the results of the new Chongqing site, the EBITDA margin was 26.0% compared to 28.5% in the
previous year and reflects a return to normality.
The operating result (EBIT) decreased by € 11.8 million or -19.7% to € 48.3 million (previous year:
€ 60.1 million). Compared to the previous year, impairments on technologies no longer in use decreased by
€ 2.9 million to € 3.1 million (previous year: € 6.0 million). Depreciation was affected by the beginning of the
depreciation of the substrate plant in Chongqing which was caused by the certification and the accompanying
start of serial production. Before only the administration building was included in the depreciation.
The EBIT margin decreased by 4.3 percentage points to 8.9% (previous year: 13.2%) due to the decrease in
EBIT and increase in revenue.
Additions to assets increased by € 145.0 million or 114.3% to € 271.8 million (previous year: € 126.8 million).
Alongside additions of € 52.2 million resulting from ongoing investment in technology upgrades, replace-
ments and expansion investments in the Shanghai plant, non-current assets increased by € 219.6 million at
the new site in Chongqing. The first products of the new IC substrate line were successfully certified, and
serial production was started. The further expansion of the site is on schedule. The second production line for
IC substrates is currently being installed and serial production should start in financial year 2016/17. Addi-
tionally, installation began of the first production line in the plant for substrate-like PCBs in the nearly com-
pleted building of the plant which will also start operating in the next financial year 2016/17, resulting in
initial revenue.
AUTOMOTIVE, INDUSTRIAL, MEDICAL SEGMENT With revenue growth of € 24.9 million to
€ 326.7 million (previous year: € 301.8 million), the Automotive, Industrial, Medical segment generated an
increase of 8.2%. This positive development was based, on the one hand, on continually increasing demand in
the automotive sector (the share of electronic components in vehicles, e.g. for advanced driver assistance
systems, continues to increase) and, on the other hand, on a stronger demand in the medical technology
sector.
Automotive, Industrial, Medical segment – overview
€ in millions (unless otherwise stated)
2015/16 2014/15
Change
in %
Segment revenue 326.7 301.8 8.2%
Revenue from external customers 306.5 282.9 8.4%
Operating result before depreciation and amortisation (EBITDA) 30.1 34.8 (13.5%)
EBITDA margin (%) 9.2% 11.5%
Operating result (EBIT) 19.2 25.9 (25.8%)
EBIT margin (%) 5.9% 8.6%
Additions to fixed assets 29.4 25.5 15.0%
Employees (incl. leased personnel), average (no.) 2,616 2,489 5.1%
Automotive, Industrial,
Medical
Development of revenue
€ in millions
Automotive, Industrial,
Medical
Revenue from external
customers by quarters
€ in millions
243.7
272.9
301.8
326.7
12/13 13/14 14/15 15/16
72.6
71.7
65.9
72.6
77.8
79.5
72.7
76.6
Q1 Q2 Q3 Q4
2014/15 2015/16
72 ATS Annual Report 2015/1646 ATS Annual Report 2015/16
Regarding the development of the Leoben, Fehring, Ansan and Nanjangud sites allocated to the Automotive,
Industrial, Medical segment, refer to Section 3 in the Group Management Report. In general, financial year
2015/16 was characterised by stable capacity utilisation at a high level.
The segment result was, however, affected by negative exchange rate effects in financial year 2015/16 which
led to exchange rate based cost increases and had a severely negative impact on results. Overall, this resulted
in an decrease in EBITDA of € 4.7 million or -13.5% to € 30.1 million (previous year: € 34.8 million).
The EBITDA margin decreased by 2.3 percentage points to 9.2% (previous year: 11.5%).
The operating result (EBIT) decreased by € 6.7 million or -25.8% to € 19.2 million (previous year: € 28.5 mil-
lion). At 5.9%, the EBIT margin for the Automotive, Industrial, Medical segment was significantly below the
previous year's figure of 8.6% due to the effects stated above.
Additions to assets rose by € 3.9 million or 15.0% to € 29.4 million (previous year: € 25.5 million). These addi-
tions were due to ongoing investment in technology upgrades, replacements and expansion at all sites.
OTHERS SEGMENT Alongside general holding activities, the Others segment also includes the Advanced
Packaging business unit which is in the development phase. This business unit deals with embedding active
and passive electronic components in printed circuit boards by using the ECP® technology patented by ATS.
The objective is to further miniaturise the printed circuit boards while improving heat distribution, electrical
performance and service life. The business unit continued to significantly increase its revenue in financial year
2015/16, and to establish itself as a development partner to its customers. Due to the business unit still being
small in size, it is still not reported as a standalone segment.
Others segment – overview
€ in millions (unless otherwise stated)
2015/16 2014/15
Change
in %
Segment revenue 22.1 10.9 102.9%
Revenue from external customers 3.9 2.0 90.2%
Operating result before depreciation and amortisation (EBITDA) 10.9 5.2 108.8%
EBITDA margin (%) 49.2% 47.8%
Operating result (EBIT) 9.4 4.0 136.8%
EBIT margin (%) 42.4% 36.4%
Additions to fixed assets 1.9 2.1 (12.6%)
Employees (incl. leased personnel), average (no.) 153 133 14.9%
Automotive, Industrial,
Medical
EBITDA development
€ in millions
Automotive, Industrial,
Medical
EBITDA by quarters
€ in millions
20.1
21.5
34.8
30.1
12/13 13/14 14/15 15/16
8.4
9.4
9.4
7.6
8.7
10.5
5.7
5.2
Q1 Q2 Q3 Q4
2014/15 2015/16
73Group Management ReportGroup Management Report 47
In today's environment, where change is the only constant, committed employees are especially important to
us. To be the first choice for highly sophisticated technologies, a company like ATS must offer its employees
prospects and clear opportunities for development; it must support them and challenge them. Managers at
ATS play a particularly significant role in this respect. In order to embrace innovation as a company every
day, we need people who are prepared to go in new directions and are open to thinking in terms of alternatives.
HUMAN RESOURCES FACTS AND FIGURES In financial year 2015/16, ATS employed an average
of 8,759 full-time equivalents including temporary employees. This means there were 1,121 more full-time
equivalents compared to the average in the previous financial year. This increase is mainly attributable to the
hiring of staff at the plants in Chongqing.
Average number of full time equivalents (incl. leased personnel)
2015/16 2014/15 Change
Mobile Devices  Substrates segment 5,990 5,017 973
Automotive, Industrial, Medical segment 2,616 2,489 127
Others 153 132 21
Total Group 8,759 7,638 1,121
EXCELLENCE IN LEADERSHIP Three principles have been defined for excellence in leadership based
on the ATS vision and mission: OPEN-MINDEDNESS, COMMITMENT and RESPONSIBILITY. We consider
leadership to be an essential part in realising our vision and achieving our mission. Studies clearly show that
good leadership practices have a significant influence on employee commitment and dedication. Our leader-
ship values provide all of our managers with a framework that enables them to live effective leadership. In
the past financial year, we offered our first-level managers the opportunity to attend modules with a focus on
communication and a culture of feedback, which they also took advantage of. The improved dialogue they
initiated leads to better mutual understanding and provides space for reflection. Open and appreciative feed-
back creates fertile ground for frictionless, open and dynamic development for the entire organisation. As a result
of positive feedback, this initiative will be extended to the next level of management in financial year 2016/17.
SUPPORT AND CHALLENGE Communication and feedback are essential instruments for ensuring the
commitment of our employees and their desire to grow, both now and in the future. Managers at ATS
therefore have a responsibility to create an atmosphere of lifelong learning and a culture of dialogue for
every single employee. Their core responsibilities include talent management, continuous development of
skills and abilities, ongoing development of an open, two-way feedback culture, as well as providing support
and challenge for each individual employee.
The annual staff appraisal meeting is the basic tool that helps ATS managers to obtain a structured view of
the potential, experience and innovative ideas of their employees. In the staff appraisal meeting, goals are
agreed, based on the company's goals, for each employee in line with their responsibilities for the following
financial year. In addition, potential and development opportunities within the current position as well as
possible career paths are discussed. It is the responsibility of every manager to support and challenge their
employees according to their interests and potential.
In annual evaluations based on this, employees with the greatest development potential are selected for
further career steps and the next steps required are decided upon.
ATS employees have the opportunity to earn additional qualifications through internal and external training
programmes, workshops and coaching. Internally, we provide introductory training for new employees to
familiarise them with the market, our products, the organisational structure and procedures of ATS, and our
corporate values. Training programmes specific to ATS are provided by internal specialists. Cross-functional,
international and intercultural training supports our internal connections, the optimisation of processes and a
Group5.
5.1. Employees
74 ATS Annual Report 2015/162 ATS Annual Report 2015/16
continuous transfer of knowledge. Basic management training programmes include leadership principles and
training on the ever-current topic of change management and strategic development. A number of important
modules are offered as part of customised, site-specific training catalogues.
In the past financial year, ATS began a customised programme of training based on a Lean Management
(efficiency) and Six Sigma (effectiveness) approach in the areas of administration, research and production.
The Lean Six Sigma initiative at ATS is named iPOK internally (Implementation of Practice Oriented
Knowledge) and encompasses all employee and organisational levels. The training consists of a theoretical
and a practical section, with the latter designed to firmly anchor the theoretical learnings within the organisa-
tion for the long term. iPOK will help ATS achieve its vision and mission by means of improvement projects
and, moreover, have positive effects on our employees' work environment. Across all sites, a total of 52
employees have been certified or are participating in Black Belt training (project managers with cross-
functional projects and around 140 hours of training) and 81 employees are certified or participating in
“Green Belt training (project managers with departmental projects and around 40 hours of training). There
have been 133 Lean Six Sigma projects initiated as a result of this certification and training.
ATS offers comprehensive apprenticeships for the skilled workers of tomorrow, primarily in the areas of
mechatronics, laboratory technology, physics laboratory, mechanical engineering and metal technology, but
also in the administrative area. At the end of the financial year, we employed 27 apprentices in Austria and
one in Germany, and, during the past financial year, 11 apprentices started their apprenticeship with ATS.
So as to generate excitement among young people for technical professions at ATS, we participate in career
fairs specific to our target groups and offer school children a direct insight into production by means of our
ongoing, interactive ATS High Technology Experience as well as introductory and seasonal internships.
ATS also positions itself as an attractive employer for young academics. We provide information to them at
career fairs and, in close cooperation with universities, we offer bachelor and master thesis projects. With our
first International Talent Programme, which enabled training in Austria for the seven participants in eight
modules over a period of 12–18 months, we were able to train talented young academics from different
countries and make them fit for our sites in China. We are currently recruiting the second generation for
the international talent programme – this time for assignments in China and India. The tremendous interna-
tional interest in this programme is evidenced by the applications received from 63 countries.
In the past financial year, around € 1,926 thousand was invested in external training and continuing profes-
sional development. The increase of €1,056 thousand compared to the previous year is primarily attributable
to the specialised training of the new employees who were recruited in the course of establishing the plants
in Chongqing. In addition, ATS also invested in university training for employees in China and in global lead-
ership and iPOK Lean Six Sigma initiatives. On the one hand, these figures reflect the importance of the quali-
fications of new labour forces, but they also reflect the focus we place on efficiency, effectiveness and leadership.
Expenditure on external training sessions
€ in thousands
2015/16 2014/15
Change
in %
Mobile Devices  Substrates segment 1,147 384 198.9%
Automotive, Industrial, Medical segment 319 284 12.5%
Others 460 202 127.3%
Total Group 1,926 870 121.5%
DIVERSITY  MOBILITY As a company that operates globally, diversity among our employees is a basic
requirement for our success. ATS promotes equal opportunities with regard to career paths and remunera-
tion or training, irrespective of age, gender, background, religion, sexual orientation, ethnicity, disability, and
religious or political belief.
75Group Management ReportGroup Management Report 49
At the end of the financial year, the proportion of female employees at ATS was 35%. The female propor-
tion in Europe, at 43%, and the United States, at 37%, is still significantly higher than in Asia, where the pro-
portion of females within ATS is 33%. Women constitute 10% of the employees reporting directly to the
Management Board of the ATS Group.
As an international company, ATS employs people from 45 nationalities. We offer a variety of career options
at an international level to our employees, and also to external applicants – through our “International Talent
Programme”, for example – and we value professional mobility. We also promote cooperation across sites
and provide intercultural training entirely in the interest of maintaining a learning organisation and in accord-
ance with our leadership principle of Open Mindedness.
The average age at ATS is 31 years. This is primarily a result of the large number of young employees in
China, where the average age is 29. In Europe and the USA, the average age is 39 and 45 years, respectively.
The average term of service Group-wide is 5.4 years based on each of the sites. It is higher in Europe, at 12.2
years, than in Asia, at 4.2 years. This is also attributable to our sites in China, and mainly to the ongoing build-
up of employees in Chongqing.
CODE OF BUSINESS ETHICS AND CONDUCT ATS has made a voluntary commitment to corpo-
rate social responsibility (CSR) measures, and to the Electronic Industry Citizenship Coalition (EICC). In align-
ment with the Triple Bottom Line approach, we have a responsibility to conduct business sustainably and in
the interests of all stakeholders from an economic, ecological and social point of view. Clear ecological stand-
ards and goals and the creation of an appropriate environment for employees as well as the company allows
us to implement our environmental, economic and social goals equitably and simultaneously. We are proud
that the same standards for the environment, health and safety apply – and are put into practice – at all of
our plants. The Code of Business Ethics and Conduct requires all employees to conduct themselves in a
responsible and respectful manner and to comply with the standards set by ATS. This results in transparen-
cy and mutual trust, and at the same time appeals to the personal responsibility of every individual. Further
details with regard to our sustainability activities can be found in the chapter “Sustainability” and in the cur-
rent Sustainability Report.
REMUNERATION SYSTEM An important factor for motivating employees and for recruiting and re-
taining new talent, alongside remuneration in line with the market, is the opportunity to participate in the
financial success of the company. Based on the ATS global bonus system, individually and collectively agreed
bonus payments are distributed whenever specific hurdle rates (defined minimums for key data) have been
achieved. The basic requirement for participation is a positive EBIT for the Group as a whole. The hurdle rate
itself is coupled with achievement of a certain EBIT figure in relation to the budgeted goals of the respective
area of responsibility.
The level of the payment will depend on ROCE, Cash Earnings, the Innovation Revenue Rate (IRR) as well as
the individual performance of each member of staff. Details on how ROCE, Cash Earnings and the IRR are
determined can be found in Section 1.3. Financial position in the Management Report. The bonus system
also ensures that, in more challenging economic times in which set aims were not achieved, bonus payments
will be either reduced or entirely suspended.
OUTLOOK Excellence in leadership has an enormous impact on sustainable business success. The execu-
tive leadership programme – the further professional development of management in the interest of sustain-
ability – is therefore a significant area of focus for financial year 2016/17 and the years that follow. Based on
new standards, we will also aim for greater transparency and permeability with respect to our training and
career paths in all areas. The introduction of an expert career path alongside the management career path
will be an import pillar. Our goal is clear: we aim to create conditions for our employees that produce excep-
tional commitment to sustainably achieving our ambitious goals.
Proportion of
female employees
in %
35%
33%
43%
C
B
A
A - Europe and USA
B - Asia
C - Total
76 ATS Annual Report 2015/1650 ATS Annual Report 2015/16
Conduct business responsibly and sustainably. This is a clear commitment, which ATS has expressed again in
the past financial year by means of the rigorous continuation of our corporate and sustainability strategy and
the activities associated with it.
The significance of sustainability is clearly reflected in our corporate mission:
 We reduce our ecological footprint
 We care about people
 We create value
We create value that extends beyond a purely economic view. European standards at all sites, ambitious key
performance indicators for resource consumption and emissions, and a clear commitment to good corporate
citizenship are among the ways ATS expresses sustainable management.
At ATS, effective sustainability strategies centre on those areas that stand in the company's direct sphere of
influence and are found within the sustainability triangle of economy, ecology and social responsibility. So as
to satisfy this requirement, all important aspect groups were evaluated in a comprehensive process and the
key topics of the ATS sustainability strategy were jointly developed though a materiality analysis.
The following aspects from the materiality analysis define the key topics of ATS sustainability activities:
5.2. Sustainability
resource efficiency
raw materials scarcity
water consumption
renewable resources
ecological responsibility
of suppliers
waste
recyclability of products
recycling rate of input materials
hazardous substances
energy consumption
carbon footprint
renewable energy
product design: impact on
energy consumption
training
health care
social responsibility
of suppliers
accident preventionequal opportunities
workers council
communication with employees
regional social responsibility
business ethics
business related
impactlow
work environment
related impact
high
high
77Group Management ReportGroup Management Report 51
ENERGY AND CARBON FOOTPRINT We established processes at all of our plants that sustainably
ensure more energy-efficient operations. In this respect, the ongoing technological development in the print-
ed circuit board industry presents a great challenge for energy efficiency: new processes need time for evalu-
ation and optimisation of energy efficiency after the qualifying phase.
Toward the end of financial year 2014/15, the energy management standard ISO 50001 was introduced for
both sites in Austria. Within this framework, analyses of the potential were conducted in the financial year
2015/16, which found an energy savings potential of around 7 GWh. Comparable efficiency analyses are
already being planned for the sites in Asia and are expected to be implemented in financial year 2016/17.
Energy efficiency is reflected in the calculated CO2 emissions because a significant portion of total emissions
is based on the indicator purchased electricity. In a four-year comparison, the CO2 at ATS calculated as
CO2 per square metre of printed circuit board produced declined from 51 kg to 50.7 kg per m
2
. In the past
financial year, however, we were unable to achieve the set target of reducing CO2 emissions by 5% compared
to the previous year. This development is based on two factors: due to the high outdoor temperatures during
the summer months of the past year, greater energy needs for process and building cooling were recorded.
This resulted in higher CO2 emissions. In addition to this, the production of ever more complex printed circuit
boards with additional functional requirements also requires more energy consumption per m
2
of printed
circuit board produced. We are working hard to implement further improvements for the coming year.
WATER Special attention continued to be paid to water consumption in the past financial year because the
production of printed circuit boards is intensive in terms of water consumption. We therefore placed our
focus, as we did in the energy area, on highlighting the major consumption areas through an effective meas-
urement system and implementing the resulting optimisations – to the extent permitted by the production
parameters.
By means of continuous improvement projects, we were able to reduce our global water consumption con-
siderably. Details can be found in the Sustainability Report 2015/16.
RESOURCES Material costs represent a significant share of the production cost of a printed circuit board.
Efficiency improvements in this area have not only an economic impact. Most importantly, we reduce
unnecessary waste and improve our recycling rate.
Material consumption in the following table refers to the plants in production during financial year 2015/16.
Purchase of significant materials
Unit 2015/16 2014/15 2013/14
Gold kg 593 596 484
Copper*)
t 3,362 3,550 3,144
Laminate million sqm 13.5 13.4 12.5
Chemicals tsd. t 96.2 92.9 87.2
ATS AS A PLACE OF LEARNING As in past years, one of our main priorities is the training and
further development of our employees. In-depth training and corresponding experience not only benefits our
employees, who thereby set the cornerstone for their further development within the company, but also
benefits the quality of our technologies, the efficiency of our actions, and the relationships with our custom-
ers. A detailed presentation of the measures and programmes, as well as key indicators, is provided in the
Human Resources section.
Carbon footprint
in kg CO2 per sqm weighted PCB
Freshwater consumption
in litres per sqm weighted PCB
51.0
50.7
49.0
50.7
12/13 13/14 14/15 15/16
834.7
783.9
734.0
718.6
12/13 13/14 14/15 15/16
78 ATS Annual Report 2015/1652 ATS Annual Report 2015/16
SHAPING THE FUTURE BY THINKING AHEAD Anticipate the future. This is the basis of our vision
First choice for advanced applications. Although we are faced with intense competition, especially in Asia,
and generally constant price pressure, we do not compromise when it comes to the highest standards in all of
our spheres of influence. Be it implementation of the work and safety standard OHSAS 18001 at all of our
sites, which is now complete, or with regard to environmental and quality standards: we want to be the
industry benchmark at all of our sites and simultaneously be among the most profitable manufacturers of
printed circuit boards.
In the area of occupational safety, we were able to record an improvement compared to the previous year.
We consider our focus in this area to be especially important and we will always work to improve the existing,
extensive safety measures. Creating awareness among our employees plays a large role in this respect. For
this reason, we launched the initiative LIFE – Living in an Injury-Free Environment at the Chongqing site.
Through various measures, LIFE ensures that the issue of health and safety is ever present in the daily work
routine.
Due to our global presence, ethical principles among our employees and partners is a major priority. In ac-
cordance with the code of conduct of the EICC, an electronics industry organisation, we ensure that a work
environment is created at all of our plants that reaches beyond the legal requirements, one in which
employees count as people. We provide this information to our business partners though an annually recur-
ring self-disclosure.
We revised our Code of Business Ethics and Conduct in the past year. The code was adapted to the require-
ments of the EICC, the code of conduct of the electronic industry association. The code therefore reflects the
most recent developments in our corporate ethic. Thus, we ensure that all of our employees are sensitised to
important corporate issues such as preventing discrimination, anti-corruption or environmental matters and
occupational safety, and that they conduct themselves in accordance with these rules and the expectations of
the company. All employees commit to this through their signature. The management at the respective sites
are required to continuously monitor compliance.
For ATS, sustainability is an important contributor to the successful future of our company. Specific goals
and measures can be found in the Sustainability Report 2015/16.
Number of accidents at work
Working hours lost per one million hours
of work as of absence of more than one
day
5.7
4.0
6.1
5.0
12/13 13/14 14/15 15/16
79Group Management ReportGroup Management Report 53
HIGHLIGHTS IN THE FINANCIAL YEAR 2015/16
 19.6% of total revenue generated by technologically innovative products that have been on the market for
less than three years (Innovation Revenue Rate)
 Development project for the production of first generation IC substrates successfully completed – signifi-
cant, forward-looking innovation for ATS
 Increased use of Industry 4.0 technologies and processes in production.
The key sentence in the ATS Mission: “We industrialise leading-edge technologies is having an impact.
ATS generated about 20% of its revenues with innovative products launched onto the market during the last
three years. These products are the result of our consistent business and innovation strategy which has the
further expansion of technological leadership as its goal. ATS has set the target of achieving an Innovation
Revenue Rate (IRR) of at least 20% each year. This is intended not only to make a significant contribution to
revenue generation, but also as an expression of our major point of differentiation from the competition. Last
year, this figure was 29.2%. The decline is attributable to the maturity of certain generations of technology
during financial year 2015/16.
The electronics industry is currently undergoing profound change. This was triggered by the slowdown in the
speed of development in processor technology. (Remark: Moore’s Law, which says that the complexity of
integrated circuits always doubles within 12 to 24 months, is no longer valid.) This creates completely new
opportunities for certain segments of the electronics supply chain: specifically for the packaging, substrate
and printed circuit board industry. Many new functions and features can be produced with significantly less
development expense than would be needed to produce them on chips. The further development in our
areas of business will have an enormous impact on the entire electronics market in the next several years.
ATS is anticipating these trends by taking them into account in our short- and long-term focus areas for
development.
RD FOCUS AREAS IN THE PAST FINANCIAL YEAR
 Flexibility/Design: integration of electronics in the smallest of spaces and interconnection of electronic
modules
 Miniaturisation/Weight reduction: devices are becoming increasingly smaller, lighter and more powerful –
interconnection electronics need to create the foundation
 Modularisation/Packages: new, highly integrated modules to achieve the tightest packing density and
highest performance capacity for a simplified value creation chain
 High speed/High frequencies: contactless communication of people and devices with large volumes of data
and radar applications for self-driving cars and work equipment
 Power electronics/High currents: energy-efficient mobility implies the electrification of mobility – mechani-
cal solutions are being replaced by energy-saving electronic solutions
 Production processes/Business models: use of data to optimise and improve production processes; integra-
tion of new and incremental steps in the value creation chain and more efficient use of resources in pro-
duction
Research and development costs in financial year 2015/16 amounted to € 95.5 million. This corresponds to a
research rate (i.e. ratio to revenue) of 12.5% compared to 8.7% in the previous year. The figure for financial
year 2015/16 was heavily influenced by high development costs for the substrate technology. Adjusted for
this special project, the research rate was 4.5%, and the associated research and development expenses
increased by € 6.3 million or 22.3% to € 34.4 million (previous year: € 28.2 million). This research rate is the
basis for securing our position as a technology leader in the coming years.
5.3. Research and development
Innovation Revenue Rate (IRR)
in %
19.2
26.5
29.2
19.6
12/13 13/14 14/15 15/16
80 ATS Annual Report 2015/1654 ATS Annual Report 2015/16
Our innovative strength and long-term competitiveness is also demonstrated in the number and quality of
our patents. In financial year 2015/16, ATS submitted 46 new applications for patents. ATS now has
162 patent families, resulting in 212 granted patents.
We ensure efficiency in our development through close cooperation with customers, suppliers and research
institutions. Internally, ATS pursues a two-stage innovation process. Development activities in the fields of
materials, processes and applications are carried out at the ATS research institutions in Leoben to the point
where the basic technological feasibility has been demonstrated. This area thus covers applied research and
technology evaluation. After that, it is the responsibility of the local departments that have responsibility for
technology development and implementation situated at ATS sites worldwide to continue the experimental
development of products and processes in order to then integrate them within existing production opera-
tions.
HIGHLIGHTS FROM RESEARCH AND DEVELOPMENT PROJECTS In February 2016, after around
17 months of extensive development and intense effort, certification was completed for serial production of
the first generation of IC substrates at Plant 1 in Chongqing. To obtain this certification, all facilities and hun-
dreds of process steps had to be precisely defined and test substrate produced under serial-production con-
ditions. This step signified the start of serial production for the first of two production lines, for the present.
ATS will be manufacturing IC substrate – so-called flip-chip ball grid array substrates – for use in micro-
processors. ATS thus becomes the first manufacturer of high-end IC substrates in China.
In the area of high-end high density interconnects (HDI), currently the core business, ATS continued to
develop the next generation of printed circuit boards, known as substrate-like printed circuit boards. The
development of this technology made further advances at our Shanghai site by means of a test line, and even
is leading to technological enhancement for the entire site. Serial production will take place at an additional
plant at the site in Chongqing. The significant technological leap that comes with substrate-like printed circuit
boards will be introduced in the second half of 2016. It will enable an entirely new generation of products
with respect to miniaturisation and increasing the performance capacity of the products in our core business.
The trend continues toward higher currents on the printed circuit board and the related need for integrated
thermal management in printed circuit boards and electronic modules, and clearly shows that the develop-
ment by ATS of the past years now is proving to be fertile ground. The driver behind this trend is rising
electro-mobility and the future vision of autonomous driving. The new ATS solutions for power electronics,
which were developed as part of an international network, have generated great interest from customers.
ATS packaging solutions have been mirrored internationally, for example in the Little Box Challenge put
forth by Google for the smallest 2kV power inverter. As a result of the development work carried out by
ATS, it was possible to reduce the volume by a factor of more than 10 compared to today's conventional
inverters.
ATS focuses increasingly on the deployment of Industry 4.0 methods in its production processes. Data from
the manufacturing process is drawn upon to optimise product properties and the efficiency of the process
flow. In recent years, ATS has already introduced a Manufacturing Execution System (MES) at some sites,
enabling process monitoring and control with data in real time. In order to progress even further with these
methods and introduce additional applications, ATS is part of a European consortium consisting of 37 part-
ners from different positions along the electronics value creation chain. This is where, in the next three years,
new and coordinated solutions will be developed that reach beyond the current boundaries in the value
creation chain, which cannot be described here for competitive reasons.
Number of patents granted
in units
124
153
174
212
12/13 13/14 14/15 15/16
81Group Management Report
5
4
3
2
1
Group Management Report 55
PRINCIPLES, STRUCTURES AND PROCESSES Risk and opportunities management is a fundamen-
tal part of conducting business within the ATS Group. The target to increase enterprise value involves not
just opportunities but also the taking of risks as well. In order to identify risks at an early stage and deal with
them in a pro-active manner, and in accordance with the Austrian Code of Corporate Governance (ÖCGK),
ATS operates a Group-wide Risk Management (RM) system, an Internal Control System (ICS) in accordance
with COSO standards, as well as Internal Audit based on the IIA standard.
From an organisational perspective, the Risk Management, Internal Control System and Internal Revision
functions come within the responsibility of the CFO. The Internal Auditor and Group Risk Manager report to
the full Management Board as part of a monthly Management Board meeting. The inclusion of the Super-
visory Board takes place within the framework of the twice yearly Audit Committee meeting. The proper
functioning of the risk management system is assessed once a year by the external auditor in the course of
the annual audit of financial statements pursuant to Rule 83 ÖCGK.
The risk management process shown in Figure 1 is conducted at least twice a year. Risk management is con-
ducted based on the risk strategy and risk appetite at the hierarchy level assigned to the relevant level of risk.
(see Figure 2):
Figure 1: ATS Risk Management Process
RM: Risk Management; ICS: Internal Control System; BU: Business Unit
Figure 2: ATS Risk Levels and Risk Management
RISK MANAGEMENT IN 2015/16 In addition to the expansion of the ATS risk map and deeper
integration of risk management at all sites, a consistent Group-wide quantitative evaluation method for all
risks and opportunities was established in the past financial year. Uniform Group-wide documentation as part
of the internal control system is ensured by the risk management software developed by ATS for all signifi-
cant processes and sites. As a result of further development of this software, also in the past financial year,
the execution and documentation of the entire risk management process now takes place through this appli-
cation as of the start of financial year 2016/17.
Risk and opportunities management6.
Risk management process
Risk management software
Risk strategy Risk strategy: defined by the Management Board and persons
responsible for processes.
Risk identification: Group-wide survey with subsequent evaluation.
Immediate reporting of significant new risks (≥3).
Risk evaluation: consistent Group-wide evaluation of all risks with
respect to their monetary impact, probability of occurring, and
resulting risk rating of 1 (low) – 5 (very high).
Aggregation  Reporting: aggregation and regular reports on all
significant risks (risk level ≥3) to the Management Board and Audit
Committee by the Risk Manager.
Risk Mitigation  Monitoring: in accordance with defined reporting
and decision levels (based on risk level, see Figure 2).
Risk management software: Group-wide for risks and ICS controls.
Reporting
Aggregation
RISK AnalysisRISK CONTROL
Identification
Monitoring
Evaluation
Mitigation
Risk level Risk controlling Process Risk appetite  risk level: a maximum risk exposure
of 50% of equity is intended. The ATS risk levels are
derived from operating cash flow as an indicator of the
risk capacity of the Group.
ICS  RM: management of process risks (risk level 1-2)
supported by the internal control system. At Group level,
relevant risks (risk level ≥3) are managed and reported
through the risk management process.
Risk Mitigation: clear assignment of responsible decision
levels based on risk level (see left)
Supervisory Board
Management Board
BU Management
Plant Management
Process Management
RM
ICS
82 ATS Annual Report 2015/16
Risk strategy Significant risks  opportunities Trend Risk mitigation  opportunity realisation
Strategy Sales price development
Capacity utilisation, technology
development, investments
(substrate  substrate-like PCB)
§	Consistent focus on high-end technology and target applications
§	Future technological and strategic site alignment
§	Technology development projects and technology roadmap
§	Strict project control, periodic strategy workshops
Market Market and segment development
Development of key customers
Sales strategy and implementation
§	Balanced segment portfolios and diversification of the customer portfolio
§	New customer acquisition and share increases with existing customers
§	Consistent acquisition of defined target applications
PROCUREMENT Development of procurement prices
Single-source risk
Supply chain risk
§	Procurement strategy (negotiation, allocation, technical changes)
§	Single-source strategy; supplier risk evaluation and multi-sourcing
§	Supply chain optimisation and regional diversification
BUSINESS
ENVIRONMENT
Catastrophe, fire
Political risk
§	Internal  external audits, emergency practice, insurance
§	Business programme management, insurance
Operations Quality performance
Intellectual property
Technical project management
Operating costs
§	Black Belt programme, continuous quality improvement measures
§	Continuous expansion and protection of the IP portfolio
§	Rigorous technical project management
§	Cost reduction programmes at all sites
OrganiSation Loss of key personnel §	Employee retention, deputy regulation and succession planning
Finance Foreign exchange risk
Financing  liquidity
Tax risk
§	Natural FX hedging through long-term cash flow planning
§	Long-term planning for financing and liquidity, interest swaps
§	Continuous monitoring of compliance with tax laws
56 ATS Annual Report 2015/16
OPERATIONAL RISK MANAGEMENT The risks, uncertainties and opportunities facing the Group
are generally based on worldwide developments in the printed circuit board and substrate market. An over-
view of the ATS risk categories, significant individual risks, risk mitigation measures and the expected trend
is shown in Figure 3 and explained in further detail below.
IP: Intellectual Property; FX: Foreign Exchange; CF: Cash Flow
Figure 3: ATS Risk Categories, Significant individual Risks, Risk Trends and Risk Mitigation Measures
INVESTMENTS In order to make the most of growth potential and remain competitive, ATS undertakes
substantial investments in new forms of technology as well as in the further development and capacity ex-
pansion of existing technologies. There are particular opportunities to be gained from, but also risks to be
taken into account, in association with, entering into the substrates business. Entering this new business
segment was carried out through a strategic partnership with a leading global semiconductor manufacturer.
Furthermore, the location at Chongqing in China offers competitive advantages over the largely Japanese
dominated competition with respect to production costs.
Incorrect assessments of technological developments, changes in demand, and negative price developments
can have severe adverse effects on the intrinsic value of investments. These effects could relate, in particular,
to entry into the substrate business, building capacity for substrate-like printed circuit boards in Chongqing,
but also to all current ATS business activities as well.
COMPETITION The clear focus on the high-tech segment coupled with the highest quality standards and
consistent cost controls meant that ATS was able to achieve a competitive advantage over a majority of its
competitors in the HDI (high-density interconnect) technology segment. This focus enabled ATS to success-
fully withstand the effects of intense competition, overcapacity in the market, and persistent ‘commodifica-
tion’ (with a corresponding margin reduction). Complementing this was the successful transfer of HDI tech-
nology from smartphone applications and other mobile devices to further applications, such as those in the
automotive industry.
The opportunities related to Austrian plants of ATS are based on high flexibility, high quality standards and
the ability to react very quickly to changing specifications and technologies. These capabilities are absolutely
imperative for prevailing in the competitive environment, especially in the industrial segment, which is char-
acterised by diverse technological requirements among a large number of customers. To ensure our competi-
Strategy
83Group Management ReportGroup Management Report 57
tive edge, new forms of technology and projects are constantly pushed forward in close cooperation with our
customers.
Advanced Packaging, a technology which was introduced to the market under the ECP® brand name, also
offers considerable potential in itself, and the successful industrialisation of this technology continues to be
driven forward.
Competitor risks arise due to potential quality improvements and technological developments in countries
with low production costs. This could mean thas ATS sites, especially in Austria and possibly also at other
manufacturing locations like those in China, might become less competitive.
KEY CUSTOMERS With the help of advanced production technologies and high quality standards, the
ATS Group has managed – largely due to its capacities in Asia – to establish itself as a reliable provider to
some of the world’s most renowned players in the electronics industry. The revenue generated with the five
largest among these customers accounts for 56% of total revenue. Our long-term relationships with these
customers also offer excellent opportunities for the future. However, concentration of this kind also poses
risks in the event that there is a significant reduction in business volume from these customers. Therefore,
the ongoing expansion of ATS's competitiveness as well as the continued broadening of its customer base
and development of new product segments are of enormous significance to our ability to quickly compensate
a possible decline in the sales volume of any one key customer.
MARKET PERFORMANCE Emergence of a weak market environment in financial year 2016/17 could
have an adverse impact on the Group’s results. However, an upward trend in the economy could also lead to
increased business opportunities. The diversified positioning throughout Mobile Devices  Substrates as well
as the automotive, industrial and medical product segments provides some mitigation of market risks result-
ing from their different production cycles.
PROCUREMENT PRICES Price fluctuations in energy and raw materials (gold, copper and laminates)
can have both a positive as well as a negative impact on achievable margins in the short term. Currently, the
trend is positive, and will be further reinforced through targeted implementation of the procurement strategy.
SOURCING The sourcing strategy of ATS focuses on a wide and clearly diversified base of carefully se-
lected suppliers in order to reduce dependencies on individual suppliers. The Group enjoys long-standing and
stable customer-supplier relations with its main key suppliers with particular expertise and competitive stand-
ings. To avoid supply shortages, ATS conducts rigorous supplier risk management, taking account of regional
cluster risks, various supply routes, and alternative procurement options. So, with few exceptions – such as in
the IC substrates area for which the suppler base is smaller – alternative supplier options are available in
order to respond to supply risks.
LOCATION SPECIFIC RISKS The large majority of ATS’ operating activities is based at sites outside of
Austria, particularly in China. This means that the Group might be subject to potential legal uncertainties,
state intervention, trade restrictions or political unrest. Irrespective of the above, any production site of the
Group may furthermore be exposed to disruptive events such as fire, natural disasters, acts of war, shortages
of supply or other elementary events. The termination of land use rights, permits or lease contracts of
specific plants might also have a negative impact on the production output of the Group.
To minimise the effects of such risks, the Group has instituted business continuity management. The Group
conducts active insurance management by means of weighing the risks and associated costs. It has con-
cluded insurance contracts to the extent customary for a company of this size if such contracts are available
at costs which are reasonable in relation to the impending risks.
Market
Procurement
Business environment
84 ATS Annual Report 2015/1658 ATS Annual Report 2015/16
COMPLIANCE Any amendments to regulatory requirements, such as the prohibition of specific processes
or materials, might lead to a rise in production costs. ATS might be subject to payment of substantial penal-
ties should any breach of customer confidentiality agreements or statutory provisions occur. ATS has im-
plemented organisational measures aimed at preventing or minimising the occurrence of compliance risks.
The extension of such measures is ongoing. As a rule, ATS follows a zero-tolerance policy and expects 100%
compliance on the part of its employees with all applicable laws and regulations.
FRAUD, DATA SECURITY AND CYBERCRIME The rising number of ever-more professional at-
tempts at fraud and cybercrime has also been noted by ATS. To successfully prevent attempted fraud, in the
past, internal controls were further intensified in the financial year 2015/16 and initiatives to sensitise em-
ployees with regard to such fraud schemes were increased. Moreover, ATS continues to expand its data and
IT security measures on a regular basis.
QUALITY PERFORMANCE As in the past, it will be the high quality of products, adherence to delivery
deadlines and service quality which will offer the Group a chance to differentiate itself from the competition
and exploit growth opportunities in the future. Any technical defects, quality deficiencies or difficulties in
delivering products may expose ATS to warranty claims, claims for damages and contractual penalties,
resulting in product recalls and the loss of customers. ATS has established a quality management system
designed to rule out deficiencies in product quality and their negative consequences as far as possible. Fur-
thermore, the Group is insured against major risks by virtue of an (extended) product liability insurance policy.
INTELLECTUAL PROPERTY ATS endeavours to exploit any opportunities for obtaining intellectual
property as well as gaining access to promising patents through the development of its own projects, cooper-
ation schemes with partners and investments. Risks arise if ATS fails to protect its intellectual property, thus
enabling the competition to utilise these technologies. Legal disputes about intellectual property can prevent
ATS from using or selling disputed technologies. Furthermore, legal disputes with regard to the unauthor-
ised use of external intellectual property can have considerable negative financial consequences. The new
IC substrates segment in particular bears risks in this regard, as ATS needs to further increase its relevant
expertise in this field.
TECHNOLOGY AND PROJECT DEVELOPMENT The Group's know-how regarding project and
technology development, particularly in China, enables the Group to exploit further promising growth oppor-
tunities, such as the establishment and expansion of capacity for IC substrates and substrate-like printed
circuit boards in Chongqing. At the same time, however, this entails special risks, also in view of the substan-
tial volume of investments in the Chongqing project. Complications in the further technological development
and project implementation might result in major burdens for business development as well as existing finan-
cial and administrative resources. With the successful qualification/certification of the substrate plant in
Chongqing, the focus in the coming financial year will be on the ramp-up of serial production and continuous
performance improvement, as well as the qualification of additional production lines.
COST CONTROL Strict cost control at all sites is essential for maintaining the competitiveness and profit-
ability of the Group. Rising costs, for example caused by a substantial increase in wage costs, particularly at
the production sites in China, might have a negative impact on the competitiveness of the Group.
EMPLOYEES The collective industry experience and management expertise of the employees of the ATS
Group form the foundation for taking advantage of future opportunities. The business of the Group might
suffer if employees in leading positions were to terminate their employment relations with ATS or if ATS
were unable to continue to recruit highly qualified engineering, sales and administrative personnel and retain
them long-term. ATS continuously develops strategies for retaining key employees, recruiting valuable
personnel and further expanding the skills of its staff.
Operations
Organisation
85Group Management ReportGroup Management Report 59
EXCHANGE RATE RISKS Exchange rate fluctuations in EUR, RMB and USD – and to a lesser extent in
JPY, KRW and INR – can have considerable positive or negative effects on the results of the Group. To mini-
mise these effects, the Group employs a hedging strategy by means of the long-term forecasting of cash
flows in each currency.
FINANCING AND LIQUIDITY To secure the financial needs for the expansion strategy, the Group uses
long-term financial and liquidity planning. Interest rates are hedged centrally for the Group as a whole
through Group Treasury in part with the use of appropriate financial instruments.
For more information on financial, liquidity, credit and foreign exchange risks, please refer to Note 20 Addi-
tional disclosures on financial instruments in the notes to the consolidated financial statements.
TAX RISK The Company is active on a global basis and thus subject to different tax systems. Unless the
requirements for the formation of a provision or liability are met, both national and international tax risks are
incorporated within financial risks and monitored accordingly. At present, the material tax risks are in relation
to the companies in India. In order to minimise future task risks, the Group continuously monitors compliance
with national tax laws and international guidelines such as the BEPS (Base Erosion and Profit Shifting) guide-
line of the OECD and makes any necessary adjustments.
Finance
86 ATS Annual Report 2015/1660 ATS Annual Report 2015/16
The accounting-related Internal Control and Risk Management system is an integral part of the Group-wide
risk management system. According to the framework concept of COSO (The Committee of Sponsoring Or-
ganization of the Treadway Commission), under the concept of Company-wide risk management, the actual
risk management as well as the Internal Control System (ICS) are subsumed. The main criteria of the Risk
Management, the Internal Control System and Internal audit of ATS are specified in a Group-wide risk man-
agement and audit manual.
The documentation of the internal controls (business processes, risks, control measures and those responsi-
ble) is made principally in the form of control matrices, which are archived in a central management data-
base. The accounting-related Internal Control System includes principles, procedures and measures to ensure
the compliance of accounting in terms of the control targets described for financial reporting.
The accounting procedures are documented in separate process instructions. As far as possible, these pro-
cesses are standardised across the Group and are presented in a standardised documentation format. Addi-
tional requirements for accounting procedures result from specific local regulations. The basic principles of
accounting and reporting are documented in the process descriptions and also in detailed process instruc-
tions, which are also filed in the central management manual. In addition, guidelines on measurement proce-
dures and organisational requirements in connection with the processes of accounting and preparing the
financial statements are compiled and updated on a regular basis. Schedules are set in accordance with
Group requirements.
The internal financial reporting is done on a monthly basis as part of the Group reporting, with the financial
information being reviewed and analysed by the Group Accounting and Group Controlling department (part
of Group Finance  Controlling). The monthly budget/actual variance with corresponding comments on the
results of the seg-ments, of the plants as well as of the Company, is reported internally to the executives and
to the members of the Supervisory Board.
The annual preparation of the budget is carried out by the Group Controlling department (as part of Group
Finance  Controlling). Quarterly forecasts are drawn up during the year for the remaining financial year
based on the quarterly results and current planning information. The forecasts with comments on the budget
comparison and presentations on the impact of opportunities and risks up to the end of the financial year are
reported to the Supervisory Board. In addition to regular reporting, multiple-year planning, project-related
financial information or calculations on investment projects are prepared and submitted to the Supervisory
Board.
Internal Control and Risk Management7.
System with regard to accounting
87Group Management ReportGroup Management Report 61
CAPITAL SHARE STRUCTURE AND DISCLOSURE OF SHAREHOLDER RIGHTS As of the
reporting date at 31 March 2015, the Company's ordinary shares amount to € 42,735,000 and are made up of
38,850,000 no-par value shares with a notional value of € 1.1 per share. The voting right at the Annual
General Meeting is exercised according to no-par value shares, with each no-par value share equalling one
voting right. All shares are bearer shares.
Significant direct and indirect shareholdings in the group parent AT  S Austria Technologie  Systemtechnik
Aktiengesellschaft (AT  S AG), which at the reporting date amount to at least 10%, are presented below:
Shares % capital % voting rights
Dörflinger-Privatstiftung:
Karl-Waldbrunner-Platz 1, A-1210 Vienna 6,902,380 17.77% 17.77%
Androsch Privatstiftung:
Schottengasse 10, A-1010 Vienna 6,339,896 16.32% 16.32%
At the reporting date 31 March 2015, about 65.91% of the shares were in free float. With the exception of
the shareholdings stated above, no other shareholder existed holding more than 10% of the voting rights in
AT  S AG. No shares with special control rights exist. The exercise of the voting right by employees who hold
shares in the Company is not subject to any limitations.
No special provisions exist on the appointment and dismissal of members of the Management Board and the
Supervisory Board.
No compensation agreements are in place between AT  S AG and its Management Board and Supervisory
Board members or employees that would become effective in the case of a public takeover bid.
By resolution passed at the 20th Annual General Meeting on 3 July 2014, the Management Board was
authorised until 2 July 2019 to increase the Company's ordinary shares, subject to approval by the
Supervisory Board, by up to € 21,367,500.00 by way of issuing up to 19,425,000 new no-par value bearer
shares against contribution in cash or in kind, in one or several tranches, also by way of indirect rights offer-
ings after having been taken over by one or more credit institutions in accordance with § 153 (6) Austrian
Stock Corporation Act (AktG). In doing so, the Management Board was authorised to determine, subject to
approval by the Supervisory Board, the detailed conditions for such issuance (in particular the issue amount,
what the contribution in kind entails, the content of the share rights, the exclusion of subscription rights, etc.)
(approved capital). The Supervisory Board was authorised to adopt amendments to the articles of association
resulting from the issuance of shares from the approved capital. The Annual General Meeting also passed the
resolution to amend § 4 of the articles of association (ordinary shares) in accordance with this resolution.
Furthermore, by resolution of the 20th Annual General Meeting on 3 July 2014, the authorisation to issue
convertible bonds as resolved in the Annual General Meeting on 7 July 2010 was revoked and, simultaneous-
ly, the Management Board was authorised until 2 July 2019, subject to approval by the Supervisory Board, to
issue one or several convertible bearer bonds in a total nominal amount of up to € 150,000,000.00 and to
grant to bearers of convertible bonds subscription rights and/or conversion rights for up to 19,425,000 new
no-par value bearer shares of the Company in accordance with the convertible bond conditions to be defined
by the Management Board. In doing so, the Company's ordinary shares were conditionally increased by up to
€ 21,367,500.00 by way of the issuance of up to 19,425,000 new no-par value bearer shares in accordance
with § 159 (2) No. 1 AktG. This conditional capital increase is only carried out insofar as the bearers of
convertible bonds issued based on the authorisation resolution passed at the Annual General Meeting on
3 July 2014 claim the right to conversion and/or subscription granted to them with regard to the Company's
shares. Furthermore, the Management Board was authorised to determine, subject to approval by the Super-
Shareholding structure and disclosures8.
on capital (disclosures according to
§ 243a Austrian Commercial Code)
88 ATS Annual Report 2015/1662 ATS Annual Report 2015/16
visory Board, the further details of carrying out the conditional capital increase (particularly the issue amount
and the content of the share rights).
With regard to increasing the approved capital and/or the conditional capital increase, the following defini-
tion of amount in accordance with the resolutions passed at the 20th Annual General Meeting on 3 July 2014
is to be observed: The sum of (i) the number of shares currently issued or potentially to be issued from condi-
tional capital in accordance with the convertible bond conditions and (ii) the number of shares issued from
approved capital shall not exceed the total amount of 19,425,000 (definition of amount of authorisations).
TREASURY SHARES By a resolution passed at the 21st Annual General Meeting on 9 July 2015, the
Management Board was again authorised to acquire and to withdraw – within 30 months as from the resolu-
tion date – treasury shares to the maximum extent of up to 10% of the ordinary shares of the Company.
Furthermore, the Management Board was authorised, for a period of five years as of the date the resolution
was passed, i.e. up to and including 8 July 2020, upon approval by the Supervisory Board, to sell treasury
shares also in a different way than via the stock exchange or by public offering, most notably to serve em-
ployee stock options, convertible bonds or to use such shares as a consideration for the acquisition of entities
or other assets and for any other legal purpose.
As of 31 March 2016, the Group does not hold any treasury shares.
There are no off-balance sheet transactions between AT  S AG and its subsidiaries.
AT  S AG neither has granted any loans nor has it assumed any liabilities in favour of board members.
For further information, reference is made to the notes to the consolidated financial statements (Note 22
“Share capital” as well as Note 16 “Financial liabilities”).
The Company's Corporate Governance Report pursuant to § 243b Austrian Commercial Code is available at
http://www.ats.net/de/unternehmen/corporate-governance/berichte/.
89Group Management ReportGroup Management Report 63
The effects of digitalisation, the continuous connecting of devices (Internet of Things) and the processing of
large amounts of data will require sustained increases in the performance of electronic devices.
This rising penetration of nearly all applications with electronic technologies will result in continued growth
for the electronics industry. The interconnection technologies will follow these trends both in terms of vol-
ume and technological development. By combining various known and new technologies, innovative solu-
tions will emerge that can meet the demanding requirements.
Following the slow-down of growth in the area of communications devices (smartphones, tablets), it can be
expected that new stimulus for further growth will be provided by the area of Internet of Things. At the same
time, it can be expected that there will be no one big thing in the future, but rather many connected smart
things.
Against this background, ATS will focus in the coming years even more intensely than it has thus far on
rapidly industrialising new technologies and developing new high-end interconnection solutions for the fu-
ture in combination with existing technologies. The plants in Chongqing will make a decisive contribution in
this respect. Therefore, in financial year 2016/17, the focus will be on further utilisation of the first produc-
tion line for IC substrates, ramp-up of the second production line for IC substrates toward the end of calendar
year 2016, and ramp-up of the first production line for substrate-like printed circuit boards during the second
half of calendar year 2016. In the core business, high-end printed circuit boards and embedding technology,
ATS will make continuous investments in technological developments at the existing sites in order to ex-
pand our leading market position.
In financial year 2016/17, in view of a weakened growth dynamic in some areas of existing customer seg-
ments as well as more intense competition, ATS again expects stronger seasonality in certain financial quar-
ters (primarily the first and fourth quarters of financial year 2016/17) and a continuous limited visibility.
Provided that the macroeconomic environment remains stable, a USD-EUR currency ratio at a level similar to
the previous financial year, 2015/16, and stable demand in the core business, Management assumes revenue
growth in the coming financial year of 10–12%. Based on costs related to the ramp-up of Chongqing, the
EBITDA margin is expected to be at a level of 18–20%; the EBITDA margin in the core business, however, will
be at a similar level to financial year 2015/16. Higher, additional depreciation and amortisation of around
€ 40 million in the financial year 2016/17 for the project Chongqing will have a significant impact on EBIT.
Leoben-Hinterberg, 9 May 2016
The Management Board
Andreas Gerstenmayer m.p. Karl Asamer m.p. Heinz Moitzi m.p.
Outlook9.
91Consolidated Financial Statements
TABLE OF CONTENTS
Consolidated Statement of Profit or Loss   92
Consolidated Statement of Comprehensive Income   92
Consolidated Statement of Financial Position   93
Consolidated Statement of Cash Flows   94
Consolidated Statement of Changes in Equity   95
Notes to the Consolidated Financial Statements   96
Consolidated Financial Statements
as of 31 March 2016
92 ATS Annual Report 2015/1664 ATS Annual Report 2015/16
€ in thousands Note 2015/16 2014/15
Revenue 1 762,879 667,010
Cost of sales 2 (611,247) (511,628)
Gross profit 151,632 155,382
Distribution costs 2 (34,624) (31,595)
General and administrative costs 2 (29,376) (28,005)
Other operating result 4 (10,663) (5,696)
Operating result 76,969 90,086
Finance income 6 7,533 9,067
Finance costs 6 (15,668) (14,170)
Finance costs - net (8,135) (5,103)
Profit before tax 68,834 84,983
Income taxes 7 (12,883) (15,634)
Profit for the year 55,951 69,349
Attributable to owners of the parent company 55,951 69,279
Attributable to non-controlling interests – 70
Earnings per share attributable to equity holders
of the parent company (in € per share): 25
- basic 1.44 1.78
- diluted 1.44 1.78
Consolidated Statement
of Comprehensive Income
€ in thousands 2015/16 2014/15
Profit for the year 55,951 69,349
Items to be reclassified:
Currency translation differences (82,521) 161,373
Gains/(losses) from the fair value measurement of hedging instruments for cash flow
hedges, net of tax 2,831 (2,517)
Items not to be reclassified: 2,659 -6757
Remeasurement of post-employment obligations, net of tax 2,659 (6,757)
Other comprehensive income for the year (77,031) 152,099
Total comprehensive income for the year (21,080) 221,448
Attributable to owners of the parent company (21,080) 221,350
Attributable to non-controlling interests – 98
Consolidated Statement
of Profit or Loss
93Consolidated Financial StatementsConsolidated Financial Statements 65
€ in thousands Note 31 Mar 2016 31 Mar 2015
ASSETS
Property, plant and equipment 8 689,161 603,664
Intangible assets 9 103,736 45,211
Financial assets 13 96 96
Deferred tax assets 7 33,826 34,301
Other non-current assets 10 39,519 29,485
Non-current assets 866,338 712,757
Inventories 11 83,438 89,222
Trade and other receivables 12 134,687 143,130
Financial assets 13 87,817 780
Current income tax receivables 504 1,004
Cash and cash equivalents 14 171,866 273,919
Current assets 478,312 508,055
Total assets 1,344,650 1,220,812
EQUITY
Share capital 22 141,846 141,846
Other reserves 23 73,688 150,774
Retained earnings 353,402 311,642
Equity attributable to owners of the parent company 568,936 604,262
Non-controlling interests – 96
Total equity 568,936 604,358
LIABILITIES
Financial liabilities 16 361,558 359,268
Provisions for employee benefits 17 36,293 33,726
Other provisions 18 6,957 7,545
Deferred tax liabilities 7 8,844 7,774
Other liabilities 15 7,755 4,757
Non-current liabilities 421,407 413,070
Trade and other payables 15 180,257 149,409
Financial liabilities 16 161,413 46,037
Current income tax payables 7,557 2,823
Other provisions 18 5,080 5,115
Current liabilities 354,307 203,384
Total liabilities 775,714 616,454
Total equity and liabilities 1,344,650 1,220,812
Consolidated Statement
of Financial Position
94 ATS Annual Report 2015/1666 ATS Annual Report 2015/16
€ in thousands 2015/16 2014/15
Operating result 76,969 90,086
Depreciation, amortisation and impairment of property, plant and equipment and intangible assets 90,519 77,485
Gains/losses from the sale of fixed assets 632 114
Non-cash expense/(income), net 576 5,900
Interest paid (15,507) (14,460)
Interest received 3,047 2,267
Income taxes paid (10,308) (16,436)
Cash flow from operating activities before changes in working capital 145,928 144,956
Inventories (426) (16,011)
Trade and other receivables (11,099) (23,612)
Trade and other payables 2,254 36,926
Other provisions 268 1,611
Cash flow from operating activities 136,925 143,870
Capital expenditure for property, plant and equipment and intangible assets (254,764) (165,318)
Proceeds from the sale of property, plant and equipment and intangible assets 499 539
Acquisition of non-controlling interests (272) –
Capital expenditure for financial assets (89,480) –
Proceeds from the sale of financial assets 1,775 –
Cash flow from investing activities (342,242) (164,779)
Proceeds from borrowings 252,140 34,623
Repayments of borrowings (131,740) (16,249)
Proceeds from government grants 4,659 1,339
Dividends paid (13,986) (7,770)
Cash flow from financing activities 111,073 11,943
Change in cash and cash equivalents (94,244) (8,966)
Cash and cash equivalents at beginning of the year 273,919 260,133
Exchange gains/(losses) on cash and cash equivalents (7,809) 22,752
Cash and cash equivalents at the end of the year 171,866 273,919
Consolidated Statement
of Cash Flows
95Consolidated Financial StatementsConsolidated Financial Statements 67
€ in thousands
Share
capital
Other
reserves
Retained
earnings
Equity
attributable
to owners
of the parent
company
Non-
controlling
interests
Total
equity
31 Mar 2014 141,846 (1,297) 250,133 390,682 (2) 390,680
Profit for the year – – 69,279 69,279 70 69,349
Other comprehensive income for the year – 152,071 – 152,071 28 152,099
thereof currency translation differences – 161,339 – 161,339 34 161,373
thereof remeasurement of post-employment obligations,
net of tax – (6,751) – (6,751) (6) (6,757)
thereof change in hedging instruments for cash flow hedges,
net of tax – (2,517) – (2,517) – (2,517)
Total comprehensive income for the year 2014/15 – 152,071 69,279 221,350 98 221,448
Dividends paid relating to 2013/14 – – (7,770) (7,770) – (7,770)
31 Mar 2015 141,846 150,774 311,642 604,262 96 604,358
Profit for the year – – 55,951 55,951 – 55,951
Other comprehensive income for the year – (77,031) – (77,031) – (77,031)
thereof currency translation differences – (82,521) – (82,521) – (82,521)
thereof remeasurement of post-employment obligations,
net of tax – 2,659 – 2,659 – 2,659
thereof change in hedging instruments for cash flow hedges,
net of tax – 2,831 – 2,831 – 2,831
Total comprehensive income for the year 2015/16 – (77,031) 55,951 (21,080) – (21,080)
Dividends paid relating to 2014/15 – – (13,986) (13,986) – (13,986)
Acquisition of non-controlling interests – (55) (205) (260) (96) (356)
31 Mar 2016 141,846 73,688 353,402 568,936 – 568,936
Consolidated Statement
of Changes in Equity
96 ATS Annual Report 2015/1668 ATS Annual Report 2015/16
GENERAL AT  S Austria Technologie  Systemtechnik Aktiengesellschaft (hereinafter referred to as “the Company”, and with its subsidi-A.
aries referred to as “the Group”) was incorporated in Austria. The Company is headquartered in Austria, Fabriksgasse 13, 8700 Leoben-
Hinterberg.
The Group manufactures and distributes printed circuit boards and provides related services in the segments Mobile Devices  Substrates, Au-
tomotive, Industrial, Medical and Others. The products are manufactured in the European and Asian markets and are directly distributed to
original equipment manufacturers (OEM) as well as to contract electronic manufacturers (CEM).
Since 20 May 2008, the Company has been listed in the Prime Market segment of the Vienna Stock Exchange, Austria, and, after a period of
double listing on the previous exchange in Frankfurt am Main, Germany, has been traded exclusively on the Vienna Stock Exchange since
15 September 2008. Prior to changing the stock exchange, the Company had been listed on the Frankfurt Stock Exchange since 16 July 1999. Due
to increased turnover, the Company’s shares were included in the Austrian ATX index for the first time on 21 March 2016. The criteria for inclu-
sion in the ATX are the average daily trading volumes during the latest twelve months as well as the free float capitalisation at the closing date of
February 2016.
According to Section 245a of the Austrian Commercial Code (UGB), the consolidated financial statements were prepared in accordance with the
International Financial Reporting Standards (IFRS and IAS) and interpretations (IFRIC and SIC) of the International Accounting Standards Board
(IASB) as adopted by the European Union (EU).
ACCOUNTING AND MEASUREMENT POLICIES The consolidated financial statements have been prepared under the historicalB.
cost convention, except for securities and derivative financial instruments, which are measured at their fair values.
a. CONSOLIDATION PRINCIPLES The balance sheet date for all consolidated companies is 31 March 2016, with the following exceptions:
Due to the legal situation in China, the financial year of ATS (China) Company Limited and ATS (Chongqing) Company Limited corresponds to
the calendar year (balance sheet date: 31 December 2015), meaning that they were consolidated on the basis of the interim financial statements
as of 31 March 2016.
The consolidated financial statements were approved for issue by the Management Board on 9 May 2016. The separate financial statements of
the Company, which are included in the consolidation after reconciliation to the applicable accounting standards, will be presented for approval
to the Supervisory Board on 6 June 2016. The separate financial statements of the Company can be modified by the Supervisory Board and, in
case of presentation to the Annual General Meeting, by the Company’s shareholders in a way that might also affect the presentation of the
consolidated financial statements.
GROUP OF CONSOLIDATED ENTITIES The Company controls an entity when the Group is exposed to risks or has rights to variable returns
from its involvement with the entity and has the ability to affect those returns through its power over the entity. In addition to the Company
itself, the consolidated financial statements comprise the following fully consolidated subsidiaries:
 ATS Asia Pacific Limited, Hong Kong, China (hereinafter referred to as ATS Asia Pacific), share 100%
 ATS (China) Company Limited, China (hereinafter referred to as ATS China), 100% subsidiary of ATS Asia Pacific
 ATS (Chongqing) Company Limited, China (hereinafter referred to as ATS Chongqing), 100% subsidiary of ATS Asia Pacific
 ATS Japan K.K., Japan, 100% subsidiary of ATS Asia Pacific
 ATS (Taiwan) Co., Ltd., Taiwan (hereinafter referred to as ATS Taiwan), 100% subsidiary of ATS Asia Pacific
 ATS India Private Limited, India (hereinafter referred to as ATS India), share 100%
 ATS Korea Co., Ltd., South Korea (hereinafter referred to as ATS Korea), share 100%
 ATS Americas LLC, USA (hereinafter referred to as ATS Americas), share 100%
 ATS Deutschland GmbH, Germany, share 100%
In the financial year 2015/16, all non-controlling interests, a share of 1.24% in ATS Korea Co., Ltd., were acquired and the subsidiary AT  S
Klagenfurt Leiterplatten GmbH in Liqu. was liquidated and deconsolidated.
The Group applies the acquisition method to account for business combinations. The consideration transferred for the acquisition of a subsidiary
is the fair value of the assets transferred, the equity interests issued and the liabilities incurred and/or assumed at the acquisition date. The
Notes to the Consolidated
Financial Statements
I. General Information
97Consolidated Financial StatementsConsolidated Financial Statements 69
consideration transferred also includes the fair value of any asset or liability resulting from a contingent consideration arrangement. Acquisition-
related costs are expensed as incurred. Identifiable assets acquired and liabilities and contingent liabilities assumed in a business combination
are measured initially at their fair values at the acquisition date.
For each business combination, the Group measures any non-controlling interest in the acquiree either at fair value or at the non-controlling
interest’s proportionate share of the acquiree’s identifiable net assets and, accordingly, recognises the full or proportional goodwill. If the con-
sideration transferred is less than the fair value of the net assets of the subsidiary acquired, the difference is recognised directly in profit or loss.
When the Group ceases to have control or significant influence over a company, any retained interest in the entity is remeasured to its fair value,
with the change in carrying amount recognised in profit or loss. The fair value is the fair value determined at initial recognition of an associate,
joint venture or financial asset. In addition, any amounts recognised in other comprehensive income in respect of that entity are accounted for
as if the parent company had directly disposed of the related assets or liabilities. This means that a profit or loss previously recognised in other
comprehensive income is reclassified from equity to profit or loss.
METHODS OF CONSOLIDATION All significant intercompany balances and transactions have been eliminated so that the consolidated finan-
cial statements present the accounting information of the Group as if it were one single company.
Capital consolidation is made in accordance with IFRS 10 “Consolidated Financial Statements”. Intercompany accounts receivable and payable as
well as expenses and income are eliminated. Unless immaterial, intercompany results in non-current assets and inventories are eliminated.
Furthermore, uniform accounting and measurement methods are applied to all consolidated subsidiaries.
The Group considers transactions with non-controlling interests as transactions with equity holders of the Group. When non-controlling interests
are acquired, the difference between the acquisition costs and the attributable share of net assets acquired in the subsidiary is deducted from
equity. Gains or losses on the sale of non-controlling interests are also recognised in equity.
b. SEGMENT REPORTING An operating segment is a component of an entity that engages in business activities and whose operating results
are reviewed regularly by the entity’s chief operating decision-maker. Business activities involve earning revenues and incurring expenses, and
these may also relate to business transactions with other operating segments of the entity. Separate financial information is available for the
individual operating segments.
In the financial year 2011/12 the Management Board – with the Supervisory Board’s approval – decided to improve the Group’s organisational
structure with the aim of adapting its operational processes even more effectively to its customers’ needs. Three business units were therefore
created: Mobile Devices, Industrial  Automotive, and Others.
Following ATS’s entry into IC substrate manufacturing and allocation of the new business to the Mobile Devices business unit, that unit has
been renamed as the Mobile Devices  Substrates business unit. Both mobile applications and substrates have an appropriate organisational
structure, the management reporting, however, continues to be performed for the Mobile Devices  Substrates segment as a whole.
At the beginning of the financial year 2015/16, the business unit Industrial  Automotive was renamed Automotive, Industrial, Medical. This
change was made to underline the growing significance of business with medical devices in both therapy and diagnosis.
The business unit Mobile Devices  Substrates is responsible for the production of printed circuit boards for mobile end-user devices such as
smartphones, tablets, notebooks and consumer products like digital cameras. The printed circuit boards for these applications are largely pro-
duced in our Shanghai (ATS China) plant. The serial production of IC substrates has started in March 2016 at the plant in Chongqing (ATS
Chongqing).
The business unit Automotive, Industrial, Medical supplies customers in the fields of automotive supplies, industrial applications, medical tech-
nology, aerospace, security and other sectors. Production for this business segment takes place at our plants in India, Korea and Austria.
The activities of the emerging business segment Advanced Packaging and parent group activities are included in the business unit Others. Ad-
vanced Packaging specialises in new, technologically highly advanced applications. A variety of components are integrated directly into printed
circuit boards in order to enable further reductions in the size of end-user devices while also enhancing the functionality. This new technology is
98 ATS Annual Report 2015/1670 ATS Annual Report 2015/16
useful in a wide range of applications. This business segment is still under development and is therefore not yet shown separately, since neither
the quantative threshold reached nor the associated opportunities and risks are material to the Group as a whole.
c. FOREIGN CURRENCIES The Group’s presentation currency is the euro (€). The functional currency of the foreign subsidiaries is the re-
spective local currency.
FOREIGN SUBSIDIARIES With the exception of equity positions (historical exchange rate), the balance sheets of ATS India, ATS China, ATS
Asia Pacific, ATS Japan K.K., ATS Korea, ATS Americas, ATS Chongqing and ATS Taiwan are translated at the exchange rates on the bal-
ance sheet date. The profit and loss statements are translated at the average exchange rates of the financial year. The effect of changes in the
exchange rate with regard to the foreign subsidiaries’ net assets is recognised directly in equity.
FOREIGN CURRENCY TRANSACTIONS In the financial statements of each of the Group’s entities, foreign currency items are translated at the
exchange rates prevailing on the day of the transaction. Monetary items are translated at the respective exchange rate ruling at the balance
sheet date; non-monetary items which were recognised according to the historical cost principle are carried at the rate of their initial recogni-
tion. Translation adjustments from monetary items, with the exception of “available-for-sale financial assets”, are recognised in profit or loss.
Translation differences from “available-for-sale financial assets” are recognised directly in equity.
Closing rate Average rate
31 Mar 2016 31 Mar 2015 Change in %
01 Apr 2015 -
31 Mar 2016
01 Apr 2014 -
31 Mar 2015 Change in %
Chinese yuan renminbi 7.3514 6.6572 10.4% 6.9623 7.8448 (11.2%)
Hong Kong dollar 8.8231 8.3285 5.9% 8.5393 9.8166 (13.0%)
Indian rupee 75.3466 67.2055 12.1% 72.0208 77.3582 (6.9%)
Japanese yen 127.8200 128.7780 (0.7%) 132.1891 138.6920 (4.7%)
South Korean won 1,297.7560 1,191.6030 8.9% 1,269.9367 1,341.2992 (5.3%)
Taiwan dollar 36.5967 33.6151 8.9% 35.3607 38.7183 (8.7%)
US dollar 1.1378 1.0740 5.9% 1.1011 1.2660 (13.0%)
d. REVENUE RECOGNITION Revenue comprises the fair value of considerations received in the course of the Group‘s ordinary activities.
Revenue is recognised net of VAT, discounts and price reductions, and after elimination of intercompany sales. Revenue is realised as follows:
REVENUE FROM PRODUCT SALES Revenue from product sales is recognised when significant risks and rewards associated with the goods
sold are transferred to the buyer. This is usually the case when the ownership is transferred.
INTEREST AND DIVIDEND INCOME Interest income is recognised on a pro rata temporis basis, taking into account the effective interest rate
of the asset. Dividend income from financial assets is recognised in profit or loss when the Group’s right to receive payments is established.
e. INCOME TAXES The income tax burden is based on the profit for the year and includes deferred income taxes.
The Group provides for deferred income taxes using the balance-sheet oriented method. Under this method, the expected tax effect of differ-
ences arising between the carrying amounts in the consolidated financial statements and the taxable carrying amounts are taken into account by
recognising deferred tax assets and tax liabilities. These differences will be reversed in the future. Deferred income tax is determined using tax
rates (and laws) that have been enacted or substantively enacted on the balance sheet date and are expected to apply when the related de-
ferred income tax asset is realised or the deferred income tax liability is settled. A future change in tax rates would also have an impact on the
deferred tax assets capitalised at the current balance sheet date.
Deferred income taxes and liabilities arise from the measurement of specific assets and liabilities, as well as tax loss carryforwards and amortisa-
tion of goodwill.
Deferred taxes on not yet realised profits/losses of available-for-sale financial assets and on not yet realised profits/losses from hedging instru-
ments for cash flow hedges that are recognised in equity are also directly recognised in equity.
99Consolidated Financial StatementsConsolidated Financial Statements 71
In accordance with IFRS, deferred income tax assets on loss carryforwards have to be recognised to the extent that it is probable that they will be
utilised against future taxable profits.
Deferred taxes are not recognised for temporary differences in connection with holdings in subsidiaries provided that the Group is able to con-
trol the timing of the reversal of the temporary differences and it is likely that the temporary differences will not be reversed in the foreseeable
future.
f. PROPERTY, PLANT AND EQUIPMENT Items of property, plant and equipment are measured at cost. Expenditure directly attributable to
the acquisition and subsequent expenditure are capitalised, repairs and maintenance costs, however, are expensed as incurred.
Borrowing costs directly attributable to the acquisition, construction or production of a qualifying asset are capitalised as part of the acquisition
or production costs of this asset in accordance with IAS 23.
From the time of their availability for use, the assets are depreciated on a straight-line basis over their expected useful lives. Depreciation is
charged on a pro rata temporis basis. Land is not subject to depreciation.
Scheduled depreciation is based on the following useful lives applicable throughout the Group:
Plants and buildings 10–50 years
Machinery and technical equipment 4–15 years
Tools, fixtures, furniture and office equipment 3–15 years
Depreciation periods and methods are reviewed annually at the end of the financial year.
In accordance with IAS 17 “Leases”, leased property, plant and equipment for which the Group bears substantially all the risks and rewards of
ownership and which in economic terms constitute asset purchases with long-term financing are capitalised at their fair value or the lower pre-
sent value of the minimum lease payments. Scheduled depreciation is effected over the useful life of the asset. If at the beginning of the lease it
is not sufficiently certain that the title will pass to the lessee, the leased asset is depreciated over the shorter of the two periods, the lease term
or useful life. Financial obligations resulting from future lease payments are discounted and carried as a liability. Current lease payments are split
into repayment and financing costs.
Leased assets under all other lease and rental agreements are classified as operating leases and attributed to the lessor. Lease payments are
recognised as an expense.
Profits or losses resulting from the closure or retirement of non-current assets, which arise from the difference between the net realisable value
and the carrying amounts, are recognised in profit or loss.
g. INTANGIBLE ASSETS
PATENTS, TRADEMARKS AND LICENSES Expenditure on acquired patents, trademarks and licenses is capitalised at cost, including incidental
acquisition expenses, and amortised on a straight-line basis over its useful life, generally between two and ten years. Amortisation terms and
methods are reviewed annually at the end of the financial year.
RESEARCH AND DEVELOPMENT COSTS Research costs are expensed as incurred and charged to cost of sales. Development costs are also
expensed as incurred.
An intangible asset arising from development is recognised if, and only if, an entity can demonstrate all of the following:
 The technical feasibility of completing the intangible asset so that it will be available for use or sale.
 Its intention to complete the intangible asset and use or sell it.
 Its ability to use or sell the intangible asset.
 How the intangible asset will generate probable future economic benefits is verifiable.
100 ATS Annual Report 2015/1672 ATS Annual Report 2015/16
 The availability of adequate technical, financial and other resources to complete the development and to use or sell the intangible asset.
 Its ability to reliably measure the expenditure attributable to the intangible asset during its development.
Capitalised development projects include all the directly attributable costs incurred as a result of development process. Borrowing costs are
capitalised if the development project is a qualifying asset in accordance with IAS 23. Development costs are amortised on a straight-line basis
over a useful life from six to seven years, which is derived from the expected sales periods.
h. IMPAIRMENT LOSSES AND WRITE-UPS OF PROPERTY, PLANT AND EQUIPMENT, INTANGIBLE ASSETS The Group regularly
reviews property, plant and equipment and intangible assets for possible impairment. If evidence for impairment exists, an impairment test is
carried out without delay. Intangible assets in the development phase are tested annually for impairment. If the recoverable amount of the
respective asset is below its carrying amount, an impairment loss amounting to the difference is recognised. The recoverable amount is the
higher of an asset’s fair value less costs to sell and its value in use. The value in use corresponds to the estimated future cash flows expected
from the continued use of the asset and its disposal at the end of its useful life. The discount rates applied correspond to the weighted cost of
capital based on externally available capital market data that are typical in the industry and have been adapted to the specific risks.
If the reason for the impairment recognised in the past no longer exists, with the exception of goodwill, a reversal of impairment up to amortised
cost is made.
i. INVENTORIES Inventories are stated at the lower of cost or net realisable value. Net realisable value is the estimated selling price in the
ordinary course of business, less variable costs necessary to make the sale. Cost is determined by the first-in, first-out (FIFO) method. The cost of
finished goods and work in progress comprises raw materials, direct labour, other direct costs and related production overheads. Interest on
borrowed capital is not recognised.
j. TRADE AND OTHER RECEIVABLES Receivables are reported at nominal values, less any allowances for doubtful accounts. Foreign cur-
rency receivables are translated at the average exchange rate prevailing at the balance sheet date. Risk management covers all recognisable
credit and country-specific risks.
k. FINANCIAL ASSETS Financial assets are recognised and derecognised using settlement date accounting. The fair values recognised in the
statement of financial position generally correspond to market prices of financial assets. Except for financial assets at fair value through profit or
loss, they are recognised initially including transaction costs.
Financial assets are divided into the categories explained below. The classification depends on the respective purpose of the financial asset and is
reviewed annually.
FINANCIAL ASSETS AT FAIR VALUE THROUGH PROFIT OR LOSS Financial instruments acquired primarily for the purpose of earning a profit
from short-term fluctuations in prices or trader margins are classified as financial assets at fair value through profit or loss. At the time of their
acquisition they are stated at fair value, excluding transaction costs, and in subsequent periods at their respective fair values. Realised and unre-
alised gains and losses are recognised in profit or loss in “Finance costs - net”. This relates primarily to securities held for trading. Derivative
financial instruments also fall into this category, unless hedge accounting is applied (refer to l. Derivative financial instruments).
SECURITIES HELD TO MATURITY Securities held to maturity are recognised at amortised cost using the effective interest rate method. Any
impairment is recognised in profit or loss.
LOANS AND RECEIVABLES Loans and receivables are non-derivative financial assets with fixed or determinable payments that are not listed in
an active market. In the statement of financial position, the respective assets are recognised under the item “Trade and other receivables”.
AVAILABLE-FOR-SALE FINANCIAL ASSETS Available-for-sale financial assets relate to securities available-for-sale. Available-for-sale securities
are instruments which Management intends to sell as a reaction to expected liquidity requirements or expected changes in interest rates, ex-
change rates or share prices. Their classification as non-current or current assets depends on the length of time for which they are expected to
be held.
101Consolidated Financial StatementsConsolidated Financial Statements 73
At the time of acquisition they are stated at cost, including transaction costs, in subsequent periods at their respective fair values. Unrealised
gains and losses, net of income tax, are recognised in other comprehensive income and not taken through profit or loss until they are sold or
considered as impaired.
Interest income and dividends from available-for-sale securities are recognised in profit or loss under “Finance costs - net”.
When an available-for-sale security is sold, the accumulated unrealised gain or loss previously recognised in equity is included in profit or loss for
the reporting period in “Finance costs - net”.
When an available-for-sale security is considered to be impaired, the accumulated unrealised loss previously recognised in equity is recognised in
profit or loss in “Finance costs - net”. An asset is impaired, if there are indications that the recoverable value is below its carrying amount. In
particular, this is the case if the decrease in fair value is of such extent that the acquisition cost is unlikely to be recovered in the foreseeable
future. Recoverability is reviewed annually at every balance sheet date.
Furthermore, financial assets that have not been allocated to any of the other categories described are recognised under available-for-sale fi-
nancial assets. If the fair value of non-listed equity instruments cannot be determined reliably, these financial assets are measured at cost. Im-
pairment losses, if any, are recognised in profit or loss, and the respective impairment losses are not reversed.
l. DERIVATIVE FINANCIAL INSTRUMENTS Where possible the Group uses derivative financial instruments to hedge against foreign cur-
rency fluctuations related to transactions in foreign currencies – in particular the US dollar. These instruments mainly include forward contracts,
foreign currency options and foreign exchange swap contracts. They are entered into in order to protect the Group against exchange rate fluctu-
ations by fixing future exchange rates for foreign currency assets and liabilities.
Furthermore, the Group manages its interest rate risk by using interest rate swaps.
The Group does not hold any financial instruments for speculative purposes.
The first-time recognition at the conclusion of the contract and the subsequent measurement of derivative financial instruments is made at their
fair values. “Hedge accounting” in accordance with IAS 39 “Financial Instruments: Recognition and Measurement”, according to which changes
in fair values of hedging instruments are recognised in equity, is applied when there is an effective hedging relationship pursuant to IAS 39 for
hedging instruments for cash flow hedges. The assessment of whether the derivative financial instruments used in the hedging relationship are
highly effective in offsetting the changes in cash flows of the hedged item is documented at the inception of the hedging relationship and on an
ongoing basis. When “hedge accounting” in equity is not applicable, unrealised gains and losses from derivative financial instruments are recog-
nised in profit or loss in “Finance costs – net”.
m. CASH AND CASH EQUIVALENTS Cash and cash equivalents comprise cash, time deposits, deposits held at call with banks and short-
term, highly liquid investments with an original maturity of up to three months (commercial papers and money market funds).
n. NON-CONTROLLING INTERESTS The Company acquired the non-controlling interest of 1.24% of the equity in ATS Korea in financial
year 2015/16 and thus no longer reports any non-controlling interests.
The profit for the year and other comprehensive income are attributed to the owners of the parent company and the non-controlling interests.
The allocation to the non-controlling interests is made even if this results in a negative balance for the non-controlling interests.
o. PROVISIONS Provisions are recognised if the Group has a legal or de facto obligation to third parties, which is based on past events, where
it is probable that this will result in an outflow of resources and the amount can be estimated reliably. The provisions are remeasured at each
balance sheet date and their amounts adjusted accordingly.
Non-current provisions are reported at the discounted amount to be paid at each balance sheet date if the interest effect resulting from the
discounting is material.
102 ATS Annual Report 2015/1674 ATS Annual Report 2015/16
p. PROVISIONS FOR EMPLOYEE BENEFITS
PENSION OBLIGATIONS The Group operates various defined contribution and defined benefit pension schemes.
A defined contribution plan is a pension plan under which the Group pays fixed contributions into a special purpose entity (fund). These contri-
butions are charged to staff costs. No provision has to be set up, as there are no additional obligations beyond the fixed amounts.
For individual members of the Management Board and certain executive employees, the Group has defined benefit plans that are valued by
qualified and independent actuaries at each balance sheet date. The Group’s obligation is to meet the benefits committed to current and former
members of the Management Board and executive employees as well as their dependents. The pension obligation calculated according to the
projected unit credit method is reduced by the plan assets of the fund in the case of a funded pension scheme. The present value of the future
pension benefit is determined on the basis of years of service, expected remuneration and pension adjustments.
To the extent that the plan assets of the fund do not cover the obligation, the net liability is accrued under pension provisions. If the net assets
exceed the pension obligation, the exceeding amount is capitalised under “Overfunded pension benefits”.
Staff costs recognised in the respective financial year are based on expected values and include the service costs. The net liabilities net interest is
recognised in “Finance costs - net”. Remeasurements of the net liability are recognised in other comprehensive income and comprise gains and
losses arising from the remeasurement of post-employment obligations.
PROVISIONS FOR SEVERANCE PAYMENTS Pursuant to Austrian labour regulations, severance payments have to be paid primarily on termina-
tion of employment by the employer or on the retirement of an employee. The liabilities are measured by qualified and independent actuaries at
each balance sheet date.
For employees who joined Austrian companies up to and including 2002, the Company has direct obligations that account for the major part of
the Group’s severance payment obligations. In accordance with IAS 19, these liabilities are calculated using the projected unit credit method as
described above and represent severance payment obligations not covered by plan assets. For employees who joined the Company as on or
after of 1 January 2003, the severance payment obligation is met by regular contributions to a staff provision fund (“Mitarbeitervorsorgekasse”).
These contributions are included in staff costs. The Company has no further payment obligations once the contributions have been paid.
For employees of the company in India, obligations for severance payments are covered by life insurance policies. Furthermore, severance pay-
ment obligations exist for employees in South Korea and China. These obligations are measured in accordance with IAS 19 using the projected
unit credit method as described above and represent severance payment obligations not covered by plan assets.
OTHER EMPLOYEE BENEFITS Other employee benefits include provisions for anniversary bonuses and relate to employees in Austria and
China.
Anniversary bonuses are special one-off payments stipulated in the Collective Agreement which are dependent on remuneration and duration of
service. Eligibility is determined by a certain minimum length of employment. The respective liability is calculated in accordance with the pro-
jected unit credit method based on the same parameters used for severance payments.
Staff costs recognised in the respective financial year include entitlements acquired and the actuarial results. The interest component is recog-
nised in “Finance costs - net”. The liabilities are measured by qualified and independent actuaries at each balance sheet date.
q. STOCK OPTION PLANS The Group has issued stock option plans that are settled either in cash or in treasury shares, with the choice of
settlement being with the entitled employees. These stock option plans are accounted for in accordance with IFRS 2 “Share-based Payment”.
The share-based payments are structured in such a way that both settlement alternatives have the same fair value. The fair value of the em-
ployee services received in exchange for the granting of the options is recognised as an expense. Liabilities arising from stock option plans are
recognised initially and at each balance sheet date until settlement at fair value using an option price model and are recognised in profit or loss.
Reference is made to Note 15 “Trade and other payables”.
103Consolidated Financial StatementsConsolidated Financial Statements 75
r. STOCK APPRECIATION RIGHTS The Group introduced a long-term incentive programme based on stock appreciation rights (SAR). Stock
appreciation rights relate to value increase in share prices based on the performance of the share price. These rights are accounted for in ac-
cordance with IFRS 2 “Share-based Payment”.
The fair value of the employee services rendered as consideration for the granting of SAR is recognised as an expense. Upon initial recognition
and at every balance sheet date until the liabilities are settled, SAR liabilities are measured at fair value through profit or loss, applying the option
price model. Reference is made to Note 15 “Trade and other payables”.
s. LIABILITIES Financial liabilities are initially measured at fair value less transaction cost and in subsequent periods at amortised cost using the
effective interest rate method. Foreign currency liabilities are translated at the average exchange rate prevailing at the balance sheet date.
t. GOVERNMENT GRANTS Government grants are recognised at their fair value where there is a reasonable assurance that the grants will
be received and the Group will comply with all attached conditions.
Government grants relating to costs are deferred and recognised in profit or loss over the period necessary to match them with the costs that
they are intended to compensate. Government grants relating to investments in property, plant and equipment are included in liabilities as
deferred government grants; they are recognised in profit or loss on a straight-line basis over the expected useful life of the related assets. Gov-
ernment grants relating to costs and property, plant and equipment are recognised in profit or loss in the other operating result.
u. CONTINGENT LIABILITIES, CONTINGENT ASSETS AND OTHER FINANCIAL OBLIGATIONS Contingent liabilities are not recog-
nised in the statement of financial position, but disclosed in Note 21 in the notes to the consolidated financial statements. They are not disclosed
if an outflow of resources with economic benefit is unlikely.
A contingent asset is not recognised in the consolidated financial statements, but disclosed if the inflow of an economic benefit is likely.
v. FIRST-TIME APPLICATION OF ACCOUNTING STANDARDS The following new and/or amended standards and interpretations were
applied for the first time in the financial year and pertain to the International Financial Reporting Standards (IFRS) as adopted by the EU.
 Annual improvements to IFRS 2010–2012 cycle.
 Annual improvements to IFRS 2011–2013 cycle.
 IAS 19: Employee benefits (clarification of instructions for contributions of employees to a defined benefit plan).
 IFRIC 21: Levies (regulation of timing approach of provision for levies).
The initial application had no significant impact on the disclosures of the Group.
w. FUTURE AMENDMENTS TO ACCOUNTING STANDARDS The IASB and IFRIC issued additional standards and interpretations not yet
effective in the financial year 2015/16.
These have already been in part adopted by the European Union. The following standards and interpretations had already been published by the
time these consolidated financial statements were prepared and are not yet effective; they have not been adopted early in the preparation of
these consolidated financial statements:
104 ATS Annual Report 2015/1676 ATS Annual Report 2015/16
Standard/Interpretation
(Content of the regulation)
Effective
date 1)
EU 2)
Expected impacts on the
consolidated financial statements
IFRS 11 Accounting for Acquisition of Interests in Joint Operations 01 Jan 2016 Yes None
IAS 16,
IAS 41
Property, Plant and Equipment/Agriculture: Bearer Plants 01 Jan 2016 Yes None
IAS 1 Disclosure initiative (Amendments to IAS 1) 01 Jan 2016 Yes None
IAS 16,
IAS 38
Property, Plant and Equipment/Intangible Assets
Clarification of Acceptable Methods of Depreciation and Amortisation
01 Jan 2016 Yes None
Annual Improvements to IFRSs 2012-2014 01 Jan 2016 Yes None
IFRS 9 Financial instruments
(New rules on the classification and measurement of financial instru-
ments, the provisions on hedge accounting and on impairment)
01 Jan 2018 No Changes in fair values of financial instruments currently
classified as “available-for-sale” by the Group will (in
part) be recognised in profit or loss in the future.
IFRS 15 Revenue from Contracts with Customers 01 Jan 2018 No None
IFRS 14 Regulatory Deferral Accounts 01 Jan 2016 No None
IAS 27 Consolidated and Separate Financial Statements: Equity Method in
separate financial statements
01 Jan 2016 No None
IFRS 10,
IFRS 12,
IAS 28
Investment companies:
Application consolidate exception
01 Jan 2016 No None
IAS 28
IFRS 10
Investments in Associates: Sales or contributions of assets between an
investor and its associate/joint venture
Postponed
indefinitely
No None
IFRS 16 Leases 01 Jan 2019 No No major changes are expected.
1)
The Group intends to apply the new regulations for the first time in the fiscal year beginning subsequent to the effective date.
2)
Status of adoption by the EU.
CRITICAL ACCOUNTING ESTIMATES AND ASSUMPTIONS The Group uses estimates and assumptions to determine theC.
reported amounts of assets, liabilities, revenue and expenses, as well as other financial liabilities, and contingent assets and liabilities. All esti-
mates and assumptions are reviewed on a regular basis and are based on past experiences and additional factors, including expectations regard-
ing future events that seem reasonable under the given circumstances. In the future, actual results may differ from these estimates. Manage-
ment believes that the estimates are reasonable.
DEVELOPMENT COSTS Capitalised development costs largely relate to the development of a new technology for the production of substrates
for silicon semiconductor chips taking place at the new site in Chongqing, China. These development costs were capitalised because the criteria
for capitalisation presented in the accounting methods were fully met as at 1 March 2014. This technology was available for use from March
2016 onwards and the depreciation of it has begun.
For the purposes of assessing impairment of capitalised development costs, Management made assumptions in the financial year 2014/15 on
the amount of the estimated future cash flows arising from the project, the discount rate to be applied, the growth rate and the period of inflow
of the expected future benefit.
An increase in significant assumptions would have the following impact on the impairment test as at 31 March 2015:
Pre-tax discount
interest rate Growth rate
+5.00% +5.00%
Capitalised development costs no impairment required no impairment required
105Consolidated Financial StatementsConsolidated Financial Statements 77
A reduction in the same assumptions would have the following impact on the impairment test as at 31 March 2015:
Pre-tax discount
interest rate Growth rate
-5.00% -5.00%
Capitalised development costs no impairment required no impairment required
CALCULATION OF THE PRESENT VALUES OF PROJECTED EMPLOYEE BENEFIT OBLIGATIONS The present value of non-current employee
benefit obligations depends on various factors that are based on actuarial assumptions (refer to I.B.p. “Provisions for employee benefits”).
These actuarial assumptions used to calculate the pension expenses and the expected defined benefit obligations were subjected to stress tests
using the following parameters: An increase in the interest rate, in the expected remuneration and/or in future pensions for the Austrian entities
by the percentage points stated in the table below would affect the present values of the projected pension and severance payment obligations
as follows as at 31 March 2016:
Interest rate
Increase in renumer-
ation Increase in pensions
€ in thousands +0.50% +0.25% +0.25%
Pension obligation (1,230) 111 563
Severance payments (1,104) 561 –
A decrease in the same parameters for the Austrian companies would have the following effects on the present value of pension and severance
payment obligations as at 31 March 2016:
Interest rate
Increase in renumer-
ation Increase in pensions
€ in thousands -0.50% -0.25% -0.25%
Pension obligation 1,389 (108) (537)
Severance payments 1,203 (541) –
Reference is made to Note 17 “Provisions for employee benefits”.
MEASUREMENT OF DEFERRED INCOME TAX ASSETS AND CURRENT TAX LIABILITIES Deferred income tax assets and liabilities are deter-
mined using the tax rates (and laws) that have been enacted or substantively enacted by the balance sheet date and are expected to apply when
the related deferred income tax asset is realised or the deferred income tax liability is settled. A future change in tax rates would also have an
impact on the deferred tax capitalised at the balance sheet date.
Deferred income tax assets in the amount of € 34.6 million were not recognised for income tax loss carryforwards in the Group of
€ 138.3 million. The major part of these non-capitalised tax loss carryforwards may be carried forward for an unlimited period of time. If they
were subsequently expected to be realised, these deferred income tax assets would have to be recognised and a related tax income reported.
Reference is made to Note 7 “Income taxes”.
Moreover, a different interpretation of tax laws by fiscal authorities could also lead to a change in income tax liabilities.
OTHER ESTIMATES AND ASSUMPTIONS Further estimates, if necessary, relate to impairments of non-current assets and provisions, as well
as the measurement of derivative financial instruments, allowances for doubtful accounts receivable and measurements of inventory. Reference
is particularly made to Note 4 “Other operating result”, Note 8 “Property, plant and equipment”, Note 9 “Intangible assets” and Note 18 “Other
provisions”.
106 ATS Annual Report 2015/1678 ATS Annual Report 2015/16
The segment information presented below is prepared in accordance with the Management Approach Concept as depicted in the Group’s inter-
nal reporting (refer to Section I.B.b. “Segment Reporting”).
Following ATS’s entry into the new business with IC substrates and the allocation of the new business to the Mobile Devices business unit, that
unit has been renamed the Mobile Devices  Substrates business unit. Both mobile applications and substrates now have appropriate organisa-
tional structures, whereas management reporting continues to be performed for the Mobile Devices  Substrates segment as a whole.
At the beginning of financial year 2015/16, the business unit Industrial  Automotive was renamed Automotive, Industrial, Medical. This change
was made to underline the growing significance of business with medical devices in both therapy and diagnosis.
The primary reportable segments consist of the business units Mobile Devices  Substrates, Automotive, Industrial, Medical and Others. The
Others segment includes the business unit Advanced Packaging, which is in the development phase. The Advanced Packaging segment neither
reaches the quantitative threshold levels, nor are this business unit's opportunities and risks material to the Group as a whole. It is therefore not
presented as a standalone segment in segment reporting. The Others segment further includes general holding activities as well as the Group’s
financing activities. The central operating result control reference is the operating result before depreciation and amortisation. The respective
reconciliation to Group figures also includes the corresponding consolidation.
Transfers and transactions between the segments are executed at arm’s length, as with independent third parties. Segment reporting is pre-
pared in accordance with the principles set out in I.B. “Accounting and measurement policies”.
€ in thousands
Mobile Devices 
Substrates
Automotive,
Industrial, Medical Others
Elimination/
Consolidation Group
2015/16 2014/15 2015/16 2014/15 2015/16 2014/15 2015/16 2014/15 2015/16 2014/15
Segment revenue 539,665 455,192 326,679 301,790 22,135 10,913 (125,600) (100,885) 762,879 667,010
Internal revenue (87,206) (73,115) (20,143) (18,898) (18,251) (8,872) 125,600 100,885 – –
External revenue 452,459 382,077 306,536 282,892 3,884 2,041 – – 762,879 667,010
Operating result before
depreciation/amortisation 126,439 127,501 30,087 34,780 10,876 5,211 86 79 167,488 167,571
Depreciation/amortisation (78,182) (67,368) (10,856) (8,874) (1,481) (1,243) – – (90,519) (77,485)
Operating result 48,257 60,133 19,231 25,906 9,395 3,968 86 79 76,969 90,086
Finance costs - net (8,135) (5,103)
Profit before tax 68,834 84,983
Income taxes (12,883) (15,634)
Profit for the year 55,951 69,349
Property, plant and equipment and
intangible assets 696,578 567,909 92,695 70,036 3,624 10,930 – – 792,897 648,875
Additions to property, plant and
equipment and intangible assets 271,752 126,825 29,362 25,515 1,869 2,135 – – 302,983 154,475
II. Segment Reporting
107Consolidated Financial Statements
Consolidated Financial Statements
79
INFORMATION BY GEOGRAPHIC REGION
Revenue broken down by customer region, based on customer’s headquarters:
€ in thousands 2015/16 2014/15
Austria 17,525 19,308
Germany 163,374 142,269
Other European countries 46,073 41,562
China 32,387 27,429
Other Asian countries 75,603 80,687
Americas 427,917 355,755
Revenue 762,879 667,010
56% of total revenue (52% in the financial year 2014/15) is attributable to the five largest customers in terms of revenue.
Property, plant and equipment and intangible assets broken down by domicile:
€ in thousands 31 Mar 2016 31 Mar 2015
Austria 66,054 49,019
China 696,534 567,867
Others 30,309 31,989
Total 792,897 648,875
108 ATS Annual Report 2015/1680 ATS Annual Report 2015/16
1. REVENUE
€ in thousands 2015/16 2014/15
Main revenue 762,646 666,705
Incidental revenue 233 305
Revenue 762,879 667,010
2. TYPES OF EXPENSES The expense types of cost of sales, distribution costs and general and administrative costs are as follows:
€ in thousands 2015/16 2014/15
Cost of materials 267,806 227,503
Staff costs 160,898 133,572
Depreciation/amortisation 79,679 67,755
Purchased services incl. leased personnel 46,405 46,744
Energy 41,415 37,786
Maintenance (incl. spare parts) 47,022 40,732
Transportation costs 14,845 13,086
Rental and leasing expenses 5,634 4,878
Change in inventories (3,023) (12,231)
Other 14,566 11,403
Total 675,247 571,228
In the financial years 2015/16 and 2014/15, the item “Other” mainly relates to travel expenses, insurance expenses, IT service costs, legal and
consulting fees.
3. RESEARCH AND DEVELOPMENT COSTS In the financial year 2015/16, the Group incurred research and development costs in the
amount of € 34,428 thousand (in the financial year 2014/15: € 28,150 thousand). The stated amounts represent only costs which can be directly
allocated and which are recognised in the profit and loss under cost of sales. In these consolidated financial statements, development costs of
€ 61,052 thousand (in the financial year 2014/15: € 29,789 thousand) were capitalised. Reference is made to Note 9 “Intangible assets”.
4. OTHER OPERATING RESULT
€ in thousands 2015/16 2014/15
Income from the reversal of government grants 191 309
Government grants for expenses 3,193 3,402
Income/(expenses) from exchange differences 52 987
Gains/(losses) from the disposal of non-current assets (632) (114)
Impairments of property, plant and equipment1)
(3,113) (5,966)
Start-up losses (10,774) (8,703)
Miscellaneous other income 420 4,389
Other operating result (10,663) (5,696)
1)
Reference is made to Note 8 Property, plant and equipment.
In the financial years 2015/16 and 2014/15, government grants for expenses mainly relate to export refunds as well as research and develop-
ment awards. Similar to prior financial year 2014/15, start-up losses resulted in the financial year 2015/16 from the construction of the new
plant in Chongqing, China and from costs relating to the construction of a new line in Hinterberg-Leoben, Austria. In the financial year 2015/16,
the item “Miscellaneous other income” mainly relates to services in-kind for miscellaneous projects and the derecognition of other liabilities
III. Notes to the Consolidated Statement
of Profit or Loss
109Consolidated Financial StatementsConsolidated Financial Statements 81
written off. In the financial year 2014/15, the item “Miscellaneous other income” mainly relates to the reduction in the provision for building
space no longer used – reference is made to Note 18 “Other Provisions” – as well as to one-off income from a compensation payment made by a
supplier.
5. NON-RECURRING ITEMS In the past and previous financial year no non-recurring costs or income were incurred.
6. FINANCE COSTS - NET
€ in thousands 2015/16 2014/15
Interest income from held to maturity investments, financial assets at fair value
through profit or loss and available-for-sale financial assets 1,610 35
Other interest income 1,437 2,232
Gains from the sale of cash equivalents – 91
Realised gains from derivative financial instruments, net 604 –
Foreign exchange gains, net 3,882 6,709
Finance income 7,533 9,067
Interest expense on bank borrowings and bonds (8,860) (11,308)
Net interest expense on personnel-related liabilities (363) (1,327)
Realised losses from derivative financial instruments, net – (690)
Losses from the measurement of derivative financial instruments at fair value, net (3,871) –
Other financial expenses (2,574) (845)
Finance costs (15,668) (14,170)
Finance costs - net (8,135) (5,103)
In accordance with IAS 23, the item “Interest expense on bank borrowings and bonds” includes capitalised borrowing costs in the amount of
€ 6,620 thousand (financial year 2014/15: € 2,791 thousand), net.
7. INCOME TAXES Income taxes are broken down as follows:
€ in thousands 2015/16 2014/15
Current income taxes 15,821 14,564
Deferred taxes (2,938) 1,070
Total tax expense 12,883 15,634
The difference between the Group’s actual tax expense and the theoretical amount that would arise using the Austrian corporate income tax
rate is as follows:
€ in thousands 2015/16 2014/15
Expected tax expense at Austrian tax rate 17,209 21,245
Effect of different tax rates in foreign countries (5,057) (5,354)
Non-creditable foreign withholding taxes 1,825 1,142
Effect of change in previously unrecognised tax losses and temporary differences (807) (938)
Effect of the change in tax rate (622) 979
Effect of permanent differences 195 (1,479)
Effect of taxes from prior periods 140 39
Total tax expense 12,883 15,634
110 ATS Annual Report 2015/1682 ATS Annual Report 2015/16
Deferred income tax assets and liabilities are offset when there is a legally enforceable right to offset current tax assets against current tax liabili-
ties and when the deferred taxes and liabilities relate to taxes levied by the same taxation authority. The amounts after setting off deferred
income tax assets against deferred liabilities are as follows:
€ in thousands 31 Mar 2016 31 Mar 2015
Assets Liabilities Assets Liabilities
Non-current assets 26,639 (4,740) 23,435 (2,806)
Provisions for employee benefits 4,607 – 4,977 –
Temporary differences arising from shares in subsidiaries – – 46 –
Losses not yet realised from hedging instruments for cash flow hedges,
recognised in equity – – 944 –
Income tax loss carryforwards including taxable goodwill 1,620 – 415 –
Deferred income tax from long-term assets/liabilities 32,866 (4,740) 29,817 (2,806)
Non-current assets 3,505 – 2,897 –
Trade and other receivables 8 – 16 –
Trade and other payables 1,871 – 2,994 –
Others 466 – 1,682 –
Temporary differences arising from shares in subsidiaries – (8,844) – (7,675)
Others – (151) – (398)
Deferred income tax from short-term assets/liabilities 5,850 (8,995) 7,589 (8,073)
Deferred income tax assets/liabilities 38,716 (13,735) 37,406 (10,879)
Deferred income tax assets/liabilities, offsetting against
the same taxation authority (4,890) 4,891 (3,105) 3,105
Deferred income tax assets/liabilities, net 33,826 (8,844) 34,301 (7,774)
At 31 March 2016, the Group has income tax loss carryforwards and tax-deductible amortisation of goodwill amounting to a total of
€ 147,797 thousand (at 31 March 2015: € 171,820 thousand), which for the most part can be carried forward for an unlimited period of time. For
loss carryforwards amounting to € 138,279 thousand (at 31 March 2015: € 164,163 thousand), included in this figure, deferred income tax assets
in the amount of € 34,570 thousand (at 31 March 2015: € 42,083 thousand) were not recognised since it is unlikely that they will be realised in
the foreseeable future.
Deferred income taxes (net) changed as follows:
€ in thousands 2015/16 2014/15
Carrying amount at the beginning of the financial year 26,527 18,800
Currency translation differences (3,736) 7,958
Income recognised in profit or loss 2,938 (1,070)
Income taxes recognised in equity (747) 839
Carrying amount at the end of the financial year 24,982 26,527
111Consolidated Financial StatementsConsolidated Financial Statements 83
Income taxes in connection with the components of other comprehensive income are as follows:
2015/16 2014/15
€ in thousands
Income/
(expense)
before taxes
Tax
income/
(expense)
Income/
(expense)
after taxes
Income/
(expense)
before taxes
Tax
income/
(expense)
Income/
(expense)
after taxes
Currency translation differences (82,521) – (82,521) 161,373 – 161,373
Gains/(losses) on the measurement of hedging instruments
for cash flow hedges 3,775 (944) 2,831 (3,356) 839 (2,517)
Remeasurements of post-employment obligations 2,462 197 2,659 (6,757) – (6,757)
Other comprehensive income (76,284) (747) (77,031) 151,260 839 152,099
112 ATS Annual Report 2015/1684 ATS Annual Report 2015/16
8. PROPERTY, PLANT AND EQUIPMENT
€ in thousands
Land, plants
and buildings
Machinery and
technical equipment
Tools, fixtures,
furniture and
office equipment
Prepayments and
construction
in progress Total
Carrying amount 31 Mar 2014 46,996 267,635 4,865 115,607 435,103
Exchange differences 18,381 77,073 994 26,411 122,859
Additions 7,890 68,478 2,925 43,650 122,943
Disposals (3) (658) ‒ ‒ (661)
Transfers 27,163 53,572 11 (80,746) ‒
Impairment ‒ (5,966) ‒ ‒ (5,966)
Depreciation, current (4,656) (63,998) (1,960) ‒ (70,614)
Carrying amount 31 Mar 2015 95,771 396,136 6,835 104,922 603,664
Thereof
Acquisition cost 135,314 1,088,131 27,223 104,922 1,355,590
Accumulated depreciation (39,543) (691,995) (20,388) ‒ (751,926)
Exchange differences (8,701) (39,227) (583) (12,557) (61,068)
Additions 386 87,365 4,428 143,434 235,613
Disposals ‒ (1,044) (86) ‒ (1,130)
Transfers 54 91,228 832 (92,114) ‒
Impairment ‒ (3,113) ‒ ‒ (3,113)
Depreciation, current (6,195) (76,048) (2,562) ‒ (84,805)
Carrying amount 31 Mar 2016 81,315 455,297 8,864 143,685 689,161
Thereof
Acquisition cost 123,028 1,148,510 27,817 143,685 1,443,040
Accumulated depreciation (41,713) (693,213) (18,953) ‒ (753,879)
The value of the land included in “Land, plants and buildings” amounts to € 1,701 thousand (at 31 March 2015: € 1,858 thousand).
Depreciation in the current financial year is recognised mainly in cost of sales, as well as in distribution costs, general and administrative costs,
and in start-up losses recognised in other comprehensive income.
In the financial year 2015/16, borrowing costs on qualifying assets of € 5,365 thousand were capitalised (in the financial year 2014/15:
€ 2,557 thousand). A financing rate of 4.1% was applied (in the financial year 2014/15: 3.6%).
IMPAIRMENT Impairment of machinery and technical equipment amounted to € 3,113 thousand (in the financial year 2014/15:
€ 5,966 thousand) in the financial year 2015/16. In both years this impairment resulted from machines that are no longer usable in the segment
Mobile Devices  Substrates.
IV. Notes to the Consolidated Statement
of Financial Position
113Consolidated Financial StatementsConsolidated Financial Statements 85
9. INTANGIBLE ASSETS
€ in thousands
Industrial property
and similar rights and
assets, and licenses in
such rights and assets
Capitalised
development costs Goodwill Prepayments
Other intangible
assets Total
Carrying amount 31 Mar 2014 1,313 140 ‒ 7,692 ‒ 9,145
Exchange differences 85 5,354 ‒ ‒ ‒ 5,439
Additions 1,535 29,789 ‒ ‒ 208 31,532
Amortisation, current (697) ‒ ‒ ‒ (208) (905)
Carrying amount 31 Mar 2015 2,236 35,283 ‒ 7,692 ‒ 45,211
Thereof
Acquisition cost 16,572 35,283 7,767 7,692 ‒ 67,314
Accumulated amortisation (14,336) ‒ (7,767) ‒ ‒ (22,103)
Exchange differences (52) (6,204) ‒ 12 ‒ (6,244)
Additions 5,877 61,052 ‒ 87 354 67,370
Transfers 7,791 ‒ ‒ (7,791) ‒ ‒
Amortisation, current (930) (1,317) ‒ ‒ (354) (2,601)
Carrying amount 31 Mar 2016 14,922 88,814 ‒ ‒ ‒ 103,736
Thereof
Acquisition cost 29,987 90,065 7,132 ‒ ‒ 127,184
Accumulated amortisation (15,065) (1,251) (7,132) ‒ ‒ (23,448)
Amortisation for the current financial year is charged to cost of sales, distribution costs, general and administrative costs and other operating
result.
The Group’s largest development project is the development of a new technology for the production of substrates for silicon semiconductor
chips taking place for the project Chongqing. As the evidence required for the capitalisation of development costs was provided for this project,
the corresponding costs were recognised in the consolidated financial statements. The serial production of substrates and the scheduled amorti-
sation of development costs started in March 2016.
In the financial year 2015/16, borrowing costs of € 1,255 thousand were capitalised with regards to capitalised development costs (in the finan-
cial year 2014/15: € 234 thousand). A financing rate of 4.1% was applied (in the financial year 2014/15: 3.6%).
IMPAIRMENTS In the financial years 2015/16 and 2014/15, there were no impairments to be recognised on intangible assets. The impairment
test for the development project in Chongqing, China that had not yet been completed in the financial year 2014/15 was based on calculations of
the value in use. Value in use is determined annually in accordance with the DCF method, based on the following critical assumptions in the prior
year:
 Long-term growth rate: 5%
 (Input tax) discount rate: 11.1%
Due to the project’s long-term nature and in order to adequately take into account cash outflows from the substrate business expected in future
periods, the calculation of the value in use was based on the expected cash flows for the next ten years. A consideration over a shorter period of
time would lead to a disproportionately increased weighting of cash inflows.
114 ATS Annual Report 2015/1686 ATS Annual Report 2015/16
10. OTHER NON-CURRENT ASSETS
€ in thousands 31 Mar 2016 31 Mar 2015
Prepayments 6,081 6,878
Deposits made 5,477 5,013
Other non-current receivables 27,961 17,594
Carrying amount 39,519 29,485
Prepayments relate to long-term rent prepayments for the factory premises in China. Other non-current receivables comprise input tax reim-
bursements in China for the plant Chongqing, which will be recovered gradually through VAT liabilities during the operating phase.
11. INVENTORIES
€ in thousands 31 Mar 2016 31 Mar 2015
Raw materials and supplies 28,918 32,558
Work in progress 23,871 22,533
Finished goods 30,649 34,131
Carrying amount 83,438 89,222
The balance of inventory write-downs recognised as an expense amounts to € 17,454 thousand as of 31 March 2016 (€ 13,953 thousand at
31 March 2015). As in the previous year, no material write-downs resulted from the measurement of inventories at net realisable value in the
financial year 2015/16.
12. TRADE AND OTHER RECEIVABLES The carrying amounts of trade and other receivables are as follows:
€ in thousands 31 Mar 2016 31 Mar 2015
Trade receivables 110,275 113,886
Impairments for trade receivables (322) (394)
VAT receivables 14,242 15,140
Other receivables from authorities 3,564 6,253
Prepayments 3,750 4,722
Energy tax refunds 1,170 1,937
Deposits 1,589 977
Other receivables 419 609
Total 134,687 143,130
As at 31 March 2016 and 31 March 2015, other receivables mainly include receivables resulting from prepaid expenses and accrued charges.
Trade receivables amounting to € 32,000 thousand (at 31 March 2015: € 32,000 thousand) act as collateral in connection with various financing
agreements. Reference is made to Note 16 “Financial liabilities”.
Taking impairment into account, the carrying amounts of trade and other receivables approximate their fair values.
REMAINING MATURITIES OF RECEIVABLES All receivables as at 31 March 2016 and 31 March 2015 have remaining maturities of less than
one year.
115Consolidated Financial StatementsConsolidated Financial Statements 87
DEVELOPMENT OF PAST DUE RECEIVABLES AND IMPAIRMENTS OF TRADE RECEIVABLES
31 Mar 2016
thereof
not impaired
thereof not impaired and not insured and past due for the
following periods
€ in thousands
Carrying
amount
and
not past due or
insured
less than
3 months
between
3 and 6
months
between
6 and 12
months
more than
12 months
Trade receivables 110,275 109,306 593 17 37 –
31 Mar 2015
thereof
not impaired
thereof not impaired and not insured and past due for the
following periods
€ in thousands
Carrying
amount
and
not past due or
insured
less than
3 months
between
3 and 6
months
between
6 and 12
months
more than
12 months
Trade receivables 113,886 112,508 957 27 – –
There were no indications at the balance sheet date, that trade receivables not impaired and overdue would not be paid.
Impairments of trade receivables have developed as follows:
€ in thousands 2015/16 2014/15
Impairments at the beginning of the year 394 82
Utilisation (7) –
Reversal (275) –
Addition 232 253
Currency translation differences (22) 59
Impairments at the end of the year 322 394
13. FINANCIAL ASSETS The carrying amounts of the financial assets are as follows:
€ in thousands 31 Mar 2016 thereof non-current thereof current
Financial assets at fair value through profit or loss 631 – 631
Available-for-sale financial assets 96 96 –
Held-to maturity investments 87,186 – 87,186
Total 87,913 96 87,817
€ in thousands 31 Mar 2015 thereof non-current thereof current
Financial assets at fair value through profit or loss 780 – 780
Available-for-sale financial assets 96 96 –
Total 876 96 780
FINANCIAL ASSETS AT FAIR VALUE THROUGH PROFIT OR LOSS
€ in thousands 31 Mar 2016 31 Mar 2015
Bonds 631 780
All bonds are denominated in euro (nominal currency).
116 ATS Annual Report 2015/1688 ATS Annual Report 2015/16
AVAILABLE-FOR-SALE FINANCIAL ASSETS
€ in thousands 2015/16 2014/15
Carrying amount at the beginning of the year 96 96
Disposals – –
Realised gains/(losses) from the current period, removed from equity – –
Exchange differences – –
Carrying amount at the end of the year 96 96
All available-for-sale financial assets are denominated in euro.
FINANCIAL INSTRUMENTS HELD TO MATURITY
The held to maturity financial investments are denominated in euro and Chinese yuan renminbi (nominal currencies). They mainly consist of time
deposits, wealth management products with interest and capital guarantees, and discountable bank bills with a maturity of more than three and
less than twelve months.
14. CASH AND CASH EQUIVALENTS
€ in thousands 31 Mar 2016 31 Mar 2015
Bank balances and cash on hand 171,866 273,919
Carrying amount 171,866 273,919
The reported carrying amounts correspond to the respective fair values.
15. TRADE AND OTHER PAYABLES
Remaining maturity
€ in thousands 31 Mar 2016 Less than 1 year
Between
1 and 5 years More than 5 years
Trade payables 130,668 130,668 ‒ ‒
Government grants 7,164 152 3,851 3,161
Liabilities to fiscal authorities and other state authorities 4,131 4,131 ‒ ‒
Liabilities to social security authorities 3,888 3,888 ‒ ‒
Liabilities from unconsumed vacations 5,856 5,856 ‒ ‒
Liabilities from stock options 207 207 ‒ ‒
Liabilities from stock appreciation rights 743 ‒ 743 ‒
Liabilities to employees 25,842 25,842 ‒ ‒
Other liabilities 9,513 9,513 ‒ ‒
Carrying amount 188,012 180,257 4,594 3,161
117Consolidated Financial StatementsConsolidated Financial Statements 89
Remaining maturity
€ in thousands 31 Mar 2015 Less than 1 year
Between
1 and 5 years More than 5 years
Trade payables 97,785 97,785 ‒ ‒
Government grants 4,265 311 3,868 86
Liabilities to fiscal authorities and other state authorities 5,853 5,853 ‒ ‒
Liabilities to social security authorities 2,523 2,523 ‒ ‒
Liabilities from unconsumed vacations 5,303 5,303 ‒ ‒
Liabilities from stock options 418 54 364 ‒
Liabilities from stock appreciation rights 397 ‒ 397 ‒
Liabilities to employees 29,133 29,133 ‒ ‒
Other liabilities 8,489 8,447 42 ‒
Carrying amount 154,166 149,409 4,671 86
The carrying amounts of the reported liabilities approximate the respective fair values.
GOVERNMENT GRANTS Government grants mainly relate to grants for land-use rights and property, plant and equipment and are released to
profit or loss according to the useful life of the related property, plant and equipment.
Furthermore, the Group received grants for project costs for several research projects which are recognised in income on a pro rata basis ac-
cording to the costs incurred and the grant ratio. Associated deferred amounts are included in government grants.
LIABILITIES FROM STOCK OPTIONS Due to the expiry of the stock option plan (2005 to 2008), the 1
st
meeting of the Nomination and Remu-
neration Committee of the Supervisory Board on 17 March 2009 passed a resolution to implement another stock option plan (SOP 2009 from
2009 to 2012) after it had been submitted for appraisal to the 55
th
meeting of the Supervisory Board on 16 December 2008. Granting of stock
options was possible in the period between 1 April 2009 and 1 April 2012.
Each of these options entitles the holder to the right to either:
 purchase shares (equity-settled share-based payment transactions) or
 settlement in cash (cash-settled share-based payment transactions) at the remaining amount between the exercise price and the closing rate
of ATS shares on the main stock exchange on which ATS shares are listed at the date the option is exercised by the beneficiary.
The exercise price is determined at the respective date of grant and is calculated as the average ATS share price over a period of six calendar
months prior to the date of grant plus 10%. The exercise price, however, corresponds at least to the nominal value of one share in the Company.
Granted options vest gradually with 20% of the options after two years, 30% of the options after three years and 50% of the options after four
years. The stock options may be exercised in full or in part after completion of the vesting period, not however during a restricted period. Op-
tions not exercised can be exercised after the expiry of the subsequent waiting period. Options not exercised within five years after the grant
date become invalid and forfeit without compensation. In the event that a restricted period comprises the end of this five-year period, this re-
stricted period will interrupt the five-year period concerned. After the end of the restricted period, stock options may still be exercised for a
period corresponding to the interruption. Stock options not exercised by the end of this five-year period (extended as stated above) become
invalid and forfeit without compensation.
The stock options could be granted in the period between 1 April 2009 and 1 April 2012. A new stock option plan starting on 1 April 2013 was
not concluded.
118 ATS Annual Report 2015/1690 ATS Annual Report 2015/16
The following table shows the development of the stock options in the financial years 2015/16 and 2014/15.
Date of grant
1 April 2012 1 April 2011 1 April 2010
Exercise price (in €) 9.86 16.60 7.45
31 Mar 2014 88,500 88,500 88,500
Number of options exercised – – 84,000
Number of options expired 1,500 1,500 1,500
31 Mar 2015 87,000 87,000 3,000
Number of options exercised 24,500 – –
Number of options expired – – 3,000
31 Mar 2016 62,500 87,000 –
Remaining contract period of stock options 1 year 3 months1)
–
Fair value of granted stock options at the balance sheet date (in € thousands)
31 Mar 2015 417 32 21
31 Mar 2016 194 – –
1)
Restricted period ending in the middle of June after three days of exercise period.
Reference is made to Note 27 “Related party transactions”.
The weighted average share price on the day of execution of all options exercised in the financial year 2015/16 is € 15.36 (in the financial year
2014/15: € 9.93).
These stock options are measured at fair value at the respective balance sheet date using the Monte Carlo method and based on the model
assumptions and valuation parameters stated below. The values determined for the measurement of the liabilities may differ from the values
later realised on the market for all stock options granted as of 1 April 2011 and 1 April 2012.
Risk-free interest rate -0.47%
Volatility 37.24%
Volatility is calculated based on the daily share prices from 4 May 2015 until the balance sheet date.
The fair value of the stock options granted is recognised as an expense over their term.
At 31 March 2016, the stock options’ exercisable intrinsic value is € 58 thousand (at 31 March 2015: € 104 thousand).
As at 31 March 2016, 19,000 stock options still are exercisable from the grant of 1 April 2012 and 87,000 stock options are exercisable from the
grant of 1 April 2011. As at 31 March 2015, 3,000 stock options are exercisable from the grant of 1 April 2010, 43,500 stock options are exercisa-
ble from the grant of 1 April 2011 and 17,400 stock options are exercisable from the grant of 1 April 2012.
LIABILITIES FROM STOCK APPRECIATION RIGHTS Due to the expiry of the stock option plan (2009 to 2012), the 81
st
Supervisory Board meet-
ing on 3 July 2014 passed a resolution to introduce a long-term incentive programme based on stock appreciation rights (SAR). SAR relate to the
value increase in share prices based on the development of the share price. SAR may be granted in the period between 1 April 2014 and 1 April
2016.
Each SAR entitles the holder to the right to a cash settlement at the remaining amount between the exercise price and the closing price of the
ATS share on the main stock exchange on which it is listed (currently the Vienna Stock Exchange) at the date the subscription right is exercised.
119Consolidated Financial StatementsConsolidated Financial Statements 91
The exercise price of SAR is determined at the respective date of grant, corresponding to the average closing price of the ATS share on the
Vienna Stock Exchange or at the main stock exchange on which the ATS share is listed over a period of six calendar months immediately pre-
ceding the date of grant.
SAR may be exercised in full or in part after the respective completion of a three-year period following the date of grant, but not during a re-
stricted period. Granted stock appreciation rights not exercised within five years after the grant date become invalid and forfeit without com-
pensation.
SAR may only be exercised by the beneficiaries if the following requirements are met at the date of exercise:
 The beneficiary’s employment contract with a company in the ATS Group remains valid. Subject to certain conditions, rights may also be
exercised within a year after termination of the employment contract.
 The required personal investment in the amount of 20% of the first amount granted (in SAR) in ATS shares is held. If the personal investment
is not fully established by the end of the three-year waiting period, all previously granted SAR become forfeit in full. The established personal
investment must be held over the complete period of participation in the programme and also applies to the grant in subsequent years. The
personal investment may only be wound down when exercise is no longer possible.
 The earnings per share (EPS) performance target was met. The level of attainment of the earnings per share performance indicator deter-
mines how many of the granted SAR may actually be exercised. The target value is the EPS value determined in the mid-term plan for the bal-
ance sheet date of the third year after the grant date. If the EPS target is attained at 100% or surpassed, the granted SAR may be exercised in
full. If attainment is between 50% and 100%, the granted SAR may be exercised on a pro rata basis. If the EPS value attained is below 50%, the
granted SAR become forfeit in full.
Number and allocation of granted SAR:
Date of grant
1 April 2015 1 April 2014
Exercise price (in €) 10.70 7.68
Number of stock appreciation rights granted – 230,000
31 Mar 2015 – 230,000
Number of stock appreciation rights granted 240,000 –
Number of stock appreciation rights expired 5,000 5,000
31 Mar 2016 235,000 225,000
Remaining contract period of stock appreciation rights granted 4 years 3 years
Fair value of granted stock appreciation rights as at the balance sheet date (in € thousands)
31 Mar 2015 – 1,192
31 Mar 2016 418 832
SAR are measured at fair value at the respective balance sheet date using the Monte Carlo method and based on the model assumptions and
valuation parameters stated below. The values determined for calculation of the liabilities may differ from the values later realised on the mar-
ket.
Risk-free interest rate -0.37 to -0.47%
Volatility 33.40 to 34.69%
Volatility is calculated based on the daily share prices from 1 March 2013 until the balance sheet date.
The fair value of the SAR granted is recognised as an expense over their term.
120 ATS Annual Report 2015/1692 ATS Annual Report 2015/16
OTHER LIABILITIES Other liabilities mainly include debtors with credit balances, accrued legal, audit and consulting fees, as well as other accru-
als.
16. FINANCIAL LIABILITIES
Remaining maturity
€ in thousands 31 Mar 2016 Less than 1 year
Between 1 and 5
years More than 5 years
Nominal Interest
rate in %
Bonds 76,798 76,798 – – 5.00
Export loans 32,000 32,000 – – 0.29
Loans from state authorities 741 213 528 – 0.75-2.00
Other bank borrowings 409,561 52,402 280,853 76,306 1.16-5.18
Derivative financial instruments1)
3,871 – 3,871 –
Carrying amount 522,971 161,413 285,252 76,306
Remaining maturity
€ in thousands 31 Mar 2015 Less than 1 year
Between 1 and 5
years More than 5 years
Nominal Interest
rate in %
Bonds 101,505 1,822 99,683 – 5.00
Export loans 32,000 32,000 – – 0.49
Loans from state authorities 508 – 508 – 0.75-2.00
Other bank borrowings 267,515 12,215 219,116 36,184 1.15-5.76
Derivative financial instruments1)
3,777 – 2,266 1,511
Carrying amount 405,305 46,037 321,573 37,695
1)
Reference is made to Note 19 “Derivative financial instruments”.
The bond with a total nominal amount of € 100 million was placed by the Company on 18 November 2011 with a term to maturity of five years
and is listed on the Second Regulated Market of the Vienna Stock Exchange. The bond has a denomination of € 1,000 and the annual fixed inter-
est of 5.00% of the nominal value is payable on 18 November of each year in arrears. The bonds proceed is used for the general corporate pur-
poses.
The bond is subject to the following terms and conditions: The bondholders do not have an ordinary cancellation right. An extraordinary cancel-
lation right has been agreed if the following events occur at the Company or one of its main subsidiaries:
 Cessation of payments or announcement of insolvency or over-indebtedness,
 Bankruptcy or other insolvency proceedings (with the exception: of court settlement) or liquidation,
 Significant deterioration of the financial position and performance due to the discontinuation of the major part of operations, sale of major
parts of the assets or non-arm’s length transactions with related parties
 Change of control as stipulated in the Austrian Takeover Act (Übernahmegesetz), if this significantly affects the ability to meet the bond obliga-
tions.
€ 18.0 million of the total nominal amount of € 100 million was repurchased on 22 October 2015 and € 6.5 million on 25 February 2016 ahead of
schedule.
Other bank borrowings mainly include long-term investment financing in addition to the current liquidity needs.
121Consolidated Financial StatementsConsolidated Financial Statements 93
In order to refinance the capital needed for the plant in Chongqing, a long-term loan was raised under an OeKB equity financing programme in
the financial year 2012/13. Loan is being repaid in semi-annual instalments between September 2014 and February 2020. 80% of the loan bears
a fixed interest rate and 20% a variable interest rate, with the variable portion scheduled to be repaid first. The main contract terms are as fol-
lows:
 Net debt/EBITDA max. 4
 Equity ratio of at least 30%
 No change of control
In order to secure planned investments in Chongqing and to further optimise the funding of the Group, a promissory note loan was successfully
placed for a total amount of € 158 million in February 2014. Loan comprises several tranches with terms to maturity of five, seven and ten years
bearing variable and fixed interest rates. The loan was concluded in euros and US dollars. The variable euro interest rate was hedged in full by
interest rate swaps. The main contract terms are as follows:
 Equity ratio of at least 35%
 Net Debt/EBITDA 3 (step-up covenant)
 Change of control within the meaning of the Austrian Takeover Act if this change of control significantly affects the ability to meet the loan
obligations.
If the step-up covenant is exceeded, the margin increases by 75 basis points. The promissory note loan is recognised in other bank borrowings.
To further optimise the funding of the Group, the variable interest rate tranches denominated in euros of € 92 million were terminated and
repaid in October 2015 and February 2016. The interest rate swaps continue to be used to secure the variable tranches of the promissory note
loans placed in October 2015. Due to different maturities and amounts, no effective hedging exists.
In order to secure planned investments and to further optimise the funding of the Group, a promissory note loan was successfully placed for a
total amount of € 221 million in October 2015. Loan comprises several tranches with terms of maturity of five and seven years bearing variable
and fixed interest rates. The loan was concluded in euros and US dollars. The main contract terms are as follows:
 Net Debt/EBITDA 3 (step-up covenant)
 Change of control within the meaning of the Austrian Takeover Act if this makes it illegal for the lender to maintain the loan due to mandatory
statutory or regulatory provisions.
If the step-up covenant is exceeded, the margin increases by 75 basis points. The promissory note loan is recognised in other bank borrowings.
122 ATS Annual Report 2015/1694 ATS Annual Report 2015/16
The contractually agreed (undiscounted) interest and redemption payments of the financial liabilities as at 31 March 2016, including interest rate
hedging, are as follows in the coming financial years:
€ in thousands Bonds Export loans
Loans from state
authorities
Other bank
borrowings
Derivative
financial
instruments
2016/17
Redemption 75,500 32,000 213 50,605 –
Fixed interest 3,775 – 8 5,570 –
Variable interest – 93 – 3,781 –
2017/18
Redemption – – 227 19,526 –
Fixed interest – – 3 5,167 –
Variable interest – – – 3,431 –
2018/19
Redemption – – – 76,870 2,280
Fixed interest – – 2 4,765 –
Variable interest – – – 3,127 –
2019/20
Redemption – – 113 28,948 –
Fixed interest – – 2 2,574 –
Variable interest – – – 2,882 –
2020/21
Redemption – – 188 165,976 1,591
Fixed interest – – 1 2,289 –
Variable interest – – – 2,225 –
after 2020/21
Redemption – – – 76,607 –
Fixed interest – – – 2,059 –
Variable interest – – – 1,292 –
With the exception of the export loan, which will probably be further extended, no significant deviations from the agreed interest and redemp-
tion payments are expected regarding term or amount.
123Consolidated Financial StatementsConsolidated Financial Statements 95
At the previous year’s balance sheet date of 31 March 2015, the contractually agreed (undiscounted) interest and redemption payments of the
financial liabilities, including interest rate hedging, were as follows for the coming financial years:
€ in thousands Bonds Export loans
Loans from state
authorities
Other bank
borrowings
Derivative
financial
instruments
2015/16
Redemption – 32,000 – 11,611 –
Fixed interest 5,000 – 6 4,121 –
Variable interest – 159 – 3,910 –
2016/17
Redemption 100,000 – 213 11,679 –
Fixed interest 5,000 – 6 3,748 –
Variable interest – – – 4,373 –
2017/18
Redemption – – 251 42,764 –
Fixed interest – – 1 3,334 –
Variable interest – – – 4,516 –
2018/19
Redemption – – 150 148,907 –
Fixed interest – – 1 2,920 –
Variable interest – – – 2,744 –
2019/20
Redemption – – 44 16,068 2,266
Fixed interest – – – 693 –
Variable interest – – – 853 –
after 2019/20
Redemption – – – 36,360 1,511
Fixed interest – – – 1,122 –
Variable interest – – – 740 –
Some of the bonds, loans from state authorities and other bank borrowings in part no longer bear market interest rates. For this reason, differ-
ences may arise between their fair values and carrying amounts.
Carrying amounts Fair values
€ in thousands 31 Mar 2016 31 Mar 2015 31 Mar 2016 31 Mar 2015
Bonds 76,798 101,505 77,388 105,000
Export loans 32,000 32,000 32,000 32,000
Loans from state authorities 741 508 745 520
Other bank borrowings 409,561 267,515 415,876 270,801
Derivative financial instruments 3,871 3,777 3,871 3,777
Total 522,971 405,305 529,880 412,098
The calculation of the fair values is based on the discounted value of future payments using current market interest rates, or the fair values are
determined on the basis of listed prices.
124 ATS Annual Report 2015/1696 ATS Annual Report 2015/16
The carrying amounts of financial liabilities by currency are as follows:
€ in thousands 31 Mar 2016 31 Mar 2015
Euro 400,390 351,610
US Dollar 122,528 53,534
Others 53 161
Total 522,971 405,305
Bank borrowings are secured by trade receivables of € 32,000 thousand (at 31 March 2015: € 32,000 thousand). Reference is made to Note 12
“Trade and other receivables”.
The Group’s unused credit lines are as follows:
€ in thousands 31 Mar 2016 31 Mar 2015
Export credit 8,000 8,000
Other credit 239,416 203,068
Total 247,416 211,068
LEASES Total future minimum lease payments recognised for non-cancellable operating leases and rental expenses are as follows:
€ in thousands 31 Mar 2016 31 Mar 2015
Less than 1 year 3,212 2,113
Between 1 and 5 years 6,388 7,133
More than 5 years 1,200 2,709
Total 10,800 11,955
The Group entered into various operating lease agreements for the rental of office space, properties and production facilities, as well as factory
and office equipment and technical equipment.
The obligations from operating leases mainly relate to sale and lease back transaction concluded in the financial year 2006/07 for the properties
and buildings in Leoben-Hinterberg and Fehring, Austria, with a non-cancellable lease term until December 2021. The stated amounts also in-
clude € 3,461 thousand at 31 March 2016 (at 31 March 2015: € 4,219 thousand) attributable to minimum lease payments from the operating
lease for no longer used building spaces in Leoben-Hinterberg, which has already been included in the statement of financial position as other
provisions. Reference is made to Note 18 “Other provisions”.
The payments recognised as expense for non-cancellable lease and rental expenses in the financial year are as follows:
€ in thousands 2015/16 2014/15
Leasing and rental expenses 3,213 3,551
17. PROVISIONS FOR EMPLOYEE BENEFITS Provisions for employee benefits relate to pension commitments, severance payments
and other employee benefits.
DEFINED CONTRIBUTION PLANS The majority of the Group’s employees in Austria and some of its employees in India are covered by defined
contribution pension plans that have been outsourced to a pension fund. For employees in Austria, the pension plans are supplemented by
death and endowment insurance policies. Employer contributions are determined on the basis of a certain percentage of current remuneration.
125Consolidated Financial StatementsConsolidated Financial Statements 97
Employer contributions under these plans amounted to € 491 thousand in the financial year 2015/16 and to € 472 thousand in the financial year
2014/15.
DEFINED BENEFIT PLANS The Group operates defined benefit plans for several current and former members of the Management Board and
former executive employees with no employee contribution required. The board members’ and other executive employees’ plans are partially
funded through assets in pension funds and partially unfunded. Pension benefits of board members and executive employees are based on their
salaries and years of service. Essentially, the Group is exposed to life expectancy and inflation risks due to future increases in pay and pensions
and from the funding of deviations in yields.
FUNDED SEVERANCE PAYMENTS The employees in India are entitled to severance payments upon retirement or, under certain circumstanc-
es, upon leaving the company, the amount of which depends on years of service and the remuneration received by the respective member of
staff. The severance payments range between half of monthly remuneration per year of service and a fixed maximum. Severance payment obli-
gations are covered by a life insurance policy. The main risk to which the Group is exposed from these obligations is the risk of inflation due to
future pay increases.
UNFUNDED SEVERANCE PAYMENTS Employees in Austria, South Korea and China are entitled to receive severance payments, which are
based upon years of service and remuneration received by the respective member of staff and are generally payable upon retirement and, under
certain circumstances, upon leaving the company. For staff members having joined the company before 1 January 2003, the severance payments
in Austria range from two to twelve months of monthly salary, with staff members in South Korea and China also entitled to a fixed amount
depending on years of service and salary. The main risk to which the Group is exposed from these obligations is the risk of inflation due to future
pay increases.
For employees in Austria who joined on or after 1 January 2003, regular contributions are paid to a staff provision fund (“Mitarbeiter-
vorsorgekasse”) without any further obligations on the part of the Group. The contributions for the financial year 2015/16 amounted to
€ 335 thousand and for the financial year 2014/15 to € 288 thousand.
OTHER EMPLOYEE BENEFITS The employees of the companies in Austria and China are entitled to anniversary bonuses for long-term service,
the eligibility to and amount of which in Austria are stipulated in the Collective Agreement.
EXPENSES for (defined benefit) pension obligations, severance payments and other employee benefits consist of the following:
Retirement benefits Severance payments
Other
employee benefits
€ in thousands 2015/16 2014/15 2015/16 2014/15 2015/16 2014/15
Current service cost 132 98 1,703 1,366 1,352 261
Interest expense 120 136 409 549 126 149
Remeasurement of obligations from other employee benefits – – – – 2,066 1,121
Expenses recognised in profit for the period 252 234 2,112 1,915 3,544 1,531
Remeasurement of obligations from post-employment benefits (905) 2,551 (1,556) 4,206 – –
Expenses recognised in other comprehensive income (905) 2,551 (1,556) 4,206 – –
Total (653) 2,785 556 6,121 3,544 1,531
Expenses for retirement, severance payments and other employee benefits are recognised in profit and loss under cost of sales, distribution
costs, general and administrative costs and in other comprehensive income. Net interest expense on personnel-related liabilities is presented in
“Finance costs – net”.
126 ATS Annual Report 2015/1698 ATS Annual Report 2015/16
Amounts accrued in the STATEMENT OF FINANCIAL POSITION are:
€ in thousands 31 Mar 2016 31 Mar 2015
Funded pension benefits 4,929 5,546
Unfunded pension benefits 1,394 1,493
Total pension benefits 6,323 7,039
Unfunded severance payments 22,091 22,284
Funded severance payments 252 202
Total severance payments 22,343 22,486
Other employee benefits 7,627 4,201
Provisions for employee benefits 36,293 33,726
Pension obligations and severance payments are as follows:
Retirement benefits Severance payments
€ in thousands 31 Mar 2016 31 Mar 2015 31 Mar 2016 31 Mar 2015
Present value of funded obligations 14,941 15,862 1,055 1,014
Fair value of plan assets (10,012) (10,316) (803) (812)
Funded status of funded obligations 4,929 5,546 252 202
Present value of unfunded obligations 1,394 1,493 22,091 22,284
Provisions recognised in the statement of financial position 6,323 7,039 22,343 22,486
The present value of projected pension benefits, the movement in plan assets (held to cover the pension benefits) and funded status are as
follows:
Funded
retirement benefits
Unfunded
retirement benefits
€ in thousands 2015/16 2014/15 2015/16 2014/15
Present value of pension obligation:
Present value at the beginning of the year 15,862 13,010 1,493 1,226
Current service cost 132 98 – –
Interest expense 270 424 25 39
Remeasurement from the change in financial assumptions (759) 3,604 (53) 269
Remeasurement from adjustments based on past experience (230) (1,132) (8) 21
Benefits paid (334) (142) (63) (62)
Present value at the end of the year 14,941 15,862 1,394 1,493
Fair value of plan assets:
Fair value at the beginning of the year 10,316 9,919
Investment result (146) 211
Interest income 175 327
Benefits paid (333) (141)
Fair value at the end of the year 10,012 10,316
Funded status of funded pension benefits 4,929 5,546
As at 31 March 2016, the average maturity of funded pension benefits is 16 years and of unfunded pension benefits 13 years.
127Consolidated Financial StatementsConsolidated Financial Statements 99
Plan assets held to cover the pension obligations have been transferred to pension funds. The diversification of the portfolio is as follows:
in % 31 Mar 2016 31 Mar 2015
Debt securities 54% 39%
Equity securities 33% 45%
Real estate 4% 4%
Cash and cash equivalents 9% 12%
Total 100% 100%
A significant portion of plan assets is traded in an active market.
The aggregate movement in funded and unfunded severance payments is as follows:
Funded
severance payments
Unfunded
severance payments
€ in thousands 2015/16 2014/15 2015/16 2014/15
Present value of severance payment obligation:
Present value at the beginning of the year 1,014 674 22,284 16,505
Exchange differences (116) 181 (196) 354
Service cost 64 50 1,639 1,316
Interest cost 74 64 396 544
Remeasurement from the change in demographic assumptions – – 253 (369)
Remeasurement from the change in financial assumptions 29 59 (1,713) 3,820
Remeasurement from adjustments based on past experience 15 12 (130) 680
Benefits paid (25) (26) (442) (566)
Present value at the end of the year 1,055 1,014 22,091 22,284
Fair value of plan assets:
Fair value at the beginning of the year 812 608
Exchange differences (91) 149
Contributions 36 26
Investment result 10 (4)
Interest income 61 59
Benefits paid (25) (26)
Fair value at the end of the year 803 812
Funded status of funded severance payments 252 202
As at 31 March 2016, the average maturity of unfunded severance payments is 12 years.
128 ATS Annual Report 2015/16100ATS Annual Report 2015/16
The aggregate movement in other employee benefits (anniversary bonuses) is as follows:
€ in thousands 2015/16 2014/15
Present value at the beginning of the year 4,201 3,867
Exchange differences (290) 305
Service cost 1,352 261
Interest expense 126 149
Remeasurement from the change in demographic assumptions 363 (286)
Remeasurement from the change in financial assumptions (292) 493
Remeasurement from adjustments based on past experience 1,995 914
Reclassification 1,968 –
Benefits paid (1,795) (1,502)
Present value at the end of the year 7,628 4,201
At 31 March 2016, the average maturity of other employee benefits is 11 years. The reclassification relates to an amount of € 1,968 thousand is
the transfer of the short-term part of anniversary bonuses from trade and other payables.
The following weighted actuarial parameters were used for the measurement at the balance sheet date:
Retirement benefits Severance payments
Other employee benefits
(anniversary bonuses)
31 Mar 2016 31 Mar 2015 31 Mar 2016 31 Mar 2015 31 Mar 2016 31 Mar 2015
Discount rate 2.00 % 1.70 % 2.12 % 2.10 % 2.28 % 2.15 %
Expected rate of remuneration increase 2.25 % 2.25 % 2.85 % 3.40 % 5.08 % 5.00 %
Expected rate of pension increase 2.00 % 2.00 % – – – –
Retirement age 65 65
1) 1)
– –
1)
Individual according to respective local legislation
18. OTHER PROVISIONS
€ in thousands Total Warranty Restructuring Others
Carrying amount 31 Mar 2015 12,660 2,515 8,153 1,992
Utilisation (1,421) (178) (622) (621)
Reversal (1,796) (1,796) – –
Addition 2,885 1,856 – 1,029
Interest effect 15 – 15 –
Exchange differences (306) (199) – (107)
Carrying amount 31 Mar 2016 12,037 2,198 7,546 2,293
129Consolidated Financial StatementsConsolidated Financial Statements101
€ in thousands Total Warranty Restructuring Others
Carrying amount 31 Mar 2014 12,809 893 10,816 1,100
Utilisation (1,970) (240) (1,030) (700)
Reversal (2,578) (530) (1,612) (436)
Addition 3,978 2,005 – 1,973
Interest effect (21) – (21) –
Exchange differences 442 387 – 55
Carrying amount 31 Mar 2015 12,660 2,515 8,153 1,992
€ in thousands 31 Mar 2016 31 Mar 2015
thereof non-current 6,957 7,545
thereof current 5,080 5,115
Carrying amount 12,037 12,660
WARRANTY PROVISION This item relates to the costs of already existing and expected complaints about products still under warranty. The
accrued amount is the best estimate of these costs based on past experience and actual facts, and is not yet recognised as a liability due to the
uncertainty as to amount and timing. The amount of expected costs includes amounts assumed from product liability insurance.
PROVISION FOR THE RESTRUCTURING This provision relates to future vacancy costs for no longer used building space based on the non-
cancellable property lease obligation as well as to a potential loss from the utilisation of the property by the lessor which is to be borne by the
lessee. In the financial year 2014/15, the value was adjusted due to the reduction in unused building space. The provision was largely recognised
as the present value of the expenses expected to be incurred until the end of the non-cancellable property lease obligation in December 2021.
Additionally, a provision for the closure of the plant in Klagenfurt recognised in the financial year 2013/14 was utilised in the financial year
2014/15.
OTHERS This item relates to provisions for risks from pending losses on onerous contracts and to provisions for the risks associated with pension
scheme contributions in Asia resulting from the uncertain legal situation there.
19. DERIVATIVE FINANCIAL INSTRUMENTS Derivative financial instruments mainly relate to foreign exchange swap contracts and
interest rate swaps. Hedged items are primarily trade receivables and payables, as well as payments in connection with loans.
The carrying amounts of the Group’s derivative financial instruments correspond to their fair values. The fair value corresponds to the amount
that would be incurred or earned if the transaction had been settled at the balance sheet date.
The fair values of the derivative financial instruments are as follows at the balance sheet date:
31 Mar 2016 31 Mar 2015
€ in thousands Assets Liabilities Assets Liabilities
Interest rate swaps at fair value – 3,871 – 3,777
Total market values – 3,871 – 3,777
130 ATS Annual Report 2015/16102ATS Annual Report 2015/16
The nominal amounts and the fair values of derivative financial instruments relating to hedges against interest rate fluctuations are as follows at
the balance sheet date, presented by currency:
31 Mar 2016 31 Mar 2015
Currency
Nominal amount
in 1,000 local currency
Market value
€ in thousands
Nominal amount
in 1,000 local currency
Market value
€ in thousands
Euro 92,000 (3,871) 92,000 (3,777)
The remaining terms of derivative financial instruments are as follows at the balance sheet date:
in months 31 Mar 2016 31 Mar 2015
Interest rate swaps 35 - 59 47 - 71
At 31 March 2016, the fixed interest rates for interest rate swaps are 1.01% and 1.405%, the variable interest rate is based on the 6-month
EURIBOR.
Based on the various scenarios, the Group hedges its cash flow interest rate risk by using interest rate swaps. Such interest rate swaps have the
economic effect of converting loans from floating rates to fixed rates. If the Group takes out loans at floating rates, it uses swaps to convert such
loans into fixed rate loans. Under these interest rate swaps, the Group agrees with other parties to exchange, at specified intervals, the differ-
ence between the fixed and variable interest rates calculated by reference to the agreed nominal amounts. Through the prepayment of the
variable parts of the promissory note loan in the financial year 2015/16 from 2014 the basis for hedge-accounting was eliminated. The existing
interest rate swaps are now used for other variable loans. Due to the different maturity and amount there is no effective hedging relationship as
defined by IAS 39 that assumes no influence on gains or losses and therefor in the financial year 2015/16, € 3.8 million of the equity was re-
cognised as non-recurring in profit and loss. Gains or losses arising from the ongoing subsequent measurement of interest rate swaps were
recognised in profit or loss under “finance costs”.
131Consolidated Financial StatementsConsolidated Financial Statements131
20. ADDITIONAL DISCLOSURES ON FINANCIAL INSTRUMENTS
CARRYING AMOUNTS AND FAIR VALUES BY MEASUREMENT CATEGORY The carrying amounts and fair values of financial instruments
included in several items in the statement of financial position by measurement category are as follows at the balance sheet date. Unless other-
wise stated, carrying amounts correspond approximately to the fair values:
31 Mar 2016
€ in thousands
Measurement catego-
ries in accordance with
IAS 39 or measurement
in accordance with
other IFRSs Level Carrying amount Fair value
Assets
Non-current assets
Financial assets AFSFA 2 96 96
Current assets
Trade receivables less impairments LAR 109,953 109,953
Other receivables LAR 419 419
Other receivables – 24,315 24,315
Trade and other receivables 134,687 134,687
Financial assets FAAFVPL 1 631 631
Financial assets HTMI 87,186 87,186
Financial assets 87,817 87,817
Cash and cash equivalents LAR 171,866 171,866
Cash and cash equivalents 171,866 171,866
Liabilities
Bonds FLAAC 1 76,798 77,388
Other financial liabilities FLAAC 2 442,302 448,621
Derivative financial instruments DHI 2 3,871 3,871
Non-current and current financial liabilities 522,971 529,880
Trade payables FLAAC 130,668 130,668
Other payables FLAAC 25,842 25,842
Other payables – 31,502 31,502
Trade and other non-current and current payables 188,012 188,012
Aggregated by measurement categories
Assets
Loans and receivables LAR1)
282,238
Available-for-sale financial assets AFSFA2)
96
Financial assets at fair value through profit or loss FAAFVPL3)
631
Held-to-maturity investments HTMI4)
87,186
Liabilities
Financial liabilities at amortised costs FLAAC 5)
675,610
Derivatives as hedging instruments DHI6)
3,871
132 ATS Annual Report 2015/16104ATS Annual Report 2015/16
31 Mar 2015
€ in thousands
Measurement catego-
ries in accordance with
IAS 39 or measurement
in accordance with
other IFRSs Level Carrying amount Fair value
Assets
Non-current assets
Financial assets AFSFA 2 96 96
Current assets
Trade receivables less impairments LAR 113,492
Other receivables LAR 609
Other receivables – 29,029
Trade and other receivables 143,130
Financial assets FAAFVPL 1 780 780
Financial assets 780 780
Cash and cash equivalents LAR 273,919
Cash and cash equivalents 273,919
Liabilities
Bonds FLAAC 1 101,505 105,000
Other financial liabilities FLAAC 2 300,023 303,321
Derivative financial instruments DHI 2 3,777 3,777
Non-current and current financial liabilities 405,305 412,098
Trade payables FLAAC 97,785
Other payables FLAAC 29,133
Other payables – 27,248
Trade and other non-current and current payables 154,166
Aggregated by measurement categories
Assets
Loans and receivables LAR1)
388,020
Available-for-sale financial assets AFSFA2)
96
Financial assets at fair value through profit or loss FAAFVPL3)
780
Liabilities
Financial liabilities at amortised costs FLAAC 5)
528,446
Derivatives as hedging instruments DHI6)
3,777
1)
Loans and receivables
2)
Available-for-sale financial assets
3)
Financial assets at fair value through profit or loss
4)
Held-to-maturity investments
5)
Financial liabilities at amortised cost
6)
Derivatives as hedging instruments
When measuring fair value, a distinction needs to be made between three valuation hierarchies.
 Level 1: The fair values are determined based on quoted market prices in an active market for identical financial instruments.
 Level 2: If quoted market prices in active markets are not available, the fair values are determined based on the results of a measurement
method that is based to the greatest possible extent on market prices.
 Level 3: In this case, the fair values are determined using measurement models which are not based on observable market data.
133Consolidated Financial StatementsConsolidated Financial Statements105
NET RESULTS RELATING TO FINANCIAL INSTRUMENTS BY MEASUREMENT CATEGORY Net gains or net losses relating to financial assets
and liabilities by measurement category are as follows:
€ in thousands 2015/16 2014/15
Loans and receivables 3,499 6,815
Financial assets at fair value through profit or loss (2,223) (29)
Available-for-sale financial assets 8 8
Held-to-maturity investments 1,579 –
Financial liabilities at amortised cost (7,490) (8,712)
Total (4,627) (1,918)
The net results relating to financial instruments include dividend income, interest income and expenses, foreign exchange gains and losses,
realised gains and losses on the disposal and sale, as well as income and expenses recognised in profit or loss from the measurement of financial
instruments.
€ 121 thousand in net income (in 2014/15: € 427 thousand) of the total net result from financial instruments is included in the operating result,
and € 4,747 thousand in net expense (in 2014/15: € 2,345 thousand in net expense) in “Finance costs – net”.
FINANCIAL RISKS
In the following, the financial risks, which comprise the financing risk, the liquidity risk, the credit risk, and the foreign exchange risk, are ad-
dressed. In the Group Management Report, further risk categories and the related processes and measures are outlined.
Risk management of financial risks is carried out by the central treasury department (Group Treasury) under policies approved by the Manage-
ment Board. Responsibilities, authorisations and limits are governed by these internal guidelines. Group Treasury identifies, evaluates and hedg-
es financial risks in close cooperation with the Group’s operating units.
FINANCING RISK The financing risk relates to securing the long-term funding of the Group and to fluctuations in the value of financial in-
struments.
On the assets side, the Group is exposed to low interest rate risks with regard to its securities portfolio. Other liquid funds are mainly invested
short-term. Reference is made to Note 13 “Financial assets” and Note 14 “Cash and cash equivalents”.
On the liabilities side, 74% (in the previous year 78%) of the total bonds and bank borrowings are subject to fixed interest rates, taking into ac-
count interest rate hedging instruments. Reference is made to Note 16 “Financial liabilities”.
The financial liabilities of the Group are linked to loan commitments that are customary in the market. These commitments are reviewed on a
quarterly basis. In the event of non-compliance with these commitments, the lenders have a right of notice.
LIQUIDITY RISK In the Group, liquidity risk refers to the circumstance of insolvency. Therefore, sufficient liquidity shall be available at all
times to be able to meet the current payment obligations on time.
At 31 March 2016, the Group has liquidity reserves of € 507.1 million (at 31 March 2015: € 485.9 million). This comprises € 259.7 million (at
31 March 2015: € 274.8 million) in cash and cash equivalents, held-to-maturity investments, securities held for trading and available-for-sale and
€ 247.4 million (at 31 March 2015: € 211.1 million) in available unused credit facilities. Thus, the liquidity reserves increased by € 21.2 million
year-on-year and include € 99.4 million (at 31 March 2015: € 131.7 million) in current reserves, which relate to ATS in China and are subject to
specific liquidity requirements.
134 ATS Annual Report 2015/16106ATS Annual Report 2015/16
The Group has a significantly positive operating cash flow. The cash flow from operating activities for the financial year 2015/16 amounts to
€ 136.9 million (in 2014/15: € 143.9 million). Thus, the investments made in the reporting year could be only partly financed by the operating
cash flow.
CREDIT RISK In the Group, credit risk refers to the potential for payment default by customers. The Group has always managed to establish
strong partnerships with its largest customers. 56% of the Group’s total revenue was attributable to its five largest customers.
The share in trade receivables outstanding at the balance sheet date roughly corresponds to the shares in revenue of the individual customers.
The credit risk is kept to a minimum by means of a comprehensive process. Customers are the subject to regular credit assessments and their
receivables are covered by insurance to a large extent. Non-insured receivables are continuously monitored and, if any risks are identified, the
deliveries are made only against advance payments or bank guarantees. In the financial year 2015/16, € 0.3 million (in 2014/15: € 0.4 million) or
0.3% (in 2014/15: 0.3%) of receivables was impaired.
Reference is made to the detailed disclosures in Note 12 “Trade and other receivables”.
FOREIGN EXCHANGE RISK As a globally operating entity, the ATS Group is exposed to foreign exchange risk. “Natural hedges” exist in
part through local added value created at the various sites. Within the Group, transaction risks are initially managed by closing positions (net-
ting). Open positions are continuously analysed and hedged by using different hedging instruments such as forward contracts, currency options
and currency swaps.
Sensitivity analyses are performed to assess the foreign exchange risk, with – all else being equal – the effects of percentage changes of foreign
exchange rates being simulated against each other.
FINANCIAL MARKET RISKS Detailed information on financial market risks and derivative financial instruments is contained in Section I.B.l.
“Accounting and measurement policies: Derivative financial instruments” and in Note 19 “Derivative financial instruments”. The Group uses
derivative financial instruments, such as forward contracts, options and swaps, exclusively for hedging purposes.
EVALUATION OF FINANCIAL MARKET RISKS BY SENSITIVITY ANALYSES The Group applies sensitivity analyses to quantify the interest rate
and currency risks. In gap analyses, the potential change in profit/loss resulting from a 1% change in price (exchange rate or interest rate) of the
foreign currency or interest net position is determined. Correlations between different risk elements are not included in these analyses. The
impact on profit/loss is determined taking into account income tax effects on the profit for the year after tax.
If the interest rates at the balance sheet date had been 100 basis points higher (or lower), based on the financing structure at the balance sheet
date, the profit for the year would have been € 1.4 million lower (or higher) (in 2014/15: € 0.9 million), provided all other variables remained
constant. This would have mainly been due to higher (or lower) interest expenses for variable interest financial liabilities. The effect of this inter-
est rate sensitivity analysis is based on the assumption that the interest rates would deviate by 100 basis points during an entire financial year
and the new interest rates would have to be applied to the amount of equity and liabilities at the balance sheet date.
A change in the US dollar exchange rate of 1% against the euro would have had an impact on the profit for the year in the amount of
€ 0.1 million (in 2014/15: € 0.6 million) due to the measurement of trade receivables and payables, financial balances, and derivative financial
instruments measured at fair value based on US dollars.
Furthermore, reference is made to the detailed disclosures in Note 12 “Trade and other receivables”.
CAPITAL RISK MANAGEMENT The objectives of the Group in respect of capital management include firstly securing the company as a
going concern in order to be able to continue providing the shareholders with dividends and the other stakeholders with their due services and,
secondly, maintaining an appropriate capital structure in order to optimise capital costs. Therefore, the amount of the dividend payments is
adjusted to the respective requirements, capital is repaid to shareholders (withdrawal of treasury shares), new shares are issued or the portfolio
of other assets is changed.
Based on the covenants defined in the credit agreements, the Group monitors its capital based on the equity ratio as well as the ratio of net debt
to EBITDA (theoretical payback period for debts).
135Consolidated Financial StatementsConsolidated Financial Statements107
The Group’s strategy is not to fall below an equity ratio of 40% and not to exceed a theoretical payback period for debts of 3.0 years, creating
sufficient leeway to cushion the effects of adverse business developments and to secure the Company as a going concern even in times of crisis.
Temporary deviations from the values are acceptable.
At the balance sheet date, the equity ratio was 42.3% and thus below the previous year’s figure of 49.5%. At 1.6 years, the theoretical payback
period for debts was above the previous year’s figure of 0.8 years.
21. CONTINGENT LIABILITIES AND OTHER FINANCIAL COMMITMENTS Regarding non-cancellable leasing and rental
agreements, reference is made to Note 16 “Financial liabilities”. At 31 March 2016, the Group has other financial commitments amounting to
€ 80,127 thousand (at 31 March 2015: € 32,857 thousand) in connection with contractually binding investment projects. Furthermore, at the
balance sheet date, the Group has no contingent liabilities from bank guarantees (at 31 March 2015: € 51 thousand). There were no other guar-
antees or commitments relating to ordinary business operations at the balance sheet date.
22. SHARE CAPITAL
Outstanding shares
in thousand shares
Ordinary shares
€ in thousands
Share premium
€ in thousands
Share capital
€ in thousands
31 Mar 2014 38,850 42,735 99,111 141,846
31 Mar 2015 38,850 42,735 99,111 141,846
31 Mar 2016 38,850 42,735 99,111 141,846
ORDINARY SHARES The ordinary shares of the Company as of 31 March 2016 amount to € 42,735 thousand (previous year:
€ 42,735 thousand) and are made up of 38,850,000 (previous year: 38,850,000) no-par value bearer shares with a notional value of € 1.10 each.
APPROVED CAPITAL AND CONDITIONAL CAPITAL INCREASE By resolution passed at the 20th Annual General Meeting on 3 July
2014, the Management Board was authorised until 2 July 2019 to increase the Company's ordinary shares, subject to approval by the Superviso-
ry Board, by up to € 21,367.5 thousand by way of issuing up to 19,425,000 new no-par value bearer shares against contribution in cash or in
kind, in one or several tranches, also by way of indirect rights, offering after having been taken over by one or more credit institutions in accord-
ance with Section 153 (6) of the Austrian Stock Corporation Act (AktG). The Management Board was authorised, subject to approval by the Su-
pervisory Board, to fully or partially exclude the shareholders’ subscription right, and with approval by the Supervisory Board, to determine the
detailed conditions for such issuance (in particular the issue amount, what the contribution in kind entails, the content of the share rights, the
exclusion of subscription rights, etc.) (approved capital). The Supervisory Board was authorised to adopt amendments to the articles of associa-
tion resulting from the issuance of shares from the approved capital.
Furthermore, by resolution of the 20th Annual General Meeting on 3 July 2014, the authorisation to issue convertible bonds as resolved in the
Annual General Meeting on 7 July 2010 was revoked and, simultaneously, the Management Board was authorised until 2 July 2019, subject to
approval by the Supervisory Board, to issue one or several convertible bearer bonds at a total nominal amount of up to € 150,000 thousand and
to grant to bearers of convertible bonds subscription rights and/or conversion rights for up to 19,425,000 new no-par value bearer shares in the
Company in accordance with the convertible bond conditions to be defined by the Management Board and subject to approval by the Superviso-
ry Board. The Management Board was authorised to fully or partially exclude the shareholders’ subscription right to convertible bonds. Converti-
ble bonds may also be issued by a directly or indirectly 100%-owned company of AT  S Austria Technologie  Systemtechnik Aktiengesellschaft.
In such a case, the Management Board was authorised, subject to approval by the Supervisory Board, to assume a guarantee for the convertible
bonds on behalf of the issuing company and to grant conversion and/or subscription rights with regard to shares in AT  S Austria Technologie 
Systemtechnik Aktiengesellschaft to the bearers of the convertible bonds.
Furthermore, in doing so, the Company’s ordinary shares were conditionally increased by up to € 21,367.5 thousand by way of issuance of up to
19,425,000 new no-par value bearer shares in accordance with Section 159 (2) No. 1 of the Austrian Stock Corporation Act (AktG). This condi-
tional capital increase will only carried out if as the bearers of convertible bonds issued based on the authorisation resolution passed at the
Annual General Meeting on 3 July 2014 claim the right to conversion and/or subscription granted to them with regard to the Company's shares.
Furthermore, the Management Board was authorised to determine, subject to approval by the Supervisory Board, the further details of carrying
136 ATS Annual Report 2015/16108ATS Annual Report 2015/16
out the conditional capital increase (particularly the issue amount and the content of the share rights). The Supervisory Board was authorised to
adopt amendments to the articles of association resulting from the issuance of shares from the conditional capital.
With regard to increasing the approved capital and/or the conditional capital increase, the following definition of amount in accordance with the
resolutions passed at the 20th Annual General Meeting on 3 July 2014 is to be observed: The sum of (i) the number of shares currently issued or
potentially to be issued from conditional capital in accordance with the convertible bond conditions and (ii) the number of shares issued from
approved capital shall not exceed the total amount of 19,425,000.
OUTSTANDING SHARES The number of shares issued amounts to 38,850,000 at 31 March 2016 (at 31 March 2015: 38,850,000).
TREASURY SHARES By a resolution passed at the 21th Annual General Meeting on 9 July 2015, the Management Board was again authorised
(pursuant to Section 65 (1) No. 8 of the Austrian Stock Corporation Act (AktG)) to acquire — within 30 months as from the resolution date —
treasury shares to the maximum extent of up to 10% of the ordinary shares of the Company at a lowest price that may be no more than 30%
lower than the average unweighted closing price of the previous 10 trading days and at a highest price per share of a maximum of up to 30%
above the average unweighted closing price of the previous 10 trading days. This authorisation also includes the acquisition of shares by the
Company’s subsidiaries (Section 66 AktG). The acquisition may be carried out via the stock exchange, by means of a public offering or in any
other legal way and for any legal purpose. The Management Board was also authorised to withdraw repurchased treasury shares as well as
treasury shares already held by the Company without any other resolution of the Annual General Meeting. This authorisation may be exercised
in full, in part or in several tranches.
At 31 March 2016, the Group does not hold any treasury shares.
At the 21th Annual General Meeting on 9 July 2015, the Management Board, in accordance with Section 65 (1b) AktG, was again authorised, for
a period of five years from the date the resolution was passed, i.e. up to and including 8 July 2020, upon approval by the Supervisory Board and
without any further resolution of the Annual General Meeting, to also sell the repurchased treasury shares or treasury shares already held by the
Company other than via the stock exchange or by public offer, or, most notably, to use treasury shares for the following purposes:
 Issuance to employees, executive employees and members of the Management Board of the Company or of an affiliated company, including
the servicing of stock transfer programmes (particularly with regard to stock options, long-term incentive plans or other participation pro-
grammes),
 To serve any issued convertible bonds
 As consideration for the acquisition of entities, investments or other assets, and
 For any other legal purpose,
and by doing so, to exclude the general purchase option of shareholders (subscription right exclusion). The authorisation may be exercised in full,
in part and also in several tranches and may serve multiple purposes.
DIVIDEND PER SHARE In the financial year 2015/16, a dividend of € 0.36 was paid per share (in 2014/15: € 0.20).
137Consolidated Financial StatementsConsolidated Financial Statements109
23. OTHER RESERVES The reclassification adjustments of the other comprehensive income realised in the profit for the year and the
movement in other reserves are as follows:
€ in thousands
Currency translation
differences
Available-for-sale
financial assets
Hedging
instruments for
cash flow hedges
Remeasurement of
obligations from
post-employment
benefits
Other
reserves
Carrying amount 31 Mar 2014 2,268 3 (314) (3,254) (1,297)
Balance of unrealised changes before
reclassification, net of tax 161,339 – (2,517) – 158,822
Remeasurement of obligations from post-
employment benefits – – – (6,751) (6,751)
Carrying amount 31 Mar 2015 163,607 3 (2,831) (10,005) 150,774
Balance of unrealised changes before
reclassification, net of tax (82,521) – 2,831 – (79,690)
Remeasurement of obligations from post-
employment benefits, net of tax – – – 2,659 2,659
Acquisition of non-controlling interests (50) – – (5) (55)
Carrying amount 31 Mar 2016 81,036 3 – (7,351) 73,688
With regard to the presentation of income taxes attributable to the individual components of the other comprehensive income, including reclas-
sification adjustments, reference is made to Note 7 “Income taxes”.
24. CASH FLOW In accordance with IAS 7, cash and cash equivalents comprise cash on hand and demand deposits and current, liquid in-
vestments that can be converted into known cash amounts at any time, and are only subject to an insignificant risk of changes in value. The
indirect method was used to prepare the consolidated cash flow statement.
Cash flow from operating activities before changes in working capital in the financial year 2015/16 was € 145,928 thousand (in 2014/15:
€ 144,956 thousand).
Cash flow from investing activities in the financial year 2015/16 amounts to € -342,242 thousand (in 2014/15: € -164,779 thousand) and com-
prises investment activities in Chongqing and Shanghai as well as various technological reinvestments at other locations and investment of liquid
funds.
Net cash generated from financing activities in the financial year 2015/16 was € 111,073 thousand (in 2014/15: € 11,943 thousand), which was
unusually high due to the placing of promissory note bonds of € 221.0 million.
€ in thousands 2015/16 2014/15
Cash flow from operating activities before changes in working capital 145,928 144,956
Cash flow from operating activities 136,925 143,870
Cash flow from investing activities (342,242) (164,779)
Free cash flow (205,317) (20,909)
Cash flow from financing activities 111,073 11,943
Change in cash and cash equivalents (94,244) (8,966)
Currency effects on cash and cash equivalents (7,809) 22,752
Cash and cash equivalents at end of the year 171,866 273,919
138 ATS Annual Report 2015/16110ATS Annual Report 2015/16
The balance of cash and cash equivalents at end of the financial year 2015/16 was € 171,866 thousand (in 2014/15: € 273,919 thousand). This
decrease was due to the very high level of investment, in spite of the very strong cash flow from operating activities. This currently very high
amount is used to ensure the financing of the new plant in Chongqing and refinancing of the bond that matures on 18 November 2016.
The non-cash expense/income is as follows:
€ in thousands 2015/16 2014/15
Changes in non-current provisions 2,492 6,079
Release of government grants (1,340) (1,189)
Other non-cash expense/(income), net (576) 1,010
Non-cash expense/(income), net 576 5,900
139Consolidated Financial StatementsConsolidated Financial Statements111
25. EARNINGS PER SHARE Earnings per share is calculated in accordance with IAS 33 “Earnings Per Share“.
WEIGHTED AVERAGE OF OUTSTANDING SHARES The number of shares issued is 38,850,000. At 31 March 2016, no treasury shares are
held, which would have had to be deducted in the calculation of earnings per share.
The weighted average number of outstanding shares for the basic earnings per share calculation amounts to 38,850 thousand in the financial
year 2015/16 and to 38,850 thousand in the financial year 2014/15.
The weighted average number of outstanding shares for the diluted earnings per share calculation amounts to 38,850 in the financial year
2015/16 and to 38,850 thousand in the financial year 2014/15.
The following table shows the composition of the diluted weighted average number of outstanding shares in the respective periods:
in thousands 2015/16 2014/15
Weighted average number of shares outstanding – basic 38,850 38,850
Diluting effect – –
Weighted average number of shares outstanding – diluted 38,850 38,850
BASIC EARNINGS PER SHARE Basic earnings per share are calculated by dividing the profit for the period attributed to the shareholders of the
Company by the weighted average number of outstanding ordinary shares in the same period.
2015/16 2014/15
Profit for the year (€ in thousands) 55,951 69,279
Weighted average number of shares outstanding – basic (in thousands) 38,850 38,850
Basic earnings per share (in €) 1.44 1.78
DILUTED EARNINGS PER SHARE Diluted earnings per share are calculated by dividing the profit for the period attributed to the shareholders
of the Company by the weighted average number of outstanding shares including the number of potentially outstanding ordinary shares in the
same period. The potentially outstanding ordinary shares comprise the additional shares to be issued for exercisable options or subscription
rights and are included in diluted earnings per share.
2015/16 2014/15
Profit for the year (€ in thousands) 55,951 69,279
Weighted average number of shares outstanding – diluted (in thousands) 38,850 38,850
Diluted earnings per share (in €) 1.44 1.78
26. MATERIAL EVENTS AFTER THE BALANCE SHEET DATE No material events occurred after the balance sheet date.
V. Other Disclosures
140 ATS Annual Report 2015/16112ATS Annual Report 2015/16
27. RELATED PARTY TRANSACTIONS In connection with various projects, the Group received consulting services from companies
where Supervisory Board chairman Mr. Androsch (AIC Androsch International Management Consulting GmbH) and Supervisory Board deputy
chairman Mr. Dörflinger (Dörflinger Management  Beteiligungs GmbH) are managing directors with the power of sole representation. The
Group also received legal advice from Frotz Riedl Rechtsanwälte, where Supervisory Board member Mr. Riedl works as an independent lawyer.
€ in thousands 2015/16 2014/15
AIC Androsch International Management Consulting GmbH 395 380
Dörflinger Management  Beteiligungs GmbH 5 8
Frotz Riedl Rechtsanwälte – 3
Total 400 391
At the balance sheet date, there are no outstanding balances or obligations to the above mentioned legal and consulting companies.
MEMBERS OF THE MANAGEMENT BOARD AND THE SUPERVISORY BOARD In the financial year 2015/16 and until the issue date
of these consolidated financial statements, the following persons served on the MANAGEMENT BOARD:
 Andreas Gerstenmayer (Chairman)
 Karl Asamer (Deputy Chairman)
 Heinz Moitzi
In the financial year 2015/16, the following persons were appointed members of the SUPERVISORY BOARD:
 Hannes Androsch (Chairman)
 Willibald Dörflinger (First Deputy Chairman)
 Regina Prehofer (Second Deputy Chairman)
 Karl Fink
 Albert Hochleitner
 Gerhard Pichler
 Georg Riedl
 Karin Schaupp
Delegated by the Works Council:
 Wolfgang Fleck
 Sabine Fussi
 Franz Katzbeck until 28 January 2016
 Siegfried Trauch from 28 January 2016
 Günther Wölfler
The number of outstanding stock options and staff costs from stock options granted are as follows:
Number of outstanding
stock options
Staff costs
(€ in thousands)
31 Mar 2016 31 Mar 2015 2015/16 2014/15
Andreas Gerstenmayer 60,000 80,000 (4) 218
Heinz Moitzi 60,000 60,000 (36) 114
Total Management Board 120,000 140,000 (40) 332
Total other executive employees 29,500 37,000 (36) 99
Total 149,500 177,000 (76) 431
141Consolidated Financial StatementsConsolidated Financial Statements113
The number of outstanding stock appreciation rights and staff costs from stock appreciation rights granted are as follows:
Number of outstanding
stock appreciation rights
Staff costs
(€ in thousands)
31 Mar 2016 31 Mar 2015 2015/16 2014/15
Andreas Gerstenmayer 80,000 40,000 65 69
Karl Asamer 60,000 30,000 48 52
Heinz Moitzi 60,000 30,000 47 52
Total Management Board 200,000 100,000 160 173
Total other executive employees 260,000 130,000 186 224
Total 460,000 230,000 346 397
Reference is made to the comments on the stock option plans under Note 15 “Trade and other payables”.
Total compensation to the members of the Management Board and to executive employees in the financial year in accordance with IAS 24:
2015/16 2014/15
€ in thousands Fixed Variable Total Fixed Variable Total
Andreas Gerstenmayer 430 457 887 429 506 935
Karl Asamer 376 277 653 3741)
301 675
Heinz Moitzi 360 289 649 359 361 720
Executive employees 4,419 2,259 6,678 4,134 1,996 6,130
Total 5,585 3,282 8,867 5,296 3,164 8,460
1)
The prior year figure has been adjusted slightly for a pro rata 13
th
and 14
th
monthly salary due to joining the Board on 1 April 2014
In accordance with IAS 24, these are key management personnel having direct or indirect authority and responsibility for planning, directing and
controlling the activities of the entity, including any managing director of that entity.
Expenses for severance payments and retirement benefits for members of the Management Board and executive employees are as follows:
Severance payments
Financial year
Pensions
Financial year
€ in thousands 2015/16 2014/15 2015/16 2014/15
Expenses recognised in profit for the period 202 165 345 328
Remeasurement recognised in other comprehensive income (267) 381 (905) 2,550
142 ATS Annual Report 2015/16
Total remuneration for services rendered personally by members of the Supervisory Board attributable to the financial year and proposed to the
Annual General Meeting:
2015/16 2014/15
€ in thousands Fixed Variable Total Fixed Variable Total
Hannes Androsch 63 24 87 35 19 54
Willibald Dörflinger 49 16 65 28 9 37
Regina Prehofer 51 16 67 25 9 34
Karl Fink 29 12 41 24 9 33
Albert Hochleitner 30 12 42 25 9 34
Gerhard Pichler 33 12 45 25 9 34
Georg Riedl 36 12 48 25 9 34
Karin Schaupp 30 12 42 22 9 31
Total 321 116 437 209 82 291
Shareholdings and stock options of members of the Management Board and the Supervisory Board at 31 March 2016:
Shares Stock options
Total shares and stock
options % capital
Management Board members 24,000 120,000 144,000 0.37
Supervisory Board members:
Hannes Androsch 599,699 – 599,699 1.54
Other members of the Supervisory Board 42,250 – 42,250 0.11
Total Supervisory Board members 641,949 – 641,949 1.65
Private foundations:
Androsch Privatstiftung 6,339,896 – 6,339,896 16.32
Dörflinger Privatstiftung 6,902,380 – 6,902,380 17.77
Total private foundations 13,242,276 – 13,242,276 34.09
Total 13,908,225 120,000 14,028,225 36.11
28. EXPENSES FOR THE GROUP AUDITOR The expenses for the financial year for the group auditor are as follows:
€ in thousands 2015/16 2014/15
Audit of consolidated and separate financial statements 137 137
Other assurance services 6 2
Other services 7 48
Total 150 187
This item does not include expenses for other network members of the group auditor, e.g. for the audit of financial statements of subsidiaries or
tax consulting services.
143Consolidated Financial StatementsConsolidated Financial Statements115
29. NUMBER OF STAFF The average numbers of staff in the financial year are as follows:
2015/16 2014/15
Waged workers 6,754 5,924
Salaried employees 2,005 1,714
Total 8,759 7,638
The calculation of the number of staff includes an average of 3,059 leased personnel for the financial year 2015/16 and an average of 3,264 for
the financial year 2014/15.
Leoben-Hinterberg, 9 May 2016
The Management Board
Andreas Gerstenmayer m.p. Karl Asamer m.p. Heinz Moitzi m.p.
144 Statement of all Legal Representatives116ATS Annual Report 2015/16
We confirm to the best of our knowledge that the consolidated financial statements give a true and fair view of the assets, liabilities, financial
position and profit or loss of the Group as required by the applicable accounting standards and that the Group Management report gives a true
and fair view of the development and performance of the business and the position of the Group, together with a description of the principal
risks and uncertainties the Group faces.
Leoben-Hinterberg, 9 May 2016
The Management Board
Andreas Gerstenmayer m.p.
Chief Executive Officer
Karl Asamer m.p.
Chief Financial Officer
Heinz Moitzi m.p.
Chief Operations Officer
Statement of
all Legal Representatives
145Auditor’s ReportAuditor’s Report117
REPORT ON THE CONSOLIDATED FINANCIAL STATEMENTS We have audited the accompanying consolidated financial statements of
AT  S Austria Technologie  Systemtechnik Aktiengesellschaft, Leoben-Hinterberg, which comprise the consolidated balance sheet as of
March 31, 2016, the separate consolidated income statement, the consolidated statement of comprehensive income, the consolidated cash flow
statement and the consolidated statement of changes in equity for the fiscal year then ended, and the notes to the consolidated financial state-
ments.
MANAGEMENT’S RESPONSIBILITY FOR THE CONSOLIDATED FINANCIAL STATEMENTS Management is responsible for the preparation
and fair presentation of the consolidated financial statements in accordance with International Financial Reporting Standards (IFRSs) as adopted
by the EU, and the additional requirements under Section 245a UGB, and for such internal control as management determines is necessary to
enable the preparation of consolidated financial statements that are free from material misstatement, whether du to fraud or error.
AUDITOR’S RESPONSIBILITY Our responsibility is to express an opinion on these consolidated financial statements based on our audit. We
conducted our audit in accordance with Austrian generally accepted auditing standards. These standards require the application of the Interna-
tional Standards on Auditing according to which we are to comply with ethical requirements and to plan and perform the audit to obtain reason-
able assurance whether the consolidated financial statements are free from material misstatement.
An audit involves performing procedures to obtain audit evidence about the amounts and disclosures in the consolidated financial statements.
The procedures selected depend on the auditor's judgment, including the assessment of the risks of material misstatement of the consolidated
financial statements, whether due to fraud or error. In making those risk assessments, the auditor considers internal control relevant to the
Group's preparation and fair presentation of the consolidated financial statements in order to design audit procedures that are appropriate in
the circumstances, but not for the purpose of expressing an opinion on the effectiveness of the Group's internal control. An audit also includes
evaluating the appropriateness of accounting policies used and the reasonableness of accounting estimates made by management, as well as
evaluating the overall presentation of the consolidated financial statements.
We believe that the audit evidence we have obtained is sufficient and appropriate to provide a basis for our audit opinion.
OPINION Our audit did not give rise to any objections. In our opinion, the consolidated financial statements comply with legal requirements and
give a true and fair view of the financial position of the Group as of March 31, 2016 and of its financial performance and its cash flows for the
fiscal year then ended in accordance with International Financial Reporting Standards (IFRSs) as adopted by the EU and the additional require-
ments under Section 245a UGB.
COMMENTS ON THE MANAGEMENT REPORT FOR THE GROUP Pursuant to statutory provisions, the management report for the
Group is to be audited as to whether it is consistent with the consolidated financial statements and as to whether the other disclosures are not
misleading with respect to the Group's position. The auditor's report also has to contain a statement as to whether the management report for
the Group is consistent with the consolidated financial statements and whether the disclosures pursuant to Section 243a UGB are appropriate.
In our opinion, the management report for the Group is consistent with the consolidated financial statements. The disclosures pursuant to Sec-
tion 243a UGB are appropriate.
Vienna, 9 May 2016
PwC Wirtschaftsprüfung GmbH
signed:
Jürgen Schauer
Austrian Certified Public Accountant
We draw attention to the fact that the English translation of this auditor's report according to Section 274 of the Austrian Commercial Code (UGB) is presented for the convenience of the reader only and that the
German wording is the only legally binding version.
Disclosure, publication and duplication of the consolidated financial statements together with the auditor's report according to Section 281 (2) UGB in a form not in accordance with statutory requirements and differing
from the version audited by us is not permitted. Reference to our audit may not be made without prior written permission from us.
Auditor’s Report
146 ATS Annual Report 2015/16118ATS Annual Report 2015/16
Actuators
Drive sections which convert electrical signals into mechanical movement.
Advanced Packaging
Active and passive electrical components are embedded in printed circuit boards and interconnected via
microvias and conducting lines instead of being assembled on the printed circuit board. This technology
enables space-saving, high-performance applications for a wide range of customer segments.
All-in-one module
All the components needed for an end device are connected in an integrated module, combining various
interconnection technologies.
Assembly service
Assembling of components on (or inside) the printed circuit board.
ATX Global Players
A free float weighted price index made up of all stocks traded on the Vienna Stock Exchange and listed in the
Prime Market, which generate at least 20 percent of sales outside of Europe.
ATX Prime
A Vienna Stock Exchange capital-weighted index comprising all securities traded in the Prime Market seg-
ment. This is a broadly-based index for all stocks that meet the minimum capitalisation requirements and
satisfy the stricter disclosure and reporting obligations.
Bare dies
Unpackaged part of a semiconductor silicon wafer.
BGA substrates
Ball Grid Array substrate. This substrate is at least 1.2 times as large as the chip placed on it.
CAPEX
CAPEX refers to the cash investments in property, plant and equipment and intangible assets, meaning that
the asset acquisition is adjusted to exclude non-cash effects.
Carbon footprint
The carbon footprint refers to the amount of greenhouse gas emissions produced over the entire life cycle of
a product.
Cash earnings
For calculation, please refer to the Group Management Report.
CEMs
Contract electronic manufacturers: companies which provide production services – primarily printed circuit
board assembly – to the customer.
Chip-on-board and/or chip-on-flex interconnection platforms
Method for the direct assembly of unpackaged semiconductors on printed circuit boards.
Corporate citizenship
Civic engagement in and by companies that follow a mid and long-term corporate strategy based on respon-
sible business operations and which, as a good citizen, are actively engaged even beyond their business
activities in the local community, for example, in environmental or cultural pursuits.
Glossary
147GlossaryGlossary 119
Corporate Governance Code
A set of rules for the responsible management and control of business enterprises. Companies voluntarily
undertake to comply with the principles of the Code.
Corporate social responsibility (CSR)
The contribution of a business enterprise to sustainable development, beyond the statutory requirements.
CSR should promote responsible corporate behaviour in business activities – with respect to the environ-
ment, relationships with staff (the workplace), and the dialogue with other stakeholders and interest groups.
COSO standard
Internationally recognised standard for Internal Control Systems (ICS) and risk management published by the
Committee of Sponsoring Organizations of the Treadway Commission (COSO).
Covenants (financial)
A covenant is an obligation of a borrower to the creditor not to exceed or fall below certain criteria. The most
common covenants are the equity ratio and net debt/EBITDA.
Coverage
Company analysis with assessment by financial analysts.
CSP substrates
Chip Scale Packaging Substrate; this substrate is no more than 1.2 times as large as the chip placed on it.
Dividend record date
Date on which the company declares who is a shareholder in the company and therefore entitled to divi-
dends.
Duration
The average repayment time for financial liabilities.
EBIT
Operating result = earnings before net finance costs and taxes (Earnings Before Interest and Taxes).
EBIT margin
EBIT as a percentage of total revenue.
EBITDA
Operating result before depreciation and amortisation (Earnings Before Interest, Taxes, Depreciation and
Amortisation).
EBITDA margin
EBITDA as a percentage of total revenue.
ECP® technology
Embedded component packaging technology developed by ATS in order to embed active and/or passive
components inside printed circuit boards (® registered trademark AT 255868).
Embedded die packaging
Technology used to embed active and passive components in a printed circuit board.
148 ATS Annual Report 2015/16120ATS Annual Report 2015/16
Embedded interposer
Interconnection between the printed circuit board and substrate with embedded components, to compen-
sate different structure levels.
Embedding
Integrating active and/or passive electronic components inside printed circuit boards.
Ex-dividend date
If shares are purchased on the ex-dividend date, there is no entitlement to dividends.
Foreign exchange
Conversion from one currency into another.
HDI printed circuit boards
Printed circuit boards with structures smaller than 100 micrometres (0.1 mm) – high density interconnection.
Hedging
Financial transactions providing protection against risks such as exchange rate or interest rate fluctuations.
High-end segment
Technologically demanding market segment on which ATS focuses as a technology leader.
IC substrates
IC substrates are multi-layered, electrically conducting circuit substrates for silicon semiconductors also
known as chips or integrated circuits/ICs and serve as the connection between the chip(s) and the main
printed circuit board.
IFRS
International Financial Reporting Standards are the international accounting rules which are mandatory for
ATS as an exchange-listed company.
IGBT applicators
An insulated-gate bipolar transistor (IGBT) is a semiconductor component used in power electronics.
IIA standard
Standards for measures and the assessment of the quality of internal auditing specified by the Institute of
Internal Auditors (IIA).
Intellectual property
In contrast to tangible property, intellectual property is the right to intangible property such as a technical
invention.
Internet of Everything
Most of the connected devices in use today require active interaction by the user and are mainly used for
acquiring information or entertainment. The majority of the 50 billion connected things in 2020 will be used
to link and direct systems in a variety of areas such as industry, smart homes, smart cities, smart energy,
smart healthcare, wearables and much more.
Internet of Things
A trend based on how internet-connected devices are used to improve the exchange of data, automate com-
plex processes in industry and generate valuable information.
149GlossaryGlossary 121
IRR
The Innovation Revenue Rate represents the share of total revenue generated from products that feature
new, innovative technologies and have been introduced in the past three years.
ISIN
Alphanumerical securities identification number (International Securities Identification Number).
ISO
International Organisation for Standardisation.
Key Performance Indicators
Key indicators for managing corporate targets and measuring progress and/or achievement.
Lean Six Sigma
Management system for efficiency and process improvement. The core element of the system is the descrip-
tion, measurement, analysis, improvement and monitoring of business processes using statistical methods.
L/S
Line/space: line width and spacing of circuit paths.
LTI
Long-term incentive: long-term-oriented bonus system.
Manufacturing Execution System (MES)
Computer systems which gather and process data in a production process – from the raw material to the final
product – in real time.
MEMS
Microelectromechanical system.
Microvia
Microvias are minute holes drilled by a laser to generate the electrical connection between the layers in a
multilayer circuit board.
Miniaturisation
Trend towards even more densely printed circuit board structures on ever smaller surfaces.
Modularisation
Individual components packaged into modules.
MOSFET
Metal-oxide semiconductor field-effect transistor which amplifies or converts electronic signals.
Motherboard
The main printed circuit board in a computer.
Multilayer
Multilayer printed circuit board.
Net CAPEX
Capital expenditure net of receipts from the disposal of property, plant and equipment and intangible assets.
150 ATS Annual Report 2015/16122ATS Annual Report 2015/16
Net debt
For calculation, please refer to the key data section in the Group Management Report.
Net gearing
For calculation, please refer to the Group Management Report.
NOPAT
Net operating profit after tax represents annual profit adjusted to exclude net finance costs. For calculation,
please refer to the Group Management Report.
ÖCGK
Austrian Corporate Governance Code (Österreichischer Corporate Governance Kodex).
OEMs
Original Equipment Manufacturers – manufacturers of original electronic end devices.
OHSAS 18001
Occupational Health and Safety Assessment Series.
Original Device or Design Manufacturer
Manufactures products commissioned by other companies, some of which are developed in-house, that are
ultimately sold under the brand name of the customer.
OSATs
Outsourced assembly and test: manufacturers that offer integrated IC (Integrated Circuit) Packaging solutions
(see Advanced Packaging).
Prepreg
Fibreglass mats saturated with epoxy resin which are cured using heat and pressure. They provide – apart
from copper foils – the base material for the production of printed circuit boards.
Prime Market
Stocks admitted to trading on the Vienna Stock Exchange on the Official Market or Second Regulated Market
and subject to additional, more stringent requirements.
Promissory note loan
A large bond-like loan with a medium to long term. The lenders are usually banks or insurance companies.
The loan is certified with the borrower's promissory note.
Ramp-up
Start-up phase of a manufacturing plant.
RD
Research and Development.
Retail bonds
Corporate bonds whose subscribers can be either private or institutional investors.
RFID
Radio Frequency Identification – technology for transceiver systems for the automatic and contactless identi-
fication of objects using radio waves.
151GlossaryGlossary 123
Risk exposure
The situation of being exposed to risk. Used as a factor in risk management to indicate risks: a combination of
the potential impact and the probability of a risk occurring.
ROCE
Return on capital employed measures how effectively a company generates returns from the capital it uses.
For calculation, please refer to the Group Management Report.
Sale-and-lease-back
Special form of leasing: an enterprise sells property or moveable assets to a leasing company and leases it
back for use in the business.
Solder-resist mask
Finish that protects the surface of the printed circuit board.
Sourcing strategy
Strategy for sourcing goods and services for a company from various suppliers.
Stock options
Options to buy or sell particular stocks.
Substrate-like printed circuit boards
The next generation of high-end HDI printed circuit boards with even finer structures in the 20–30 micro-
metre range. They enable applications such as SiP (System in Package) for mobile applications and wearables.
Swap
A swap is a derivative financial instrument under which future payment streams are exchanged. Typically,
currencies (currency swap) or fixed and variable interest payments (interest swap) are exchanged.
System in Board (SiB)
When passive and/or active components are embedded inside printed circuit boards.
System in Package (SiP)
Consists of one or more semiconductors and passive components that form a system or a functional block.
Tier 1 manufacturers
Automotive suppliers.
WACC
Weighted Average Cost of Capital represents the average cost that a company has to pay to obtain equity or
debt capital.
Wearable devices
Electronic devices that can be worn.
Wire-bond substrate
Substrate on which a semiconductor is connected with wires.
152 ATS Annual Report 2015/16
AT  S Austria Technologie  Systemtechnik Aktiengesellschaft
Fabriksgasse 13
8700 Leoben
Austria
Phone: +43 (0)3842 200-0
ir@ats.net
www.ats.net
Published by and responsible for content
AT  S Austria Technologie  Systemtechnik Aktiengesellschaft
Fabriksgasse 13
8700 Leoben
Austria
Concept and design (general section)
Mensalia Unternehmensberatungs GmbH, Vienna
Photos
Andreas Jakwerth: pages 1, 5, 8, 11, 22, 30, 50, 90
ATS: pages 7, 42, 49, 153
Daniel Novotny: page 23
Helmut Jokesch: page 35
Klaus Vyhnalek: page 35
Werbeagentur DMP: pages 12, 13
Illustrations
Stefanie Hilgarth/carolineseidler.com: pages 3, 14, 15, 21
Werbeagentur DMP: pages 2, 28, 63, 76
Disclaimer
This report contains forward-looking statements which were made on the basis of the information available
at the time of publication. These can be identified by the use of such expressions as “expects”, “plans”, “an-
ticipates”, “intends”, “could”, “will”, “aim” and “estimation” or other similar words. These statements are
based on current expectations and assumptions. Such statements are by their very nature subject to known
and unknown risks and uncertainties. As a result, actual developments may vary significantly from the for-
ward-looking statements made in this report. Recipients of this report are expressly cautioned not to place
undue reliance on such statements. Neither ATS nor any other entity accept any responsibility for the cor-
rectness and completeness of the forward-looking statements contained in this report. ATS undertakes no
obligation to update or revise any forward-looking statements, whether as a result of changed assumptions
or expectations, new information or future events.
Percentages and individual items presented in this report are rounded, which may result in rounding differences.
Formulations attributable to people are to be understood as gender-neutral.
This report in no way represents an invitation or recommendation to buy or sell shares in ATS.
The report is published in German and English. In case of doubt, the German version is binding.
No responsibility accepted for errors or omissions.
Published on 9 June 2016
Contact/Imprint
AT&S Annual Report 2015/16

AT&S Annual Report 2015/16

  • 2.
    Key figures IFRS Unit2012/13 1) 2013/14 2014/15 2015/16 Change in % EARNINGS DATA AND GENERAL INFORMATION Revenue € in millions 541.7 589.9 667.0 762.9 14.4% thereof in Asia % 73.9% 75.9% 79.0% 81.0% – thereof in Europe % 26.1% 24.1% 21.0% 19.0% – Cost of sales € in millions 464.6 471.1 511.6 611.2 19.5% Gross profit € in millions 77.1 118.8 155.4 151.6 (2.4%) Gross profit margin % 14.2% 20.1% 23.3% 19.9% – EBITDA € in millions 102.4 127.2 167.6 167.5 (0.0%) EBITDA margin % 18.9% 21.6% 25.1% 22.0% – EBIT € in millions 31.4 53.9 90.1 77.0 (14.6%) EBIT margin % 5.8% 9.1% 13.5% 10.1% – Profit for the period € in millions 14.6 38.2 69.3 56.0 (19.3%) Profit for the period attributable to owners of the parent company € in millions 14.6 38.2 69.3 56.0 (19.2%) Cash earnings € in millions 85.6 111.4 146.8 146.5 (0.2%) ROE (Return on equity)2) % 5.0% 11.0% 13.9% 9.5% – ROCE (Return on capital employed)2) % 5.6% 9.6% 12.0% 8.2% – ROS (Return on sales) % 2.7% 6.5% 10.4% 7.3% – IRR (Innovation revenue rate) % 19.2% 26.5% 29.2% 19.6% – Cash flow from operating activities (OCF) € in millions 71.7 104.8 143.9 136.9 (4.8%) Net CAPEX € in millions 40.5 90.3 164.8 254.3 54.3% Employees (incl. leased personnel), end of reporting period – 7,011 7,129 8,120 9,116 12.3% Employees (incl. leased personnel), average – 7,321 7,027 7,638 8,759 14.7% BALANCE SHEET DATA Total assets € in millions 726.7 916.1 1,220.8 1,344.7 10.1% Total equity € in millions 304.8 390.7 604.4 568.9 (5.9%) Equity attributable to owners of the parent company € in millions 304.9 390.7 604.3 568.9 (5.8%) Equity ratio % 42.0% 42.7% 49.5% 42.3% – Net debt € in millions 217.4 110.9 130.5 263.2 101.7% Net gearing % 71.3% 28.4% 21.6% 46.3% – Net working capital € in millions 102.7 91.7 95.3 88.4 (7.2%) Net working capital as a percentage of revenues % 19.0% 15.6% 14.3% 11.6% – STOCK EXCHANGE DATA Shares outstanding end of reporting period – 23,322,588 38,850,000 38,850,000 38,850,000 – Weighted average number of shares outstanding – 23,322,588 30,820,545 38,850,000 38,850,000 – Earnings per share outstanding end of reporting period € 0.62 0.98 1.78 1.44 (19.1%) Earnings per average number of shares outstanding € 0.62 1.24 1.78 1.44 (19.1%) Cash earnings per average number of shares € 3.67 3.61 3.78 3.77 (0.3%) Dividend per share3) € 0.20 0.20 0.36 0.36 – Closing price € 6.79 8.75 14.62 12.90 (11.8%) Dividend yield (at the closing price) 3) % 2.9% 2.3% 2.5% 2.8% – Market capitalisation, end of reporting period € in millions 158.4 339.9 568.0 501.2 (11.8%) Market capitalisation per equity4) % 51.9% 87.0% 94.0% 88.1% – 1) Adjusted taking into account IAS 19 revised. 2) Calculated on the basis of average values. 3) 2015/16: Proposal for the Annual General Meeting on 7 July 2016. 4) Equity attributable to owners of the parent company.
  • 3.
    127 54 2012/13 2013/14 2014/152015/16 41 90 254 165 2012/13 2013/14 2014/15 2015/162012/13 2013/14 2014/15 2015/16 102 31 168 77 168 90 2012/13 2013/14 2014/15 2015/16 2012/13 2013/14 2014/15 2015/16 2012/13 2013/14 2014/15 2015/16 305 391 604 569 15 38 69 56542 590 667 763 74 84 95 103 7,321 7,027 7,029* 7,379* EMPLOYEES/REVENUE PER EMPLOYEE Headcount, € in thousands NET CAPEX € in millions EBITDA/EBIT € in millions REVENUE/GROSS PROFIT MARGIN € in millions, in % 14.2 20.1 23.3 19.9 PROFIT FOR THE PERIOD € in millions 42.0 42.7 49.5 Performance Highlights New promissory note loan of € 221.0 million with an average interest rate of 1.6% +14.4% increase in revenue February 2016 of which organic 5.2% = growth significantly above the market average Certification and start of serial production on the first IC substrate production line influenced by higher depreciation and amortisation of the project in Chongqing EBIT -14.6% EBIT margin 10.1% influenced by the start of serial production in Chongqing EBITDA € 167.5 million EBITDA margin 22.0% 42.3 * Employees in average, adjusted by non-revenue generating employees at plant under construction in Chongqing (FY 2014/15: 609 employees; FY 2015/16: 1,380 employees). TOTAL EQUITY/EQUITY RATIO € in millions, in % Revenue guidance of € 740 million and EBITDA margin guidance of > 19% exceeded
  • 4.
    We are working onthe solutions!
  • 6.
    First choice for advanced applications MISSION VISION 2AT&S Annual Report 2015/16 § We set the highest quality standards in our industry § We industrialize leading-edge technology § We care about people § We reduce our ecological footprint § We create value TOP ON COSTUMER’S MIND § Clear USP for all the markets we serve § Best-in-class interface to the customer § Innovative, sustainable solutions § Clear value proposition in the high-end PCB industry § Outstanding product range WE PROVIDE LEADING-EDGE TECHNOLOGY & SERVICES § Identify and anticipate key technological innovations § Provide value-adding solutions § Innovation and industrialisation are essential parts of our culture § We constantly strive to be best-in-class in all of our processes AT&S in Brief AT&S is the leading manufacturer of printed circuit boards in Europe and globally one of the technology leaders in the printed circuit board (PCB) industry. AT&S concentrates on high-end technologies and applications in the segments Mobile Devices & Substrates and Automotive, Industrial, Medical. AT&S is successful among its ­mostly Asian competition because of its clear focus on the high-end, exceptional process know-how, quality, efficiency, capacity utilisation and European governance. AT&S has a cost-effective production footprint in close proximity to the customer, with six production sites in Austria (Leoben, Fehring), India (Nanjangud), China (Shanghai, Chongqing), and South Korea (Ansan). The average number of employees in the financial year 2015/16 was 8,759. AT&S shares have been listed since 1999, first on the Frankfurt Stock Exchange and, since 2008, on the Vienna Stock Exchange.
  • 7.
    3Table of Contents Tableof Contents 51 Group Management Report 52 Business development 52 Market and industry 57 Profit situation 61 Financial position 68 Significant events after the reporting period 69 Plants and branch offices 70 Business development by segments 73 Group 73 Employees 76 Sustainability 79 Research and development 81 Risk and opportunities management 86 Internal Control and Risk Management System with regard to accounting 87 Shareholder structure and disclosure on capital (disclosures according to § 243a Austrian Commercial Code) 89 Outlook 91 Consolidated Financial Statements 2015/16 144 Statement of all Legal Representatives 145 Auditor’s Report 146 Glossary High-tech printed circuit boards for high-end applications 4 Management statement 4 Andreas Gerstenmayer, CEO, discusses the business performance in 2015/16 and the AT&S strategy 8 Heinz Moitzi, COO, on the new plant in China and further trends in research and development 10 Karl Asamer, CFO, discusses ROCE, investments in Chongqing and financial strategy 12 Profile, strategy and influence & success factors 12 Group profile 13 Group sites 14 Value creation chain 16 Goals and strategy 21 Influence and success factors 23 Report of the Supervisory Board 26 Investor Relations 31 Corporate Governance Report 32 Principles and Corporate Governance Declaration 34 AT&S AG Management Board 36 AT&S AG Supervisory Board 43 Remuneration Report: Management and Supervisory Boards 47 Directors’ Holdings & Dealings 48 Other codes of conduct
  • 8.
    4 AT&S AnnualReport 2015/16 How to get smaller and bigger at the same time. Chongqing or advancing to a new league Dear shareholders, customers and partners of AT&S, When I was recently asked by an interested private investor, what’s the AT&S investment story in a nutshell, this was my answer: we invest early in technologies so that we profit from market trends and create added value for our customers. We do this continuously, but at present we have a special focus: our 480 million euro investment in Chongqing, China, in IC substrates and substrate-like printed circuit boards. The performance capacity of electronic prod- ucts and components will continue to in- crease dramatically in the future. This means new dimensions for even smaller and more reliable end devices that cannot be foreseen today. The success factors for product genera- tions will be structural density and function- ality. AT&S has developed a clear strategy and technology roadmap which will enable it to continue meeting these requirements at the forefront of technology in the future. An essential part of this strategy are the new plants for the production of IC substrates and substrate-like printed circuit boards in China. This, combined with proven tech- nologies such as HDI any-layer and embed- ding, gives us the ability to offer customers a unique technology and solutions portfolio bundled in this form. We are planning further significant growth in the high-end technology segment and there- by achieve a new business dimension that generates the operating cash flow needed to finance our future investments even more than before with self-generated funds. This ensures our future! The commissioning of the new plants in Chongqing supports us in this endeavor. Let’s look at the results for the reporting year. Based on very good utilisation levels, we have not only achieved our targets for revenue and profitability announced in our outlook for the year 2015/16, but exceeded them. In addition to strong operating per­formance, the development of foreign exchange rates (primarily the U.S. dollar to the euro) and the start of serial production of the first production line in Chongqing only by mid-­ February contributed. In terms of revenue, we achieved an ­increase of 14.4% in 2015/16. After adjusting for the special effects related to foreign ­exchange, we achieved an increase of 5.2% The AT&S business model in 60 seconds For our printed circuit boards, it’s all about smaller and smaller sizes. But when it comes to our future technology portfolio and business size, AT&S is getting bigger. The printed circuit boards of the future are becoming increasingly smaller, and the requirements go beyond pure printed circuit boards to highly complex all-in interconnection solutions. Facilities that can produce these technologies require considerable investments. It’s a plus when a company can generate high enough cash flow to use for financing. Make our customers successful – this is the AT&S product Printed circuit boards are the basis of all electronic devices. As a production services provider, AT&S enables its customers – whether brand manufacturers or suppliers – to produce unique products. Our success is their success. Anticipate the trends in high-end interconnectivity solutions Innovation is essential to this. We therefore develop materials and processes for the most advanced requirements ahead of time for serial production. This is how we provide an advantage to technology and global market leaders. Maximum production efficiency The production of a printed circuit board involves over 200 steps, in which efficiency and productivity – and always delivering the highest quality on time – are the AT&S success factors. This means continuous investments in technology and employees so as to generate high profitability at the peak of technology.
  • 10.
    6 AT&S AnnualReport 2015/16 from an operational perspective. The prima- ry growth driver was the Mobile Devices & Substrates segment, which posted a revenue increase of 18.6%. Revenue in the Auto­ motive, Industrial, Medical segment rose by 8.2%, mainly resulting from automotive ap- plications such as driver assistance systems. A very gratifying contribution was made by the segment “Other”, which includes ­advanced packaging technology. Revenue in this segment increased by 102.9%. EBITDA remained at the level of the pre- vious year based on a small increase in the Mobile Devices & Substrates segment and negative foreign exchange effects in the Au- tomotive, Industrial, Medical segment. In addition to revenue, EBITDA and EBIT, we also include return on capital employed (ROCE) and the innovation revenue rate (IRR, share of total revenue generated from technologically innovative products introduced in the past three years) in our five most important key performance in- dicators. For IRR, we aim for a figure of greater than 20%. In the reporting year, we achieved 19.6%. Last year, this figure was 29.2%. The difference is attributable to the maturity of certain generations of technolo- gy during the financial year 2015/16. Due to our commitment in Chongqing, ROCE declined from 12.0% to 8.2%. Our CFO, Karl Asamer, provides details about this in following interview starting on page 10. Capacity utilisation of our production sites is one of the most important factors in­ fluencing our earnings development. In the ­financial year 2015/16, we kept this at a very high level. The product mix in the ­reporting year also matched our capacity and the tech- nologies at each of our sites. At this point I would like to briefly call to mind, or introduce you to, the essential points in our strategy. Our strategy is to earn money at the peak of technology. We therefore maintain a clear focus on technologies that are at the high- end of their respective application and on applications with good rates of growth. We are very well positioned in the segments that will especially benefit in the future from the trend of total connectivity: ­mobile end ­devices, automotive, industry and medical. Our broad market coverage gives us the ­ability to take advantage of peak ­technology in particular segments and then ­leverage these technologies as needed to ­other The “Gartner Hype Cycle” is a graphical representation used worldwide in the IT industry. It shows the phases of public visibility an innovation receives over the course of time – from the flash of inspiration all the way to industrial production. The chart includes only those applications that are especially relevant for AT&S with regard to current and future applications. Plateau will be reached in 5 to 10 years. TIME Innovation Trigger Peak of Inflated Expectations Trough of Disillusionment Plateau of Productivity Slope of Enlightenment As of July 2015, Source: AT&S, Gartner Inc. expectations Wearables Autonomous Vehicles Micro Data Centers IoT Platform Connected Home Smart Robots Internet of Things (M2M) Augmented Reality Virtual Reality EXPECTATIONS THE HYPE CYCLE IN THE ELECTRONICS INDUSTRY
  • 11.
    7Management statement ­segments, generallystaggered over time (details on this can be found in the Strategy section, beginning on page 16). We always have to find the right balance when making optimal use of existing technologies, and when we step in new directions, evaluate which competencies we can further develop. The penetration of additional electronic functionalities into our daily lives and the total connectivity of many possible appli- cations will provide us with opportunities for further growth. We want to continue to be the provider who recognises what the market needs better and earlier than our competitors. We want to impress the cus- tomer with the corresponding solutions and level of quality. We expect that the future of electronics will be primarily dominated by a large number of connected, smart ­devices and the processing of enormous volumes With the new plant in China and the existing high-end technologies, we are able to offer a unique technology and service portfolio to the market. of data. These trends will fundamentally change society. However, it is important to be aware that the implementation and introduction of various technologies will take place over different periods of time (see Gartner Hype Cycle). We therefore build up our market intelligence on an ongoing basis, and sharpen our strategy ­continuously. But one thing is clear: there will always be a connection platform that enables the func- tionality of the future. The technological limits have not yet been reached – but we are always working on it. Because of the market segments it targets and the technol- ogies available, AT&S is best prepared to support these trends and provide customers with the right connection platforms. In order to remain at the top of ­technology, we work continuously to become even more efficient. The key opportunity for ­improvement is in accelerating our business ­processes and further optimising our cost structures. An important aspect of this is to either ­reduce the complexity in our produc- tion­processortobettercontrolit.Ultimately, our customers are the ultimate beneficiaries by receiving even more reliable quality with shorter delivery times. For our share­holders, we want to generate clear added value by achieving a return on capital employed (ROCE) which is higher than the weighted average cost of capital in the printed circuit board industry. For the medium term, we have defined a key indicator of 12% ROCE. Shareholders should also profit from the success of our business performance in the form of dividends. More on our dividend policy in the interview with CFO, Karl Asamer, on page 10. Sincerely, Andreas Gerstenmayer, CEO
  • 12.
    8 AT&S AnnualReport 2015/16 »We now have the technologies that will help us drive the further miniaturisation and modularisation required.«
  • 13.
    9Management statement Our Asiantiger is ready to jump Chongqing qualification completed within 17 months Our new plant in China will be our biggest exclamation mark! We are ready to work on the answers that the market is asking of us. One thing is for certain: we will deliver. A report by COO Heinz Moitzi. AT&S is working to develop the trendsetting answers to the questions of the market. With the AT&S core competences in research and development: a profound knowledge of ma- terials, exceptional process know-how, and a true understanding of quality. With a grasp of the general megatrends and for what the market needs in the future, we work with our customers to develop a view of where the technological journey could go. From this perspective and the knowledge of our cus- tomers’ needs, we jointly develop the connec- tion technologies for their future products. The foundation of our operational success lies in the optimal balancing of our produc- tion facilities. It is therefore increasingly im- portant to adopt state-of-the-art production techniques such as MES (Manufacturing Ex- ecution System) or Industry 4.0. As a result of the cooperation between sales and produc- tion, which has been successfully practised for many years, AT&S has succeeded in the highly efficient utilisation of its facilities by means of an optimal product mix. We will face this challenge in the financial year 2016/17 at the IC substrate plant in Chongqing. After completing the qualifica- tion of the individual machines and processes in record-breaking time, the plant is transi- tioning step by step to full operation. I can report that the ramp-up has gone smoothly so far. This is surely an expression of our expertise in bringing new technologies and new processes to serial production readiness quickly and efficiently. The IC substrates that we produce for semi­ conductor manufacturers have raised new technological­questions. These are related to the important drivers of technology in our industry: miniaturisation and modularisa- tion. We currently produce printed circuit boards with a space of 35 µm (micrometers) between the individual conducting lines. For IC substrates, which we now produce in Chongqing, this space is only 12 µm. Within the next five years, this trend is going towards 1–2 µm structures. As a result of entering the new IC substrates segment, we now have the technologies that will help us drive the further miniaturisation and modularisation required, based on our existing technology tool box. IC substrates offer us an enormous opportu- nity – we can now provide the full range of interconnection technology based on “organ- ic materials” and use all of the technologies in our toolbox. In order to create the produc- tion processes we need in the future to push miniaturisation towards of 1–2 µm struc- tures, we are already developing the technol- ogy needed for this jointly with our suppliers, universities, and customers. We are learning to speak the language of the semiconductor industry as the standards that apply there will also be required of us in the future. With respect to basic research, we are part of a consortium with international research insti- tutions in the ANSET project. The project involves the development of printed circuit boards that cannot be hacked externally – which is prevented by the hardware. A very exciting project in times like these. For research and development and for me in particular, the subject of resource efficiency holds great significance. In recent years – including 2015/16 – we have been able to steadily reduce water consumption. And with regard to CO2 emissions, we are on the right path. In the past financial year, we were unable to achieve our target of a 5% reduc- tion. In addition to the higher CO2 burden »We understand – and develop – what the market will need in the future.« resulting from changes in the product mix and the qualification of new facilities, the need for energy-intensive cooling increased at all plants in the past financial year due to the unusually long periods of extreme heat. Technological megatrends are taking place based on the emerging total connectivity – the interconnection of key electronic devices with one another. We are therefore working on medium-term solutions in which AT&S embedding technology and other features make it possible to produce a cost-effective all-in-one module. Applications include electromobility and autonomous driving, for example. Short-term R&D priorities are the next generation of IC substrates and the next evolution in our core business: sub- strate-like printed circuit boards or PCBs based on mSAP (modified semi-additive process). And, of course, we are working in our core business to make our manufacturing and production processes more efficient and qualitatively even more stable.
  • 14.
    10 AT&S AnnualReport 2015/16 Can you give us a brief review of the past ­financial year? Financial year 2015/16 was very successful. As a result of our concentration on high-end applications in mobile devices and the au- tomotive, industrial, and medical areas, we participated in the further growth of these segments. We grew at a faster pace than the market as a whole, with revenue growth of 14.4% to € 762.9 million, and currency-ad- justed organic sales growth of 5.2%. Has Chongqing had an impact? What does this revenue growth mean for the profitabil- ity of AT&S? In revenue terms there has been no nota- ble impact yet. However, EBITDA and EBIT were both affected by the costs of the Chongqing project. Without the effects from Chongqing, EBITDA of € 171.9 mil- lion would have increased to € 180.2 million and EBIT of € 98.2 million to € 103.2 mil- lion. Foreign exchange, which had a consid- erable positive effect on revenue, ultimately had a minor impact on the result. How do you explain this success? The earnings improvement excluding the effects from Chongqing is a result of the in- crease in revenue optimised capacity utilisa- tion and strict cost control in financial year 2015/16. How did return on capital employed per- form compared to the prior period? ROCE of 8.2% was lower compared to the prior-year period. The investment so far of roughly € 290 million for the Chongqing project, which did not make a contribution to earnings in the past financial year, had a negative impact on this key figure. Adjusted for Chongqing, ROCE was 19.3%, which is a significant increase over the prior-year fig- ure of 18.5%. The gearing ratio also rose as planned compared to last year, from 21.6% to 46.3%. On the gearing ratio – what effect has the en- vironment of low interest rates had on your financing costs? We took advantage of both the low interest rates and the profitability of the company to issue a promissory note loan of € 221.0 mil- lion, with a term of 5.6 years and an average interest rate at the time of issue of 1.6%. We refinanced the bond, which is to expire in November 2016, repaid parts of the prom- issory note loan granted in 2014 ahead of schedule, and have not had to use the agreed credit facilities. It is our goal to reduce our financing costs further and to adjust the maturities of our financial obligations to the needs of the business. In selecting our fi- nancing partners, the most important crite- ria are the competitiveness of their offers and their credit rating as well as their presence in the relevant countries. We therefore work with well-known international financial in- stitutions in addition to partners in Austria. Which business risks do you focus on in ­particular? Of course, we have key risks on our radar, and we present them as part of this report in the Risk Report section. Because of our busi- ness model, we pay great attention to market risk so that we can recognise early whether we are aligned with the correct trend with respect to technologies, applications, and markets. It is important that the risks are also associated with sufficient opportunities. What opportunities do you see? AT&S is very innovative, and in the past year it significantly enhanced its reputation as a technology partner to the electronics industry. As a result, we are involved earlier and more frequently in development pro- jects, which enables us to strengthen our position in the market. We expect that, in the future, this will lead to a rate of reve- nue growth above that of market growth. By means of further, constant improvement to our processes, we can secure and raise the competitiveness of the Group. How do you assess the overall economic ­environment and any effects it has on AT&S? We assume that the positive growth trend in the USA and the still very robust, if weak- ened, growth in Asia will have a positive impact on AT&S and support our planned growth. And with respect to interest rate de- velopments, we are assuming little change. Constant or slightly higher interest rates in the USA tend to be balanced by constant or On cash flow, ROCE and increasing enterprise value Take advantage of opportunities in turbulent times Investments in China are the basis for future growth. Advanced technology continues to be the main strategic focus for positioning AT&S. A conversation with CFO Karl Asamer. »Our goal: reduce financing costs to below 2%!«
  • 15.
    falling rates inChina and Europe. Exchange rates are often defined by short-term trends and changes could have a corresponding in- fluence on our business. What is important for our hedging strategy is that the Asian currencies continue to be linked to the USD. One last question – particularly important to shareholders: What are your plans for a div- idend for the past financial year? With the start of the IC substrates invest- ment project in Chongqing, the earlier dividend policy was temporarily suspended and replaced by a fixed amount of € 0.20 per share for the financial year 2013/14 and € 0.36 per share for the financial year 2014/15. At this time of high capital ex- penditure, the Management Board will aim for a moderate dividend policy. For the fi- nancial year 2015/16, we will propose a divi- dend of € 0.36 per share again to the Annual General Meeting of Shareholders.
  • 16.
    12 AT&S AnnualReport 2015/16 Others § Segment revenue: € 22.1 million* § Share of Group revenue: < 1% Characteristics § Includes the Advanced Packaging business unit and Group activities Product portfolio § Embedded component packaging Group profile AT&S is the leading manufacturer of printed circuit boards in Europe and globally one of the technology leaders in the printed circuit board (PCB) industry. AT&S concentrates on high-end technologies and applications in the segments Mobile Devices & Substrates and Automotive, Industrial, Medical. AT&S is successful among its mostly Asian competition because of its clear focus on the high-end, exceptional process know-how, quality, efficiency, capacity utilisation and European governance. AT&S has a cost-effective production footprint in close proximity to the customer, with six production sites in Austria (Leoben, Fehring), India (Nanjangud), China (Shanghai, Chongqing), and South Korea (Ansan). The average number of employees in the financial year 2015/16 was 8,759. AT&S shares have been listed since 1999, first on the Frankfurt Stock Exchange and, since 2008, on the Vienna Stock Exchange. Automotive, Industrial, Medical § Segment revenue: € 326.7 million* § Share of Group revenue: approx. 40% § EBITDA: € 30.1 million § EBITDA margin: 9.2% Characteristics Stable development due to longer product cycles of up to 7 years Application examples § Automotive: advanced driver assistance systems (navigation, lane change, safety, infotainment), lighting, transmission control, etc. § Industrial: control solutions (machine-2-machine communication), etc. § Medical technology: diagnostics, therapies Product portfolio HDI microvia PCBs – multilayer PCBs – double-sided PCBs – IMS PCBs – flexible PCBs – semiflexible PCBs – rigid-flex PCBs – flexible PCBs on aluminium – 2.5D technology platform Mobile Devices & Substrates § Segment revenue: € 539.7 million* § Share of Group revenue: approx. 60% § EBITDA: € 126.4 million § EBITDA margin: 23.4% Characteristics High-end technology driver, volatility due to seasonal fluctuations, short product cycle of about 12–15 months for high-end printed circuit boards Application examples § Communication: smartphones, wearables § Computing: tablets, notebooks, PCs § Consumer electronics: cameras, game consoles Product portfolio IC substrates – HDI any-layer printed PCBs – HDI PCBs – multilayer PCBs ECP: embedded component packaging flexible PCBIC substrateHDI microvia PCBHDI any-layer PCB rigid-flex PCB flexible PCB on aluminium * incl. intersegment revenues
  • 17.
    13Group profile /sites § Production in Europe: high product diversity, low volume § Production in Asia: high volume, low product diversity § Sales network spanning three continents AT&S plant Sales offices/representations Nanjangud, India 1,160 employees Leoben, Austria Headquarters 918 employees Shanghai, China 4,585 employees Ansan, korea 275 employees Chongqing, China 1,380 employees Fehring, Austria 368 employees Group sites 73 employees in other locations
  • 18.
    14 AT&S AnnualReport 2015/16 Value creation chain Printed circuit board production  Schematic illustration of the production process of a printed circuit board. Depending on the number of layers, the production of a printed circuit board can have up to 150 steps. Resources Production process Purchase of resources and materials (including copper foil, cores, prepreg, gold, tin, silver, laminate, chemicals, etc.) Energy (electricity, heat, compressed air, etc.) Water (for production, cooling, cleaning) Employees (8,759 FTEs on average in financial year 2015/16) Extract of determinants of the value chain Processing of customer data Core 1. Insulation material: woven glass fibers saturated with epoxy resin 2. Copper foil Repeat of the laminate layers and exposure processes Up to 26 layers are possibleApplication of the solder-resist mask Protects against copper oxidation on the surface and prevents short- circuiting between the individual circuit paths and solderable areas Expose, develop, and cure All inactive areas are covered. All active areas (soldering pads, test surfaces, etc.) are cleared of the solder resist Contouring (milling, scoring) Production planning and continuous optimisation R&D basic development, production processes, material selection, problem solving Internal and external recycling of waste Efficient use of resources, energy, and water in production Repetition of the process steps of cleaning, lamination, exposure, development, and etching Surface coating of the pads with nickel/gold, silver or immersion tin As oxidation protection and to form a layer that can be soldered Cleaning the surface and lamination with photosensitive film
  • 19.
    15Value creation chain Installationinto the end device Applications of AT&S printed circuit boards Smartphones, tablets, digital cameras, LED headlights, control systems, driver assist systems, diagnostic instruments, hearing aids, pacemakers, robotics, sensor technology, etc. Development of the resist and removal of unneeded copper foil through etching Chemical treatment of the surface area For better adhesion Exposure with LDI (Laser Direct Imaging) A laser beam exposes all ­areas that should be preserved after the etching process Lay-up and pressing of core, prepreg and copper foil at up to 40 bar and 220°C Mechanical drilling For connectivity of the individual copper layers Quality control 100% test of the electrical capability, visual inspection Quality control Certification of facilities and processes Training and continuous education of employees Laser drilling For connectivity between individual layers Copper plating of the drill and laser holes For electrical conductivity Assembling the PCB with semiconductors (microchips), resistors, capacitors, etc. Printed circuit boards are vacuum-packed (individually or in trays) and delivered to the customer Next steps* * Not part of the AT&S value chain
  • 20.
    First choice for advanced applications 16AT&S Annual Report 2015/16 From vision to strategy VISION TARGETS / KEY PERFORMANCE INDICATORS Creation of shareholder value § Medium-term ROCE of 12% Expansion of technology leadership § Leading provider in high-end core business § Medium term: leading provider in new business areas § Innovation revenue rate: 20% Long-term profitable growth/ be one of the most profitable providers in the industry § Medium-term EBITDA margin target of 18–20% § Medium-term revenue target of € 1 billion The best employees and management team members § Talent programs § Training and continuing development § Leadership Excellence programme
  • 21.
    17 Capital excellence § Equityratio: 40% § Financing costs of 2% (in a corresponding interest rate environment) § Payback period of debt 3 years STRATEGY Sustainable business development with focus on ROCE Stable dividend policy Continuous innovation and focus on high-end technologies and applications Developing and marketing new technologies for new applications and requirements, and introduction of existing high-end technolo- gies into developed market segments Focus on innovative solutions Industrialisation of new interconnection platforms through a combination of existing and new high-end technologies Focus on applications and technologies with above-average growth and long-term profitability Focus on the highest service level and customer orientation Operational excellence Focus on cash flow generation Sustainable business leadership Benchmark in the industry through reduction of: § 5% in CO2 emissions p.a. § 3% in fresh water consumption p.a. Goals and strategy
  • 22.
    18 ATS AnnualReport 2015/16 Continuous innovation and focus on high-end technologies and applications: In order to not only maintain, but also to expand our position at the top of technology – a requirement for profitable growth – ATS continuously invests in innovative technologies and processes. ATS uses a dual market strategy Innovations: ATS develops and markets new technologies for new applications and requirements, such as further miniaturisation, and therefore addresses the technological trends in the market segments. One example is mSAP technology (“modified semi-additive Process”), where the printed circuit process is combined with the substrate process in a new evolution of the printed circuit board. These are the basis for system-in-board (SiB) solutions. With system-in-board solutions, semiconductors and other active and passive components in the form of bare dies or packages are integrated into the printed circuit board. Another example is “center core embedding” technology, which is the evolution of current technology patented by ATS for embedding active and passive components into the printed circuit board. With center core embedding, components can now be connected to both sides rather than just one. This is used in power solutions primarily in the industrial and automotive segments. Further development: existing technologies and processes undergo continuous further development. Around € 40–50 million, known as “maintenance capex” is spent annually on technology upgrades, in part to counter any commodification of the technology (where the technology can be produced by many), but also to put tested technologies to use in additional areas of application. An example of this is in the automotive area where, as a result of its early focus on high-end applications, ATS was able to successfully position itself with HDI  technology, which had previously been used only in the Mobile Devices segment. ATS aims to continue as one of the top providers in the high-end business and to be among the most important players in new technologies. ATS measures its innovative strength with the innovation revenue rate (IRR), which indicates the percentage of total revenue achieved with new technologies that have been introduced into the market within the last three years. ATS has defined a target for its Innovation Revenue Rate (IRR) of over 20%. Focus on innovative solutions ATS is strongly focused on providing new interconnection solutions from its “technology toolbox” of existing and new technologies, and industrialising them for serial production. Using this toolbox, which consists of HDI any-layer, embedding, IC substrates, interposers, substrate-like printed circuit boards, and cavities (specially recessed areas), ATS can offer entirely new interconnection platforms to a variety of customers (OEMs, semiconductor manufacturers, tier 1, OSATs = outsourced semiconductor assembly and test) and reposition itself as a total connections solutions provider. Focus on applications and technologies with above-average growth and long-term profitability As one of the most profitable providers in the industry today, ATS can firmly support further profitable growth through its continuous focus on high-end technologies and applications. Through a comprehensive and meticulous process in the individual business units, current and future applications are chosen from among hundreds based on their above average market growth (at least in the low double-digit range), their potential for double-digit EBITDA margins, their need for technology-based high-end structures, and high barriers to entry overall. ATS has defined a medium-term goal of € 1 billion in revenue and aims again for a medium-term EBITDA margin in the range of 18–20%.
  • 23.
    19Goals and strategy Focuson the highest service level and orientation on customers In its role as one of the leading providers of high-end production services, ATS competes primarily with Asian providers. Our key point of differentiation and high customer loyalty comes not only from the level of our technology but also from our absolute focus on the customer. These factors are also a major reason for our high capacity utilisation. ATS’s perception of itself as a partner who can meet even the most complex, individualised requirements in the widest range of lot sizes must be proven every day. This focus on the customer is ensured, on one hand, through an extensive sales and engineering team on three continents that is also close to the customer. In addition, through the introduction of a global Lean Six Sigma process customised for ATS, the company focuses only on value-creating activities, enabling the highest possible customer orientation and service. Operational excellence One of the major unique selling propositions (USP) that ATS offers customers and one that distinguishes it from the competition is its sustained level of very high quality and its competitive cost structure. Over 200 individual steps are needed to produce a high-end printed circuit board. This requires considerable process know-how in all fields of production such as chemistry, electroplating, and mechanics. Mastering these complex production processes with the highest degree of efficiency and productivity at all six production sites, while optimising capacity utilisation, is a key characteristic of the outstanding ATS production management, and it becomes ever better through continuous improvement. These parameters are measured in part by capacity utilisation, which ATS measures across all facilities over a given period of time (asset-weighted capacity utilisation) as well as by costs of quality and revenue per employee. ATS aims to set the benchmark for quality and productivity in every customer segment. Focus on cash flow generation ATS competes in an industry that is shaped by a rapidly changing environment. These developments require continuous investment for a position at the top of technology. Such investments are needed in rapid cycles and cause a corresponding need for cash from the business operations. ATS therefore aims to generate substantial operating cash flow based also on future investments, and thereby strengthen its internal financing capacity. Sustainable business development with a focus on ROCE ATS is clearly committed to creating shareholder value and measures its business performance from the investors’ point-of-view by means of return of capital employed (ROCE). ROCE shows the extent to which ATS manages the capital it uses (tangible and intangible assets and net working capital) efficiently and profitably (the calculation is found in the Management Report). ATS has defined a medium-term ROCE performance indicator of 12%, which is above the weighted average cost of capital for comparable companies. Stable dividend policy Until fiscal year 2011/12, ATS dividend payments were linked to “cash earnings”, the pay-out ratio was on average 10% of cash earnings. With the start of the IC-substrates investment project in Chongqing, the earlier dividend policy was temporarily suspended and replaced by a fixed amount of € 0.20 per share for the financial year 2013/14 and € 0.36 per share for financial year 2014/15. At this time of high capital expenditure, the Management Board will aim for a moderate and stable dividend policy for financial year 2016/17 and 2017/18.
  • 24.
    20 ATS AnnualReport 2015/16 The best employees and managers As a global technology company in a constantly and profoundly changing environment, the best educated, most flexible, and highly motivated employees are the key to long-term success. To ensure and continue to develop expertise, ATS relies on a continuous training and education. It also recruits young, mobile graduates of the highest calibre by means of its International Talent Programme, and focuses on positioning itself as an attractive employer in order to recruit experts with relevant experience. A success-oriented and appreciative corporate culture with clear leadership values derived from its vision and mission is defined as a key to employee commitment and retention at ATS, and is reinforced through a global leadership program. Further details on this are found in the Management Report in the employees section. Sustainable business leadership Sustainability at ATS does not only mean being a “good corporate citizen”. At ATS, sustainability is a clear economic consideration. At all of its production sites, ATS has introduced European standards that exceed local guidelines in many areas of environmental protection, occupational safety, and resource consumption. These are expressed in clear key performance indicators: ATS has established the target of reducing its total carbon footprint in kg CO2 per m2 of printed circuit board by 5% annually, and fresh water consumption per m2 of printed circuit board by 3% annually. Social responsibility is demonstrated at each of the individual sites in the spirit of “think global, act local” in the form of numerous projects primarily in the area of education. The goal of the ATS sustainability strategy is to unite economy, ecology, and social responsibility in a way that benefits all stakeholders. Further information can be found in the section Sustainability in the Management Report and in the Sustainability Report 2015/16. Capital excellence A balanced capital structure (equity and debt) embedded in the prevailing interest rate environment forms the basis for the long-term growth of the Group. ATS has an equity ratio of over 40% as its target for the corresponding credit standing. In the area of financing, ATS aims for a balanced financial structure with a variety of financial instruments for the optimal management of financing cost and repayment period. ATS targets financing costs of less than 2% in the current interest rate environment and a payback period of debt (net debt/EBITDA) of less than three years. Detailed information can be found in the Management Report or in the Notes.
  • 25.
    21 Consistent portfolio managementwith regard to market segments, applications, customers, and technologies to take advantage of various seasonalities and volatilities Long-term strategy with sufficient flexibility to be able to anticipate market developments and be able to respond to market changes Quick implementation of new high-end technologies and processes on competitive terms at the highest level of quality Greatest possible use of mature technologies for new applications in developed markets segments Intelligent combination of different technologies for new solutions for the interconnection technology Competitive production site selection Maximum customer proximity and high internal market intelligence for early detection of trends that will define the printed circuit board industry Excellence at all levels of the value creation chain, from procurement to production to distribution Influence and success factors SUCCESS FACTORSINFLUENCE FACTORS In a continuously changing environment, ATS has defined key influence and success factors for sustainable success: FURTHER ADVANCING OF THE MINIATURISATION OF INTERCONNECTION SOLUTIONS HIGHER PERFORMANCE AND more DENSE STRUCTURES AT THE SAME TIME FURTHER COSTS REDUCTIONS SPEED OF IMPLEMENTING NEW TECHNOLOGIES INTO SERIAL PRODUCTION (“INDUSTRIALISATION”) Influence and success factors
  • 27.
    23Report of theSupervisory Board 1 Dear shareholders, The financial year 2015/16 was another successful year for ATS. Revenue increased further to € 762.9 million and the operating result before interest, tax, depreciation and amortisation (EBITDA), with € 167.5 million, matched the high level of the previous year, even though start-up effects for the project Chongqing had an influence on earnings. This performance can be attributed to an unusually high demand in the first half of the year for printed circuit boards used in mobile devices, and to continuing high demand in automotive applications. However, ATS could not entirely decouple from the somewhat weaker demand development in the high-end segment for mobile devices in the third quarter of financial year 2015/16. ATS is planning to continue the growth path and its technological leadership in several segments in the competi- tive environment dominated by Asian companies. This should be supported by the successful completion of the qualification phase in February 2016 and the start of serial production of the new “IC substrate” technol- ogy, which has now taken place, and expansion of the site in Chongqing, China, for the next generation of printed circuit boards – the substrate-like printed circuit board. The official opening of the IC substrate plant took place on 20 April 2016, attended by Chinese public officials including Chongqing's mayor, Huang Qifan, Austrian officials, representatives from business and the media, customers, the Chairman and First Deputy Chairman of the Supervisory Board and the Management of ATS. COMPOSITION OF THE SUPERVISORY BOARD The Supervisory Board of ATS consists of twelve members. During the financial year 2015/16, elections for the Supervisory Board were held and one change was effected: At the 21st Annual General Meeting of ATS on 9 July 2015, Hannes Androsch, Willibald Dö- rflinger, Karl Fink and Albert Hochleitner were re-elected to the Supervisory Board of the company in accord- ance with the proposal made by the Supervisory Board. The additional members representing shareholder interests on the Supervisory Board of ATS are Regina Prehofer, Gerhard Pichler, Georg Riedl and Karin Schaupp. At the Supervisory Board meeting directly following the Annual General Meeting, Hannes Androsch was unanimously elected as Chairman of the Supervisory Board, Willibald Dörflinger as First Deputy Chairman, and Regina Prehofer as Second Deputy Chairwoman. Effective 28 January 2016, Siegfried Trauch was delegated by the Works Council as an employee representa- tive on the Supervisory Board, taking the place of Franz Katzbeck. Thus Franz Katzbeck departed the Supervi- sory Board on this date. The additional employee representatives delegated by the Works Council to the Supervisory Board are Wolfgang Fleck, Günther Wölfler and Sabine Fussi. ACTIVITIES OF THE SUPERVISORY BOARD The Supervisory Board met five times during the fi- nancial year 2015/16, with the participation of the Management Board. Karl Fink and Franz Katzbeck were excused from two Supervisory Board meetings. Supervising the construction, qualification, certification and finally the commissioning of the IC substrate plant in Chongqing, as well as the further expansion of the Chongqing site for the next generation of printed circuit boards, were also key areas of focus of the Super- visory Board's activities in financial year 2015/16. Proceedings and decisions made by the Supervisory Board in the past financial year were related to the financing of continued growth and, related to this, the continuous improvement of the financing structure – as well as further strategic development of the Group: With the launch of the IC substrate plant in the past financial year, ATS has set the course for further tech- nological development, but is only just beginning this journey. ATS must not only continue to develop this largest single investment and successfully bring it to market, but also profitably expand the existing business and position ATS precisely and quickly in the value chain of the electronics industry that is changing with ever greater speed and force, and in the appropriate customer segments. The production site ATS Korea Co., Ltd. in Ansan (South Korea) has now been 100% integrated into the Group with the acquisition of a remaining minority share. Report of the Supervisory Board Report of the Supervisory Board
  • 28.
    24 ATS AnnualReport 2015/162 ATS Annual Report 2015/16 Again, in the financial year 2015/16, the Supervisory Board diligently exercised its tasks and duties as required by law, the Articles of Association, the Austrian Corporate Governance Code (ÖCGK) and its rules and proce- dures. In the financial year from 1 April 2015 to 31 March 2016, the Supervisory Board was regularly in- formed by the Management Board through a continuous, open exchange of information and opinions, as well as comprehensive oral and written reports about the market situation, strategy, operating and financial position of the Group and its investments, staff situation and planned capital expenditures. The Supervisory Board took the respective decisions accordingly. The Supervisory Board was able to confirm a functioning Issuer Compliance system. Between meetings of the Supervisory Board, the Chairman of the Supervisory Board and his Deputy were regularly informed by the Management Board of business developments. SUPERVISORY BOARD COMMITTEES The Supervisory Board has established an Audit Committee and a Nomination and Remuneration Committee as standing committees. In the 2014/15 financial year, the Supervisory Board also established a “Financing” Project Committee. The respective committees established, carried out detailed analyses of particular matters and reported their findings to the Supervisory Board: The Audit Committee, consisting of Regina Prehofer (Chairwoman), Gerhard Pichler (finance expert), Georg Riedl, Wolfgang Fleck and Günther Wölfler, focused primarily on the review of the annual and consolidated annual financial statements for the year ended 31 March 2015 and on planning and preparation for the audit of the annual and consolidated annual financial statements for the financial year 2015/16. Through discussions with the Auditor, inspection of relevant documents and discussions with the Management Board, it obtained a comprehensive view. The Audit Committee also monitored the effectiveness of the company- wide internal control system and the Group's internal audit and risk management systems. The Audit Committee reported to the full Supervisory Board with respect to this monitoring and found no deficiencies. The Audit Committee convened twice in the past financial year. The meetings, both of which were attended by all committee members, were chaired by Regina Prehofer, who also was regularly involved in quarterly reporting in this function and reported on these matters to the Supervisory Board. At the Supervisory Board meeting that took place following the Annual General Meeting on 9 July 2015, the following members of the Supervisory Board were unanimously elected as members of the Nomination and Remuneration Committee: Hannes Androsch (Chairman), Willibald Dörflinger (Deputy Chairman), Georg Riedl, Wolfgang Fleck, Günther Wölfler; accordingly, Karl Fink and Albert Hochleitner departed from this committee. The Nomination and Remuneration Committee met three times in the past financial year. At two of these meetings, Hannes Androsch was represented by Willibald Dörflinger; employee representatives did not take part in two meetings which were exclusively concerned with regulation of the relationship between the company and its Management Board members. One focus of the activities of the Nomination and Remuneration Committee's activities was the further development of the company's remuneration and incentive systems in line with the market. In financial year 2014/15, the Supervisory Board resolved to establish a Project Committee with respect to the implementation of various measures for debt financing, including providing approval for implementation of the relevant transactions. The Project Committee was empowered to grant all further approvals required from the Supervisory Board for borrowings, as well as the precise terms and conditions in this respect. The Project Committee consisted of Hannes Androsch (Chairman), Willibald Dörflinger, Regina Prehofer, Wolf- gang Fleck and Günther Wölfler. The Project Committee met once during the financial year 2015/16, with all committee members taking part, and discontinued its activities on 24 September 2015 – after the Super- visory Board passed a resolution approving a number of debt financing measures as requested by the Management Board and supported by the Project Committee. Subsequently, matters of financing were again discussed exclusively by the full Supervisory Board. SELF-EVALUATION OF THE SUPERVISORY BOARD The Supervisory Board annually performs self-evaluation, as it did again in the financial year 2015/16, to ensure the continuous improvement of its working practices and the fulfillment of its responsibilities to the shareholders and other stakeholders. The
  • 29.
    25Report of theSupervisory BoardReport of the Supervisory Board 3 annual evaluation carried out by the Supervisory Board confirmed that its regular practices meet the re- quirements of the Austrian Stock Corporation Act and the Austrian Corporate Governance Code (ÖCGK), and that its organisation, work practices and orientation in the interest of the shareholders and all other stake- holders are effective. The self-evaluation will continue to constitute an important component of critical re- view by the Supervisory Board of its own activities. ANNUAL FINANCIAL STATEMENT AND DIVIDENDS The Supervisory Board of ATS proposed that PwC Wirtschaftsprüfung GmbH, Vienna be appointed Company and Group auditors for the financial year 2015/16. The proposal was approved by the Annual General Meeting of 9 July 2015. The annual financial statements of AT S Austria Technologie Systemtechnik Aktiengesellschaft and the consolidated financial statements for the year ended 31 March 2016 were both audited by PwC Wirtschaftsprüfung GmbH, Vienna, and were awarded an unqualified audit report. The management report and the Group Management Report for the financial year 2015/16 were consistent with the annual financial statements and the consolidated financial statements. Based on the prior discussions of the Audit Commit- tee, and following its own detailed discussions and examination, the Supervisory Board approved the Compa- ny's annual financial statements for the year ended 31 March 2016 in accordance with Section 96 (4) Austrian Stock Corporation Act (AktG). Also based on the prior discussions of the Audit Committee, and after its own detailed consideration and examination, it approved the consolidated financial statements drawn up in ac- cordance with Section 245a Austrian Commercial Code (UGB) and with IFRS, as well as the Management Report, the Group Management Report and the Corporate Governance Report. The Supervisory Board re- view, which included extensive discussions with the auditors, did not give rise to any objections. Pursuant to the recommendation of the Audit Committee, the Supervisory Board of ATS will propose to the 22nd Annu- al General Meeting that PwC Wirtschaftsprüfung GmbH, Vienna be appointed Company and Group auditors for the financial year 2016/17. The Supervisory Board adopts the Management Board's recommendation for the allocation of profits. Ac- cordingly, from the reported net profit as at 31 March 2016 amounting to € 40,075,119.15 (whereof distrib- utable: € 38,493,735.07), an amount of € 13,986,000.00, which corresponds to € 0.36 per share, should be distributed as dividends. The remaining amount of € 26,089,119.15 should be carried forward. THANKS TO THE MANAGEMENT BOARD AND ALL ATS EMPLOYEES The past financial year was particularly challenging, marked by the requirements of the existing business as well as the contin- ued construction, qualification, certification and commissioning of a highly modern new production site for IC substrate technology, which is new for ATS. Finally, the Supervisory Board would like to express its gratitude and acknowledgement to the entire Management Board and all employees for their outstanding achievements and commitment in the past financial year. On behalf of the Supervisory Board Leoben-Hinterberg, 6 June 2016 Hannes Androsch m.p. Chairman of the Supervisory Board
  • 30.
    26 ATS AnnualReport 2015/162 ATS Annual Report 2015/16 DEVELOPMENTS IN THE CAPITAL MARKET Persistent volatility with high short-term price fluctua- tions was the defining characteristic of development in the global capital markets in the past financial year. The first months of financial year 2015/16 were dominated by the continuing uncertainty of Greece remain- ing in the Eurozone. Nevertheless, both the DAX and ATX as well as the Dow Jones Industrial (DJI) indexes already reached their high for the year in the first quarter of the financial year 2015/16. Concerns about the economic performance in China, which had been fed by a devaluation of the Chinese currency, resulted in broad share price losses on all relevant capital markets. In December 2015, after the US central bank trig- gered a positive reaction on the markets with its decision to raise interest rates for the first time in nearly a decade, the drop in the price of crude oil in the last quarter of the financial year – temporarily falling to its lowest point in 13 years – shaped the performance of the financial markets. Combined with renewed turbu- lence on Chinese stock exchanges, this caused extensive price losses from which the markets were able to recover to some extent during the final weeks of the financial year. In light of these events, the performance of the Dow Jones Industrial in USA amounted to -0.5% in the period from April 2015 to March 2016. The technology-focused NASDAQ 100 stock index gained 3.5% in the same period. After major fluctuations over the course of the financial year, the key German index DAX closed at the end of March with a decline of 16.7% compared to the beginning of April 2015. The share index for Europe as a whole, the Euro Stoxx 50, declined by 18.7%. In unison with international capital markets, the Viennese benchmark index, the ATX, as well as the broader ATX Prime, partly recovered from their lows at the start of the 2016 calendar year, and lost 9.5% and 7.6% respectively. ATS SHARE PERFORMANCE AND LIQUIDITY The ATS share began the financial year 2015/16 at a price of € 14.72 and reached its high for the reporting period of € 16.35 at the beginning of August 2015. In line with events on international capital markets, there was a subsequent price correction until the low of € 10.12 was recorded in February 2016. The ATS share then performed well in the last weeks of the finan- cial year and significantly recovered from its low point. The price at the end of the reporting period on 31 March 2016 was € 12.90. For financial year 2015/16, this corresponds to a decline of 11.8% (closing price on 31 March 2015: € 14.62). Compared to the ATX Prime Index of the Vienna Stock Exchange, which fell by 7.6% in the past financial year, this represents a slightly below-average performance. The average daily trading volume for 2015/16 was 65,400 shares (single-counted). ATS shares were traded for a total value of € 225.9 million in the reporting year, resulting in an average daily turnover of € 914,387 (prior year: € 693,255). The increase in trading volume was also essential for the first-time inclusion of ATS in the lead- ing Austrian benchmark, the ATX, of which the ATS share has been a part since 21 March 2016. The ac- ceptance criteria for the ATX are the average daily trading volume over the past twelve months and the free- float capitalisation as of the end of February 2016. ATS has also been included since June 2015 in the Aus- trian sustainability index, VÖNIX. This index consists of the shares of companies that stand out from their peers with respect to ecological and social activities and performance. Investor Relations ATS share at a glance Initial listing 16 July 1999 Frankfurt, “Neuer Markt” starting 20 May 2008 Vienna, Prime Market Number of ordinary shares 38,850,000 Securities Identification No. 969985 ISIN Code AT0000969985 Ticker symbol ATS Reuters ATS.VI Bloomberg ATS AV Indices ATX, ATX GP, WBI, VÖNIX
  • 31.
    Investor Relations 120% 100% 80% 60% ATS ATXPrime Tec DAX 27 ANNUAL RESULTS 2014/15 § Record year for ATS § Revenue: + 13.1%, EBITDA: + 31.8%, EBITDA margin: 25.1%, earnings per share of €1.78 § One of the most profitable companies in the printed circuit board industry Q1 2015/16 § Limited seasonality § Increase in revenue of 37.6%, EBITDA margin 23.4%, earnings per share rise by 159.2% to €0.50 § Revenue guidance increase to €725 million H1 2015/16 § Very high capacity utilisation § Increase in revenue of 28.2%, EBITDA margin 24.1%, and earnings per share rise to €1.08 § Further revenue guidance increase to €740 million § Revenues from advanced packaging technology triple and achieve positive earnings Q1–Q3 2015/16 § Growth significantly stronger than the printed circuit board market § Increase in revenue of 19.4%, EBITDA margin at 24.0%, and earnings per share at €1.55 § Slight weakening in demand for mobile end devices in the last months of the 3rd quarter APR MAY JUN JUL AUG SEP OCT NOV DEC JAN FEB MAR EXTERNALEVENTSINTERNALEVENTS § Announcement of Chongqing expansion § Start of construction – Chongqing Plant II § Capital Markets Day in Chongqing § 21st Annual General Meeting § Listing in the VÖNIX sustainability index § Listing on the ATX index § ATS share price high of € 16.35 § Conclusion of promissory note loan agreement for around € 221.0 million § Roof topping-off ceremony for Chongqing II § ATS cooperation with Fairphone § Start serial ­production of IC substrates Qualification and certification of Chongqing plant I § Greek referendum on reform measures § The FED declines an increase in interest rates § ­VW scandal emerges § Euro Stoxx 50 falls to just under 3,000 points § ECB does not fulfill expectations of a further loosening of monetary policy § The FED raises interest rates § Tec DAX reaches its high for the reporting period of 1,889 points § Trading volume on the Vienna Stock Ex- change rises by 24% APRIL TO AUGUST 2015: uncertainty over Greece remaining in the Eurozone § High for the year for the ATX at 2,681 points § New high for the Dow Jones at 18,351 points § DAX reaches new all-time high of 12,391 points § Equity markets in China fall by more than 30% § Renminbi devalued § DAX below 10,000 points, Dow Jones below 16,000 points § Rising tensions between Turkey and Russia § Turbulence on equity markets in China § Share prices fall globally, Dow Jones again below 16,000 points § Crude oil temporarily falls to 13-year low § Tec DAX temporarily falls to under 1,500 points § DAX falls below 9,000 points, ATX falls below 2,000 points § ATS Technology Forum
  • 32.
    28 ATS AnnualReport 2015/16 6 ATS Annual Report 2015/16 Key Stock figures Unit 2015/16 2014/15 2013/14 Closing price at 31 March € 12.90 14.62 8.75 High € 16.35 15.55 9.12 Low € 10.12 7.68 6.15 Market capitalisation, end of reporting period € in millions 501.2 568.0 339.9 Average share turnover per day € in thousands 914.4 693.3 496.6 Average number of shares traded per day Shares 65,400 67,000 50,200 Dividend per share1) € 0.36 0.36 0.20 Dividend yield (at the closing price) % 2.8% 2.5% 2.3% Earnings per share € 1.44 1.78 1.24 Carrying value per share € 14.64 15.56 10.06 Price-earnings ratio per share - 8.96 8.21 7.06 1) 2015/16: Proposal to the Annual General Meeting on 7 July 2016. DIVIDEND POLICY Through to the financial year 2011/12, the amount of the ATS dividend was linked to “cash earnings”. On average, approximately 10% of cash earnings was distributed as dividends. With the start of the IC substrates investment project in Chongqing, this dividend policy was temporarily suspended and replaced by a fixed amount of € 0.20 per share for the financial years 2012/13 and 2013/14, and € 0.36 per share for the financial year 2014/15. For the financial year 2015/16, the Management Board will propose a dividend of € 0.36 per share to the Annual General Meeting on 7 July 2016. SHAREHOLDER STRUCTURE Regional split as % of shares outstanding (free float) ANALYSIS OF THE ATS SHARE As at 31 March 2016, the ATS share was analysed by the following eight investment banks. Investment bank Recommendation Investment bank Recommendation Berenberg Bank Buy Kepler Cheuvreux Hold Erste Group Buy Oddo Seydler Research Neutral Hauck Aufhäuser Hold Raiffeisen Centrobank Hold HSBC Buy Wood Company Buy The names of the analysts and the respective analysis date and price target are available on the website www.ats.net/investors. 65.9% 17.8% 16.3% Free Float Dörflinger Private Foundation* Androsch Private Foundation* *including direct and indirect holdings Regional Split as % of shares outstanding (Free Float)Shareholder structure Other Investors: 5.2% Free Float not identified: 14.9% Private Investors: 36.9% Institutional Investors Continental Europe (excl. Austria): 8.9% Institutional Investors North America: 9.6% Institutional Investors UK Ireland: 6.2% Institutional Investors Austria: 18.3%
  • 33.
    Investor Relations 29InvestorRelations 7 ROADSHOWS ATS continued its extensive programme of roadshows in financial year 2015/16, providing information to existing and potential investors, both private and institutional, as well as analysts as part of over 20 roadshows and investor conferences as well as numerous teleconferences and individual meetings and a Capital Markets Day. The programme covered relevant capital market centres in Europe, Asia and the USA. At the centre was information about development of the new plant for IC substrates in Chongqing and the progress toward the certification as the start of serial production. In connection with this, the Capital Markets Day was held in June 2015 in Chongqing to give the participants a first-hand view directly at the site. A medium-term technology roadmap was also outlined. Further important topics in the dialogue with the capital market participants were the current trends in the market and in technology as well as the develop- ments in the customer segments. CAPITAL MARKET COMMUNICATION The ATS investor relations team is committed to transparent, proactive and continuous communication with all capital market participants on an equal basis. By means of comprehensive dialogue and by providing information that is timely and relevant, we aim to reinforce long- term confidence in ATS, its business model and the associated opportunities and risks. All relevant infor- mation for capital market participants is available on our comprehensive Investor Relations website at http://www.ats.net/investors, and information can also be sourced through the ATS Twitter page (@ATS_IR_PR) and YouTube channel (ATundS). For greater transparency and the equal treatment of all shareholders, ATS broadcasts its Annual General Meeting and twice-yearly press conferences on the Inter- net. In connection with this, the Investor Relations team is also pleased to receive requests and feedback on the Shareholders Hotline (see Contact). We cordially invite all shareholders to attend the next Annual General Meeting on 7 July 2016. All current and complete information is published on the website. The resolutions from the last Annual General Meeting as well as all information and documents are also available on the website. Financial Calendar 27 June 2016 Record date Annual General Meeting 07 July 2016 22nd Annual General Meeting 26 July 2016 Ex-dividend day 27 July 2016 Record date dividend 28 July 2016 Dividend payment day 28 July 2016 Results for the first quarter 2016/17 03 November 2016 Results for the first half-year 2016/17 31 January 2017 Results for the first three quarters 2016/17 09 May 2017 Annual results 2016/17 CONTACT/SHAREHOLDER’S HOTLINE Elke Koch Phone.: +43 (0)3842 200-5925 Email: ir@ats.net
  • 35.
    31Corporate Governance Report CorporateGovernance Report TABLE OF CONTENTS Principles and Corporate Governance Declaration   32 ATS AG Management Board   34 ATS AG Supervisory Board   36 Composition   37 Independence of Supervisory Board members   39 Diversity   40 Agreements requiring approval   40 Committees   40 Remuneration Report: Management and Supervisory Boards   43 Directors’ Holdings Dealings   47 Other codes of conduct   48 Code of Business Ethics and Conduct   48 Capital market compliance   48 Advancement of women in senior management   48
  • 36.
    32 ATS AnnualReport 2015/168 ATS Annual Report 2015/16 CORPORATE GOVERNANCE CODE In Austria, the Corporate Governance Code (ÖCGK) drawn up by the Working Group for Corporate Governance under the guidance of the government authorities responsible for the Austrian capital markets has been in force since 1 October 2002. Since then it has been reviewed annually in light of national and international developments and amended where necessary. The objective of the ÖCGK is the responsible management and control of enterprises for the purpose of sustainable, long-term value creation, with a high level of transparency for all stakeholders. Its basis is provided by the provisions of Austrian company, stock exchange and capital markets legislation, the EU recommendations concerning the responsibilities of Supervisory Board members and the remunera- tion of directors, and the principles of the OECD guidelines for corporate governance. The rules of the ÖCGK are divided into three categories:  L-Rules (legal requirements): rules based on mandatory statutory requirements  C-Rules (comply or explain): rules from which any departure must be explained and justified  R-Rules (recommendations): rules in the nature of recommendations, where non-compliance need neither be disclosed nor explained. The version of the ÖCGK currently in force can be downloaded from the Working Group's website at www.corporate-governance.at. An English translation of the Code and interpretations of the Code prepared by the Working Group are also available there. ATS shares have been listed on the Vienna Stock Exchange since 20 May 2008. In order to qualify for inclu- sion in the Prime Market, companies must provide an undertaking to comply with the ÖCGK. ATS has there- fore expressly subscribed to the ÖCGK since its shares were listed. AT S Austria Technologie Systemtechnik Aktiengesellschaft (ATS) declares its adherence to the Austrian Corporate Governance Code (ÖCGK) as amended in January 2015, and submits this corporate governance report in accordance with Section 243b Austrian Business Code (UGB). This report also forms part of the Annual Report for the financial year 2015/16. It is also available on the company's website, www.ats.net, under Company – Corporate Governance – Reports. With the following declarations of undertaking, ATS complies as of 31 March 2016 with the provisions of the Code as amended in January 2015: C-RULE 18A Internal Audit conducts regular group-wide reviews based on an audit plan approved by the Audit Committee, which includes measures to fight corruption in the Group. It reports to the Audit Commit- tee on this matter regularly and also if warranted by particular events. C-RULES 27–28A AND ALL RELATED PROVISIONS These rules were amended in the course of the review of the ÖCGK in December 2009 and came into force on 1 January 2010. Rules 27, 27a and 28 con- tained in the version of January 2010 only apply to contracts concluded after 31 December 2009. C-rules 27- 28a were therefore not applicable with respect to the original agreement appointing Heinz Moitzi to the Management Board and were also not applied in full when that agreement was extended in 2013. Due to the short period between the most recent revision of the Austrian Corporate Governance Code and the appoint- ment of Andreas Gerstenmayer as Chairman of the Management Board in mid-December 2009, and in order to avoid any departure from the remuneration regulations applicable to the appointment of Mr Moitzi, the new rules were not taken into account when the agreement with Andreas Gerstenmayer was signed in Janu- ary 2010, nor when his Management Board appointment was renewed in 2013. This was not considered necessary because the Group’s stock option scheme had already expired (see below). Furthermore, the Man- agement Board and Supervisory Board work closely together on the long-term development of the Group. The Supervisory Board and the Nomination and Remuneration Committee also regularly analyse the broader Principles and Corporate Governance Declaration
  • 37.
    33Corporate Governance ReportCorporateGovernance Report 9 long-term orientation of Management Board remuneration. The following deviations from the rules currently require explanation: The Group's now-expired stock option scheme did not require the beneficiaries to hold shares in the Group, and provided only for a vesting period of two years before a part of the options acquired could be exercised. The stock option scheme in question has expired, with the last allocation having been made on 1 April 2012. Options granted under this scheme may still be exercised until 31 March 2017. After extensive planning, a long-term incentive (LTI) programme for the Management Board and key staff was implemented by resolution of the Supervisory Board on 3 July 2014 as a replacement for the stock option scheme that expired with the last distribution on 1 April 2012. The new programme is based on stock appre- ciation rights (SAR). The Management Board and Supervisory Board also work continuously to raise the performance of ATS Group still further with respect to non-financial targets. However, in order to maintain the transparency and traceability of target achievement as it relates to variable long-term remuneration, no fixed non-financial criteria for remuneration under the long-term incentive programme are stipulated. Details of this long-term incentive programme can be found in the section on Management Board remuneration. The variable remuneration of the Management Board in financial year 2015/16 (not in the form of stock options and SAR), which was accounted for in total remuneration and for which provisions have been estab- lished until payout in financial year 2016/17, was dependent on the achievement of three performance indi- cators defined in the budget for the respective financial year: return on capital employed (ROCE), cash earn- ings, each with a 45% weighting, and the innovation revenue rate (IRR), with a 10% weighting. The basic prerequisite for awarding this variable remuneration is positive EBIT for the Group as a whole for the financial year and attainment of the target EBIT for the Group as a whole by at least 70% (the hurdle rate). If these key performance indicators are exceeded, bonuses are restricted to a maximum of 200% of the annual bonus set out in the contract of employment. The inclusion of IRR is of major importance in giving variable remu- neration a long-term focus because innovation strength – the development of new technologies, products or product types – is a crucial factor for the future business success of the Group. It can also be reliably measured. IRR represents the share of total revenue generated from technologically innovative products introduced in the past three years. The three-year reference period provides a long-term component of variable remuneration. Management Board members are contractually entitled to termination benefits in accordance with the Sala- ried Employees Act (AngG), applied mutatis mutandis (“old system for severance pay”), if their appointments are terminated. In the event of premature termination of a Management Board member's appointment by the respective board member for reasonable cause, or where the function becomes obsolete for legal rea- sons, remuneration is payable until the end of the appointment contract, and not necessarily for a maximum of two years. Where a Management Board member resigns their appointment or is removed from office for severe breach of duty, and in the event of death, payment of salary ceases at the end of the applicable month. Subject to termination provisions in accordance with the Salaried Employees Act, compensation payments in the case of premature termination of Management Board appointments, even if without good cause, could exceed more than two years' total remuneration in exceptional cases.
  • 38.
    34 ATS AnnualReport 2015/16 As a collective executive body, the Management Board is jointly responsible for the management of the company. Each member of the Management Board is also responsible for defined areas of the business, in addition to their collective responsibility. Management Board members have a duty to keep each other in- formed of all important business events and transactions. Fundamental issues of business policy and major decisions require a joint decision by all Management Board members. Meetings of the Management Board are characterised by a culture of open discussion. If unanimous agreement is not reached on such decisions, the Chairman of the Supervisory Board must be informed without delay. The Supervisory Board must also be informed of all proposed decisions with far-reaching consequences. The Management Board is required to obtain the prior consent of the Supervisory Board for business transactions as stipulated by law and the Articles of Association or rules and procedures issued by the Supervisory Board to the Management Board. Internal Audit reports directly to the Management Board. The audit plan and any material outcomes must be reported to the Audit Committee of the Supervisory Board at least once a year. The rules and procedures of ATS's Management Board require the Board to meet at least once a month. In the past financial year there were a total of 24 Management Board meetings. Written minutes of all Board meetings and decisions are required. As at 31 March 2016 and during the entire reporting period, the Management Board of ATS was composed of Andreas Gerstenmayer as Chairman (CEO), Karl Asamer as Deputy Chairman and Chief Financial Officer (CFO) and Heinz Moitzi as Chief Operating Officer (COO). In addition to the statutory collective responsibility, functional responsibility is allocated to the members of the Management Board as follows: a) Andreas Gerstenmayer is Chairman of the Management Board (CEO) and responsible for:  Sales and Marketing  Human Resources  Investor Relations, Public Relations and Internal Communications  Business Development Strategy  Compliance  CSR Sustainability b) Karl Asamer is Deputy Chairman of the Management Board with responsibility as CFO for:  Finance and Accounting, Treasury  Controlling  Legal Affairs, Risk Management and Internal Audit  IT and Organisation  Procurement c) Heinz Moitzi is COO, with responsibility for:  Research Development (RD)  Operations  Quality Management  Business Process Excellence  Environment  Safety ATS AG Management Board
  • 39.
    35Corporate Governance ReportCorporateGovernance Report 11 Andreas Gerstenmayer was born on 18 February 1965 and is a German citizen. He is a graduate of the Production Engineering programme at Rosenheim University of Applied Sciences. In 1990, he joined Siemens in Germany, working first in lighting, and then hold- ing various management positions in the Siemens Group. In 2003, he was appointed Managing Director of Siemens Transportation Systems GmbH Austria and CEO of the Drive Technology business unit in Graz (global headquarters). He was first appointed to the Management Board on 1 February 2010 and his current term ends on 31 January 2018. Mr Gerstenmayer holds no supervisory board memberships or similar positions in other companies in Austria or abroad that are not included in the consolidated financial statements. On 26 January 2012, the Provincial Government of Styria passed a resolution appointing Mr Gerstenmayer to the advisory committee of the Styrian Research Council (Forschungsrat Steiermark). Karl Asamer was born on 19 January 1970. He has a degree in business administration from Johannes Kepler University in Linz. Before joining ATS, he worked for the Geka Group in Bechhofen, Germany, where he was managing partner. Prior to that, his respon- sibilities included financial management at Sell GmbH, the leading manufacturer of air- craft galleys for wide-body aircraft, and Magna Closures Europe, a division of automotive components supplier Magna. Mr Asamer is managing partner of Asamer GmbH, located in Ansbach, Germany. He became a member of the Management Board of ATS on 1 April 2014. His current term ends on 31 March 2017. Mr Asamer holds no supervisory board memberships or similar positions in other companies in Austria or abroad that are not included in the consolidated financial statements. Heinz Moitzi, born on 5 July 1956, studied electrical installation with Stadtwerke Juden- burg (Judenburg municipal utility company) from 1971 to 1975. From 1976 to 1981 he attended the Austrian higher technical college (HTBL), where he completed his certificate in electrical engineering. In 1981 he was a measurement engineer at the Leoben Universi- ty of Mining and Metallurgy. Mr Moitzi has been with ATS since 1981, first as head of the mechanics and electroplating department, then as production and plant manager at Leoben-Hinterberg. From 2001 to 2004 he was project leader and COO of ATS in Shang- hai. Upon his return, he assumed the position of Vice President of Production. He was first appointed to the Management Board on 1 April 2005, and his current term ends on 31 March 2018. Mr Moitzi holds no supervisory board memberships or similar positions in other companies in Austria or abroad that are not included in the consolidated financial statements.
  • 40.
    36 ATS AnnualReport 2015/1612 ATS Annual Report 2015/16 ATS AG Supervisory Board Date of birth Date of first appointment End of current appointment Independent according to ÖCGK rule Hannes Androsch 18.04.1938 30.09.19951) 26th AGM 2020 - Willibald Dörflinger 20.05.1950 05.07.2005 26th AGM 2020 53, 54 Regina Prehofer 02.08.1956 07.07.2011 22nd AGM 2016 53, 54 Karl Fink 22.08.1945 05.07.2005 26th AGM 2020 53, 54 Albert Hochleitner 04.07.1940 05.07.2005 26th AGM 2020 53, 54 Gerhard Pichler 30.05.1948 02.07.2009 25th AGM 2019 53 Georg Riedl 30.10.1959 28.05.1999 22nd AGM 2016 53 Karin Schaupp 23.01.1950 07.07.2011 22nd AGM 2016 53, 54 Wolfgang Fleck 15.06.1962 03.09.20082) n.a. Sabine Fussi 12.10.1969 14.09.20112) n.a. Franz Katzbeck 11.02.1964 15.10.20132) 3) resigned3) n.a. Siegfried Trauch 30.08.1960 28.01.20162) 3) n.a. Günther Wölfler 21.10.1960 10.06.20092) n.a. 1) ATS was originally established as a private limited company (GmbH). The shareholders' meeting of 23 June 1995 passed a resolution to change the company into a public limited company (AG), and appointed Supervisory Board members including Hannes Androsch. The AG was registered in the Register of Companies on 30 September 1995. 2) Appointed by the Works Council; date of first appointment in this case is either the date of the first Supervisory Board meeting attended or the date of notifica- tion to the Supervisory Board of the appointment. 3) Siegfried Trauch was appointed to the Supervisory Board by the Works Council effective 28 January 2016, replacing Franz Katzbeck. The Supervisory Board monitors and supervises Management, and is responsible for decisions that are of fundamental importance to, or involve the strategic focus of, the Group. Throughout the financial year from 1 April 2015 to 31 March 2016, the Supervisory Board received written and oral reports from the Management Board on the Group's policies and performance, and was closely involved in all business issues. The Supervisory Board met five times during the financial year 2015/16, with the participation of the Management Board. In these meetings, the Management Board and the Supervisory Board discussed the economic position of ATS Group in depth. As part of the Group's ongoing reporting process and at all board meetings, the Man- agement Board gave the Supervisory Board comprehensive reports on the Group's operating and financial position, and on its investments in other companies, the staff situation and planned capital expenditures. In- depth discussions focused primarily on debt financing, progress on the entry into the IC substrate market and the associated qualification for production and ramp-up of serial production, as well as the further expansion and strategic direction of new site in Chongqing, China, and the Group as a whole. ATS's commitment to the principles of good governance is reflected in the open discussions that take place within and between the Management Board and the Supervisory Board. In the financial year 2015/16, the Supervisory Board again carried out its annual self-evaluation to ensure the continuing improvement of its working practices and the fulfilment of its responsibilities to the shareholders and other stakeholders. The annual evaluation carried out by the Supervisory Board confirmed that its regular practices meet the re- quirements of the Austrian Stock Corporation Act and the Austrian Corporate Governance Code (ÖCGK), and that its organisation, work practices and orientation in the interest of the shareholders and all other stake- holders are effective. The self-evaluation will continue to constitute an important component of the Supervi- sory Board's critical review of its own activities. ATS AG Supervisory Board
  • 41.
    37Corporate Governance ReportCorporateGovernance Report 13 COMPOSITION SHAREHOLDER REPRESENTATIVES Hannes Androsch, Chairman of the Supervisory Board, was first appointed on 30 September 1995. His cur- rent appointment runs until the 26th Annual General Meeting in 2020. Mr Androsch is an industrialist who, from 1970 to 1981, was Austrian Federal Minister of Finance. Between 1976 and 1981 he was also Vice Chancellor of the Republic of Austria. From July 1981 until 1988 he was Managing Director of Creditanstalt-Bankverein. In 1994, together with Willibald Dörflinger and Helmut Zoidl, he carried out a management buyout of ATS. Hannes Androsch holds interests in a number of well-known Austrian businesses. Willibald Dörflinger, First Deputy Chairman of the Supervisory Board, was initially appointed to the Board on 5 July 2005. His current appointment runs until the 26th Annual General Meeting in 2020. Mr Dörflinger began his professional career in 1972 at M. Schmid Söhne, before moving to Honesta, Holz- und Kunststoffwarenindustrie in 1974. In 1978 he became head of technical procurement at EUMIG Elektri- zitäts- und Metallwaren Industrie GesmbH; from 1980 he was head of the department for circuit boards and surface technology, and Managing Director from 1986 to 1990. From 1990 to 1994 Mr Dörflinger was Managing Director of ATS as well as of EUMIG Fohnsdorf Industrie GmbH. In 1994 he joined Hannes Androsch and Helmut Zoidl in the management buyout of ATS. Until 2005, he served first as Managing Partner, then became a member and finally Chairman of the Management Board. In 2005 he joined ATS's Supervisory Board. Other supervisory board or similar positions held by Mr Dörflinger at listed companies:  HWA AG Regina Prehofer, Second Deputy Chairwoman of the Supervisory Board, was first appointed to the Board on 7 July 2011. Her current appointment runs until the 22nd Annual General Meeting in 2016. Ms Prehofer studied commerce and law in Vienna. She started her career in 1981 at Österreichische Kontrollbank. In 1987 she joined Creditanstalt, where she held various managerial positions in the bank's corporate customer segment. In 2003 she was appointed to the Management Board of Bank Austria Creditanstalt AG, where she was responsible for corporate customers and Eastern European markets. From 2006 to 2008 she was CEO of UniCredit Global Leasing, in addition to her Management Board responsibilities in Austria. This appointment gave her overall responsibility for UniCredit Group's leasing operations. In Sep- tember 2008 she moved to the Management Board of BAWAG P.S.K. where she headed the bank's retail and corporate customer activities. From 2011 to 2015 she was Vice Rector with responsibility for finance and infrastructure at the Vienna University of Economics and Business Administration. Other supervisory board or similar positions held by Ms Prehofer in listed companies:  Wienerberger AG (Chairwoman of Supervisory Board since December 2013) Karl Fink was first appointed on 5 July 2005. His current appointment runs until the 26th Annual General Meeting in 2020. Mr Fink graduated in business studies from the Vienna University of Economics and Business in 1971. From 1971 to 1975 he worked for Marubeni Corporation in international commodities trading before moving to Wiener Städtische Wechselseitige Versicherungsanstalt in Vienna. Between 1979 and 1987 he was Chairman of the Management Board of Interrisk - Internationale Versicherungs-Aktiengesellschaft. In 1987 he became a member of the Management Board of Wiener Städtische Allgemeine Versicherungs AG and Deputy Managing
  • 42.
    38 ATS AnnualReport 2015/1614 ATS Annual Report 2015/16 Director in July 2004. In October 2007 he was appointed Managing Director of Wiener Städtische Versicher- ung AG, Vienna Insurance Group. Mr Fink retired from the Vienna Insurance Group Managing Board on 30 September 2009. He is a member of the Management Board of Wiener Städtische Versicherungsverein, the principal shareholder in Vienna Insurance Group, holds a number of supervisory positions and consultative positions within that Group. He is also honorary consul of Montenegro. Albert Hochleitner was first appointed on 5 July 2005. His current appointment runs until the 26th Annual General Meeting in 2020. Mr Hochleitner completed his studies in engineering physics at Vienna University of Technology in 1965. In the same year, he joined the Siemens Group's low voltage works in Vienna. In 1984 he was appointed Chair- man of the Management Board of Uher AG. In 1988 he joined Siemens AG, where he was head of the electric motors business in the automotive technology sector based in Wurzburg. In October 1992 he became a member of the Management Board of Siemens AG Austria. From 1994 he was Chairman of the Management Board, before becoming a member of the Supervisory Board of Siemens AG in 2005, which he left in 2010 because of reaching the applicable age limit for members of the Supervisory Board. Gerhard Pichler was first appointed on 2 July 2009. His current appointment runs until the 25th Annual Gen- eral Meeting in 2019. Mr Pichler studied business administration at the Vienna University of Economics and Business. A certified auditor and tax adviser, he has been Managing Director of CONSULTATIO Wirtschaftsprüfungsgesellschaft m.b.H. since 1986, and Managing Partner of the Group since 1995. Georg Riedl was first appointed on 28 May 1999. His current appointment runs until the 22nd Annual General Meeting in 2016. Mr Riedl acquired his doctorate in law in 1984 from the University of Vienna. In 1991 he commenced inde- pendent practice at Riedl Ringhofer. He has been in independent practice since 2013 at the law office of Frotz Riedl Rechtsanwälte. He specialises in business, commercial, corporate, foundation and tax law, mer- gers and acquisitions, and contract law. Other Supervisory Board or similar positions held by Mr Riedl in listed companies:  VIENNA INSURANCE GROUP AG Wiener Versicherung Gruppe Karin Schaupp was first appointed on 7 July 2011. Her current appointment runs until the 22nd Annual Gen- eral Meeting in 2016. Ms Schaupp earned her doctorate at the Karl Franzens University in Graz in 1978 and began her career as a university research assistant at the Institute of Pharmaceutical Chemistry. In 1980 she started her career in industry as Head of Analytics at Leopold Pharma GmbH. After holding various research, development and product management posts in the international pharmaceuticals industry she was appointed CEO of Frese- nius Kabi Austria GmbH in 1997. In 1999 she became regional manager for Austria and Southeastern Europe. In 2000 she was appointed to the management board of Fresenius Kabi AG, Bad Homburg, with responsibility for worldwide operations. She has been an independent consultant since 2003, with a focus on strategic business development and innovation transfer. Other Supervisory Board or similar positions held by Ms Schaupp at listed companies:  BDI – BioEnergy International AG
  • 43.
    39Corporate Governance ReportCorporateGovernance Report 15 EMPLOYEE REPRESENTATIVES Employee participation in supervisory boards and their committees is mandated by law, and forms part of the Austrian corporate governance system. Employee representatives are entitled to delegate one representative as a Supervisory Board member for every two Supervisory Board members elected by the General Meeting. If there is an odd number of shareholders' representatives, the number of employee representatives is rounded up. This one-third representation also applies to all Supervisory Board committees, with the exception of meetings and votes concerning the relationship between the company and its management board members. Resolutions appointing or dismissing a management board member and the granting of stock options in the company are also excepted. The Group Works Council meets regularly with the Management Board. These meetings facilitate the exchange of information on developments in the Group which have a direct bearing on employees. Wolfgang Fleck, Sabine Fussi, Franz Katzbeck and Günther Wölfler have been appointed to the Supervisory Board by the Works Council. Effective 28 January 2016, Siegfried Trauch was appointed by the Works Council to the Supervisory Board, replacing Franz Katzbeck. Thus, Franz Katzbeck resigned from the Supervisory Board on this date. Additional information on the Supervisory Board and its composition is available online at www.ats.net/company/supervisory-board/. INDEPENDENCE OF SUPERVISORY BOARD MEMBERS The ÖCGK specifies that the majority of Supervisory Board members representing the shareholders must be independent. In accordance with C Rule 53, the Supervisory Board has established the following criteria to be used in determining the independence of its members. Supervisory Board members are to be regarded as independent if they have no business or personal relationships with the Company or its Management Board which could be cause for material con- flicts of interest and therefore liable to influence the behaviour of the member in question. The following criteria are applied in determining the independence of Supervisory Board members:  The Supervisory Board member was neither a member of the Management Board nor a senior manager of the Company or one of its subsidiaries in the past five years.  The Supervisory Board member neither had during the last financial year nor currently has a business relationship with the Group or any of its subsidiaries of material significance to that member. This also ap- plies to business relationships between ATS Group and enterprises in which the Supervisory Board mem- ber has a significant economic interest.  During the last three years, the Supervisory Board member was neither a statutory auditor of the Group, nor a person with an interest in the audit firm, nor an employee of any such firm.  The Supervisory Board member is not a member of a management board of another company where a member of ATS's Management Board is a member of that company's Supervisory Board.  The Supervisory Board member has not been a member of the Supervisory Board for longer than 15 years. This does not apply to Supervisory Board members who are shareholders with entrepreneurial interests in the Group, or who represent the interests of such shareholders.  The Supervisory Board member is not a close family relative (direct descendant, spouse, life partner, par- ent, uncle, aunt, sibling, nephew or niece) of a Management Board member or of any person in a position described in the foregoing points. In the meeting of 17 March 2016, the members of the Supervisory Board representing shareholder interests each declared whether they were independent as determined by the above criteria. Seven of the eight mem- bers of the ATS AG Supervisory Board representing shareholder interests declared that they were inde- pendent. Mr Androsch declared that he was not independent. C Rule 54 specifies that for companies with a free float in excess of 50%, at least two Supervisory Board members who are independent should also not be shareholders with interests in excess of 10%, or
  • 44.
    40 ATS AnnualReport 2015/1616 ATS Annual Report 2015/16 representatives of such interests. Five of the eight Supervisory Board members representing the shareholders – Regina Prehofer, Karin Schaupp, Willibald Dörflinger, Karl Fink and Albert Hochleitner – declared themselves independent within the meaning of this rule. DIVERSITY Expertise and management experience are vital considerations when selecting members of the Supervisory Board. Diversity is also a consideration in its composition. Three members of the Supervisory Board are women, representing a proportion of female members of 25% – significantly above the Austrian average. The age of Supervisory Board members ranges from 46 to 78. All members of the Supervisory Board representing shareholder interests have extensive experience in international business. AGREEMENTS REQUIRING APPROVAL In connection with various projects, the Group obtained the services from consulting companies where the Chairman of the Supervisory Board Hannes Androsch, as member of the Management Board, has full authority to act on behalf of the company (AIC Androsch Interna- tional Management Consulting GmbH) and where the First Deputy Chairman of the Supervisory Board Wil- libald Dörflinger, as Managing Director, has full authority to act on behalf of the company (Dörflinger Man- agement Beteiligungs GmbH). The Group obtained legal services from Frotz Riedl Rechtsanwälte, where member of the Supervisory Board Georg Riedl works as an independent attorney. € in thousands 2015/16 2014/15 AIC Androsch International Management Consulting GmbH 395 380 Dörflinger Management Beteiligungs GmbH 5 8 Frotz Riedl Rechtsanwälte - 3 Total 400 391 COMMITTEES In order to provide effective support and to properly address complex technical matters, the Supervisory Board has established two permanent committees for in-depth analysis of particular issues and regular reporting to the Supervisory Board. In the financial year 2014/15, the Supervisory Board also established a Project Committee to review matters related to debt financing. This committee continued its mandate in financial year 2015/16 and was discontinued upon resolution of these matters. AUDIT COMMITTEE In the financial year under review, the Audit Committee comprised:  Regina Prehofer (Chairwoman)  Gerhard Pichler (finance expert)  Georg Riedl  Wolfgang Fleck  Günther Wölfler These members were confirmed in the extraordinary (constitutive) meeting of the Supervisory Board that took place in connection with this after the Annual General Meeting on 9 July 2015. The Audit Committee monitors the accounting process and the work of the statutory auditor, monitors and reviews the statutory auditor's independence, reviews the preparation and audit of the annual financial statements, and reviews the proposed distribution of profits, the Management Report and the Corporate Governance Report. The Committee is responsible for reporting on the results of its reviews to the Super- visory Board. The Audit Committee also carries out preparatory work for the Supervisory Board on all issues in connection with the audit of the consolidated financial statements, consolidated management report and the consolidated accounting process. It also submits a proposal for the appointment of the statutory auditors and reports on this matter to the Supervisory Board. The Audit Committee is responsible for monitoring the effectiveness of the Group-wide internal control system and, where appropriate, the Group’s internal audit
  • 45.
    41Corporate Governance ReportCorporateGovernance Report 17 and risk management systems. The Audit Committee convened twice in the last financial year. Its activities focused primarily on the discussion and review of the annual and consolidated annual financial statements for the year ended 31 March 2015, the planning and preparation for the audit of the annual and consolidated annual financial statements for the financial year 2015/16, and the discussion of the risk management, inter- nal control and internal audit systems. The chairwoman of the Audit Committee was also involved in the quarterly reporting in the financial year 2015/16. NOMINATION AND REMUNERATION COMMITTEE Until 9 July 2015, this committee comprised:  Hannes Androsch (Chairman)  Karl Fink  Albert Hochleitner  Wolfgang Fleck  Günther Wölfler Since the election in the extraordinary (constitutive) meeting of the Supervisory Board that took place after the Annual General Meeting on 9 July 2015, the Nomination andRemuneration Committee comprised the following members:  Hannes Androsch (Chairman)  Willibald Dörflinger (Deputy Chairman)  Georg Riedl  Wolfgang Fleck  Günther Wölfler The Nomination and Remuneration Committee submits proposals to the Supervisory Board for appointments to fill vacancies on the Management Board whenever necessary. It deals with succession planning issues and the remuneration of Management Board members. The committee met three times for these purposes in the financial year 2015/16. The Nomination and Remuneration Committee is authorised to make decisions in urgent cases. All of the commit- tee members representing shareholders possess knowledge of and experience in the area of remuneration policies. PROJECT COMMITTEE In financial year 2014/15, the Supervisory Board – in connection with a policy resolution of the same date concerning the implementation of various measures for debt financing – resolved under Section 17 of the Articles of Association to create a Project Committee made up of Supervisory Board members to oversee further progress, including giving approval for implementation of the relevant transac- tions. The Project Committee comprised the following members:  Hannes Androsch (Chairman)  Willibald Dörflinger  Regina Prehofer  Wolfgang Fleck  Günther Wölfler The Project Committee was authorised by the Supervisory Board to provide all further approvals required for issuing bonds, or assuming another form of debt, and the precise terms and conditions with respect to this. The Project Committee, which was formed on 19 March 2015, and thus at the end of the financial year, met once during the financial year 2015/16, with all committee members taking part, and dissolved on 24 Sep- tember 2015 after the Supervisory Board passed a resolution approving a number of debt financing measures as requested by the Management Board with the support of the Project Committee. Subsequently, matters of financing were discussed solely by the full Supervisory Board.
  • 47.
    43Corporate Governance Report CorporateGovernance Report 19 The following report presents the remuneration of ATS's Management and Supervisory Board members. It should be read in conjunction with the explanations in the notes to the 2015/16 annual and consolidated financial statements. MANAGEMENT BOARD REMUNERATION Total remuneration paid to members of the Management Board in the financial year: Financial year 2015/16 Financial year 2014/15 € in thousands Fixed Variable Total Fixed Variable Total Andreas Gerstenmayer 430 457 887 429 506 935 Karl Asamer 376 277 653 3741) 301 675 Heinz Moitzi 360 289 649 359 361 720 Total 1,166 1,023 2,189 1,162 1,168 2,330 1) Last year’s figure was slightly adjusted for a proportionate 13th and 14th salary, based on the assignment as of 1 April 2014. The fixed element represented 48.48% of Mr Gerstenmayer's total remuneration, and the variable element 51.52%. The fixed element represented 57.58% of Mr Asamer's total remuneration, and the variable element 42.42%. The fixed element represented 55.47% of Mr Moitzi's total remuneration, and the variable element 44.53%. For the Management Board as a whole, the fixed element represented 53.27% of total remunera- tion, and the variable element 46.73% in the financial year 2015/16. The stock option based system of Management Board remuneration at ATS is based on the Stock Option Scheme 2009-2012, in which allocations were made from 1 April 2009 to 1 April 2012. The number of stock options allocated to members of the Management Board was as follows: Allocated on 1 April of every year Total 2012 2011 2010 2009 Andreas Gerstenmayer 120,000 40,000 40,000 40,000 – Heinz Moitzi 120,000 30,000 30,000 30,000 30,000 Exercise Price (€) 9.86 16.60 7.45 3.86 The options granted may be exercised in tranches: up to 20% after two years, up to an additional 30% after three years, and up to an additional 50% after four years (from the allotment date). Stock options may be exercised in whole or in part after completion of the vesting period, although not during a restricted period. Allotted options not exercised within five years of the date of granting expire without compensation. If the end of the five-year period falls within a restricted period, however, the restricted period will interrupt that five-year period. Options can be exercised again after the restricted period for the length of time the inter- ruption occurred. The five-year period is extended in this special case. Options not exercised by the end of any five-year period extended in this manner become invalid and lapse without compensation. The stock option scheme in question ended with the last allotment made on 1 April 2012. Options allotted on 1 April 2012 and not yet exercised (see Directors' holdings and dealings, including changes in the financial year 2015/16) may still be exercised until 31 March 2017. By resolution of the Supervisory Board on 3 July 2014, a long-term incentive (LTI) programme for the Man- agement Board and key staff was implemented as a replacement for the stock option scheme that expired with the last distribution on 1 April 2012. The new programme is based on stock appreciation rights (SAR). SAR are rights to appreciation in value based on share performance over a defined period of time. As with Remuneration Report: Management and Supervisory Boards
  • 48.
    44 ATS AnnualReport 2015/1620 ATS Annual Report 2015/16 stock options, but without a granting of actual shares or an option for such granting, the recipient receives financial remuneration only if the performance of the share price is positive. In particular, the conditions include long-term and multiple-year performance criteria, a minimum vesting period of three years (with a subsequent exercise period of no more than two years), a minimum own investment by the recipient, and an upper limit on the potential financial benefits.  Earnings per share (EPS) determines how many of the SAR allotted may actually be exercised once the vesting period ends. The EPS established by the medium-term plan for the reporting date of the third year following the allotment applies as the target. If, at the end of the vesting period, less than 50% of the EPS target has been achieved, the allotted SAR are forfeited. If 100% or more of the EPS target has been achieved at the end of the vesting period, all of the allotted SAR may be exercised. If achievement of the target is between 50% and 100%, the allotted SAR may be exercised in linear proportion to the percentage achieved.  Own investment is a mandatory prerequisite for exercising SAR. The own investment is made by purchasing shares corresponding to 20% of the total allotment amount in SAR for a given year (e.g. for an allotment of 5,000 SAR, the own investment is 1,000 shares). If the own investment has not been made in full by the end of the vesting period (after three years), SAR are forfeited in a corresponding amount. The own in- vestment must be held for the entire period of participation in the LTI programme.  The exercise price is determined on the allotment date and is equal to the average closing price of ATS shares on the Vienna Stock Exchange during the six months preceding the respective allotment date.  The performance of the share price determines the amount of the LTI awarded to the recipient: The differ- ence between the exercise price of the relevant virtual allotment and the closing price of the ATS share on the Vienna Stock Exchange on the exercise date is multiplied by the number of SAR. There are no pre- miums on the exercise price and payouts are made in cash. In the event of extraordinary positive perfor- mance, the payout amount per SAR is limited to the amount represented by 200% of the respective exer- cise price. (Example: for an exercise price of € 8.00, the maximum value per SAR is € 16.00, which means that any share closing price above € 24.00 produces no associated increase in the value per SAR.) In this LTI Programme for 2014 – 2016, three allotment tranches were possible between 1 April 2014 and 1 April 2016. To date, the following number of SAR has been allotted to members of the Management Board at the exercise price indicated: Allocated on 1 April of each year Total 2015 2014 Andreas Gerstenmayer 80,000 40,000 40,000 Karl Asamer 60,000 30,000 30,000 Heinz Moitzi 60,000 30,000 30,000 Exercise Price (€) 10.70 7.68 The variable remuneration of the Management Board in financial year 2015/16 (not in the form of stock options and SAR), which was accounted for in total remuneration and for which provisions have been estab- lished until payout in financial year 2016/17, was dependent on the achievement of three performance indi- cators defined in the budget for the respective financial year: return on capital employed (ROCE), cash earn- ings, each with a 45% weighting, and the innovation revenue rate (IRR), with a 10% weighting. The basic prerequisite for awarding this variable remuneration is positive EBIT for the Group as a whole for the financial year and the attainment of the target EBIT for the Group as a whole by at least 70% (the hurdle rate). If these key performance indicators are exceeded, bonuses are restricted to a maximum of 200% of the annual bonus set out in the contract of employment. The inclusion of IRR is of major importance in giving variable remuneration a long-term focus. Innovative strength – the development of new technologies, products or
  • 49.
    45Corporate Governance Report CorporateGovernance Report 21 product types – is a crucial factor for the future business success of the Group. It can also be reliably meas- ured: IRR represents the share of total revenue generated by technologically innovative products introduced in the past three years. The three-year reference period provides a long-term component of variable remu- neration. Management Board members are contractually entitled to termination benefits in accordance with the Salaried Employees Act (AngG), applied mutatis mutandis (“old system for severance pay”), if their ap- pointments are terminated. In the event of premature termination initiated by a Management Board mem- ber for reasonable cause, or if the function is eliminated for legal reasons, remuneration is payable until the end of the appointment contract. Where a Management Board member resigns the appointment or is re- moved from office for severe breach of duty, and in the event of death, payment of salary ceases at the end of the applicable month. There are no other rights or entitlements arising from the termination of appoint- ments. Mr Gerstenmayer and Mr Moitzi have pension entitlements in the form of defined benefit or defined contri- bution plans agreed individually. For Andreas Gerstenmayer, a contribution of 10% of monthly gross salary is paid into a pension fund. Mr Moitzi's pension entitlement is 1.2% of his most recent salary for each year of service, up to a maximum of 40%. The amount of the occupational pension is based on the capital accumu- lated in the pension fund; the annuitisation is determined by the pension fund's rules. Members of the Management Board are entitled to a company car (the respective non-monetary taxable remuneration is considered when calculating the net salary), and are covered by accident insurance. Health insurance is limited to what is provided under the Austrian statutory social security system. SUPERVISORY BOARD REMUNERATION Remuneration for the members of the Supervisory Board is de- termined retrospectively for the past financial year by means of a resolution at the Annual General Meeting. Remuneration paid to members of the Supervisory Board in the financial year 2015/16 for the previous finan- cial year was in accordance with the resolution passed at the 21st Annual General Meeting of 9 July 2015. in € Member Fixed fee Committee fee Variable remuneration Attendance fee Total Hannes Androsch 30,000 3,000 18,700 2,400 54,100 Willibald Dörflinger 25,000 – 9,350 2,400 36,750 Regina Prehofer 20,000 3,000 9,350 2,000 34,350 Karl Fink 20,000 2,000 9,350 2,000 33,350 Albert Hochleitner 20,000 2,000 9,350 2,400 33,750 Gerhard Pichler 20,000 2,000 9,350 2,400 33,750 Georg Riedl 20,000 2,000 9,350 2,400 33,750 Karin Schaupp 20,000 – 9,350 2,000 31,350 Total 175,000 14,000 84,150 18,000 291,150 The Chairman of the Supervisory Board receives fixed remuneration of € 30,000 per financial year, the First Deputy Chairman € 25,000 and all other elected members € 20,000. Chairmanship of a standing committee (Nomination and Remuneration Committee, Audit Committee) is remunerated with a fixed amount of € 3,000 per financial year, and membership of a standing committee with € 2,000. The attendance fee is € 400 per Supervisory Board meeting and all cash expenses are reimbursed. Members of the Supervisory Board also receive variable remuneration based on the short-term achievement of defined targets for the performance indicators cash earnings (with a weighting of 45%), ROCE (return on capital employed; also with a weighting of 45%) and the innovation revenue rate (IRR) with a weighting of 10%. If the targets are achieved 100%, the Chairman receives € 10,000 and other members € 5,000. If the key performance indicators for ROCE, Cash
  • 50.
    46 ATS AnnualReport 2015/1622 ATS Annual Report 2015/16 Earnings and IRR are exceeded, variable remuneration of a maximum of 200% of the base described above is paid. Members of the Supervisory Board do not receive stock options in the Group. Since the targets estab- lished for variable remuneration in the budget for financial year 2014/15 were achieved, variable remunera- tion accrued for that year and was subsequently paid out in accordance with the resolution by the 21 st Annual General Meeting of 9 July 2015. The employee representatives perform their duties on the Supervisory Board voluntarily and therefore re- ceive no separate remuneration for their position. DIRECTORS AND OFFICERS LIABILITY INSURANCE (DO INSURANCE) The DO insurance at ATS covers all past, present and future members of the Company's and its subsidiaries' managing and supervisory bodies and selected other senior staff. The insurance covers court and all other costs of defence against unwarranted claims, together with the satisfaction of warranted claims for pure financial loss arising from breaches of duty by the insured in their managerial or supervisory activities. The insurance provides global cover and the annual premium is paid by ATS.
  • 51.
    47Corporate Governance Report CorporateGovernance Report 23 The members of the Supervisory Board and the Management Board have voluntarily undertaken to disclose publicly the number of shares in AT S Austria Technologie Systemtechnik Aktiengesellschaft held by them. The holdings of individuals with close personal relationships with members of the Supervisory Board or Management Board are not disclosed. Shares Options (Stock Option Scheme) As of 31 Mar 2015 Change As of 31 Mar 2016 % capital1) As of 31 Mar 2015 Exercised/ lapsed As of 31 Mar 2016 Andreas Gerstenmayer 10,000 – 10,000 0.03% 80,000 20,000 60,000 Karl Asamer 4,000 5,000 9,000 0.02% – – – Heinz Moitzi 2,786 2,214 5,000 0.01% 60,000 – 60,000 Hannes Androsch 599,699 – 599,699 1.54% – – – Androsch Privatstiftung 6,339,896 – 6,339,896 16.32% – – – Willibald Dörflinger – – – – – – – Dörflinger Privatstiftung 6,902,380 – 6,902,380 17.77% – – – Karl Fink – – – – – – – Albert Hochleitner – – – – – – – Gerhard Pichler 26,768 – 26,768 0.07% – – – Regina Prehofer – – – – – – – Georg Riedl 15,482 – 15,482 0.04% – – – Karin Schaupp – – – – – – – Wolfgang Fleck – – – – – – – Sabine Fussi – – – – – – – Franz Katzbeck – – – – – – – Siegfried Trauch – – – – – – – Günther Wölfler – – – – – – – 1) The indicated number of shares held in AT S Austria Technologie Systemtechnik Aktiengesellschaft includes all direct and indirect investments. Thus, for the Androsch Private Foundation, this information also includes those shares held by AIC Androsch International Management Consulting GmbH, which is owned by the Androsch Private Foundation. For the Dörflinger Private Foundation, it also includes those shares held by Dörflinger Management Beteiligungs GmbH, whose majority owner is the Dörflinger Private Foundation. The individual directors' dealings notifications can be viewed in and downloaded from the FMA Directors' Dealings Database, at https://www.fma.gv.at/en/companies/issuers/directors-dealings/directorsdealings- database.html. Directors’ Holdings Dealings
  • 52.
    48 ATS AnnualReport 2015/1624 ATS Annual Report 2015/16 CODE OF BUSINESS ETHICS AND CONDUCT ATS has established its own code of ethics and conduct, which describes how ATS conducts its business in an ethical and socially responsible way. These principles apply to all ATS's activities worldwide, to all ATS segments, and to all companies that are part of the ATS Group. The ATS Code of Business Ethics and Conduct is based on the ethics standard SA8000. ATS is com- mitted to meeting the requirements of the Electronic Industry Citizenship Coalition (EICC). Integrity and compliance with both legal and ethical principles are essential for maintaining the credibility, trustworthiness and authenticity of the Group. Stricter or more detailed guidelines may be established for specific regions, countries or functions, but they must be consistent with this corporate policy. Under one of the main provi- sions of the Code, ATS does not tolerate any form of discrimination, for example on the basis of gender, age, religion, or ethnic origin, in activities such as recruitment, remuneration and promotion. CAPITAL MARKET COMPLIANCE As a company listed on the Vienna Stock Exchange, ATS acknowledges its responsibility to prevent the abuse of compliance-related information and insider information through appropriate measures and in accordance with applicable laws and regulations. ATS attaches great im- portance to the equal treatment of all investors and the provision of comprehensive information. ATS also complies with laws related to third parties such as customers and suppliers. All employees are therefore required to conduct themselves with due care in this respect. ATS supports the aim of the ÖCGK to raise Austrian and foreign investors' confidence in the Austrian financial market by enhancing transparency and reinforcing standard principles. For the purpose of preventing insider trading and ensuring compliance with other relevant capital market regulations, the Group has adopted a Compliance Code (Corporate Directive Issuer Compliance) that also applies to all Supervisory Board members. The Corporate Directive Issuer Compliance was most recently updated in the financial year 2015/16, and the amended version entered into force on 15 October 2015. These guidelines apply to all companies in the ATS Group, and all employees and governing bodies, includ- ing the Supervisory Board. It applies in particular to certain persons working in sensitive areas and contains detailed instructions, guidelines and aids to ensure compliance with the relevant regulations. ADVANCEMENT OF WOMEN IN SENIOR MANAGEMENT ATS has no explicitly formulated plan for increasing the number of women on the Management or Supervisory Boards or in senior management posi- tions in the Company or its subsidiaries. The selection of candidates to fill open positions is based on the principle of the best possible person for the job – regardless of gender, age, religion or ethnic origin. There are women in various senior management positions at ATS and its subsidiaries. Although no women are represented on the Management Board of ATS, two of the eight members of the ATS Supervisory Board representing shareholder interests and one of the employee representatives are women. At 25%, the proportion of female Supervisory Board members is above the average for Austrian companies. At the end of the financial year, the proportion of female employees at ATS was 35%. The female proportion in Europe at 43% and the United States at 37% are still significantly higher than in Asia, where the proportion of females employed by ATS is 33%. Women constitute 10% of the employees reporting directly to the Management Board of the ATS Group. The Group continues to try to increase female representation at board and senior management level. Proactive efforts are made, particularly when staff return from maternity leave, to ensure that careers and family life are compatible. Management Board Andreas Gerstenmayer m.p. Karl Asamer m.p. Heinz Moitzi m.p. Other codes of conduct
  • 55.
    51Group Management Report TABLEOF CONTENTS 1. Business development   52 1.1. Market and industry   52 1.2. Profit situation   57 1.3. Financial position   61 2. Significant events after the reporting period   68 3. Plants and branch offices   69 4. Business development by segments   70 5. Group   73 5.1. Employees   73 5.2. Sustainability   76 5.3. Research and development   79 6. Risk and opportunities management   81 7. Internal Control and Risk Management System with regard to accounting   86 8. Shareholding structure and disclosures on capital (disclosures according to § 243a Austrian Commercial Code)   87 9. Outlook   89 Group Management Report 2015/16
  • 56.
    52 ATS AnnualReport 2015/1626 ATS Annual Report 2015/16 Over the past two decades, the global market for printed circuit boards has been shaped by the growth of and technological change in the electronics industry in general and, in particular, by end devices such as computers – from servers to desktops and notebooks – in addition to smartphones and tablets. The extraordinary growth rates for smartphones and tablets have slowed considerably, and the market for desktop and notebook computers is declining. The communication and computer segment continue to be the largest buyers of high-end printed circuit boards and substrates. Contrary to the original estimates by Prismark, which projected average growth in 2015 of around 3% in the market for printed circuit boards and substrates year on year, the market recorded an overall decline of around 4%. ATS, however, recorded organic growth of 5.2%. A deciding factor in the market downturn in 2015 was a weak demand in the computer segment and in consumer products. The likewise above-average decline in substrates of 8.9% was directly connected to the contraction of 10% in the computer segment. Based on the most recent estimates by Prismark, average annual market growth between 2015 and 2018 will be around 2%. As a result, the global printed circuit board market would not return to its 2014 volume until 2017. Further reasons for the outlook of low growth for the overall market are the increasing miniaturisation and higher integration in the semiconductor industry as well as the integration of components into substrates and printed circuit boards, which reduces the area needed for these connection platforms. Particularly affected by this are providers in the middle and low-end technology segments. For providers of high-end technologies such as ATS, these broad market forecasts require a more differentiating analysis. The technological development of high-end printed circuit boards and substrates will continue to be driven in the next several years by applications in the communication and computer areas. These segments will con- tinue to influence the architecture of the electronic components they need, including semiconductors, and not only accelerate the already rapid technological development of substrates and printed circuit boards, but also drive the convergence of the technologies they use. According to Moore’s law, the continuous miniaturisation in the semiconductor industry will define the asso- ciated increase in power density – even if, in the future, it is no longer every two years but a longer interval instead. There will be a simultaneous reduction in semiconductor size and miniaturisation in printed circuit boards and substrates, and thus continued growth in HDI and microvia technology. Furthermore, additional miniaturisation potential will emerge through the combination of production processes and materials for high-end printed circuit boards with the processes and technologies from substrate production. With the additional integration of components in substrate and printed circuit boards, measurements in all dimensions will become smaller, as the example in the diagram below illustrates. Business development1. 1.1. Market and industry PCB market US$ in billions Source: Prismark, February 2016 17.4 15.8 15.6 16.3 16.6 15.5 15.6 16.2 16.4 16.8 8.0 7.8 7.7 7.9 7.9 3.4 3.5 3.6 3.8 4.0 3.5 3.5 3.6 3.8 4.0 2.2 2.2 2.3 2.3 2.4 7.6 6.9 6.7 6.9 6.9 57.6 55.3 55.7 57.4 58.6 2014 2015 2016 2017 2018 IC Packaging Aviation/Military Industrial/Medical Automotive Consumer Communication Computer Advanced Package (SiP)/15µ Line/ Space Embedded Interposer 20µ Line/Space Cavity Advanced Package/ SLP/(SiB)/30µ Line/Space Embedded IC-Substrate 10µ Line/Space
  • 57.
    53Group Management ReportGroupManagement Report 27 The opportunities that arise from the intelligent combination of various technologies also mean new growth potential for the printed circuit board industry. Thus the assembly service market, which today is controlled exclusively by electronic manufacturing services and original device manufacturing companies, opens up for manufacturers of high-end printed circuit boards and substrates through embedding technologies, as does the packaging market currently dominated by the semiconductor industry. TRENDS AND TECHNOLOGIES The world is becoming more digital. The driving forces are the availa- ble and nearly omnipresent possibilities for connection, the ever-declining costs of data transmission and sensors, and use of the internet to support communication between electronic devices. As such, society is poised at the start of the Internet of Things (IoT) – a logical technological development based on how internet-connected devices are used to improve the exchange of data, automate complex industrial processes, and generate valuable information. The potential of the Internet of Things as the next big thing is most often assessed based on the growth in devices connected through the internet. However, the latest studies by Yole forecast that the strongest areas of growth in connection with IoT will not be end devices such as wearables and sensors or smartphones and tablets, but rather the necessary infra- structure such as base stations for the transmission of data as well as powerful computers and data centres to process and store the rapidly increasing volume of data. Source: Yole, April 2016 This development will significantly influence further growth of the entire electronics industry in all segments. Servers and storage media show the greatest growth potential in the computer segment, with average annual increases of 5.7% until 2018, end devices in the consumer segment at 5.8%, electronics for automobiles at 7.9%, industrial electronics at 8.0% and the market for medical electronics at 5.4%. A printed circuit board is a connection platform for electrical, electronic and mechanical components. It enables the mechanical attachment and the electrical connection of resistors, capacitors, microprocessors, memory chips, sensors, connectors and many other components that are required for a fully functioning electronic system. Since nearly every electronic device contains one or more printed circuit boards, they are an indispensable part of our daily life. Printed circuit boards consist of electrically insulating carrier material (usually fibreglass mats saturated in epoxy resin) with conductive connections attached to them (normally made of etched copper layers). There are countless types of printed circuit boards, ranging from single-layer to highly complex multilayer models. The complexity of printed circuit boards and the related requirements for the different production processes are determined by several factors. These factors are the number of layers, the vertical connections of the individual layers and their minimum hole diameter, line width and spacing as well as the surface finish. Pro- gressive miniaturisation of electronic components in end devices while simultaneously enlarging their power density increases the requirements for and the complexity of printed circuit boards. For many years, ATS Electronics market by segment US$ in billions Source: Prismark, February 2016 487 467 476 486 506 535 561 586 600 641 154 152 152 165 180186 171 181 192 215129 124 130 139 156 99 99 105 110 116 138 139 143 150 1621,728 1,713 1,773 1,842 1,976 2014 2015 2016 2017 2018 Aviation/Military Medical Industrial Automotive Consumer Communication Computer Cloud Network connectivity End device APPLICATIONS Base stations Small area networks (WiFi) Servers, datacenters Smartphones, tablets Wearables, ­environmental control sectors etc. HUB / Gateway Connected Devices
  • 58.
    54 ATS AnnualReport 2015/1628 ATS Annual Report 2015/16 has placed its focus on the production of highly complex printed circuit boards for the most sophisticated applications. Over 75% of revenue is now generated in this top category of technology. IC substrates represent cutting edge technology for connection platforms. The most important difference compared with printed circuit boards are the achievable structures – a minimum of less than 10µm is possi- ble. Unlike in the production of printed circuit boards, however, the clean room requirements that must be met are far more complex, and alternative plating processes are required to form vertical connections. Other than traditional printed circuit boards, IC substrates may also consist of ceramic or glass materials. INTERNATIONAL MARKET DEVELOPMENT The global printed circuit board market is strongly influenced by the highly developed but increasingly difficult to predict electronics industry. As a result of rapidly changing customer needs and the shifting global economic climate, the markets for end devices and semiconductors are subject to increasingly greater fluctuations. The printed circuit board industry is also subject to these macro trends which determine the demand for electronic devices and systems. Additionally, the imbalance between supply and demand, the progressing geographic migration, the price decline and the fierce competition exert an influence over this highly fragmented market. Globally, there were around 2,400 producers in 2014 (source: NTI, August 2015). The top 30 companies have a combined market share of around 60%. (source: Prismark, February 2016). Independent market analysts predict an average annual growth of about 2% for the global printed circuit board market until 2018 (source: Prismark, February 2016), expecting above-average growth rates of 5.8% for more advanced technologies such as any-layer printed circuit boards (source: Prismark, June 2015). In 2015, global demand for printed circuit boards stood at US$ 55.3 billion (source: Prismark, February 2016), representing a decline of 4% from the previous year. COMMUNICATION: SMARTPHONES REMAIN THE TECHNOLOGICAL GROWTH DRIVER IN THE ELECTRONICS INDUSTRY With about 1.429 billion devices sold, the smartphone market was by far the largest segment of the global electronics industry in 2015, and also the fastest growing (10% growth) year-on-year. Even if independent market analysts predict significantly lower average growth rates of about 6.6% for the coming years (source: IDC, December 2015), smartphones will remain the largest segment of the electronics industry. The market for communications infrastructure will become more important again in the next several years as a result of the IoT and, beginning in 2019, with the introduction of fifth generation networks (5G). Based on the most recent forecasts, it should grow by 2.6% annually (source: Prismark, February 2016). COMPUTERS: THE “INTERNET OF THINGS” WILL GENERATE NEW GROWTH IN SERVERS AND STORAGE MEDIA The market for computers – desktops, notebooks and tablets – re- corded a decline of around 9% in 2015. Contrary to original forecasts, even the tablet computer market, for which average growth of 13% p.a. had been expected (source: IDC, January 2014), declined for the first time in 2015, by around 11.4% from 2014 (source: Prismark, February 2016). For the coming years, steady demand is projected with different growth rates for the various end devices. For server and storage computing devices, solid and sustained growth of about 5% is anticipated in the next several years due to continuing digitalisation and thus the rising volume of data, which must be analysed and stored (source: Prismark, February 2016). CONSUMER The consumer market, which has significant demand for high-end printed circuit boards in products such as digital cameras, TVs and so-called smart devices like smart watches and fitness trackers, also experienced a decline in 2015, of 1.3%, as wearable applications did not break through on the market and digital cameras are being replaced by smartphones. Sales volume smartphones units sold in millions Source: IDC, December 2015 Sales volume computer market units sold in millions Source: Prismark, February 2016 1,302 1,429 1,499 1,610 1,729 2014 2015 2016 2017 2018 220 195 190 187 184 185 172 170 170 170 128 118 115 113 112 9 11 11 12 13 2014 2015 2016 2017 2018 Tablets Notebooks Desktops Servers
  • 59.
    55Group Management ReportGroupManagement Report 29 According to Prismark, there will be no growth in this market again in 2016 but will begin to grow again in 2017 at an average rate of around 5.8%. Growth will be driven primarily by 4K TVs, smart watches, consumer robots and handheld projectors AUTOMOTIVE ELECTRONICS: ABOVE-AVERAGE GROWTH THROUGH NEW DEVICES The share of the automotive market in electronic systems declined in value in 2015 by 8.1% on a US$ basis. It is expected to grow by 7.9% annually until 2018 (source: Prismark, March 2016). Demand for printed circuit boards for automotive electronics is anticipated to grow by an annual average of 4.6% (source: Prismark, February 2016). Thus the growth rates for electronic systems for the automotive market as well as for printed circuit boards in this segment are significantly higher than the average overall figures for the global electron- ics industry. In this segment, applications in the area of safety and information also drive the demand and the use of HDI and microvia printed circuit boards. The applications in which HDI and microvia printed circuit boards are now used extend from navigation, multimedia and infotainment systems to emergency calling and camera systems and electronic transmission control. The concept of autonomous driving has sparked the development of central systems to collect the data and information from camera systems, radar and ultrasound sensors, analyse them, and ultimately control the relevant actuators for braking, stability and steering systems. These new central computers also need HDI technology because of the large volumes of data and the required data transfer speed. INDUSTRIAL ELECTRONICS The industrial electronics systems market declined from 2014 to 2015 by 3.9%. In 2016, independent market analysts expect a growth rate of 4.8% (Source: Prismark, February 2016). The correlated growth in printed circuit boards for this segment is expected to about 3% for the same time period. (Source: Prismark, February 2016). The industrial electronics segment continues to be heavily influenced by applications in the areas measure- ment and control technology, power electronics, lighting systems as well as diagnostic instruments, RFID readers and also railway technology. In the future, M2M (machine-to-machine and machine-to-man) com- munication modules driven by Industry 4.0 activities will enable further growth in this segment. MEDICAL ELECTRONICS The global market for medical electronics systems had a value of US$ 99 billion in 2015 (source: Prismark, February 2016), representing stagnation year on year. The medical electron- ics market is characterised by a high level of complexity with regard to applications such as diagnostic and imaging devices, therapy applications and patient monitoring. Further application areas are surgical lighting, analytical instruments and molecular diagnostics. Prices for medical technology, devices and systems range from low two-digit US$ amounts for fitness trackers to several 100,000 US$ for a computer tomography system. Average annual growth of around 5.4% is expected until 2018. Sales volume automotive market vehicles sold in millions Source: Prismark, February 2016 Sales volume industrial electronics systems market US$ in billions Source: Prismark, February 2016 Sales volume medical electronics systems market US$ in billions Source: Prismark, February 2016 90 93 96 99 102 2014 2015 2016 2017 2018 129 124 130 139 147 2014 2015 2016 2017 2018 99 99 105 110 116 2014 2015 2016 2017 2018
  • 60.
    56 ATS AnnualReport 2015/1630 ATS Annual Report 2015/16 THE MARKET FOR IC SUBSTRATES Independent market analysts calculate the volume of surface produced for 2014 of 7.5 million m² (Yole) or 7.4 million m² (Prismark), and the volume for 2015 of 8.7 million m² (Yole) or 7.5 million m² (Prismark). Based on the Yole calculation, this represents growth of around 16%, and based on Prismark, growth of 1.2%. The forecasts for 2016 amount to 9.6 million m² (Yole) and 7.5 million m² (Prismark). These differing estimates arise from diverging ways of defining the market for substrates, i.e. the inclusion of different substrate technologies such as wire-bond substrates versus flip-chip substrates or even chip-on- board and chip-on-flex interconnection platforms. The different estimates are also related to the prediction of demand for end uses and applications, which is becoming increasingly difficult. The substrates market in recent years has been shaped primarily by growth in the smartphone industry and decline in the computer market. In the next several years, the Internet of Things will have a significant influ- ence on further growth in the semiconductor industry and the associated demand for substrates. IoT is not a single application but rather the connection of end devices such as wearables and sensors with gateways such as smartphones or tablets. These gateways are connected through base stations via WiFi networks and process the data through servers and data centres in the cloud. Differing growth forecasts result from how certain factors are assessed, such as the demand for end devices or the required expansion of networks and data centres as the engine of IoT. IC substrates are used in all segments of the electronics industry, and more than 80% of them in smartphones, desktop and notebook computers, tablets, servers and storage systems (source: Prismark, July 2014). In contrast to the large number of printed circuit board producers, there are only a few manufacturers of IC substrates, among which the top 10 providers jointly lay claim to more than 80% of the market (source: Prismark, July 2014). This environment presents ATS with the opportunity in the coming years to establish itself as a leading provider to this high-tech segment. MINIATURISATION, FUNCTIONAL INTEGRATION AND MODULARISATION DETER- MINE THE MARKET FOR EMBEDDED COMPONENT PACKAGING (ECP) AND EM- BEDDED DIE PACKAGING Embedded die packaging technology is still in the market introductory phase. Yole analysts estimate the total market volume for 2015 to be US$ 27 million and predict a market increase until 2018, reaching a total volume of about US$ 142 million. This corresponds to an average annual growth rate of about 73% (source: Yole, March 2015). Paramount to ECP technology is miniaturisation by integrating components – and thus functionality – into the printed circuit board, as well as improved reliability of the interconnection technology between components and printed circuit board. Further challenges include increasing mechanical stability and improving thermal and electrical properties for applications in the high frequency area, for power electronics but also for audio applications and high-speed data transfer. ECP technology focuses on two different areas. So-called packages or system-in-package (SiP) modules cur- rently represent the largest part. Typical examples for application include power modules, MOSFET and IGBT applications, MEMS modules, sensor and camera modules, audio and radio modules as well as DC/DC con- verters. The second area relates to motherboards (main boards), including applications such as highly reliable printed circuit boards for tough environmental conditions (e.g. engine control), notebooks, mobile internet devices, smartphones, hearing aid devices and integrated RFID solutions. Production volume IC substrates in million sqm Source: Prismark, February 2016 Yole, April 2016 Sales volume of embedded die packaging market US$ in millions Source: Yole, March 2015 7.5 8.7 9.6 11.1 12.8 7.4 7.5 7.5 7.9 8.1 2014 2015 2016 2017 2018 Yole Prismark 14 27 52 90 142 2014 2015 2016 2017 2018
  • 61.
    57Group Management ReportGroupManagement Report 31 In financial year 2015/16, ATS once again significantly exceeded the record revenue level of 2014/15 de- spite the printed circuit board industry and the customer segments addressed by ATS showing uneven performance compared to financial year 2014/15 and increasing price pressure in the core business. Overall, ATS increased Group revenue by € 95.9 million or 14.4% to € 762.9 million (previous year: € 667.0 million). This positive development was due to strong demand in all segments, with revenue increasing organically by € 34.4 million or 5.2%. Alongside this strong organic growth, positive currency effects of € 58.9 million or 8.8% contributed to this revenue growth in the reporting period. Initial revenues from the Chongqing project increased revenue by € 2.6 million or 0.4%. Around 73.3% of revenue in 2015/16 was invoiced in foreign currencies. The revenue share of products manufactured in Asia rose from 79.0% in the previous year to 81.0% in the reporting year. The regional revenue structure based on the customer’s headquarters shows a share of 56.1% for Americas, compared to 53.4% in the previous year. The revenue share of the remaining regions shifted accordingly. Due to the high importance of mobile devices, ATS revenue shows a certain seasonality. The first quarter of the financial year is typically weaker than the second and third quarters, which generally show very high demand due to preparations for the Christmas trade, and is characterised by the launches of the latest product generations. The fourth quarter normally has weaker customer demand and is characterised by production breaks in our largest plant in Shanghai (and, in the future, also in Chongqing) due to Chinese New Year. In the current year, the seasonality was not very distinct, as demand from the Mobile Devices Sub- strates segment was unusually strong in the first few months of the financial year. Furthermore, ATS bene- fited from a very strong US dollar compared to the previous year. Growth rates decreased mid-year, as the comparable periods in the previous year where already unusually strong, the available production capacity was almost all at full utilisation in the previous year and exchange rates showed no significant changes. The production break caused by Chinese New Year was on a normal level compared to the previous year (when the plant closure was reduced to the minimum) and was offset by the stable high level of demand from the Automotive, Industrial, Medical segment throughout the year. Result key data € in millions (unless otherwise stated) 2015/16 2014/15 Change in % Revenue 762.9 667.0 14.4% Operating result before interest, tax, depreciation and amortisation (EBITDA) 167.5 167.6 0.0% EBITDA margin (%) 22.0% 25.1% Operating result (EBIT) 77.0 90.1 (14.6%) EBIT margin (%) 10.1% 13.5% Profit for the year 56.0 69.3 (19.3%) Earnings per share (€) 1.44 1.78 (19.1%) Additions to fixed assets 303.0 154.5 96.1% Average number of staff (incl. leased personnel) 8,759 7,638 14.7% 1.2. Profit situation Development of revenue € in millions Revenue by quarter € in millions Revenue by region (Customer headquarters) in % 541.7 589.9 667.0 762.9 12/13 13/14 14/15 15/16 141.3 160.8 187.3 177.6 194.4 192.7 197.2 178.5 Q1 Q2 Q3 Q4 2014/15 2015/16 F E D C B A 2014/15 2015/16 A - Austria B - Germany C - Other European countries D - China E - Other Asian countries F - Americas 2.9% 21.3% 6.2% 4.1% 12.1% 53.4% 2.3% 21.4% 6.0% 4.3% 9.9% 56.1%
  • 62.
    58 ATS AnnualReport 2015/1632 ATS Annual Report 2015/16 The Mobile Devices Substrates segment (MS) achieved a revenue of € 539.7 million in the reporting year, an increase of € 84.5 million or 18.6% compared to the previous year’s figure of € 455.2 million. The segment benefited from very strong demand in the first two quarters of the reporting year and positive currency effects, whereas the fourth quarter in particular showed the normal seasonality for this segment. The Auto- motive, Industrial, Medical segment (AIM) increased its revenue by € 24.9 million or 8.2% to € 326.7 million (previous year: € 301.8 million). This development was mainly driven by the ongoing trend towards more electronics in motor vehicles and the stronger demand for mobile applications in the patient monitoring area. The industrial area showed stable development and repeated the previous year’s good figures. The Advanced Packaging business unit, which is included in the Others segment (OT), showed a further strong advancement and achieved a revenue increase of € 11.2 million or 102.9% to € 22.1 million (previous year: € 10.9 million) in the reporting year. The increase was due both to the successful acquisition of new customers and the ongo- ing implementation of the embedding technology with existing customers from the other segments. In the current year, the significance of the Mobile Devices Substrates segment increased further as the growth rates in this segment were higher than in the Automotive, Industrial, Medical segment. The Group's EBITDA of € 167.5 million was at the previous year’s level of € 167.6 million. The result already recflects the first negative impacts of the start of the serial production of the Chongqing project. The startup costs of the Chongqing project burdened EBITDA by € 12.7 million in the reporting period (previous year: € 4.3 million). The increase of € 8.4 million comprised € 6.9 million from the planned start of serial production and € 1.5 from exchange rate effects. Group-wide, exchange rate effects increased EBITDA by € 13.0 million or 7.7%. The results in the first two quarters were in line with the very positive revenue development, while the last quarter was heavily impacted by the startup costs. Development of profit € in millions 2014/15 One-off effects1) Currency effects2) Organic 2015/16 Revenue 667.0 2.6 58.9 34.4 762.9 Cost of sales (511.6) (13.2) (50.2) (36.3) (611.2) Gross profit 155.4 (10.6) 8.7 (1.9) 151.6 Distribution costs (31.6) (0.3) (1.8) (1.0) (34.6) General and administrative costs (28.0) (0.7) (0.9) 0.2 (29.4) Other operating result (5.7) (3.8) (2.1) 0.9 (10.7) Operating result before deprecia- tion and amortisation (EBITDA) 167.6 (6.9) 13.0 (6.2) 167.5 Operating result (EBIT) 90.1 (15.3) 3.9 (1.8) 77.0 Finance costs - net (5.1) (0.3) (2.1) (0.7) (8.1) Profit before tax 85.0 (15.5) 1.8 (2.5) 68.8 Income taxes (15.6) 3.7 (1.3) 0.4 (12.9) Profit for the year 69.3 (11.8) 0.5 (2.0) 56.0 1) Chongqing project 2) Translation and valuation effects included in the consolidated financial statements Compared to the previous year, the EBITDA margin decreased by 3.1 percentage points from 25.1% to 22.0%. This development is mainly due to the start-up costs in connection with the start of serial production for the Chongqing project. After deducting one-off effects from both years, the decrease amounts to 2.1 percentage points, from 25.8% in the previous year to 23.7% in the reporting year. This decrease is mainly due to a com- pensation payment by a supplier included in the previous year, changes to the payroll-related costs in our biggest factory in Shanghai and the temporary discontinuation of an export promotion in India. However, the EBIDTA margin remained above our long-term target of 18-20%. Revenue from external customers by segment in % 2015/16 2014/15 Development of EBITDA € in millions EBITDA by quarter € in million OT AIM MS OT 59.3% 40.2% 0.5% MS 2013/14 57.3% 42.4% 0.3% OT AIM MS 102.4 127.2 167.6 167.5 12/13 13/14 14/15 15/16 29.1 43.2 55.0 40.3 45.5 47.7 47.0 27.3 Q1 Q2 Q3 Q4 2014/15 2015/16
  • 63.
    59Group Management ReportGroupManagement Report 33 Cost of materials increased from 34.1% in the previous year to 35.1% in the reporting year, reflecting the development towards superior quality, complex products as well as the startup-costs. The ratio of staff costs to revenue amounted to 21.1%, slightly above the previous year’s figure of 20.0%. This can be explained by payroll-related costs in Shanghai as well as the start-up costs. The absolute increase in administrative and distribution costs resulted from exchange rate effects, the setup of the Chongqing organisation according to plan and the further enhancement of distribution activities, which, however, increased at a lower rate com- pared to revenue. Other operating incomes and expenses includes non capitaliseable development costs for the Chongqing project of € 10.7 million (previous year: € 8.7 million), positive currency differences resulting from the measurement of foreign currency receivables and liabilities of € 0.1 million (previous year: € 0.7 million) and impairments of € 3.1 million (previous year: € 6.0 million). Amortisation of intangible assets and depreciation of property, plant and equipment of € 87.4 million or 11.0% of non-current assets (previous year: € 71.5 million or 11.0% of non-current assets) reflect ATS's high technical standards as well as its investment ratio and have increased particularly due to currency exchange effects and the start of depreciation of the technical equipment and development costs for Chongqing. In addition to scheduled depreciation and amortisation, lower impairments were incurred compared to the previous year of € 3.1 million or 0.4% of non-current assets (previous year: € 6.0 million or 0.9% of non- current assets) resulting from the impairment of technical equipment in China no longer in use. Impairments are made when there is no longer a potential for use in ongoing operations and the amount recoverable through a disposal falls below the carrying amount. The operating result (EBIT) decreased by € 13.1 million or -14.6% to € 77.0 million (previous year: € 90.1 million). Adjusted for the Chongqing project, ATS achieved an increase of € 5.0 million or 5.1% to € 103.2 million (previous year: € 98.2 million). The EBIT margin decreased by 3.4 percentage points to 10.1% (previous year: 13.5%), or, adjusted by the Chongqing project, by 1.1 percentage points from 14.7% in the previous year to 13.6% in the current year. Finance costs – net declined from € -5.1 million to € -8.1 million. Interest expenses on financial liabilities reduced from € 11.3 million to € 8.9 million. This was mainly due to an increase in the capitalised interest costs to € 6.6 million (previous year: € 2.8 million) relating to the purchase of qualified assets in Chongqing. Gross interest expenses rose only slightly by € 1.4 million from € 14.1 million to € 15.5 million due to effected optimising measures, although gross debt rose from € 405.3 million to € 523.0 million. These optimisations, however, resulted in hedging instruments, that swapped variable into fixed interest, becoming ineffective, because the duration and amount no longer matched with the primary secured debts, and the requirements for hedge accounting were no longer met. Due to these necessary changes in the accounting, € 3.8 million was included as a one-time expense in the profit and loss statement for the reporting period. Lower social capital interest costs of € 0.4 million (previous year: € 1.3 million) and – although the environ- ment was unfavourable for placing funds – a higher return on financial investments of € 3.0 million (previous year: € 2.2 million) resulted in a decline in finance costs – net. In the reporting year, finance costs – net in- cluded positive foreign exchange differences resulting from the measurement of liquid foreign currency funds and debts and realised exchange gains from financial instruments were recognised as income of € 3.9 million (previous year: € 6.7 million). In principle, finance costs – net are influenced by currency effects only to a limited extent, as the main part of the loans from credit institutions is made up of liabilities in euros. The main intra-group loans are long-term by nature and their repayment is neither scheduled nor probable in the foreseeable future. These loans are therefore recorded directly in equity through the statement of compre- hensive income. The Group's tax expense decreased in relation to the profit for the year before tax and amounted to € 12.9 million (previous year: € 15.6 million). Compared to the prior year, the effective tax rate rose slightly from 18.4% to 18.7%. Compared to the previous year, there were no significant tax-related changes. It will only be possible to assess the impacts of the OECD BEPS project on ATS after implementation into the tax EBITDA margin in % Development of EBIT € in millions EBIT margin in %18.9 21.6 25.1 22.0 12/13 13/14 14/15 15/16 31.4 53.9 90.1 77.0 12/13 13/14 14/15 15/16 5.8 9.1 13.5 10.1 12/13 13/14 14/15 15/16
  • 64.
    60 ATS AnnualReport 2015/1634 ATS Annual Report 2015/16 laws of the individual countries. Current assessments however show, that this will lead to significantly higher reporting and documentation requirements (country by country reporting) and to higher administrative costs in order to ensure tax compliance in all Group companies and to minimise the risk of double taxation. The profit for the year decreased from € 69.3 million in the previous year by € 13.3 million or -19.3% to € 56.0 million, and earnings per share decreased by € 0.34 or -19.1% from € 1.78 to € 1.44 with same number of outstanding shares. Earnings per share in € 0.62 1.24 1.78 1.44 12/13 13/14 14/15 15/16
  • 65.
    61Group Management ReportConsolidatedFinancial Statements 35 Development of statement of financial position € in millions 31 Mar 2015 One-off effects1) Currency effects Organic 31 Mar 2016 Non-current assets 712.8 222.5 (81.0) 12.1 866.3 Current assets 508.1 (21.9) (36.1) 28.2 478.3 Total assets 1,220.8 200.6 (117.1) 40.3 1,344.7 Equity 604.4 (29.4) (82.6) 76.6 568.9 Non-current liabilities 413.1 148.6 (16.3) (124.0) 421.4 Current liabilities 203.4 81.4 (18.2) 87.7 354.3 Total equity and liabilities 1,220.8 200.6 (117.1) 40.3 1,344.7 1) Chongqing project In financial year 2015/16, the total amount of the consolidated statement of financial position rose by € 123.9 million or 10.1% from € 1,220.8 million to € 1,344.7 million. This was mainly due to additions to as- sets for the Chongqing project of € 231.5 million which were partly offset by exchange rate effects. The increase in intangible assets of a total of € 58.5 million or 129.4% to € 103.7 million (previous year: € 45.2 million) is mainly due to capitalised development costs of € 61.1 million that meet the criteria of IAS 38. Property, plant and equipment rose by a total of € 235.6 million, mainly due to additions in Chongqing of € 163.7 million and technology upgrades in Shanghai of € 52.1 million. Amortisation and depreciation of € 90.5 million (previous year: € 77.5 million) and exchange rate effects of € -67.3 million were taken into account in the net change in fixed assets which rose by € 144.0 million or 22.2% to € 792.9 million (previous year: € 648.9 million). Non-current assets include input tax receivables of € 27.9 million (previous year: € 17.6 million) which can only be offset against VAT payables in over one year's time. Net working capital € in millions (unless otherwise stated) 31 Mar 2016 31 Mar 2015 Change in % Inventories 83.4 89.2 (6.5%) Trade receivables 110.0 113.5 (3.1%) Trade payables (130.7) (97.8) 33.6% Liabilities from investments 55.6 17.5 218.1% Working capital trade 118.4 122.4 (3.3%) Other current assets, payables, provisions (29.9) (27.1) 10.5% Net working capital 88.4 95.3 (7.2%) Net working capital in % of total revenue 11.6% 14.3% Days outstanding (in days): Inventories 50 64 (21.4%) Receivables 53 62 (14.7%) Payables 63 77 (17.9%) Inventories declined by € 5.8 million or -6.5% from € 89.2 million to € 83.4 million, mainly due to exchange rate effects. Increased inventories due to Chongqing were almost fully compensated by a reduction at the other sites. Trade receivables fell by € 3.5 million or -3.1% to € 110.0 million (previous year: € 113.5 million) 1.3. Financial position
  • 66.
    62 ATS AnnualReport 2015/1636 ATS Annual Report 2015/16 due to exchange rate effects. Days of receivables outstanding decreased by 16.3% to 53 days (previous year: 62 days) due to higher revenue. Trade payables increased by € 32.9 million or 33.6% from € 97.8 million to € 130.7 million. This increase was due to an increase of € 38.1 million in payables of investments for € 55.6 million (previous year: € 17.5 million). Equity decreased by € 35.5 million or -5.9% from € 604.4 million to € 568.9 million. The positive contribution from the Group result increased equity by € 56.0 million (previous year: € 69.3 million), however, negative currency differences from the translation of subsidiaries' net asset positions and from the translation of long- term loans to subsidiaries decreased equity by € 82.5 million. The decrease results from devaluations of the Chinese yuan renminbi, the Indian rupee and the South Korean won compared to the euro. Actuarial gains, mainly resulting from the higher interest rates applied in calculating personnel provisions, increased equity by € 2.7 million (previous year: reduction of € 6.8 million). Non-current financial liabilities increased by € 2.3 million or 0.6% from € 359.3 million to € 361.6 million and thus maintained the level of the previous year. Current financial liabilities increased from € 46.0 million to € 161.4 million. These included the reclassification of the bond due on 18 November 2016 with a residual carrying amount of € 76.8 million. Net debt € in millions (unless otherwise stated) 31 Mar 2016 31 Mar 2015 Change in % Financial liabilities, current 161.4 46.0 250.6% Financial liabilities, non-current 361.6 359.3 0.6% Gross debt 523.0 405.3 29.0% Cash and cash equivalents (171.9) (273.9) (37.3%) Financial assets (87.9) (0.9) 9,890.9% Net debt 263.2 130.5 101.7% Operating result before interest, tax, depreciation and amortisation (EBITDA) 167.5 167.6 (0.0%) Net debt/EBITDA ratio 1.6 0.8 Equity 568.9 604.4 (5.9%) Total consolidated statement of financial position 1,344.7 1,220.8 10.1% Equity ratio (%) 42.3% 49.5% Net gearing (Net debt/Equity) (%) 46.3% 21.6% Despite high cash flows from operating activities, net debt increased by € 132.7 million or 101.7% to € 263.2 million (previous year: € 130.5 million) due to the high capital expenditures and the dividend paid. The gearing ratio increased to 46.3% and was thus significantly above the previous year's level of 21.6%. The indicator net debt/EBITDA, which represents a theoretical payback period for debts, declined from 0.8 years to 1.6 years due to the higher net debt. Net debt/EBITDA Multiple Net gearing in % 2.1 0.9 0.8 1.6 12/13 13/14 14/15 15/16 71.3 28.4 21.6 46.3 12/13 13/14 14/15 15/16
  • 67.
    63Group Management ReportConsolidatedFinancial Statements 37 TREASURY ACTIVITIES In financial year 2015/16, Group Treasury set essential strategic directions for the coming years. With the aim of securing the current extremely favourable market conditons in the financing sector over the long term, reducing the costs of interest within the next years, refinancing the bond due on 18 November 2016 and extending the maturity date, ATS successfully placed promissory note loans with a total volume of € 221.0 million on the market on 23 October 2015. Additionally, a bilateral promissory note loan of € 100.0 million was signed at the beginning of March 2016, which was disbursed in April 2016. Along- side the general financing of the Group, received funds were used for the partial, premature buyback of the bond with a nominal value of € 24.5 million and for the early redemption of the variable part of the promisso- ry note loan with a volume of € 92.0 million that had been placed in 2014. The financing of ATS is based on a four-pillar strategy that minimises dependence on individual financing instruments. Based on the prevailing financial market conditions, individual areas can be expedited more strongly or, as the case may be, not used at times. The starategy is based on long-term, fixed interest bearing retail bonds. Their advantage lies in their high predictability and security for the Company as they bear fixed interest rates and are non-redeemable. How- ever, their higher placement costs are a disadvantage. The current retail bond, which has a carrying amount of € 76.8 million, matures on 18 November 2016. On 22 October 2015, bonds with a nominal value of € 18.0 million and on 25 February 2016 bonds with a nominal value of € 6.5 million, were bought back early from institutional investors. The aim of this measure was to use existing liquidity to yield a return. The current point of view is, that the maturing bonds will not be replaced for the time being. Promissory note loans provided the the key support for the financing strategy in financial year 2015/16: Their key feature is also their high level of predictability – however, their placement costs were far lower. In March 2014, € 156.5 million and US$ 2.0 million with maturities of 5, 7 and 10 years, were placed. An interest rate swap was used to convert future variable euro interest obligations into fixed interest payments. The variable tranche of the promissory note loan placed in 2014 of € 92.0 million was partially reimbursed in October 2015, the remaining part was reimbursed in February 2016 in order to optimise financing costs. The concluded interest rate swaps continue to be used as security against the promissory note loan placed in October 2015 in order to hedge the variable interest payables in euros over a major part of the term. Howev- Development of net debt € in millions gearing in % 21,6 % 28,4 % CAPEX project Chongqing CAPEX others Cash flow from operatingactivities before changesin W C Dividend Changesin networkingcapital and other Netdebtand netgearing asof31.3.2016 Netdebtand netgearing asof31.3.2015 130.5 21.6% 46.3% +190.3 +64.5 +14.0 -145.9 +9.8 263.2
  • 68.
    64 ATS AnnualReport 2015/1638 ATS Annual Report 2015/16 er, the effectiveness criteria of hedge accounting in accordance with IFRS are no longer being met and the evaluation is therefore recognised in the statement of profit or loss. On 23 October 2015, a promissory note transaction with a total volume of € 221.0 million was closed success- fully. The emission volume originally aimed for € 100 million was increased to € 221.0 million due to the high demand. The promissory note loan consists of tranches with terms of five and seven years at fixed and varia- ble interests rates in euros and US dollars with an average interest rate at issue of around 1.6%. On 4 March 2016, a bilateral promissory note loan of € 100.0 million and a term of seven years, which will be paid out in April 2016, was signed. In the financial year 2015/16, the amount will be shown as unused credit lines. Due to the above-mentioned advantages, ATS is planning to focus also on this type of financing in the future. Bank loans are used as the third pillar. € 122.3 million in loans was taken out from several national and inter- national banks. These loans mainly bear variable interest rates and have maturities of between one and six years. The fourth pillar consists of credit lines serving to cover liquidity fluctuations. At the reporting date, ATS reported more than € 247.4 million in unused credit lines in the form of loans commitments from banks or promissory note loans already concluded. The most important task of the treasury function at ATS is to secure sufficient liquidity reserves. It also monitors covenants defined in the credit agreements in order to ensure compliance with them. The notional payback period for debts, defined as net debt/EBITDA, of 1.6 years was significantly below the covenant of 4.0 and the Group’s own target value of 3.0, and has worsened due to the high level of invest- ment activity (previous year: 0.8 years). The equity ratio decreased from 49.5% in the previous year to 42.3% in the reporting year and thus continued to be significantly above the target value and the covenant. The equity ratio is negatively impacted by the higher gross debt resulting from the early financing. For further information regarding capital risk management, please refer to Note 20 “Additional disclosures on financial instruments“ – sub-section Capital Risk Management – in the notes to the consolidated financial statements. Treasury keydata Covenant1) Target2) 31 Mar 2016 31 Mar 2015 Net debt/EBITDA ratio 4.0 3.0 1.6 0.8 Equity ratio 35% 40% 42.3% 49.5% 1) Covenants are limits included in old credit agreements which the actual figures should not exceed (Net debt/EBITDA) or undercut (equity ratio). 2) Target values are limits defined by ATS which the actual figures, under normal circumstances, should not exceed (Net debt/EBITDA) or undercut (equity ratio). ATS pursues a financing structure that is as balanced as possible, with an average duration that is con- sistent with the investment programme. At the reporting date, the duration was 3.9 years (previous year: 3.8 years). This slight increase is due to the placement of the promissory note loan in October 2015 which reimbursed part of the promissory note loan from 2014 that had a higher interest rate and is intended to redeem the bond due on 18 November 2016. As a result of the repayment of the bond and bank loans of € 158.3 million in 2016/17 and the repayment of parts of the promissory note loan and bank loans of € 167.8 million in 2020/21, the financing structure shows a high amount in both years. Redemption € in millions 76.6 167.8 29.1 79.2 19.8 158.3 20/21 20/21 19/20 18/19 17/18 16/17
  • 69.
    65Group Management ReportConsolidatedFinancial Statements 39 Carrying amount of financial liabilities by maturity € in millions 31 Mar 2016 in % 31 Mar 2015 in % Remaining maturity Less than 1 year 161.4 30.9% 46.0 11.4% Between 1 and 5 years 285.3 54.5% 321.6 79.3% More than 5 years 76.3 14.6% 37.7 9.3% Total financial liabilities 523.0 100.0% 405.3 100.0% A further aim was to minimise the interest rate risk by predominantly using fixed interest rates. 73.9% (previ- ous year: 78.3%) of financing is conducted at or was swapped to fixed interest rates, and only 26.1% (previ- ous year: 21.7%) is based on variable interest rates. These strategies for securing interest rates are being continuously adapted based on expectations of interests rates. ATS also intends to invest available liquid funds profitably but risk-sensitively: As at 31 March 2016 ATS had total financial resources of € 259.8 million (previous year: € 274.8 million). By optimising the terms of investment and early conversion of liquid funds into currencies with higher interest rates and which are also continually required by ATS, the highest possible yields should be achieved in a currently very challenging, from an investor-perspective, environment. This early conversion into foreign currencies serves as a natural currency hedge and a reduction of the expo- sure to foreign currencies. In addition to this natural hedging and the above-mentioned instruments for interest rate hedging, ATS occasionally hedges foreign currency transaction risks in the short-term (less than one year). At the reporting date, there were no such hedging instruments in place. Currency translation risks resulting from the conversion of subsidiaries with different local currencies are not hedged. The final treasury aim consists of an optimised debtor relationship management. ATS considers these to be defining banks for national and international cooperation and setting up and maintaining the communication that is needed on both sides. The aim is to create transparency across the opportunities and risks of ATS in order to strengthen a long-term partnership with the financing institutions, that is profitable for both sides. The annual and quarterly reports act as the basis for this. In addition, meetings with our financing bank part- ners take place at least once a year in which the opportunities for cooperation are discussed. ATS adopts an active approach to financial management in order to achieve the above-mentioned treasury aims as cost-effectively as possible. The measures taken in financial year 2015/16 will reduce both the aver- age financing costs and, from a current perspective, the total financing costs for the next year, even though the gross debts are expected to rise. For financial year 2016/17, ATS must take advantage of current low interest rates in order to conclude further long-term financing contracts. CASH FLOW Cash flow from operating activities before changes in working capital increased slightly from € 145.0 million to € 145.9 million. The decrease in profit for the year from € 69.3 million to € 56.0 million and the increase in interest payments increased from € 14.5 million to € 15.5 million were offset by higher depre- ciation and amortisation and by a reduction in tax payments (from € 16.4 million to € 10.3 million). Cash flow from operating activities decreased from € 143.9 million by € 7.0 million or -4.8% to € 136.9 million. While cash flow from operating activities before changes in working capital increased by € 0.9 million or 0.7% to € 145.9 million, cash used in working capital rose by € 6.5 million. There was a lower inflow from other provisions of € 1.3 million. Maturities of financial liabilities in % Average financing costs in % 5 years 1 year 1 – 5 years 54.5% 14.6% 30.9% 4.6 3.7 3.6 3.3 12/13 13/14 14/15 15/16
  • 70.
    66 ATS AnnualReport 2015/1640 ATS Annual Report 2015/16 Due to investment activities in Chongqing and Shanghai, various technological reinvestments at the other sites and the placing of liquid funds with terms of over 3 months, cash flow from investing activities amount- ed to € 342.2 million. Capital expenditures on property, plant and equipment and intangible assets amounted to € 254.8 million and was thus € 89.5 million above very high previous year’s level of € 165.3 million. At € 111.1 million, cash flow from financing activities was exceptionally higher at € 99.2 million above the previous year’s figure, due to the placing of promissory note loans with a volume of € 221.0 million. Free cash flow, i.e. cash flow from operating activities plus cash flow from investing activities, was negative at € 205.3 million due to the high investment activities and was € 184.4 million below the previous year's figure of € -20.9 million. € 87.7 million of this change resulted from the investing of cash and cash equivalents and € 0.3 million from payments for the acquisition of minority interests. Cash flow statement (short version) € in millions 2015/16 2014/15 Change in % Cash flow from operating activities before changes in working capital 145.9 145.0 0.7% Cash flow from operating activities 136.9 143.9 (4.8%) Cash flow from investing activities (342.2) (164.8) 107.7% Free cash flow (205.3) (20.9) 881.9% Cash flow from financing activities 111.1 11.9 830.2% Change in cash and cash equivalents (94.2) (9.0) 950.6% Currency effects on cash and cash equivalents (7.8) 22.8 (134.3%) Cash and cash equivalents at end of the year 171.9 273.9 (37.3%) Due to the high level of investments, cash and cash equivalents decreased from € 273.9 million to € 171.9 million, despite the very strong cash flow from operating activities and the above-mentioned financ- ing and investment measures. In addition, ATS disposes of current financial assets of € 87.8 million (previ- ous year: € 0.8 million). This amount, which currently remains very high, is being used to secure the financing of the new plant in Chongqing and the repayment of the bond that matures on 18 November 2016. ATS PERFORMANCE SYSTEM In addition to revenue and EBITDA, ATS uses a further three key figures as primary reference values for performance measurement in internal strategic corporate manage- ment: ROCE, cash earnings and IRR. They describe and control performance in respect of investors, opera- tional performance and performance in respect of customers. ATS uses return on capital employed (ROCE) to measure its performance from the point of view of inves- tors, using the ratio of the result adjusted for finance costs – net and average capital employed. This illus- trates the extent to which ATS fulfills its investors' interest requirements. Average capital costs are derived from the minimum return expected by investors to provide equity or borrowings. The weighted average cost of capital (WACC) for the printed circuit board industry is around 8.9%. At a ROCE of 8.2%, ATS was not able to achieve the WACC figure in the reporting year due to the expenditure in Chongqing and the associated average capital employed. After adjustments, ROCE was 19.3% (previous year: 18.5%). The return on capital employed in the core business was thus significantly higher than the return expected by investors.
  • 71.
    67Group Management ReportConsolidatedFinancial Statements 41 ROCE declined year-on-year due to the decrease in EBIT. However, as a result of the considerable investment activities in the Chongqing project, the average capital employed rose to € 783.5 million (previous year: € 618.2 million). Return on capital employed (ROCE) € in millions 2015/16 2014/15 Change in % Operating result (EBIT) before non-recurring items 77.0 90.1 (14.6%) Income taxes (12.9) (15.6) (17.6%) Operating result after tax (NOPAT) 64.1 74.5 (13.9%) Equity - average 586.7 497.5 17.9% Net debt - average 196.9 120.7 63.1% Capital employed - average 783.5 618.2 26.7% ROCE 8.2% 12.0% In addition to the investor-oriented key figure of ROCE, ATS uses cash earnings as a control reference. This indicator describes a company's operational financial performance. Cash earnings fell only slightly by € 0.3 million or -0.2% to € 146.5 million (previous year: € 146.8 million). The decline in profit for the year was mainly due to higher depreciation and amortisation which are non-cash costs and thus do not affect cash earnings. Cash earnings € in millions (unless otherwise stated) 2015/16 2014/15 Change in % Profit for the year attributable to owners of the parent company 56.0 69.3 (19.2%) Depreciation and amortisation and impairments of property, plant and equipment and intangible assets 90.5 77.5 16.8% Cash earnings 146.5 146.8 (0.2%) Cash earnings per share (€) 3.77 3.78 (0.3%) The third performance indicator relates to the ability to implement innovations in a timely manner and in response to the market. ATS measures this ability by using the innovation revenue rate (IRR), which ex- presses the revenue share of products that feature new and innovative technologies and which were launched on the market in the last three years. For financial year 2015/16, the IRR is 19.6% (previous year: 29.2%). ATS aims to achieve an IRR of at least 20%. This decline was due to the maturity of certain genera- tions of technology in 2015/16. Innovation Revenue Rate (IRR) € in millions 2015/16 2014/15 Change in % Main revenue 762.7 666.7 14.4% Main revenue generated by innovative products 149.2 194.7 (23.4%) IRR 19.6% 29.2% ROCE in % Cash earnings € in millions Innovation Revenue Rate (IRR) in % 5.6 9.6 12.0 8.2 12/13 13/14 14/15 15/16 85.6 111.4 146.8 146.5 12/13 13/14 14/15 15/16 19.2 26.5 29.2 19.6 12/13 13/14 14/15 15/16
  • 72.
    68 ATS AnnualReport 2015/1642 ATS Annual Report 2015/16 Until 9 May 2016, no events or developments came to ATS' attention that would have resulted in significant changes in the disclosure or measurement of the individual asset and liability items as at 31 March 2016. Significant events after the reporting2. period
  • 73.
    69Group Management ReportGroupManagement Report 43 The ATS group currently operates the following six active production plants specialising in different technologies. LEOBEN AND FEHRING The Austrian plants mainly deliver to the European and, to an increasing ex- tent, American markets. Short turnaround times, special applications and proximity to customers are particu- larly important in Europe. The plant in Leoben successfully continued with the niche and prototype produc- tion which was launched in recent years. Despite the high production capacity utilisation at the Leoben site, the flexibility to handle short-term requests was maintained. Production for the future market of Advanced Packaging is also operated in Leoben. The production capacity utilisation of the plant in Fehring showed a satisfying development in the reporting year. Synergies with other sites (Leoben and Nanjangud) are utilised in the outer layer manufacturing of multilayers. The decline in the original core business (double-layer printed circuit boards) was compensated by these measures. SHANGHAI The plant in Shanghai produces HDI (high density interconnection) high-tech printed circuit boards in serial production for the Mobile Devices Substrates segment and has customers all over the world. Capacity was well utilised in the financial year 2015/16 and, in some months, this plant was running at maximum capacity. Moreover, demand for HDI printed circuit boards for the automobile industry remained further on a very high level in 2015/16, which were produced for the Automotive, Industrial, Medical seg- ment. The trend towards thinner line space was proactively used by the site to secure its leading technologi- cal position for the upcoming years. CHONGQING ATS sets another technological milestone at this new plant in China with the production of IC substrates (integrated circuit substrates). The certification of the first products was achieved in February 2016 and the serial production then started. The second substrate line is intended to start operations in the financial year 2016/17. The buildup of the second plant for substrate-like PCBs is on schedule, the installation of the first line should be completed by the middle of the year, and the start of production and initial reve- nues are expected in the second half of the financial year. ANSAN The positive performance of the Korean plant continued in the financial year 2015/16. In addition to the still very good utilisation of production capacities in the area of medical products for European and American customers, substantial volumes for the Mobile Devices Substrates segment were also produced. The minority shares were acquired in the last financial year and, with SAP implementation, the plant also made progress in organisational terms. NANJANGUD Revenue and the operating result showed a negative trend due to exchange rate effects. Manufacturing efficiency (material and energy consumption as well as maintenance costs) was improved through targeted measures. The plant's capacity was continuously at a very high level. HONG KONG The company ATS Asia Pacific, which is based in Hong Kong, is the holding company for the Mobile Devices Substrates segment and the headquarters of Group-wide procurement for to this seg- ment. The proximity to the CEMs of customers and to suppliers is another locational advantage which the business partners highly appreciate. About 60% of the Group’s revenue is carried out via this company. The sales offices in America, Germany, Japan and Taiwan continued to guarantee good and close contact with customers in the financial year 2015/16. Plants and branch offices3. Austria China China South Korea India China Sales offices
  • 74.
    70 ATS AnnualReport 2015/1644 ATS Annual Report 2015/16 The ATS Group divides its operating activities into three segments: Mobile Devices Substrates, Automo- tive, Industrial, Medical and Others. The Mobile Devices Substrates segment mainly comprises the applica- tions of smartphones, tablets, notebooks and consumer products such as digital cameras. At the beginning of the financial year, the Industrial Automotive segment was renamed Automotive, Industrial, Medical. This change was made to underline the growing significance of business with medical devices in both therapy and diagnosis. The segment includes the industrial electronics, automotive, aviation security, and medical appli- cations. The Others segment covers the activities of the Advanced Packaging business unit (which is in the development phase) as well as higher-level Group activities. The Advanced Packaging business unit neither reaches the quantitative thresholds, nor are its opportunities and risks material to the Group as a whole. It is therefore not presented as a segment of its own in segment reporting. MOBILE DEVICES SUBSTRATES SEGMENT The applications of the Mobile Devices Substrates segment require technologically sophisticated printed circuit boards and permanent process and product innovations. The ongoing growth in demand for smartphones all over the world is the key growth driver. The growing performance of these devices would not be possible without HDI (high density interconnection) printed circuit boards. ATS is one of the leading suppliers of HDI technology around the world and ranked third in 2014 (source: Prismark, August 2015). With a revenue share of 59.3% (previous year: 57.3%), the Mobile Devices Substrates segment still remains the largest segment of the ATS Group. Mobile Devices Substrates segment – overview € in millions (unless otherwise stated) 2015/16 2014/15 Change in % Segment revenue 539.7 455.2 18.6% Revenue from external customers 452.5 382.1 18.4% Operating result before depreciation and amortisation (EBITDA) 126.4 127.5 (0.8%) EBITDA margin (%) 23.4% 28.0% Operating result (EBIT) 48.3 60.1 (19.7%) EBIT margin (%) 8.9% 13.2% Additions to fixed assets 271.8 126.8 114.3% Employees (incl. leased personnel), average (no.) 5,990 5,017 19.4% At € 539.7 million, revenue generated exceeded the previous year's figure of € 455.2 million by € 84.5 million or 18.6%. The very high demand from high-value mobile devices such as smartphones also continued in the first quarter of the current financial year and, combined with favourable exchange rates for ATS, led to significant revenue increases. The second quarter, however, benefited from the ongoing strong demand, the product launches in the mobile industry and the favourable exchange rates. The third quarter was character- ised by a return to normal growth rates and revenue managed to maintain the exceptionally strong level of the previous year. The fourth quarter, which is usually weaker as a result of plant closures due to the Chinese New Year, instead showed stable demand in the reporting period and was only slightly lower than the exceptionally strong level of the previous year. In terms of geography, there was a further revenue increase from our American customers. Furthermore, the segment’s revenue was positively affected by sustained high demand from the Automotive, Industrial, Medi- cal segment. The plant in Shanghai, which is allocated to the Mobile Devices Substrates segment, achieved significantly higher revenues with the Automotive, Industrial, Medical segment. At € 126.4 million, segment EBITDA was € 1.1 million or -0.8% below on the previous year’s figure of € 127.5 million and was negatively impacted in the fourth quarter by startup costs for the new site in Chong- qing. Given the stable and high demand throughout the year, very high utilisation could be achieved. Business development by segments4. Mobile Devices Substrates Development of revenue € in millions Mobile Devices Substrates Revenue from external customers by quarters € in millions Mobile Devices Substrates EBITDA Development € in millions Mobile Devices Substrates EBITDA by quarters € in millions 334.7 378.3 455.2 539.7 12/13 13/14 14/15 15/16 68.0 88.7 120.9 104.5 115.9 112.2 123.4 101.0 Q1 Q2 Q3 Q4 2014/15 2015/16 82.0 106.8 127.5 126.4 12/13 13/14 14/15 15/16 21.5 30.5 43.9 31.6 33.3 34.4 41.5 17.3 Q1 Q2 Q3 Q4 2014/15 2015/16
  • 75.
    71Group Management ReportGroupManagement Report 45 Furthermore, the ongoing good product mix and positive exchange rate effects led to an improved result that almost offset the higher startup costs at the Chongqing site. At 23.4%, the EBITDA margin for the Mobile Devices Substrates segment was 4.6 percentage points down on the previous year’s figure of 28.0%. Ad- justed for the results of the new Chongqing site, the EBITDA margin was 26.0% compared to 28.5% in the previous year and reflects a return to normality. The operating result (EBIT) decreased by € 11.8 million or -19.7% to € 48.3 million (previous year: € 60.1 million). Compared to the previous year, impairments on technologies no longer in use decreased by € 2.9 million to € 3.1 million (previous year: € 6.0 million). Depreciation was affected by the beginning of the depreciation of the substrate plant in Chongqing which was caused by the certification and the accompanying start of serial production. Before only the administration building was included in the depreciation. The EBIT margin decreased by 4.3 percentage points to 8.9% (previous year: 13.2%) due to the decrease in EBIT and increase in revenue. Additions to assets increased by € 145.0 million or 114.3% to € 271.8 million (previous year: € 126.8 million). Alongside additions of € 52.2 million resulting from ongoing investment in technology upgrades, replace- ments and expansion investments in the Shanghai plant, non-current assets increased by € 219.6 million at the new site in Chongqing. The first products of the new IC substrate line were successfully certified, and serial production was started. The further expansion of the site is on schedule. The second production line for IC substrates is currently being installed and serial production should start in financial year 2016/17. Addi- tionally, installation began of the first production line in the plant for substrate-like PCBs in the nearly com- pleted building of the plant which will also start operating in the next financial year 2016/17, resulting in initial revenue. AUTOMOTIVE, INDUSTRIAL, MEDICAL SEGMENT With revenue growth of € 24.9 million to € 326.7 million (previous year: € 301.8 million), the Automotive, Industrial, Medical segment generated an increase of 8.2%. This positive development was based, on the one hand, on continually increasing demand in the automotive sector (the share of electronic components in vehicles, e.g. for advanced driver assistance systems, continues to increase) and, on the other hand, on a stronger demand in the medical technology sector. Automotive, Industrial, Medical segment – overview € in millions (unless otherwise stated) 2015/16 2014/15 Change in % Segment revenue 326.7 301.8 8.2% Revenue from external customers 306.5 282.9 8.4% Operating result before depreciation and amortisation (EBITDA) 30.1 34.8 (13.5%) EBITDA margin (%) 9.2% 11.5% Operating result (EBIT) 19.2 25.9 (25.8%) EBIT margin (%) 5.9% 8.6% Additions to fixed assets 29.4 25.5 15.0% Employees (incl. leased personnel), average (no.) 2,616 2,489 5.1% Automotive, Industrial, Medical Development of revenue € in millions Automotive, Industrial, Medical Revenue from external customers by quarters € in millions 243.7 272.9 301.8 326.7 12/13 13/14 14/15 15/16 72.6 71.7 65.9 72.6 77.8 79.5 72.7 76.6 Q1 Q2 Q3 Q4 2014/15 2015/16
  • 76.
    72 ATS AnnualReport 2015/1646 ATS Annual Report 2015/16 Regarding the development of the Leoben, Fehring, Ansan and Nanjangud sites allocated to the Automotive, Industrial, Medical segment, refer to Section 3 in the Group Management Report. In general, financial year 2015/16 was characterised by stable capacity utilisation at a high level. The segment result was, however, affected by negative exchange rate effects in financial year 2015/16 which led to exchange rate based cost increases and had a severely negative impact on results. Overall, this resulted in an decrease in EBITDA of € 4.7 million or -13.5% to € 30.1 million (previous year: € 34.8 million). The EBITDA margin decreased by 2.3 percentage points to 9.2% (previous year: 11.5%). The operating result (EBIT) decreased by € 6.7 million or -25.8% to € 19.2 million (previous year: € 28.5 mil- lion). At 5.9%, the EBIT margin for the Automotive, Industrial, Medical segment was significantly below the previous year's figure of 8.6% due to the effects stated above. Additions to assets rose by € 3.9 million or 15.0% to € 29.4 million (previous year: € 25.5 million). These addi- tions were due to ongoing investment in technology upgrades, replacements and expansion at all sites. OTHERS SEGMENT Alongside general holding activities, the Others segment also includes the Advanced Packaging business unit which is in the development phase. This business unit deals with embedding active and passive electronic components in printed circuit boards by using the ECP® technology patented by ATS. The objective is to further miniaturise the printed circuit boards while improving heat distribution, electrical performance and service life. The business unit continued to significantly increase its revenue in financial year 2015/16, and to establish itself as a development partner to its customers. Due to the business unit still being small in size, it is still not reported as a standalone segment. Others segment – overview € in millions (unless otherwise stated) 2015/16 2014/15 Change in % Segment revenue 22.1 10.9 102.9% Revenue from external customers 3.9 2.0 90.2% Operating result before depreciation and amortisation (EBITDA) 10.9 5.2 108.8% EBITDA margin (%) 49.2% 47.8% Operating result (EBIT) 9.4 4.0 136.8% EBIT margin (%) 42.4% 36.4% Additions to fixed assets 1.9 2.1 (12.6%) Employees (incl. leased personnel), average (no.) 153 133 14.9% Automotive, Industrial, Medical EBITDA development € in millions Automotive, Industrial, Medical EBITDA by quarters € in millions 20.1 21.5 34.8 30.1 12/13 13/14 14/15 15/16 8.4 9.4 9.4 7.6 8.7 10.5 5.7 5.2 Q1 Q2 Q3 Q4 2014/15 2015/16
  • 77.
    73Group Management ReportGroupManagement Report 47 In today's environment, where change is the only constant, committed employees are especially important to us. To be the first choice for highly sophisticated technologies, a company like ATS must offer its employees prospects and clear opportunities for development; it must support them and challenge them. Managers at ATS play a particularly significant role in this respect. In order to embrace innovation as a company every day, we need people who are prepared to go in new directions and are open to thinking in terms of alternatives. HUMAN RESOURCES FACTS AND FIGURES In financial year 2015/16, ATS employed an average of 8,759 full-time equivalents including temporary employees. This means there were 1,121 more full-time equivalents compared to the average in the previous financial year. This increase is mainly attributable to the hiring of staff at the plants in Chongqing. Average number of full time equivalents (incl. leased personnel) 2015/16 2014/15 Change Mobile Devices Substrates segment 5,990 5,017 973 Automotive, Industrial, Medical segment 2,616 2,489 127 Others 153 132 21 Total Group 8,759 7,638 1,121 EXCELLENCE IN LEADERSHIP Three principles have been defined for excellence in leadership based on the ATS vision and mission: OPEN-MINDEDNESS, COMMITMENT and RESPONSIBILITY. We consider leadership to be an essential part in realising our vision and achieving our mission. Studies clearly show that good leadership practices have a significant influence on employee commitment and dedication. Our leader- ship values provide all of our managers with a framework that enables them to live effective leadership. In the past financial year, we offered our first-level managers the opportunity to attend modules with a focus on communication and a culture of feedback, which they also took advantage of. The improved dialogue they initiated leads to better mutual understanding and provides space for reflection. Open and appreciative feed- back creates fertile ground for frictionless, open and dynamic development for the entire organisation. As a result of positive feedback, this initiative will be extended to the next level of management in financial year 2016/17. SUPPORT AND CHALLENGE Communication and feedback are essential instruments for ensuring the commitment of our employees and their desire to grow, both now and in the future. Managers at ATS therefore have a responsibility to create an atmosphere of lifelong learning and a culture of dialogue for every single employee. Their core responsibilities include talent management, continuous development of skills and abilities, ongoing development of an open, two-way feedback culture, as well as providing support and challenge for each individual employee. The annual staff appraisal meeting is the basic tool that helps ATS managers to obtain a structured view of the potential, experience and innovative ideas of their employees. In the staff appraisal meeting, goals are agreed, based on the company's goals, for each employee in line with their responsibilities for the following financial year. In addition, potential and development opportunities within the current position as well as possible career paths are discussed. It is the responsibility of every manager to support and challenge their employees according to their interests and potential. In annual evaluations based on this, employees with the greatest development potential are selected for further career steps and the next steps required are decided upon. ATS employees have the opportunity to earn additional qualifications through internal and external training programmes, workshops and coaching. Internally, we provide introductory training for new employees to familiarise them with the market, our products, the organisational structure and procedures of ATS, and our corporate values. Training programmes specific to ATS are provided by internal specialists. Cross-functional, international and intercultural training supports our internal connections, the optimisation of processes and a Group5. 5.1. Employees
  • 78.
    74 ATS AnnualReport 2015/162 ATS Annual Report 2015/16 continuous transfer of knowledge. Basic management training programmes include leadership principles and training on the ever-current topic of change management and strategic development. A number of important modules are offered as part of customised, site-specific training catalogues. In the past financial year, ATS began a customised programme of training based on a Lean Management (efficiency) and Six Sigma (effectiveness) approach in the areas of administration, research and production. The Lean Six Sigma initiative at ATS is named iPOK internally (Implementation of Practice Oriented Knowledge) and encompasses all employee and organisational levels. The training consists of a theoretical and a practical section, with the latter designed to firmly anchor the theoretical learnings within the organisa- tion for the long term. iPOK will help ATS achieve its vision and mission by means of improvement projects and, moreover, have positive effects on our employees' work environment. Across all sites, a total of 52 employees have been certified or are participating in Black Belt training (project managers with cross- functional projects and around 140 hours of training) and 81 employees are certified or participating in “Green Belt training (project managers with departmental projects and around 40 hours of training). There have been 133 Lean Six Sigma projects initiated as a result of this certification and training. ATS offers comprehensive apprenticeships for the skilled workers of tomorrow, primarily in the areas of mechatronics, laboratory technology, physics laboratory, mechanical engineering and metal technology, but also in the administrative area. At the end of the financial year, we employed 27 apprentices in Austria and one in Germany, and, during the past financial year, 11 apprentices started their apprenticeship with ATS. So as to generate excitement among young people for technical professions at ATS, we participate in career fairs specific to our target groups and offer school children a direct insight into production by means of our ongoing, interactive ATS High Technology Experience as well as introductory and seasonal internships. ATS also positions itself as an attractive employer for young academics. We provide information to them at career fairs and, in close cooperation with universities, we offer bachelor and master thesis projects. With our first International Talent Programme, which enabled training in Austria for the seven participants in eight modules over a period of 12–18 months, we were able to train talented young academics from different countries and make them fit for our sites in China. We are currently recruiting the second generation for the international talent programme – this time for assignments in China and India. The tremendous interna- tional interest in this programme is evidenced by the applications received from 63 countries. In the past financial year, around € 1,926 thousand was invested in external training and continuing profes- sional development. The increase of €1,056 thousand compared to the previous year is primarily attributable to the specialised training of the new employees who were recruited in the course of establishing the plants in Chongqing. In addition, ATS also invested in university training for employees in China and in global lead- ership and iPOK Lean Six Sigma initiatives. On the one hand, these figures reflect the importance of the quali- fications of new labour forces, but they also reflect the focus we place on efficiency, effectiveness and leadership. Expenditure on external training sessions € in thousands 2015/16 2014/15 Change in % Mobile Devices Substrates segment 1,147 384 198.9% Automotive, Industrial, Medical segment 319 284 12.5% Others 460 202 127.3% Total Group 1,926 870 121.5% DIVERSITY MOBILITY As a company that operates globally, diversity among our employees is a basic requirement for our success. ATS promotes equal opportunities with regard to career paths and remunera- tion or training, irrespective of age, gender, background, religion, sexual orientation, ethnicity, disability, and religious or political belief.
  • 79.
    75Group Management ReportGroupManagement Report 49 At the end of the financial year, the proportion of female employees at ATS was 35%. The female propor- tion in Europe, at 43%, and the United States, at 37%, is still significantly higher than in Asia, where the pro- portion of females within ATS is 33%. Women constitute 10% of the employees reporting directly to the Management Board of the ATS Group. As an international company, ATS employs people from 45 nationalities. We offer a variety of career options at an international level to our employees, and also to external applicants – through our “International Talent Programme”, for example – and we value professional mobility. We also promote cooperation across sites and provide intercultural training entirely in the interest of maintaining a learning organisation and in accord- ance with our leadership principle of Open Mindedness. The average age at ATS is 31 years. This is primarily a result of the large number of young employees in China, where the average age is 29. In Europe and the USA, the average age is 39 and 45 years, respectively. The average term of service Group-wide is 5.4 years based on each of the sites. It is higher in Europe, at 12.2 years, than in Asia, at 4.2 years. This is also attributable to our sites in China, and mainly to the ongoing build- up of employees in Chongqing. CODE OF BUSINESS ETHICS AND CONDUCT ATS has made a voluntary commitment to corpo- rate social responsibility (CSR) measures, and to the Electronic Industry Citizenship Coalition (EICC). In align- ment with the Triple Bottom Line approach, we have a responsibility to conduct business sustainably and in the interests of all stakeholders from an economic, ecological and social point of view. Clear ecological stand- ards and goals and the creation of an appropriate environment for employees as well as the company allows us to implement our environmental, economic and social goals equitably and simultaneously. We are proud that the same standards for the environment, health and safety apply – and are put into practice – at all of our plants. The Code of Business Ethics and Conduct requires all employees to conduct themselves in a responsible and respectful manner and to comply with the standards set by ATS. This results in transparen- cy and mutual trust, and at the same time appeals to the personal responsibility of every individual. Further details with regard to our sustainability activities can be found in the chapter “Sustainability” and in the cur- rent Sustainability Report. REMUNERATION SYSTEM An important factor for motivating employees and for recruiting and re- taining new talent, alongside remuneration in line with the market, is the opportunity to participate in the financial success of the company. Based on the ATS global bonus system, individually and collectively agreed bonus payments are distributed whenever specific hurdle rates (defined minimums for key data) have been achieved. The basic requirement for participation is a positive EBIT for the Group as a whole. The hurdle rate itself is coupled with achievement of a certain EBIT figure in relation to the budgeted goals of the respective area of responsibility. The level of the payment will depend on ROCE, Cash Earnings, the Innovation Revenue Rate (IRR) as well as the individual performance of each member of staff. Details on how ROCE, Cash Earnings and the IRR are determined can be found in Section 1.3. Financial position in the Management Report. The bonus system also ensures that, in more challenging economic times in which set aims were not achieved, bonus payments will be either reduced or entirely suspended. OUTLOOK Excellence in leadership has an enormous impact on sustainable business success. The execu- tive leadership programme – the further professional development of management in the interest of sustain- ability – is therefore a significant area of focus for financial year 2016/17 and the years that follow. Based on new standards, we will also aim for greater transparency and permeability with respect to our training and career paths in all areas. The introduction of an expert career path alongside the management career path will be an import pillar. Our goal is clear: we aim to create conditions for our employees that produce excep- tional commitment to sustainably achieving our ambitious goals. Proportion of female employees in % 35% 33% 43% C B A A - Europe and USA B - Asia C - Total
  • 80.
    76 ATS AnnualReport 2015/1650 ATS Annual Report 2015/16 Conduct business responsibly and sustainably. This is a clear commitment, which ATS has expressed again in the past financial year by means of the rigorous continuation of our corporate and sustainability strategy and the activities associated with it. The significance of sustainability is clearly reflected in our corporate mission:  We reduce our ecological footprint  We care about people  We create value We create value that extends beyond a purely economic view. European standards at all sites, ambitious key performance indicators for resource consumption and emissions, and a clear commitment to good corporate citizenship are among the ways ATS expresses sustainable management. At ATS, effective sustainability strategies centre on those areas that stand in the company's direct sphere of influence and are found within the sustainability triangle of economy, ecology and social responsibility. So as to satisfy this requirement, all important aspect groups were evaluated in a comprehensive process and the key topics of the ATS sustainability strategy were jointly developed though a materiality analysis. The following aspects from the materiality analysis define the key topics of ATS sustainability activities: 5.2. Sustainability resource efficiency raw materials scarcity water consumption renewable resources ecological responsibility of suppliers waste recyclability of products recycling rate of input materials hazardous substances energy consumption carbon footprint renewable energy product design: impact on energy consumption training health care social responsibility of suppliers accident preventionequal opportunities workers council communication with employees regional social responsibility business ethics business related impactlow work environment related impact high high
  • 81.
    77Group Management ReportGroupManagement Report 51 ENERGY AND CARBON FOOTPRINT We established processes at all of our plants that sustainably ensure more energy-efficient operations. In this respect, the ongoing technological development in the print- ed circuit board industry presents a great challenge for energy efficiency: new processes need time for evalu- ation and optimisation of energy efficiency after the qualifying phase. Toward the end of financial year 2014/15, the energy management standard ISO 50001 was introduced for both sites in Austria. Within this framework, analyses of the potential were conducted in the financial year 2015/16, which found an energy savings potential of around 7 GWh. Comparable efficiency analyses are already being planned for the sites in Asia and are expected to be implemented in financial year 2016/17. Energy efficiency is reflected in the calculated CO2 emissions because a significant portion of total emissions is based on the indicator purchased electricity. In a four-year comparison, the CO2 at ATS calculated as CO2 per square metre of printed circuit board produced declined from 51 kg to 50.7 kg per m 2 . In the past financial year, however, we were unable to achieve the set target of reducing CO2 emissions by 5% compared to the previous year. This development is based on two factors: due to the high outdoor temperatures during the summer months of the past year, greater energy needs for process and building cooling were recorded. This resulted in higher CO2 emissions. In addition to this, the production of ever more complex printed circuit boards with additional functional requirements also requires more energy consumption per m 2 of printed circuit board produced. We are working hard to implement further improvements for the coming year. WATER Special attention continued to be paid to water consumption in the past financial year because the production of printed circuit boards is intensive in terms of water consumption. We therefore placed our focus, as we did in the energy area, on highlighting the major consumption areas through an effective meas- urement system and implementing the resulting optimisations – to the extent permitted by the production parameters. By means of continuous improvement projects, we were able to reduce our global water consumption con- siderably. Details can be found in the Sustainability Report 2015/16. RESOURCES Material costs represent a significant share of the production cost of a printed circuit board. Efficiency improvements in this area have not only an economic impact. Most importantly, we reduce unnecessary waste and improve our recycling rate. Material consumption in the following table refers to the plants in production during financial year 2015/16. Purchase of significant materials Unit 2015/16 2014/15 2013/14 Gold kg 593 596 484 Copper*) t 3,362 3,550 3,144 Laminate million sqm 13.5 13.4 12.5 Chemicals tsd. t 96.2 92.9 87.2 ATS AS A PLACE OF LEARNING As in past years, one of our main priorities is the training and further development of our employees. In-depth training and corresponding experience not only benefits our employees, who thereby set the cornerstone for their further development within the company, but also benefits the quality of our technologies, the efficiency of our actions, and the relationships with our custom- ers. A detailed presentation of the measures and programmes, as well as key indicators, is provided in the Human Resources section. Carbon footprint in kg CO2 per sqm weighted PCB Freshwater consumption in litres per sqm weighted PCB 51.0 50.7 49.0 50.7 12/13 13/14 14/15 15/16 834.7 783.9 734.0 718.6 12/13 13/14 14/15 15/16
  • 82.
    78 ATS AnnualReport 2015/1652 ATS Annual Report 2015/16 SHAPING THE FUTURE BY THINKING AHEAD Anticipate the future. This is the basis of our vision First choice for advanced applications. Although we are faced with intense competition, especially in Asia, and generally constant price pressure, we do not compromise when it comes to the highest standards in all of our spheres of influence. Be it implementation of the work and safety standard OHSAS 18001 at all of our sites, which is now complete, or with regard to environmental and quality standards: we want to be the industry benchmark at all of our sites and simultaneously be among the most profitable manufacturers of printed circuit boards. In the area of occupational safety, we were able to record an improvement compared to the previous year. We consider our focus in this area to be especially important and we will always work to improve the existing, extensive safety measures. Creating awareness among our employees plays a large role in this respect. For this reason, we launched the initiative LIFE – Living in an Injury-Free Environment at the Chongqing site. Through various measures, LIFE ensures that the issue of health and safety is ever present in the daily work routine. Due to our global presence, ethical principles among our employees and partners is a major priority. In ac- cordance with the code of conduct of the EICC, an electronics industry organisation, we ensure that a work environment is created at all of our plants that reaches beyond the legal requirements, one in which employees count as people. We provide this information to our business partners though an annually recur- ring self-disclosure. We revised our Code of Business Ethics and Conduct in the past year. The code was adapted to the require- ments of the EICC, the code of conduct of the electronic industry association. The code therefore reflects the most recent developments in our corporate ethic. Thus, we ensure that all of our employees are sensitised to important corporate issues such as preventing discrimination, anti-corruption or environmental matters and occupational safety, and that they conduct themselves in accordance with these rules and the expectations of the company. All employees commit to this through their signature. The management at the respective sites are required to continuously monitor compliance. For ATS, sustainability is an important contributor to the successful future of our company. Specific goals and measures can be found in the Sustainability Report 2015/16. Number of accidents at work Working hours lost per one million hours of work as of absence of more than one day 5.7 4.0 6.1 5.0 12/13 13/14 14/15 15/16
  • 83.
    79Group Management ReportGroupManagement Report 53 HIGHLIGHTS IN THE FINANCIAL YEAR 2015/16  19.6% of total revenue generated by technologically innovative products that have been on the market for less than three years (Innovation Revenue Rate)  Development project for the production of first generation IC substrates successfully completed – signifi- cant, forward-looking innovation for ATS  Increased use of Industry 4.0 technologies and processes in production. The key sentence in the ATS Mission: “We industrialise leading-edge technologies is having an impact. ATS generated about 20% of its revenues with innovative products launched onto the market during the last three years. These products are the result of our consistent business and innovation strategy which has the further expansion of technological leadership as its goal. ATS has set the target of achieving an Innovation Revenue Rate (IRR) of at least 20% each year. This is intended not only to make a significant contribution to revenue generation, but also as an expression of our major point of differentiation from the competition. Last year, this figure was 29.2%. The decline is attributable to the maturity of certain generations of technology during financial year 2015/16. The electronics industry is currently undergoing profound change. This was triggered by the slowdown in the speed of development in processor technology. (Remark: Moore’s Law, which says that the complexity of integrated circuits always doubles within 12 to 24 months, is no longer valid.) This creates completely new opportunities for certain segments of the electronics supply chain: specifically for the packaging, substrate and printed circuit board industry. Many new functions and features can be produced with significantly less development expense than would be needed to produce them on chips. The further development in our areas of business will have an enormous impact on the entire electronics market in the next several years. ATS is anticipating these trends by taking them into account in our short- and long-term focus areas for development. RD FOCUS AREAS IN THE PAST FINANCIAL YEAR  Flexibility/Design: integration of electronics in the smallest of spaces and interconnection of electronic modules  Miniaturisation/Weight reduction: devices are becoming increasingly smaller, lighter and more powerful – interconnection electronics need to create the foundation  Modularisation/Packages: new, highly integrated modules to achieve the tightest packing density and highest performance capacity for a simplified value creation chain  High speed/High frequencies: contactless communication of people and devices with large volumes of data and radar applications for self-driving cars and work equipment  Power electronics/High currents: energy-efficient mobility implies the electrification of mobility – mechani- cal solutions are being replaced by energy-saving electronic solutions  Production processes/Business models: use of data to optimise and improve production processes; integra- tion of new and incremental steps in the value creation chain and more efficient use of resources in pro- duction Research and development costs in financial year 2015/16 amounted to € 95.5 million. This corresponds to a research rate (i.e. ratio to revenue) of 12.5% compared to 8.7% in the previous year. The figure for financial year 2015/16 was heavily influenced by high development costs for the substrate technology. Adjusted for this special project, the research rate was 4.5%, and the associated research and development expenses increased by € 6.3 million or 22.3% to € 34.4 million (previous year: € 28.2 million). This research rate is the basis for securing our position as a technology leader in the coming years. 5.3. Research and development Innovation Revenue Rate (IRR) in % 19.2 26.5 29.2 19.6 12/13 13/14 14/15 15/16
  • 84.
    80 ATS AnnualReport 2015/1654 ATS Annual Report 2015/16 Our innovative strength and long-term competitiveness is also demonstrated in the number and quality of our patents. In financial year 2015/16, ATS submitted 46 new applications for patents. ATS now has 162 patent families, resulting in 212 granted patents. We ensure efficiency in our development through close cooperation with customers, suppliers and research institutions. Internally, ATS pursues a two-stage innovation process. Development activities in the fields of materials, processes and applications are carried out at the ATS research institutions in Leoben to the point where the basic technological feasibility has been demonstrated. This area thus covers applied research and technology evaluation. After that, it is the responsibility of the local departments that have responsibility for technology development and implementation situated at ATS sites worldwide to continue the experimental development of products and processes in order to then integrate them within existing production opera- tions. HIGHLIGHTS FROM RESEARCH AND DEVELOPMENT PROJECTS In February 2016, after around 17 months of extensive development and intense effort, certification was completed for serial production of the first generation of IC substrates at Plant 1 in Chongqing. To obtain this certification, all facilities and hun- dreds of process steps had to be precisely defined and test substrate produced under serial-production con- ditions. This step signified the start of serial production for the first of two production lines, for the present. ATS will be manufacturing IC substrate – so-called flip-chip ball grid array substrates – for use in micro- processors. ATS thus becomes the first manufacturer of high-end IC substrates in China. In the area of high-end high density interconnects (HDI), currently the core business, ATS continued to develop the next generation of printed circuit boards, known as substrate-like printed circuit boards. The development of this technology made further advances at our Shanghai site by means of a test line, and even is leading to technological enhancement for the entire site. Serial production will take place at an additional plant at the site in Chongqing. The significant technological leap that comes with substrate-like printed circuit boards will be introduced in the second half of 2016. It will enable an entirely new generation of products with respect to miniaturisation and increasing the performance capacity of the products in our core business. The trend continues toward higher currents on the printed circuit board and the related need for integrated thermal management in printed circuit boards and electronic modules, and clearly shows that the develop- ment by ATS of the past years now is proving to be fertile ground. The driver behind this trend is rising electro-mobility and the future vision of autonomous driving. The new ATS solutions for power electronics, which were developed as part of an international network, have generated great interest from customers. ATS packaging solutions have been mirrored internationally, for example in the Little Box Challenge put forth by Google for the smallest 2kV power inverter. As a result of the development work carried out by ATS, it was possible to reduce the volume by a factor of more than 10 compared to today's conventional inverters. ATS focuses increasingly on the deployment of Industry 4.0 methods in its production processes. Data from the manufacturing process is drawn upon to optimise product properties and the efficiency of the process flow. In recent years, ATS has already introduced a Manufacturing Execution System (MES) at some sites, enabling process monitoring and control with data in real time. In order to progress even further with these methods and introduce additional applications, ATS is part of a European consortium consisting of 37 part- ners from different positions along the electronics value creation chain. This is where, in the next three years, new and coordinated solutions will be developed that reach beyond the current boundaries in the value creation chain, which cannot be described here for competitive reasons. Number of patents granted in units 124 153 174 212 12/13 13/14 14/15 15/16
  • 85.
    81Group Management Report 5 4 3 2 1 GroupManagement Report 55 PRINCIPLES, STRUCTURES AND PROCESSES Risk and opportunities management is a fundamen- tal part of conducting business within the ATS Group. The target to increase enterprise value involves not just opportunities but also the taking of risks as well. In order to identify risks at an early stage and deal with them in a pro-active manner, and in accordance with the Austrian Code of Corporate Governance (ÖCGK), ATS operates a Group-wide Risk Management (RM) system, an Internal Control System (ICS) in accordance with COSO standards, as well as Internal Audit based on the IIA standard. From an organisational perspective, the Risk Management, Internal Control System and Internal Revision functions come within the responsibility of the CFO. The Internal Auditor and Group Risk Manager report to the full Management Board as part of a monthly Management Board meeting. The inclusion of the Super- visory Board takes place within the framework of the twice yearly Audit Committee meeting. The proper functioning of the risk management system is assessed once a year by the external auditor in the course of the annual audit of financial statements pursuant to Rule 83 ÖCGK. The risk management process shown in Figure 1 is conducted at least twice a year. Risk management is con- ducted based on the risk strategy and risk appetite at the hierarchy level assigned to the relevant level of risk. (see Figure 2): Figure 1: ATS Risk Management Process RM: Risk Management; ICS: Internal Control System; BU: Business Unit Figure 2: ATS Risk Levels and Risk Management RISK MANAGEMENT IN 2015/16 In addition to the expansion of the ATS risk map and deeper integration of risk management at all sites, a consistent Group-wide quantitative evaluation method for all risks and opportunities was established in the past financial year. Uniform Group-wide documentation as part of the internal control system is ensured by the risk management software developed by ATS for all signifi- cant processes and sites. As a result of further development of this software, also in the past financial year, the execution and documentation of the entire risk management process now takes place through this appli- cation as of the start of financial year 2016/17. Risk and opportunities management6. Risk management process Risk management software Risk strategy Risk strategy: defined by the Management Board and persons responsible for processes. Risk identification: Group-wide survey with subsequent evaluation. Immediate reporting of significant new risks (≥3). Risk evaluation: consistent Group-wide evaluation of all risks with respect to their monetary impact, probability of occurring, and resulting risk rating of 1 (low) – 5 (very high). Aggregation Reporting: aggregation and regular reports on all significant risks (risk level ≥3) to the Management Board and Audit Committee by the Risk Manager. Risk Mitigation Monitoring: in accordance with defined reporting and decision levels (based on risk level, see Figure 2). Risk management software: Group-wide for risks and ICS controls. Reporting Aggregation RISK AnalysisRISK CONTROL Identification Monitoring Evaluation Mitigation Risk level Risk controlling Process Risk appetite risk level: a maximum risk exposure of 50% of equity is intended. The ATS risk levels are derived from operating cash flow as an indicator of the risk capacity of the Group. ICS RM: management of process risks (risk level 1-2) supported by the internal control system. At Group level, relevant risks (risk level ≥3) are managed and reported through the risk management process. Risk Mitigation: clear assignment of responsible decision levels based on risk level (see left) Supervisory Board Management Board BU Management Plant Management Process Management RM ICS
  • 86.
    82 ATS AnnualReport 2015/16 Risk strategy Significant risks opportunities Trend Risk mitigation opportunity realisation Strategy Sales price development Capacity utilisation, technology development, investments (substrate substrate-like PCB) § Consistent focus on high-end technology and target applications § Future technological and strategic site alignment § Technology development projects and technology roadmap § Strict project control, periodic strategy workshops Market Market and segment development Development of key customers Sales strategy and implementation § Balanced segment portfolios and diversification of the customer portfolio § New customer acquisition and share increases with existing customers § Consistent acquisition of defined target applications PROCUREMENT Development of procurement prices Single-source risk Supply chain risk § Procurement strategy (negotiation, allocation, technical changes) § Single-source strategy; supplier risk evaluation and multi-sourcing § Supply chain optimisation and regional diversification BUSINESS ENVIRONMENT Catastrophe, fire Political risk § Internal external audits, emergency practice, insurance § Business programme management, insurance Operations Quality performance Intellectual property Technical project management Operating costs § Black Belt programme, continuous quality improvement measures § Continuous expansion and protection of the IP portfolio § Rigorous technical project management § Cost reduction programmes at all sites OrganiSation Loss of key personnel § Employee retention, deputy regulation and succession planning Finance Foreign exchange risk Financing liquidity Tax risk § Natural FX hedging through long-term cash flow planning § Long-term planning for financing and liquidity, interest swaps § Continuous monitoring of compliance with tax laws 56 ATS Annual Report 2015/16 OPERATIONAL RISK MANAGEMENT The risks, uncertainties and opportunities facing the Group are generally based on worldwide developments in the printed circuit board and substrate market. An over- view of the ATS risk categories, significant individual risks, risk mitigation measures and the expected trend is shown in Figure 3 and explained in further detail below. IP: Intellectual Property; FX: Foreign Exchange; CF: Cash Flow Figure 3: ATS Risk Categories, Significant individual Risks, Risk Trends and Risk Mitigation Measures INVESTMENTS In order to make the most of growth potential and remain competitive, ATS undertakes substantial investments in new forms of technology as well as in the further development and capacity ex- pansion of existing technologies. There are particular opportunities to be gained from, but also risks to be taken into account, in association with, entering into the substrates business. Entering this new business segment was carried out through a strategic partnership with a leading global semiconductor manufacturer. Furthermore, the location at Chongqing in China offers competitive advantages over the largely Japanese dominated competition with respect to production costs. Incorrect assessments of technological developments, changes in demand, and negative price developments can have severe adverse effects on the intrinsic value of investments. These effects could relate, in particular, to entry into the substrate business, building capacity for substrate-like printed circuit boards in Chongqing, but also to all current ATS business activities as well. COMPETITION The clear focus on the high-tech segment coupled with the highest quality standards and consistent cost controls meant that ATS was able to achieve a competitive advantage over a majority of its competitors in the HDI (high-density interconnect) technology segment. This focus enabled ATS to success- fully withstand the effects of intense competition, overcapacity in the market, and persistent ‘commodifica- tion’ (with a corresponding margin reduction). Complementing this was the successful transfer of HDI tech- nology from smartphone applications and other mobile devices to further applications, such as those in the automotive industry. The opportunities related to Austrian plants of ATS are based on high flexibility, high quality standards and the ability to react very quickly to changing specifications and technologies. These capabilities are absolutely imperative for prevailing in the competitive environment, especially in the industrial segment, which is char- acterised by diverse technological requirements among a large number of customers. To ensure our competi- Strategy
  • 87.
    83Group Management ReportGroupManagement Report 57 tive edge, new forms of technology and projects are constantly pushed forward in close cooperation with our customers. Advanced Packaging, a technology which was introduced to the market under the ECP® brand name, also offers considerable potential in itself, and the successful industrialisation of this technology continues to be driven forward. Competitor risks arise due to potential quality improvements and technological developments in countries with low production costs. This could mean thas ATS sites, especially in Austria and possibly also at other manufacturing locations like those in China, might become less competitive. KEY CUSTOMERS With the help of advanced production technologies and high quality standards, the ATS Group has managed – largely due to its capacities in Asia – to establish itself as a reliable provider to some of the world’s most renowned players in the electronics industry. The revenue generated with the five largest among these customers accounts for 56% of total revenue. Our long-term relationships with these customers also offer excellent opportunities for the future. However, concentration of this kind also poses risks in the event that there is a significant reduction in business volume from these customers. Therefore, the ongoing expansion of ATS's competitiveness as well as the continued broadening of its customer base and development of new product segments are of enormous significance to our ability to quickly compensate a possible decline in the sales volume of any one key customer. MARKET PERFORMANCE Emergence of a weak market environment in financial year 2016/17 could have an adverse impact on the Group’s results. However, an upward trend in the economy could also lead to increased business opportunities. The diversified positioning throughout Mobile Devices Substrates as well as the automotive, industrial and medical product segments provides some mitigation of market risks result- ing from their different production cycles. PROCUREMENT PRICES Price fluctuations in energy and raw materials (gold, copper and laminates) can have both a positive as well as a negative impact on achievable margins in the short term. Currently, the trend is positive, and will be further reinforced through targeted implementation of the procurement strategy. SOURCING The sourcing strategy of ATS focuses on a wide and clearly diversified base of carefully se- lected suppliers in order to reduce dependencies on individual suppliers. The Group enjoys long-standing and stable customer-supplier relations with its main key suppliers with particular expertise and competitive stand- ings. To avoid supply shortages, ATS conducts rigorous supplier risk management, taking account of regional cluster risks, various supply routes, and alternative procurement options. So, with few exceptions – such as in the IC substrates area for which the suppler base is smaller – alternative supplier options are available in order to respond to supply risks. LOCATION SPECIFIC RISKS The large majority of ATS’ operating activities is based at sites outside of Austria, particularly in China. This means that the Group might be subject to potential legal uncertainties, state intervention, trade restrictions or political unrest. Irrespective of the above, any production site of the Group may furthermore be exposed to disruptive events such as fire, natural disasters, acts of war, shortages of supply or other elementary events. The termination of land use rights, permits or lease contracts of specific plants might also have a negative impact on the production output of the Group. To minimise the effects of such risks, the Group has instituted business continuity management. The Group conducts active insurance management by means of weighing the risks and associated costs. It has con- cluded insurance contracts to the extent customary for a company of this size if such contracts are available at costs which are reasonable in relation to the impending risks. Market Procurement Business environment
  • 88.
    84 ATS AnnualReport 2015/1658 ATS Annual Report 2015/16 COMPLIANCE Any amendments to regulatory requirements, such as the prohibition of specific processes or materials, might lead to a rise in production costs. ATS might be subject to payment of substantial penal- ties should any breach of customer confidentiality agreements or statutory provisions occur. ATS has im- plemented organisational measures aimed at preventing or minimising the occurrence of compliance risks. The extension of such measures is ongoing. As a rule, ATS follows a zero-tolerance policy and expects 100% compliance on the part of its employees with all applicable laws and regulations. FRAUD, DATA SECURITY AND CYBERCRIME The rising number of ever-more professional at- tempts at fraud and cybercrime has also been noted by ATS. To successfully prevent attempted fraud, in the past, internal controls were further intensified in the financial year 2015/16 and initiatives to sensitise em- ployees with regard to such fraud schemes were increased. Moreover, ATS continues to expand its data and IT security measures on a regular basis. QUALITY PERFORMANCE As in the past, it will be the high quality of products, adherence to delivery deadlines and service quality which will offer the Group a chance to differentiate itself from the competition and exploit growth opportunities in the future. Any technical defects, quality deficiencies or difficulties in delivering products may expose ATS to warranty claims, claims for damages and contractual penalties, resulting in product recalls and the loss of customers. ATS has established a quality management system designed to rule out deficiencies in product quality and their negative consequences as far as possible. Fur- thermore, the Group is insured against major risks by virtue of an (extended) product liability insurance policy. INTELLECTUAL PROPERTY ATS endeavours to exploit any opportunities for obtaining intellectual property as well as gaining access to promising patents through the development of its own projects, cooper- ation schemes with partners and investments. Risks arise if ATS fails to protect its intellectual property, thus enabling the competition to utilise these technologies. Legal disputes about intellectual property can prevent ATS from using or selling disputed technologies. Furthermore, legal disputes with regard to the unauthor- ised use of external intellectual property can have considerable negative financial consequences. The new IC substrates segment in particular bears risks in this regard, as ATS needs to further increase its relevant expertise in this field. TECHNOLOGY AND PROJECT DEVELOPMENT The Group's know-how regarding project and technology development, particularly in China, enables the Group to exploit further promising growth oppor- tunities, such as the establishment and expansion of capacity for IC substrates and substrate-like printed circuit boards in Chongqing. At the same time, however, this entails special risks, also in view of the substan- tial volume of investments in the Chongqing project. Complications in the further technological development and project implementation might result in major burdens for business development as well as existing finan- cial and administrative resources. With the successful qualification/certification of the substrate plant in Chongqing, the focus in the coming financial year will be on the ramp-up of serial production and continuous performance improvement, as well as the qualification of additional production lines. COST CONTROL Strict cost control at all sites is essential for maintaining the competitiveness and profit- ability of the Group. Rising costs, for example caused by a substantial increase in wage costs, particularly at the production sites in China, might have a negative impact on the competitiveness of the Group. EMPLOYEES The collective industry experience and management expertise of the employees of the ATS Group form the foundation for taking advantage of future opportunities. The business of the Group might suffer if employees in leading positions were to terminate their employment relations with ATS or if ATS were unable to continue to recruit highly qualified engineering, sales and administrative personnel and retain them long-term. ATS continuously develops strategies for retaining key employees, recruiting valuable personnel and further expanding the skills of its staff. Operations Organisation
  • 89.
    85Group Management ReportGroupManagement Report 59 EXCHANGE RATE RISKS Exchange rate fluctuations in EUR, RMB and USD – and to a lesser extent in JPY, KRW and INR – can have considerable positive or negative effects on the results of the Group. To mini- mise these effects, the Group employs a hedging strategy by means of the long-term forecasting of cash flows in each currency. FINANCING AND LIQUIDITY To secure the financial needs for the expansion strategy, the Group uses long-term financial and liquidity planning. Interest rates are hedged centrally for the Group as a whole through Group Treasury in part with the use of appropriate financial instruments. For more information on financial, liquidity, credit and foreign exchange risks, please refer to Note 20 Addi- tional disclosures on financial instruments in the notes to the consolidated financial statements. TAX RISK The Company is active on a global basis and thus subject to different tax systems. Unless the requirements for the formation of a provision or liability are met, both national and international tax risks are incorporated within financial risks and monitored accordingly. At present, the material tax risks are in relation to the companies in India. In order to minimise future task risks, the Group continuously monitors compliance with national tax laws and international guidelines such as the BEPS (Base Erosion and Profit Shifting) guide- line of the OECD and makes any necessary adjustments. Finance
  • 90.
    86 ATS AnnualReport 2015/1660 ATS Annual Report 2015/16 The accounting-related Internal Control and Risk Management system is an integral part of the Group-wide risk management system. According to the framework concept of COSO (The Committee of Sponsoring Or- ganization of the Treadway Commission), under the concept of Company-wide risk management, the actual risk management as well as the Internal Control System (ICS) are subsumed. The main criteria of the Risk Management, the Internal Control System and Internal audit of ATS are specified in a Group-wide risk man- agement and audit manual. The documentation of the internal controls (business processes, risks, control measures and those responsi- ble) is made principally in the form of control matrices, which are archived in a central management data- base. The accounting-related Internal Control System includes principles, procedures and measures to ensure the compliance of accounting in terms of the control targets described for financial reporting. The accounting procedures are documented in separate process instructions. As far as possible, these pro- cesses are standardised across the Group and are presented in a standardised documentation format. Addi- tional requirements for accounting procedures result from specific local regulations. The basic principles of accounting and reporting are documented in the process descriptions and also in detailed process instruc- tions, which are also filed in the central management manual. In addition, guidelines on measurement proce- dures and organisational requirements in connection with the processes of accounting and preparing the financial statements are compiled and updated on a regular basis. Schedules are set in accordance with Group requirements. The internal financial reporting is done on a monthly basis as part of the Group reporting, with the financial information being reviewed and analysed by the Group Accounting and Group Controlling department (part of Group Finance Controlling). The monthly budget/actual variance with corresponding comments on the results of the seg-ments, of the plants as well as of the Company, is reported internally to the executives and to the members of the Supervisory Board. The annual preparation of the budget is carried out by the Group Controlling department (as part of Group Finance Controlling). Quarterly forecasts are drawn up during the year for the remaining financial year based on the quarterly results and current planning information. The forecasts with comments on the budget comparison and presentations on the impact of opportunities and risks up to the end of the financial year are reported to the Supervisory Board. In addition to regular reporting, multiple-year planning, project-related financial information or calculations on investment projects are prepared and submitted to the Supervisory Board. Internal Control and Risk Management7. System with regard to accounting
  • 91.
    87Group Management ReportGroupManagement Report 61 CAPITAL SHARE STRUCTURE AND DISCLOSURE OF SHAREHOLDER RIGHTS As of the reporting date at 31 March 2015, the Company's ordinary shares amount to € 42,735,000 and are made up of 38,850,000 no-par value shares with a notional value of € 1.1 per share. The voting right at the Annual General Meeting is exercised according to no-par value shares, with each no-par value share equalling one voting right. All shares are bearer shares. Significant direct and indirect shareholdings in the group parent AT S Austria Technologie Systemtechnik Aktiengesellschaft (AT S AG), which at the reporting date amount to at least 10%, are presented below: Shares % capital % voting rights Dörflinger-Privatstiftung: Karl-Waldbrunner-Platz 1, A-1210 Vienna 6,902,380 17.77% 17.77% Androsch Privatstiftung: Schottengasse 10, A-1010 Vienna 6,339,896 16.32% 16.32% At the reporting date 31 March 2015, about 65.91% of the shares were in free float. With the exception of the shareholdings stated above, no other shareholder existed holding more than 10% of the voting rights in AT S AG. No shares with special control rights exist. The exercise of the voting right by employees who hold shares in the Company is not subject to any limitations. No special provisions exist on the appointment and dismissal of members of the Management Board and the Supervisory Board. No compensation agreements are in place between AT S AG and its Management Board and Supervisory Board members or employees that would become effective in the case of a public takeover bid. By resolution passed at the 20th Annual General Meeting on 3 July 2014, the Management Board was authorised until 2 July 2019 to increase the Company's ordinary shares, subject to approval by the Supervisory Board, by up to € 21,367,500.00 by way of issuing up to 19,425,000 new no-par value bearer shares against contribution in cash or in kind, in one or several tranches, also by way of indirect rights offer- ings after having been taken over by one or more credit institutions in accordance with § 153 (6) Austrian Stock Corporation Act (AktG). In doing so, the Management Board was authorised to determine, subject to approval by the Supervisory Board, the detailed conditions for such issuance (in particular the issue amount, what the contribution in kind entails, the content of the share rights, the exclusion of subscription rights, etc.) (approved capital). The Supervisory Board was authorised to adopt amendments to the articles of association resulting from the issuance of shares from the approved capital. The Annual General Meeting also passed the resolution to amend § 4 of the articles of association (ordinary shares) in accordance with this resolution. Furthermore, by resolution of the 20th Annual General Meeting on 3 July 2014, the authorisation to issue convertible bonds as resolved in the Annual General Meeting on 7 July 2010 was revoked and, simultaneous- ly, the Management Board was authorised until 2 July 2019, subject to approval by the Supervisory Board, to issue one or several convertible bearer bonds in a total nominal amount of up to € 150,000,000.00 and to grant to bearers of convertible bonds subscription rights and/or conversion rights for up to 19,425,000 new no-par value bearer shares of the Company in accordance with the convertible bond conditions to be defined by the Management Board. In doing so, the Company's ordinary shares were conditionally increased by up to € 21,367,500.00 by way of the issuance of up to 19,425,000 new no-par value bearer shares in accordance with § 159 (2) No. 1 AktG. This conditional capital increase is only carried out insofar as the bearers of convertible bonds issued based on the authorisation resolution passed at the Annual General Meeting on 3 July 2014 claim the right to conversion and/or subscription granted to them with regard to the Company's shares. Furthermore, the Management Board was authorised to determine, subject to approval by the Super- Shareholding structure and disclosures8. on capital (disclosures according to § 243a Austrian Commercial Code)
  • 92.
    88 ATS AnnualReport 2015/1662 ATS Annual Report 2015/16 visory Board, the further details of carrying out the conditional capital increase (particularly the issue amount and the content of the share rights). With regard to increasing the approved capital and/or the conditional capital increase, the following defini- tion of amount in accordance with the resolutions passed at the 20th Annual General Meeting on 3 July 2014 is to be observed: The sum of (i) the number of shares currently issued or potentially to be issued from condi- tional capital in accordance with the convertible bond conditions and (ii) the number of shares issued from approved capital shall not exceed the total amount of 19,425,000 (definition of amount of authorisations). TREASURY SHARES By a resolution passed at the 21st Annual General Meeting on 9 July 2015, the Management Board was again authorised to acquire and to withdraw – within 30 months as from the resolu- tion date – treasury shares to the maximum extent of up to 10% of the ordinary shares of the Company. Furthermore, the Management Board was authorised, for a period of five years as of the date the resolution was passed, i.e. up to and including 8 July 2020, upon approval by the Supervisory Board, to sell treasury shares also in a different way than via the stock exchange or by public offering, most notably to serve em- ployee stock options, convertible bonds or to use such shares as a consideration for the acquisition of entities or other assets and for any other legal purpose. As of 31 March 2016, the Group does not hold any treasury shares. There are no off-balance sheet transactions between AT S AG and its subsidiaries. AT S AG neither has granted any loans nor has it assumed any liabilities in favour of board members. For further information, reference is made to the notes to the consolidated financial statements (Note 22 “Share capital” as well as Note 16 “Financial liabilities”). The Company's Corporate Governance Report pursuant to § 243b Austrian Commercial Code is available at http://www.ats.net/de/unternehmen/corporate-governance/berichte/.
  • 93.
    89Group Management ReportGroupManagement Report 63 The effects of digitalisation, the continuous connecting of devices (Internet of Things) and the processing of large amounts of data will require sustained increases in the performance of electronic devices. This rising penetration of nearly all applications with electronic technologies will result in continued growth for the electronics industry. The interconnection technologies will follow these trends both in terms of vol- ume and technological development. By combining various known and new technologies, innovative solu- tions will emerge that can meet the demanding requirements. Following the slow-down of growth in the area of communications devices (smartphones, tablets), it can be expected that new stimulus for further growth will be provided by the area of Internet of Things. At the same time, it can be expected that there will be no one big thing in the future, but rather many connected smart things. Against this background, ATS will focus in the coming years even more intensely than it has thus far on rapidly industrialising new technologies and developing new high-end interconnection solutions for the fu- ture in combination with existing technologies. The plants in Chongqing will make a decisive contribution in this respect. Therefore, in financial year 2016/17, the focus will be on further utilisation of the first produc- tion line for IC substrates, ramp-up of the second production line for IC substrates toward the end of calendar year 2016, and ramp-up of the first production line for substrate-like printed circuit boards during the second half of calendar year 2016. In the core business, high-end printed circuit boards and embedding technology, ATS will make continuous investments in technological developments at the existing sites in order to ex- pand our leading market position. In financial year 2016/17, in view of a weakened growth dynamic in some areas of existing customer seg- ments as well as more intense competition, ATS again expects stronger seasonality in certain financial quar- ters (primarily the first and fourth quarters of financial year 2016/17) and a continuous limited visibility. Provided that the macroeconomic environment remains stable, a USD-EUR currency ratio at a level similar to the previous financial year, 2015/16, and stable demand in the core business, Management assumes revenue growth in the coming financial year of 10–12%. Based on costs related to the ramp-up of Chongqing, the EBITDA margin is expected to be at a level of 18–20%; the EBITDA margin in the core business, however, will be at a similar level to financial year 2015/16. Higher, additional depreciation and amortisation of around € 40 million in the financial year 2016/17 for the project Chongqing will have a significant impact on EBIT. Leoben-Hinterberg, 9 May 2016 The Management Board Andreas Gerstenmayer m.p. Karl Asamer m.p. Heinz Moitzi m.p. Outlook9.
  • 95.
    91Consolidated Financial Statements TABLEOF CONTENTS Consolidated Statement of Profit or Loss   92 Consolidated Statement of Comprehensive Income   92 Consolidated Statement of Financial Position   93 Consolidated Statement of Cash Flows   94 Consolidated Statement of Changes in Equity   95 Notes to the Consolidated Financial Statements   96 Consolidated Financial Statements as of 31 March 2016
  • 96.
    92 ATS AnnualReport 2015/1664 ATS Annual Report 2015/16 € in thousands Note 2015/16 2014/15 Revenue 1 762,879 667,010 Cost of sales 2 (611,247) (511,628) Gross profit 151,632 155,382 Distribution costs 2 (34,624) (31,595) General and administrative costs 2 (29,376) (28,005) Other operating result 4 (10,663) (5,696) Operating result 76,969 90,086 Finance income 6 7,533 9,067 Finance costs 6 (15,668) (14,170) Finance costs - net (8,135) (5,103) Profit before tax 68,834 84,983 Income taxes 7 (12,883) (15,634) Profit for the year 55,951 69,349 Attributable to owners of the parent company 55,951 69,279 Attributable to non-controlling interests – 70 Earnings per share attributable to equity holders of the parent company (in € per share): 25 - basic 1.44 1.78 - diluted 1.44 1.78 Consolidated Statement of Comprehensive Income € in thousands 2015/16 2014/15 Profit for the year 55,951 69,349 Items to be reclassified: Currency translation differences (82,521) 161,373 Gains/(losses) from the fair value measurement of hedging instruments for cash flow hedges, net of tax 2,831 (2,517) Items not to be reclassified: 2,659 -6757 Remeasurement of post-employment obligations, net of tax 2,659 (6,757) Other comprehensive income for the year (77,031) 152,099 Total comprehensive income for the year (21,080) 221,448 Attributable to owners of the parent company (21,080) 221,350 Attributable to non-controlling interests – 98 Consolidated Statement of Profit or Loss
  • 97.
    93Consolidated Financial StatementsConsolidatedFinancial Statements 65 € in thousands Note 31 Mar 2016 31 Mar 2015 ASSETS Property, plant and equipment 8 689,161 603,664 Intangible assets 9 103,736 45,211 Financial assets 13 96 96 Deferred tax assets 7 33,826 34,301 Other non-current assets 10 39,519 29,485 Non-current assets 866,338 712,757 Inventories 11 83,438 89,222 Trade and other receivables 12 134,687 143,130 Financial assets 13 87,817 780 Current income tax receivables 504 1,004 Cash and cash equivalents 14 171,866 273,919 Current assets 478,312 508,055 Total assets 1,344,650 1,220,812 EQUITY Share capital 22 141,846 141,846 Other reserves 23 73,688 150,774 Retained earnings 353,402 311,642 Equity attributable to owners of the parent company 568,936 604,262 Non-controlling interests – 96 Total equity 568,936 604,358 LIABILITIES Financial liabilities 16 361,558 359,268 Provisions for employee benefits 17 36,293 33,726 Other provisions 18 6,957 7,545 Deferred tax liabilities 7 8,844 7,774 Other liabilities 15 7,755 4,757 Non-current liabilities 421,407 413,070 Trade and other payables 15 180,257 149,409 Financial liabilities 16 161,413 46,037 Current income tax payables 7,557 2,823 Other provisions 18 5,080 5,115 Current liabilities 354,307 203,384 Total liabilities 775,714 616,454 Total equity and liabilities 1,344,650 1,220,812 Consolidated Statement of Financial Position
  • 98.
    94 ATS AnnualReport 2015/1666 ATS Annual Report 2015/16 € in thousands 2015/16 2014/15 Operating result 76,969 90,086 Depreciation, amortisation and impairment of property, plant and equipment and intangible assets 90,519 77,485 Gains/losses from the sale of fixed assets 632 114 Non-cash expense/(income), net 576 5,900 Interest paid (15,507) (14,460) Interest received 3,047 2,267 Income taxes paid (10,308) (16,436) Cash flow from operating activities before changes in working capital 145,928 144,956 Inventories (426) (16,011) Trade and other receivables (11,099) (23,612) Trade and other payables 2,254 36,926 Other provisions 268 1,611 Cash flow from operating activities 136,925 143,870 Capital expenditure for property, plant and equipment and intangible assets (254,764) (165,318) Proceeds from the sale of property, plant and equipment and intangible assets 499 539 Acquisition of non-controlling interests (272) – Capital expenditure for financial assets (89,480) – Proceeds from the sale of financial assets 1,775 – Cash flow from investing activities (342,242) (164,779) Proceeds from borrowings 252,140 34,623 Repayments of borrowings (131,740) (16,249) Proceeds from government grants 4,659 1,339 Dividends paid (13,986) (7,770) Cash flow from financing activities 111,073 11,943 Change in cash and cash equivalents (94,244) (8,966) Cash and cash equivalents at beginning of the year 273,919 260,133 Exchange gains/(losses) on cash and cash equivalents (7,809) 22,752 Cash and cash equivalents at the end of the year 171,866 273,919 Consolidated Statement of Cash Flows
  • 99.
    95Consolidated Financial StatementsConsolidatedFinancial Statements 67 € in thousands Share capital Other reserves Retained earnings Equity attributable to owners of the parent company Non- controlling interests Total equity 31 Mar 2014 141,846 (1,297) 250,133 390,682 (2) 390,680 Profit for the year – – 69,279 69,279 70 69,349 Other comprehensive income for the year – 152,071 – 152,071 28 152,099 thereof currency translation differences – 161,339 – 161,339 34 161,373 thereof remeasurement of post-employment obligations, net of tax – (6,751) – (6,751) (6) (6,757) thereof change in hedging instruments for cash flow hedges, net of tax – (2,517) – (2,517) – (2,517) Total comprehensive income for the year 2014/15 – 152,071 69,279 221,350 98 221,448 Dividends paid relating to 2013/14 – – (7,770) (7,770) – (7,770) 31 Mar 2015 141,846 150,774 311,642 604,262 96 604,358 Profit for the year – – 55,951 55,951 – 55,951 Other comprehensive income for the year – (77,031) – (77,031) – (77,031) thereof currency translation differences – (82,521) – (82,521) – (82,521) thereof remeasurement of post-employment obligations, net of tax – 2,659 – 2,659 – 2,659 thereof change in hedging instruments for cash flow hedges, net of tax – 2,831 – 2,831 – 2,831 Total comprehensive income for the year 2015/16 – (77,031) 55,951 (21,080) – (21,080) Dividends paid relating to 2014/15 – – (13,986) (13,986) – (13,986) Acquisition of non-controlling interests – (55) (205) (260) (96) (356) 31 Mar 2016 141,846 73,688 353,402 568,936 – 568,936 Consolidated Statement of Changes in Equity
  • 100.
    96 ATS AnnualReport 2015/1668 ATS Annual Report 2015/16 GENERAL AT S Austria Technologie Systemtechnik Aktiengesellschaft (hereinafter referred to as “the Company”, and with its subsidi-A. aries referred to as “the Group”) was incorporated in Austria. The Company is headquartered in Austria, Fabriksgasse 13, 8700 Leoben- Hinterberg. The Group manufactures and distributes printed circuit boards and provides related services in the segments Mobile Devices Substrates, Au- tomotive, Industrial, Medical and Others. The products are manufactured in the European and Asian markets and are directly distributed to original equipment manufacturers (OEM) as well as to contract electronic manufacturers (CEM). Since 20 May 2008, the Company has been listed in the Prime Market segment of the Vienna Stock Exchange, Austria, and, after a period of double listing on the previous exchange in Frankfurt am Main, Germany, has been traded exclusively on the Vienna Stock Exchange since 15 September 2008. Prior to changing the stock exchange, the Company had been listed on the Frankfurt Stock Exchange since 16 July 1999. Due to increased turnover, the Company’s shares were included in the Austrian ATX index for the first time on 21 March 2016. The criteria for inclu- sion in the ATX are the average daily trading volumes during the latest twelve months as well as the free float capitalisation at the closing date of February 2016. According to Section 245a of the Austrian Commercial Code (UGB), the consolidated financial statements were prepared in accordance with the International Financial Reporting Standards (IFRS and IAS) and interpretations (IFRIC and SIC) of the International Accounting Standards Board (IASB) as adopted by the European Union (EU). ACCOUNTING AND MEASUREMENT POLICIES The consolidated financial statements have been prepared under the historicalB. cost convention, except for securities and derivative financial instruments, which are measured at their fair values. a. CONSOLIDATION PRINCIPLES The balance sheet date for all consolidated companies is 31 March 2016, with the following exceptions: Due to the legal situation in China, the financial year of ATS (China) Company Limited and ATS (Chongqing) Company Limited corresponds to the calendar year (balance sheet date: 31 December 2015), meaning that they were consolidated on the basis of the interim financial statements as of 31 March 2016. The consolidated financial statements were approved for issue by the Management Board on 9 May 2016. The separate financial statements of the Company, which are included in the consolidation after reconciliation to the applicable accounting standards, will be presented for approval to the Supervisory Board on 6 June 2016. The separate financial statements of the Company can be modified by the Supervisory Board and, in case of presentation to the Annual General Meeting, by the Company’s shareholders in a way that might also affect the presentation of the consolidated financial statements. GROUP OF CONSOLIDATED ENTITIES The Company controls an entity when the Group is exposed to risks or has rights to variable returns from its involvement with the entity and has the ability to affect those returns through its power over the entity. In addition to the Company itself, the consolidated financial statements comprise the following fully consolidated subsidiaries:  ATS Asia Pacific Limited, Hong Kong, China (hereinafter referred to as ATS Asia Pacific), share 100%  ATS (China) Company Limited, China (hereinafter referred to as ATS China), 100% subsidiary of ATS Asia Pacific  ATS (Chongqing) Company Limited, China (hereinafter referred to as ATS Chongqing), 100% subsidiary of ATS Asia Pacific  ATS Japan K.K., Japan, 100% subsidiary of ATS Asia Pacific  ATS (Taiwan) Co., Ltd., Taiwan (hereinafter referred to as ATS Taiwan), 100% subsidiary of ATS Asia Pacific  ATS India Private Limited, India (hereinafter referred to as ATS India), share 100%  ATS Korea Co., Ltd., South Korea (hereinafter referred to as ATS Korea), share 100%  ATS Americas LLC, USA (hereinafter referred to as ATS Americas), share 100%  ATS Deutschland GmbH, Germany, share 100% In the financial year 2015/16, all non-controlling interests, a share of 1.24% in ATS Korea Co., Ltd., were acquired and the subsidiary AT S Klagenfurt Leiterplatten GmbH in Liqu. was liquidated and deconsolidated. The Group applies the acquisition method to account for business combinations. The consideration transferred for the acquisition of a subsidiary is the fair value of the assets transferred, the equity interests issued and the liabilities incurred and/or assumed at the acquisition date. The Notes to the Consolidated Financial Statements I. General Information
  • 101.
    97Consolidated Financial StatementsConsolidatedFinancial Statements 69 consideration transferred also includes the fair value of any asset or liability resulting from a contingent consideration arrangement. Acquisition- related costs are expensed as incurred. Identifiable assets acquired and liabilities and contingent liabilities assumed in a business combination are measured initially at their fair values at the acquisition date. For each business combination, the Group measures any non-controlling interest in the acquiree either at fair value or at the non-controlling interest’s proportionate share of the acquiree’s identifiable net assets and, accordingly, recognises the full or proportional goodwill. If the con- sideration transferred is less than the fair value of the net assets of the subsidiary acquired, the difference is recognised directly in profit or loss. When the Group ceases to have control or significant influence over a company, any retained interest in the entity is remeasured to its fair value, with the change in carrying amount recognised in profit or loss. The fair value is the fair value determined at initial recognition of an associate, joint venture or financial asset. In addition, any amounts recognised in other comprehensive income in respect of that entity are accounted for as if the parent company had directly disposed of the related assets or liabilities. This means that a profit or loss previously recognised in other comprehensive income is reclassified from equity to profit or loss. METHODS OF CONSOLIDATION All significant intercompany balances and transactions have been eliminated so that the consolidated finan- cial statements present the accounting information of the Group as if it were one single company. Capital consolidation is made in accordance with IFRS 10 “Consolidated Financial Statements”. Intercompany accounts receivable and payable as well as expenses and income are eliminated. Unless immaterial, intercompany results in non-current assets and inventories are eliminated. Furthermore, uniform accounting and measurement methods are applied to all consolidated subsidiaries. The Group considers transactions with non-controlling interests as transactions with equity holders of the Group. When non-controlling interests are acquired, the difference between the acquisition costs and the attributable share of net assets acquired in the subsidiary is deducted from equity. Gains or losses on the sale of non-controlling interests are also recognised in equity. b. SEGMENT REPORTING An operating segment is a component of an entity that engages in business activities and whose operating results are reviewed regularly by the entity’s chief operating decision-maker. Business activities involve earning revenues and incurring expenses, and these may also relate to business transactions with other operating segments of the entity. Separate financial information is available for the individual operating segments. In the financial year 2011/12 the Management Board – with the Supervisory Board’s approval – decided to improve the Group’s organisational structure with the aim of adapting its operational processes even more effectively to its customers’ needs. Three business units were therefore created: Mobile Devices, Industrial Automotive, and Others. Following ATS’s entry into IC substrate manufacturing and allocation of the new business to the Mobile Devices business unit, that unit has been renamed as the Mobile Devices Substrates business unit. Both mobile applications and substrates have an appropriate organisational structure, the management reporting, however, continues to be performed for the Mobile Devices Substrates segment as a whole. At the beginning of the financial year 2015/16, the business unit Industrial Automotive was renamed Automotive, Industrial, Medical. This change was made to underline the growing significance of business with medical devices in both therapy and diagnosis. The business unit Mobile Devices Substrates is responsible for the production of printed circuit boards for mobile end-user devices such as smartphones, tablets, notebooks and consumer products like digital cameras. The printed circuit boards for these applications are largely pro- duced in our Shanghai (ATS China) plant. The serial production of IC substrates has started in March 2016 at the plant in Chongqing (ATS Chongqing). The business unit Automotive, Industrial, Medical supplies customers in the fields of automotive supplies, industrial applications, medical tech- nology, aerospace, security and other sectors. Production for this business segment takes place at our plants in India, Korea and Austria. The activities of the emerging business segment Advanced Packaging and parent group activities are included in the business unit Others. Ad- vanced Packaging specialises in new, technologically highly advanced applications. A variety of components are integrated directly into printed circuit boards in order to enable further reductions in the size of end-user devices while also enhancing the functionality. This new technology is
  • 102.
    98 ATS AnnualReport 2015/1670 ATS Annual Report 2015/16 useful in a wide range of applications. This business segment is still under development and is therefore not yet shown separately, since neither the quantative threshold reached nor the associated opportunities and risks are material to the Group as a whole. c. FOREIGN CURRENCIES The Group’s presentation currency is the euro (€). The functional currency of the foreign subsidiaries is the re- spective local currency. FOREIGN SUBSIDIARIES With the exception of equity positions (historical exchange rate), the balance sheets of ATS India, ATS China, ATS Asia Pacific, ATS Japan K.K., ATS Korea, ATS Americas, ATS Chongqing and ATS Taiwan are translated at the exchange rates on the bal- ance sheet date. The profit and loss statements are translated at the average exchange rates of the financial year. The effect of changes in the exchange rate with regard to the foreign subsidiaries’ net assets is recognised directly in equity. FOREIGN CURRENCY TRANSACTIONS In the financial statements of each of the Group’s entities, foreign currency items are translated at the exchange rates prevailing on the day of the transaction. Monetary items are translated at the respective exchange rate ruling at the balance sheet date; non-monetary items which were recognised according to the historical cost principle are carried at the rate of their initial recogni- tion. Translation adjustments from monetary items, with the exception of “available-for-sale financial assets”, are recognised in profit or loss. Translation differences from “available-for-sale financial assets” are recognised directly in equity. Closing rate Average rate 31 Mar 2016 31 Mar 2015 Change in % 01 Apr 2015 - 31 Mar 2016 01 Apr 2014 - 31 Mar 2015 Change in % Chinese yuan renminbi 7.3514 6.6572 10.4% 6.9623 7.8448 (11.2%) Hong Kong dollar 8.8231 8.3285 5.9% 8.5393 9.8166 (13.0%) Indian rupee 75.3466 67.2055 12.1% 72.0208 77.3582 (6.9%) Japanese yen 127.8200 128.7780 (0.7%) 132.1891 138.6920 (4.7%) South Korean won 1,297.7560 1,191.6030 8.9% 1,269.9367 1,341.2992 (5.3%) Taiwan dollar 36.5967 33.6151 8.9% 35.3607 38.7183 (8.7%) US dollar 1.1378 1.0740 5.9% 1.1011 1.2660 (13.0%) d. REVENUE RECOGNITION Revenue comprises the fair value of considerations received in the course of the Group‘s ordinary activities. Revenue is recognised net of VAT, discounts and price reductions, and after elimination of intercompany sales. Revenue is realised as follows: REVENUE FROM PRODUCT SALES Revenue from product sales is recognised when significant risks and rewards associated with the goods sold are transferred to the buyer. This is usually the case when the ownership is transferred. INTEREST AND DIVIDEND INCOME Interest income is recognised on a pro rata temporis basis, taking into account the effective interest rate of the asset. Dividend income from financial assets is recognised in profit or loss when the Group’s right to receive payments is established. e. INCOME TAXES The income tax burden is based on the profit for the year and includes deferred income taxes. The Group provides for deferred income taxes using the balance-sheet oriented method. Under this method, the expected tax effect of differ- ences arising between the carrying amounts in the consolidated financial statements and the taxable carrying amounts are taken into account by recognising deferred tax assets and tax liabilities. These differences will be reversed in the future. Deferred income tax is determined using tax rates (and laws) that have been enacted or substantively enacted on the balance sheet date and are expected to apply when the related de- ferred income tax asset is realised or the deferred income tax liability is settled. A future change in tax rates would also have an impact on the deferred tax assets capitalised at the current balance sheet date. Deferred income taxes and liabilities arise from the measurement of specific assets and liabilities, as well as tax loss carryforwards and amortisa- tion of goodwill. Deferred taxes on not yet realised profits/losses of available-for-sale financial assets and on not yet realised profits/losses from hedging instru- ments for cash flow hedges that are recognised in equity are also directly recognised in equity.
  • 103.
    99Consolidated Financial StatementsConsolidatedFinancial Statements 71 In accordance with IFRS, deferred income tax assets on loss carryforwards have to be recognised to the extent that it is probable that they will be utilised against future taxable profits. Deferred taxes are not recognised for temporary differences in connection with holdings in subsidiaries provided that the Group is able to con- trol the timing of the reversal of the temporary differences and it is likely that the temporary differences will not be reversed in the foreseeable future. f. PROPERTY, PLANT AND EQUIPMENT Items of property, plant and equipment are measured at cost. Expenditure directly attributable to the acquisition and subsequent expenditure are capitalised, repairs and maintenance costs, however, are expensed as incurred. Borrowing costs directly attributable to the acquisition, construction or production of a qualifying asset are capitalised as part of the acquisition or production costs of this asset in accordance with IAS 23. From the time of their availability for use, the assets are depreciated on a straight-line basis over their expected useful lives. Depreciation is charged on a pro rata temporis basis. Land is not subject to depreciation. Scheduled depreciation is based on the following useful lives applicable throughout the Group: Plants and buildings 10–50 years Machinery and technical equipment 4–15 years Tools, fixtures, furniture and office equipment 3–15 years Depreciation periods and methods are reviewed annually at the end of the financial year. In accordance with IAS 17 “Leases”, leased property, plant and equipment for which the Group bears substantially all the risks and rewards of ownership and which in economic terms constitute asset purchases with long-term financing are capitalised at their fair value or the lower pre- sent value of the minimum lease payments. Scheduled depreciation is effected over the useful life of the asset. If at the beginning of the lease it is not sufficiently certain that the title will pass to the lessee, the leased asset is depreciated over the shorter of the two periods, the lease term or useful life. Financial obligations resulting from future lease payments are discounted and carried as a liability. Current lease payments are split into repayment and financing costs. Leased assets under all other lease and rental agreements are classified as operating leases and attributed to the lessor. Lease payments are recognised as an expense. Profits or losses resulting from the closure or retirement of non-current assets, which arise from the difference between the net realisable value and the carrying amounts, are recognised in profit or loss. g. INTANGIBLE ASSETS PATENTS, TRADEMARKS AND LICENSES Expenditure on acquired patents, trademarks and licenses is capitalised at cost, including incidental acquisition expenses, and amortised on a straight-line basis over its useful life, generally between two and ten years. Amortisation terms and methods are reviewed annually at the end of the financial year. RESEARCH AND DEVELOPMENT COSTS Research costs are expensed as incurred and charged to cost of sales. Development costs are also expensed as incurred. An intangible asset arising from development is recognised if, and only if, an entity can demonstrate all of the following:  The technical feasibility of completing the intangible asset so that it will be available for use or sale.  Its intention to complete the intangible asset and use or sell it.  Its ability to use or sell the intangible asset.  How the intangible asset will generate probable future economic benefits is verifiable.
  • 104.
    100 ATS AnnualReport 2015/1672 ATS Annual Report 2015/16  The availability of adequate technical, financial and other resources to complete the development and to use or sell the intangible asset.  Its ability to reliably measure the expenditure attributable to the intangible asset during its development. Capitalised development projects include all the directly attributable costs incurred as a result of development process. Borrowing costs are capitalised if the development project is a qualifying asset in accordance with IAS 23. Development costs are amortised on a straight-line basis over a useful life from six to seven years, which is derived from the expected sales periods. h. IMPAIRMENT LOSSES AND WRITE-UPS OF PROPERTY, PLANT AND EQUIPMENT, INTANGIBLE ASSETS The Group regularly reviews property, plant and equipment and intangible assets for possible impairment. If evidence for impairment exists, an impairment test is carried out without delay. Intangible assets in the development phase are tested annually for impairment. If the recoverable amount of the respective asset is below its carrying amount, an impairment loss amounting to the difference is recognised. The recoverable amount is the higher of an asset’s fair value less costs to sell and its value in use. The value in use corresponds to the estimated future cash flows expected from the continued use of the asset and its disposal at the end of its useful life. The discount rates applied correspond to the weighted cost of capital based on externally available capital market data that are typical in the industry and have been adapted to the specific risks. If the reason for the impairment recognised in the past no longer exists, with the exception of goodwill, a reversal of impairment up to amortised cost is made. i. INVENTORIES Inventories are stated at the lower of cost or net realisable value. Net realisable value is the estimated selling price in the ordinary course of business, less variable costs necessary to make the sale. Cost is determined by the first-in, first-out (FIFO) method. The cost of finished goods and work in progress comprises raw materials, direct labour, other direct costs and related production overheads. Interest on borrowed capital is not recognised. j. TRADE AND OTHER RECEIVABLES Receivables are reported at nominal values, less any allowances for doubtful accounts. Foreign cur- rency receivables are translated at the average exchange rate prevailing at the balance sheet date. Risk management covers all recognisable credit and country-specific risks. k. FINANCIAL ASSETS Financial assets are recognised and derecognised using settlement date accounting. The fair values recognised in the statement of financial position generally correspond to market prices of financial assets. Except for financial assets at fair value through profit or loss, they are recognised initially including transaction costs. Financial assets are divided into the categories explained below. The classification depends on the respective purpose of the financial asset and is reviewed annually. FINANCIAL ASSETS AT FAIR VALUE THROUGH PROFIT OR LOSS Financial instruments acquired primarily for the purpose of earning a profit from short-term fluctuations in prices or trader margins are classified as financial assets at fair value through profit or loss. At the time of their acquisition they are stated at fair value, excluding transaction costs, and in subsequent periods at their respective fair values. Realised and unre- alised gains and losses are recognised in profit or loss in “Finance costs - net”. This relates primarily to securities held for trading. Derivative financial instruments also fall into this category, unless hedge accounting is applied (refer to l. Derivative financial instruments). SECURITIES HELD TO MATURITY Securities held to maturity are recognised at amortised cost using the effective interest rate method. Any impairment is recognised in profit or loss. LOANS AND RECEIVABLES Loans and receivables are non-derivative financial assets with fixed or determinable payments that are not listed in an active market. In the statement of financial position, the respective assets are recognised under the item “Trade and other receivables”. AVAILABLE-FOR-SALE FINANCIAL ASSETS Available-for-sale financial assets relate to securities available-for-sale. Available-for-sale securities are instruments which Management intends to sell as a reaction to expected liquidity requirements or expected changes in interest rates, ex- change rates or share prices. Their classification as non-current or current assets depends on the length of time for which they are expected to be held.
  • 105.
    101Consolidated Financial StatementsConsolidatedFinancial Statements 73 At the time of acquisition they are stated at cost, including transaction costs, in subsequent periods at their respective fair values. Unrealised gains and losses, net of income tax, are recognised in other comprehensive income and not taken through profit or loss until they are sold or considered as impaired. Interest income and dividends from available-for-sale securities are recognised in profit or loss under “Finance costs - net”. When an available-for-sale security is sold, the accumulated unrealised gain or loss previously recognised in equity is included in profit or loss for the reporting period in “Finance costs - net”. When an available-for-sale security is considered to be impaired, the accumulated unrealised loss previously recognised in equity is recognised in profit or loss in “Finance costs - net”. An asset is impaired, if there are indications that the recoverable value is below its carrying amount. In particular, this is the case if the decrease in fair value is of such extent that the acquisition cost is unlikely to be recovered in the foreseeable future. Recoverability is reviewed annually at every balance sheet date. Furthermore, financial assets that have not been allocated to any of the other categories described are recognised under available-for-sale fi- nancial assets. If the fair value of non-listed equity instruments cannot be determined reliably, these financial assets are measured at cost. Im- pairment losses, if any, are recognised in profit or loss, and the respective impairment losses are not reversed. l. DERIVATIVE FINANCIAL INSTRUMENTS Where possible the Group uses derivative financial instruments to hedge against foreign cur- rency fluctuations related to transactions in foreign currencies – in particular the US dollar. These instruments mainly include forward contracts, foreign currency options and foreign exchange swap contracts. They are entered into in order to protect the Group against exchange rate fluctu- ations by fixing future exchange rates for foreign currency assets and liabilities. Furthermore, the Group manages its interest rate risk by using interest rate swaps. The Group does not hold any financial instruments for speculative purposes. The first-time recognition at the conclusion of the contract and the subsequent measurement of derivative financial instruments is made at their fair values. “Hedge accounting” in accordance with IAS 39 “Financial Instruments: Recognition and Measurement”, according to which changes in fair values of hedging instruments are recognised in equity, is applied when there is an effective hedging relationship pursuant to IAS 39 for hedging instruments for cash flow hedges. The assessment of whether the derivative financial instruments used in the hedging relationship are highly effective in offsetting the changes in cash flows of the hedged item is documented at the inception of the hedging relationship and on an ongoing basis. When “hedge accounting” in equity is not applicable, unrealised gains and losses from derivative financial instruments are recog- nised in profit or loss in “Finance costs – net”. m. CASH AND CASH EQUIVALENTS Cash and cash equivalents comprise cash, time deposits, deposits held at call with banks and short- term, highly liquid investments with an original maturity of up to three months (commercial papers and money market funds). n. NON-CONTROLLING INTERESTS The Company acquired the non-controlling interest of 1.24% of the equity in ATS Korea in financial year 2015/16 and thus no longer reports any non-controlling interests. The profit for the year and other comprehensive income are attributed to the owners of the parent company and the non-controlling interests. The allocation to the non-controlling interests is made even if this results in a negative balance for the non-controlling interests. o. PROVISIONS Provisions are recognised if the Group has a legal or de facto obligation to third parties, which is based on past events, where it is probable that this will result in an outflow of resources and the amount can be estimated reliably. The provisions are remeasured at each balance sheet date and their amounts adjusted accordingly. Non-current provisions are reported at the discounted amount to be paid at each balance sheet date if the interest effect resulting from the discounting is material.
  • 106.
    102 ATS AnnualReport 2015/1674 ATS Annual Report 2015/16 p. PROVISIONS FOR EMPLOYEE BENEFITS PENSION OBLIGATIONS The Group operates various defined contribution and defined benefit pension schemes. A defined contribution plan is a pension plan under which the Group pays fixed contributions into a special purpose entity (fund). These contri- butions are charged to staff costs. No provision has to be set up, as there are no additional obligations beyond the fixed amounts. For individual members of the Management Board and certain executive employees, the Group has defined benefit plans that are valued by qualified and independent actuaries at each balance sheet date. The Group’s obligation is to meet the benefits committed to current and former members of the Management Board and executive employees as well as their dependents. The pension obligation calculated according to the projected unit credit method is reduced by the plan assets of the fund in the case of a funded pension scheme. The present value of the future pension benefit is determined on the basis of years of service, expected remuneration and pension adjustments. To the extent that the plan assets of the fund do not cover the obligation, the net liability is accrued under pension provisions. If the net assets exceed the pension obligation, the exceeding amount is capitalised under “Overfunded pension benefits”. Staff costs recognised in the respective financial year are based on expected values and include the service costs. The net liabilities net interest is recognised in “Finance costs - net”. Remeasurements of the net liability are recognised in other comprehensive income and comprise gains and losses arising from the remeasurement of post-employment obligations. PROVISIONS FOR SEVERANCE PAYMENTS Pursuant to Austrian labour regulations, severance payments have to be paid primarily on termina- tion of employment by the employer or on the retirement of an employee. The liabilities are measured by qualified and independent actuaries at each balance sheet date. For employees who joined Austrian companies up to and including 2002, the Company has direct obligations that account for the major part of the Group’s severance payment obligations. In accordance with IAS 19, these liabilities are calculated using the projected unit credit method as described above and represent severance payment obligations not covered by plan assets. For employees who joined the Company as on or after of 1 January 2003, the severance payment obligation is met by regular contributions to a staff provision fund (“Mitarbeitervorsorgekasse”). These contributions are included in staff costs. The Company has no further payment obligations once the contributions have been paid. For employees of the company in India, obligations for severance payments are covered by life insurance policies. Furthermore, severance pay- ment obligations exist for employees in South Korea and China. These obligations are measured in accordance with IAS 19 using the projected unit credit method as described above and represent severance payment obligations not covered by plan assets. OTHER EMPLOYEE BENEFITS Other employee benefits include provisions for anniversary bonuses and relate to employees in Austria and China. Anniversary bonuses are special one-off payments stipulated in the Collective Agreement which are dependent on remuneration and duration of service. Eligibility is determined by a certain minimum length of employment. The respective liability is calculated in accordance with the pro- jected unit credit method based on the same parameters used for severance payments. Staff costs recognised in the respective financial year include entitlements acquired and the actuarial results. The interest component is recog- nised in “Finance costs - net”. The liabilities are measured by qualified and independent actuaries at each balance sheet date. q. STOCK OPTION PLANS The Group has issued stock option plans that are settled either in cash or in treasury shares, with the choice of settlement being with the entitled employees. These stock option plans are accounted for in accordance with IFRS 2 “Share-based Payment”. The share-based payments are structured in such a way that both settlement alternatives have the same fair value. The fair value of the em- ployee services received in exchange for the granting of the options is recognised as an expense. Liabilities arising from stock option plans are recognised initially and at each balance sheet date until settlement at fair value using an option price model and are recognised in profit or loss. Reference is made to Note 15 “Trade and other payables”.
  • 107.
    103Consolidated Financial StatementsConsolidatedFinancial Statements 75 r. STOCK APPRECIATION RIGHTS The Group introduced a long-term incentive programme based on stock appreciation rights (SAR). Stock appreciation rights relate to value increase in share prices based on the performance of the share price. These rights are accounted for in ac- cordance with IFRS 2 “Share-based Payment”. The fair value of the employee services rendered as consideration for the granting of SAR is recognised as an expense. Upon initial recognition and at every balance sheet date until the liabilities are settled, SAR liabilities are measured at fair value through profit or loss, applying the option price model. Reference is made to Note 15 “Trade and other payables”. s. LIABILITIES Financial liabilities are initially measured at fair value less transaction cost and in subsequent periods at amortised cost using the effective interest rate method. Foreign currency liabilities are translated at the average exchange rate prevailing at the balance sheet date. t. GOVERNMENT GRANTS Government grants are recognised at their fair value where there is a reasonable assurance that the grants will be received and the Group will comply with all attached conditions. Government grants relating to costs are deferred and recognised in profit or loss over the period necessary to match them with the costs that they are intended to compensate. Government grants relating to investments in property, plant and equipment are included in liabilities as deferred government grants; they are recognised in profit or loss on a straight-line basis over the expected useful life of the related assets. Gov- ernment grants relating to costs and property, plant and equipment are recognised in profit or loss in the other operating result. u. CONTINGENT LIABILITIES, CONTINGENT ASSETS AND OTHER FINANCIAL OBLIGATIONS Contingent liabilities are not recog- nised in the statement of financial position, but disclosed in Note 21 in the notes to the consolidated financial statements. They are not disclosed if an outflow of resources with economic benefit is unlikely. A contingent asset is not recognised in the consolidated financial statements, but disclosed if the inflow of an economic benefit is likely. v. FIRST-TIME APPLICATION OF ACCOUNTING STANDARDS The following new and/or amended standards and interpretations were applied for the first time in the financial year and pertain to the International Financial Reporting Standards (IFRS) as adopted by the EU.  Annual improvements to IFRS 2010–2012 cycle.  Annual improvements to IFRS 2011–2013 cycle.  IAS 19: Employee benefits (clarification of instructions for contributions of employees to a defined benefit plan).  IFRIC 21: Levies (regulation of timing approach of provision for levies). The initial application had no significant impact on the disclosures of the Group. w. FUTURE AMENDMENTS TO ACCOUNTING STANDARDS The IASB and IFRIC issued additional standards and interpretations not yet effective in the financial year 2015/16. These have already been in part adopted by the European Union. The following standards and interpretations had already been published by the time these consolidated financial statements were prepared and are not yet effective; they have not been adopted early in the preparation of these consolidated financial statements:
  • 108.
    104 ATS AnnualReport 2015/1676 ATS Annual Report 2015/16 Standard/Interpretation (Content of the regulation) Effective date 1) EU 2) Expected impacts on the consolidated financial statements IFRS 11 Accounting for Acquisition of Interests in Joint Operations 01 Jan 2016 Yes None IAS 16, IAS 41 Property, Plant and Equipment/Agriculture: Bearer Plants 01 Jan 2016 Yes None IAS 1 Disclosure initiative (Amendments to IAS 1) 01 Jan 2016 Yes None IAS 16, IAS 38 Property, Plant and Equipment/Intangible Assets Clarification of Acceptable Methods of Depreciation and Amortisation 01 Jan 2016 Yes None Annual Improvements to IFRSs 2012-2014 01 Jan 2016 Yes None IFRS 9 Financial instruments (New rules on the classification and measurement of financial instru- ments, the provisions on hedge accounting and on impairment) 01 Jan 2018 No Changes in fair values of financial instruments currently classified as “available-for-sale” by the Group will (in part) be recognised in profit or loss in the future. IFRS 15 Revenue from Contracts with Customers 01 Jan 2018 No None IFRS 14 Regulatory Deferral Accounts 01 Jan 2016 No None IAS 27 Consolidated and Separate Financial Statements: Equity Method in separate financial statements 01 Jan 2016 No None IFRS 10, IFRS 12, IAS 28 Investment companies: Application consolidate exception 01 Jan 2016 No None IAS 28 IFRS 10 Investments in Associates: Sales or contributions of assets between an investor and its associate/joint venture Postponed indefinitely No None IFRS 16 Leases 01 Jan 2019 No No major changes are expected. 1) The Group intends to apply the new regulations for the first time in the fiscal year beginning subsequent to the effective date. 2) Status of adoption by the EU. CRITICAL ACCOUNTING ESTIMATES AND ASSUMPTIONS The Group uses estimates and assumptions to determine theC. reported amounts of assets, liabilities, revenue and expenses, as well as other financial liabilities, and contingent assets and liabilities. All esti- mates and assumptions are reviewed on a regular basis and are based on past experiences and additional factors, including expectations regard- ing future events that seem reasonable under the given circumstances. In the future, actual results may differ from these estimates. Manage- ment believes that the estimates are reasonable. DEVELOPMENT COSTS Capitalised development costs largely relate to the development of a new technology for the production of substrates for silicon semiconductor chips taking place at the new site in Chongqing, China. These development costs were capitalised because the criteria for capitalisation presented in the accounting methods were fully met as at 1 March 2014. This technology was available for use from March 2016 onwards and the depreciation of it has begun. For the purposes of assessing impairment of capitalised development costs, Management made assumptions in the financial year 2014/15 on the amount of the estimated future cash flows arising from the project, the discount rate to be applied, the growth rate and the period of inflow of the expected future benefit. An increase in significant assumptions would have the following impact on the impairment test as at 31 March 2015: Pre-tax discount interest rate Growth rate +5.00% +5.00% Capitalised development costs no impairment required no impairment required
  • 109.
    105Consolidated Financial StatementsConsolidatedFinancial Statements 77 A reduction in the same assumptions would have the following impact on the impairment test as at 31 March 2015: Pre-tax discount interest rate Growth rate -5.00% -5.00% Capitalised development costs no impairment required no impairment required CALCULATION OF THE PRESENT VALUES OF PROJECTED EMPLOYEE BENEFIT OBLIGATIONS The present value of non-current employee benefit obligations depends on various factors that are based on actuarial assumptions (refer to I.B.p. “Provisions for employee benefits”). These actuarial assumptions used to calculate the pension expenses and the expected defined benefit obligations were subjected to stress tests using the following parameters: An increase in the interest rate, in the expected remuneration and/or in future pensions for the Austrian entities by the percentage points stated in the table below would affect the present values of the projected pension and severance payment obligations as follows as at 31 March 2016: Interest rate Increase in renumer- ation Increase in pensions € in thousands +0.50% +0.25% +0.25% Pension obligation (1,230) 111 563 Severance payments (1,104) 561 – A decrease in the same parameters for the Austrian companies would have the following effects on the present value of pension and severance payment obligations as at 31 March 2016: Interest rate Increase in renumer- ation Increase in pensions € in thousands -0.50% -0.25% -0.25% Pension obligation 1,389 (108) (537) Severance payments 1,203 (541) – Reference is made to Note 17 “Provisions for employee benefits”. MEASUREMENT OF DEFERRED INCOME TAX ASSETS AND CURRENT TAX LIABILITIES Deferred income tax assets and liabilities are deter- mined using the tax rates (and laws) that have been enacted or substantively enacted by the balance sheet date and are expected to apply when the related deferred income tax asset is realised or the deferred income tax liability is settled. A future change in tax rates would also have an impact on the deferred tax capitalised at the balance sheet date. Deferred income tax assets in the amount of € 34.6 million were not recognised for income tax loss carryforwards in the Group of € 138.3 million. The major part of these non-capitalised tax loss carryforwards may be carried forward for an unlimited period of time. If they were subsequently expected to be realised, these deferred income tax assets would have to be recognised and a related tax income reported. Reference is made to Note 7 “Income taxes”. Moreover, a different interpretation of tax laws by fiscal authorities could also lead to a change in income tax liabilities. OTHER ESTIMATES AND ASSUMPTIONS Further estimates, if necessary, relate to impairments of non-current assets and provisions, as well as the measurement of derivative financial instruments, allowances for doubtful accounts receivable and measurements of inventory. Reference is particularly made to Note 4 “Other operating result”, Note 8 “Property, plant and equipment”, Note 9 “Intangible assets” and Note 18 “Other provisions”.
  • 110.
    106 ATS AnnualReport 2015/1678 ATS Annual Report 2015/16 The segment information presented below is prepared in accordance with the Management Approach Concept as depicted in the Group’s inter- nal reporting (refer to Section I.B.b. “Segment Reporting”). Following ATS’s entry into the new business with IC substrates and the allocation of the new business to the Mobile Devices business unit, that unit has been renamed the Mobile Devices Substrates business unit. Both mobile applications and substrates now have appropriate organisa- tional structures, whereas management reporting continues to be performed for the Mobile Devices Substrates segment as a whole. At the beginning of financial year 2015/16, the business unit Industrial Automotive was renamed Automotive, Industrial, Medical. This change was made to underline the growing significance of business with medical devices in both therapy and diagnosis. The primary reportable segments consist of the business units Mobile Devices Substrates, Automotive, Industrial, Medical and Others. The Others segment includes the business unit Advanced Packaging, which is in the development phase. The Advanced Packaging segment neither reaches the quantitative threshold levels, nor are this business unit's opportunities and risks material to the Group as a whole. It is therefore not presented as a standalone segment in segment reporting. The Others segment further includes general holding activities as well as the Group’s financing activities. The central operating result control reference is the operating result before depreciation and amortisation. The respective reconciliation to Group figures also includes the corresponding consolidation. Transfers and transactions between the segments are executed at arm’s length, as with independent third parties. Segment reporting is pre- pared in accordance with the principles set out in I.B. “Accounting and measurement policies”. € in thousands Mobile Devices Substrates Automotive, Industrial, Medical Others Elimination/ Consolidation Group 2015/16 2014/15 2015/16 2014/15 2015/16 2014/15 2015/16 2014/15 2015/16 2014/15 Segment revenue 539,665 455,192 326,679 301,790 22,135 10,913 (125,600) (100,885) 762,879 667,010 Internal revenue (87,206) (73,115) (20,143) (18,898) (18,251) (8,872) 125,600 100,885 – – External revenue 452,459 382,077 306,536 282,892 3,884 2,041 – – 762,879 667,010 Operating result before depreciation/amortisation 126,439 127,501 30,087 34,780 10,876 5,211 86 79 167,488 167,571 Depreciation/amortisation (78,182) (67,368) (10,856) (8,874) (1,481) (1,243) – – (90,519) (77,485) Operating result 48,257 60,133 19,231 25,906 9,395 3,968 86 79 76,969 90,086 Finance costs - net (8,135) (5,103) Profit before tax 68,834 84,983 Income taxes (12,883) (15,634) Profit for the year 55,951 69,349 Property, plant and equipment and intangible assets 696,578 567,909 92,695 70,036 3,624 10,930 – – 792,897 648,875 Additions to property, plant and equipment and intangible assets 271,752 126,825 29,362 25,515 1,869 2,135 – – 302,983 154,475 II. Segment Reporting
  • 111.
    107Consolidated Financial Statements ConsolidatedFinancial Statements 79 INFORMATION BY GEOGRAPHIC REGION Revenue broken down by customer region, based on customer’s headquarters: € in thousands 2015/16 2014/15 Austria 17,525 19,308 Germany 163,374 142,269 Other European countries 46,073 41,562 China 32,387 27,429 Other Asian countries 75,603 80,687 Americas 427,917 355,755 Revenue 762,879 667,010 56% of total revenue (52% in the financial year 2014/15) is attributable to the five largest customers in terms of revenue. Property, plant and equipment and intangible assets broken down by domicile: € in thousands 31 Mar 2016 31 Mar 2015 Austria 66,054 49,019 China 696,534 567,867 Others 30,309 31,989 Total 792,897 648,875
  • 112.
    108 ATS AnnualReport 2015/1680 ATS Annual Report 2015/16 1. REVENUE € in thousands 2015/16 2014/15 Main revenue 762,646 666,705 Incidental revenue 233 305 Revenue 762,879 667,010 2. TYPES OF EXPENSES The expense types of cost of sales, distribution costs and general and administrative costs are as follows: € in thousands 2015/16 2014/15 Cost of materials 267,806 227,503 Staff costs 160,898 133,572 Depreciation/amortisation 79,679 67,755 Purchased services incl. leased personnel 46,405 46,744 Energy 41,415 37,786 Maintenance (incl. spare parts) 47,022 40,732 Transportation costs 14,845 13,086 Rental and leasing expenses 5,634 4,878 Change in inventories (3,023) (12,231) Other 14,566 11,403 Total 675,247 571,228 In the financial years 2015/16 and 2014/15, the item “Other” mainly relates to travel expenses, insurance expenses, IT service costs, legal and consulting fees. 3. RESEARCH AND DEVELOPMENT COSTS In the financial year 2015/16, the Group incurred research and development costs in the amount of € 34,428 thousand (in the financial year 2014/15: € 28,150 thousand). The stated amounts represent only costs which can be directly allocated and which are recognised in the profit and loss under cost of sales. In these consolidated financial statements, development costs of € 61,052 thousand (in the financial year 2014/15: € 29,789 thousand) were capitalised. Reference is made to Note 9 “Intangible assets”. 4. OTHER OPERATING RESULT € in thousands 2015/16 2014/15 Income from the reversal of government grants 191 309 Government grants for expenses 3,193 3,402 Income/(expenses) from exchange differences 52 987 Gains/(losses) from the disposal of non-current assets (632) (114) Impairments of property, plant and equipment1) (3,113) (5,966) Start-up losses (10,774) (8,703) Miscellaneous other income 420 4,389 Other operating result (10,663) (5,696) 1) Reference is made to Note 8 Property, plant and equipment. In the financial years 2015/16 and 2014/15, government grants for expenses mainly relate to export refunds as well as research and develop- ment awards. Similar to prior financial year 2014/15, start-up losses resulted in the financial year 2015/16 from the construction of the new plant in Chongqing, China and from costs relating to the construction of a new line in Hinterberg-Leoben, Austria. In the financial year 2015/16, the item “Miscellaneous other income” mainly relates to services in-kind for miscellaneous projects and the derecognition of other liabilities III. Notes to the Consolidated Statement of Profit or Loss
  • 113.
    109Consolidated Financial StatementsConsolidatedFinancial Statements 81 written off. In the financial year 2014/15, the item “Miscellaneous other income” mainly relates to the reduction in the provision for building space no longer used – reference is made to Note 18 “Other Provisions” – as well as to one-off income from a compensation payment made by a supplier. 5. NON-RECURRING ITEMS In the past and previous financial year no non-recurring costs or income were incurred. 6. FINANCE COSTS - NET € in thousands 2015/16 2014/15 Interest income from held to maturity investments, financial assets at fair value through profit or loss and available-for-sale financial assets 1,610 35 Other interest income 1,437 2,232 Gains from the sale of cash equivalents – 91 Realised gains from derivative financial instruments, net 604 – Foreign exchange gains, net 3,882 6,709 Finance income 7,533 9,067 Interest expense on bank borrowings and bonds (8,860) (11,308) Net interest expense on personnel-related liabilities (363) (1,327) Realised losses from derivative financial instruments, net – (690) Losses from the measurement of derivative financial instruments at fair value, net (3,871) – Other financial expenses (2,574) (845) Finance costs (15,668) (14,170) Finance costs - net (8,135) (5,103) In accordance with IAS 23, the item “Interest expense on bank borrowings and bonds” includes capitalised borrowing costs in the amount of € 6,620 thousand (financial year 2014/15: € 2,791 thousand), net. 7. INCOME TAXES Income taxes are broken down as follows: € in thousands 2015/16 2014/15 Current income taxes 15,821 14,564 Deferred taxes (2,938) 1,070 Total tax expense 12,883 15,634 The difference between the Group’s actual tax expense and the theoretical amount that would arise using the Austrian corporate income tax rate is as follows: € in thousands 2015/16 2014/15 Expected tax expense at Austrian tax rate 17,209 21,245 Effect of different tax rates in foreign countries (5,057) (5,354) Non-creditable foreign withholding taxes 1,825 1,142 Effect of change in previously unrecognised tax losses and temporary differences (807) (938) Effect of the change in tax rate (622) 979 Effect of permanent differences 195 (1,479) Effect of taxes from prior periods 140 39 Total tax expense 12,883 15,634
  • 114.
    110 ATS AnnualReport 2015/1682 ATS Annual Report 2015/16 Deferred income tax assets and liabilities are offset when there is a legally enforceable right to offset current tax assets against current tax liabili- ties and when the deferred taxes and liabilities relate to taxes levied by the same taxation authority. The amounts after setting off deferred income tax assets against deferred liabilities are as follows: € in thousands 31 Mar 2016 31 Mar 2015 Assets Liabilities Assets Liabilities Non-current assets 26,639 (4,740) 23,435 (2,806) Provisions for employee benefits 4,607 – 4,977 – Temporary differences arising from shares in subsidiaries – – 46 – Losses not yet realised from hedging instruments for cash flow hedges, recognised in equity – – 944 – Income tax loss carryforwards including taxable goodwill 1,620 – 415 – Deferred income tax from long-term assets/liabilities 32,866 (4,740) 29,817 (2,806) Non-current assets 3,505 – 2,897 – Trade and other receivables 8 – 16 – Trade and other payables 1,871 – 2,994 – Others 466 – 1,682 – Temporary differences arising from shares in subsidiaries – (8,844) – (7,675) Others – (151) – (398) Deferred income tax from short-term assets/liabilities 5,850 (8,995) 7,589 (8,073) Deferred income tax assets/liabilities 38,716 (13,735) 37,406 (10,879) Deferred income tax assets/liabilities, offsetting against the same taxation authority (4,890) 4,891 (3,105) 3,105 Deferred income tax assets/liabilities, net 33,826 (8,844) 34,301 (7,774) At 31 March 2016, the Group has income tax loss carryforwards and tax-deductible amortisation of goodwill amounting to a total of € 147,797 thousand (at 31 March 2015: € 171,820 thousand), which for the most part can be carried forward for an unlimited period of time. For loss carryforwards amounting to € 138,279 thousand (at 31 March 2015: € 164,163 thousand), included in this figure, deferred income tax assets in the amount of € 34,570 thousand (at 31 March 2015: € 42,083 thousand) were not recognised since it is unlikely that they will be realised in the foreseeable future. Deferred income taxes (net) changed as follows: € in thousands 2015/16 2014/15 Carrying amount at the beginning of the financial year 26,527 18,800 Currency translation differences (3,736) 7,958 Income recognised in profit or loss 2,938 (1,070) Income taxes recognised in equity (747) 839 Carrying amount at the end of the financial year 24,982 26,527
  • 115.
    111Consolidated Financial StatementsConsolidatedFinancial Statements 83 Income taxes in connection with the components of other comprehensive income are as follows: 2015/16 2014/15 € in thousands Income/ (expense) before taxes Tax income/ (expense) Income/ (expense) after taxes Income/ (expense) before taxes Tax income/ (expense) Income/ (expense) after taxes Currency translation differences (82,521) – (82,521) 161,373 – 161,373 Gains/(losses) on the measurement of hedging instruments for cash flow hedges 3,775 (944) 2,831 (3,356) 839 (2,517) Remeasurements of post-employment obligations 2,462 197 2,659 (6,757) – (6,757) Other comprehensive income (76,284) (747) (77,031) 151,260 839 152,099
  • 116.
    112 ATS AnnualReport 2015/1684 ATS Annual Report 2015/16 8. PROPERTY, PLANT AND EQUIPMENT € in thousands Land, plants and buildings Machinery and technical equipment Tools, fixtures, furniture and office equipment Prepayments and construction in progress Total Carrying amount 31 Mar 2014 46,996 267,635 4,865 115,607 435,103 Exchange differences 18,381 77,073 994 26,411 122,859 Additions 7,890 68,478 2,925 43,650 122,943 Disposals (3) (658) ‒ ‒ (661) Transfers 27,163 53,572 11 (80,746) ‒ Impairment ‒ (5,966) ‒ ‒ (5,966) Depreciation, current (4,656) (63,998) (1,960) ‒ (70,614) Carrying amount 31 Mar 2015 95,771 396,136 6,835 104,922 603,664 Thereof Acquisition cost 135,314 1,088,131 27,223 104,922 1,355,590 Accumulated depreciation (39,543) (691,995) (20,388) ‒ (751,926) Exchange differences (8,701) (39,227) (583) (12,557) (61,068) Additions 386 87,365 4,428 143,434 235,613 Disposals ‒ (1,044) (86) ‒ (1,130) Transfers 54 91,228 832 (92,114) ‒ Impairment ‒ (3,113) ‒ ‒ (3,113) Depreciation, current (6,195) (76,048) (2,562) ‒ (84,805) Carrying amount 31 Mar 2016 81,315 455,297 8,864 143,685 689,161 Thereof Acquisition cost 123,028 1,148,510 27,817 143,685 1,443,040 Accumulated depreciation (41,713) (693,213) (18,953) ‒ (753,879) The value of the land included in “Land, plants and buildings” amounts to € 1,701 thousand (at 31 March 2015: € 1,858 thousand). Depreciation in the current financial year is recognised mainly in cost of sales, as well as in distribution costs, general and administrative costs, and in start-up losses recognised in other comprehensive income. In the financial year 2015/16, borrowing costs on qualifying assets of € 5,365 thousand were capitalised (in the financial year 2014/15: € 2,557 thousand). A financing rate of 4.1% was applied (in the financial year 2014/15: 3.6%). IMPAIRMENT Impairment of machinery and technical equipment amounted to € 3,113 thousand (in the financial year 2014/15: € 5,966 thousand) in the financial year 2015/16. In both years this impairment resulted from machines that are no longer usable in the segment Mobile Devices Substrates. IV. Notes to the Consolidated Statement of Financial Position
  • 117.
    113Consolidated Financial StatementsConsolidatedFinancial Statements 85 9. INTANGIBLE ASSETS € in thousands Industrial property and similar rights and assets, and licenses in such rights and assets Capitalised development costs Goodwill Prepayments Other intangible assets Total Carrying amount 31 Mar 2014 1,313 140 ‒ 7,692 ‒ 9,145 Exchange differences 85 5,354 ‒ ‒ ‒ 5,439 Additions 1,535 29,789 ‒ ‒ 208 31,532 Amortisation, current (697) ‒ ‒ ‒ (208) (905) Carrying amount 31 Mar 2015 2,236 35,283 ‒ 7,692 ‒ 45,211 Thereof Acquisition cost 16,572 35,283 7,767 7,692 ‒ 67,314 Accumulated amortisation (14,336) ‒ (7,767) ‒ ‒ (22,103) Exchange differences (52) (6,204) ‒ 12 ‒ (6,244) Additions 5,877 61,052 ‒ 87 354 67,370 Transfers 7,791 ‒ ‒ (7,791) ‒ ‒ Amortisation, current (930) (1,317) ‒ ‒ (354) (2,601) Carrying amount 31 Mar 2016 14,922 88,814 ‒ ‒ ‒ 103,736 Thereof Acquisition cost 29,987 90,065 7,132 ‒ ‒ 127,184 Accumulated amortisation (15,065) (1,251) (7,132) ‒ ‒ (23,448) Amortisation for the current financial year is charged to cost of sales, distribution costs, general and administrative costs and other operating result. The Group’s largest development project is the development of a new technology for the production of substrates for silicon semiconductor chips taking place for the project Chongqing. As the evidence required for the capitalisation of development costs was provided for this project, the corresponding costs were recognised in the consolidated financial statements. The serial production of substrates and the scheduled amorti- sation of development costs started in March 2016. In the financial year 2015/16, borrowing costs of € 1,255 thousand were capitalised with regards to capitalised development costs (in the finan- cial year 2014/15: € 234 thousand). A financing rate of 4.1% was applied (in the financial year 2014/15: 3.6%). IMPAIRMENTS In the financial years 2015/16 and 2014/15, there were no impairments to be recognised on intangible assets. The impairment test for the development project in Chongqing, China that had not yet been completed in the financial year 2014/15 was based on calculations of the value in use. Value in use is determined annually in accordance with the DCF method, based on the following critical assumptions in the prior year:  Long-term growth rate: 5%  (Input tax) discount rate: 11.1% Due to the project’s long-term nature and in order to adequately take into account cash outflows from the substrate business expected in future periods, the calculation of the value in use was based on the expected cash flows for the next ten years. A consideration over a shorter period of time would lead to a disproportionately increased weighting of cash inflows.
  • 118.
    114 ATS AnnualReport 2015/1686 ATS Annual Report 2015/16 10. OTHER NON-CURRENT ASSETS € in thousands 31 Mar 2016 31 Mar 2015 Prepayments 6,081 6,878 Deposits made 5,477 5,013 Other non-current receivables 27,961 17,594 Carrying amount 39,519 29,485 Prepayments relate to long-term rent prepayments for the factory premises in China. Other non-current receivables comprise input tax reim- bursements in China for the plant Chongqing, which will be recovered gradually through VAT liabilities during the operating phase. 11. INVENTORIES € in thousands 31 Mar 2016 31 Mar 2015 Raw materials and supplies 28,918 32,558 Work in progress 23,871 22,533 Finished goods 30,649 34,131 Carrying amount 83,438 89,222 The balance of inventory write-downs recognised as an expense amounts to € 17,454 thousand as of 31 March 2016 (€ 13,953 thousand at 31 March 2015). As in the previous year, no material write-downs resulted from the measurement of inventories at net realisable value in the financial year 2015/16. 12. TRADE AND OTHER RECEIVABLES The carrying amounts of trade and other receivables are as follows: € in thousands 31 Mar 2016 31 Mar 2015 Trade receivables 110,275 113,886 Impairments for trade receivables (322) (394) VAT receivables 14,242 15,140 Other receivables from authorities 3,564 6,253 Prepayments 3,750 4,722 Energy tax refunds 1,170 1,937 Deposits 1,589 977 Other receivables 419 609 Total 134,687 143,130 As at 31 March 2016 and 31 March 2015, other receivables mainly include receivables resulting from prepaid expenses and accrued charges. Trade receivables amounting to € 32,000 thousand (at 31 March 2015: € 32,000 thousand) act as collateral in connection with various financing agreements. Reference is made to Note 16 “Financial liabilities”. Taking impairment into account, the carrying amounts of trade and other receivables approximate their fair values. REMAINING MATURITIES OF RECEIVABLES All receivables as at 31 March 2016 and 31 March 2015 have remaining maturities of less than one year.
  • 119.
    115Consolidated Financial StatementsConsolidatedFinancial Statements 87 DEVELOPMENT OF PAST DUE RECEIVABLES AND IMPAIRMENTS OF TRADE RECEIVABLES 31 Mar 2016 thereof not impaired thereof not impaired and not insured and past due for the following periods € in thousands Carrying amount and not past due or insured less than 3 months between 3 and 6 months between 6 and 12 months more than 12 months Trade receivables 110,275 109,306 593 17 37 – 31 Mar 2015 thereof not impaired thereof not impaired and not insured and past due for the following periods € in thousands Carrying amount and not past due or insured less than 3 months between 3 and 6 months between 6 and 12 months more than 12 months Trade receivables 113,886 112,508 957 27 – – There were no indications at the balance sheet date, that trade receivables not impaired and overdue would not be paid. Impairments of trade receivables have developed as follows: € in thousands 2015/16 2014/15 Impairments at the beginning of the year 394 82 Utilisation (7) – Reversal (275) – Addition 232 253 Currency translation differences (22) 59 Impairments at the end of the year 322 394 13. FINANCIAL ASSETS The carrying amounts of the financial assets are as follows: € in thousands 31 Mar 2016 thereof non-current thereof current Financial assets at fair value through profit or loss 631 – 631 Available-for-sale financial assets 96 96 – Held-to maturity investments 87,186 – 87,186 Total 87,913 96 87,817 € in thousands 31 Mar 2015 thereof non-current thereof current Financial assets at fair value through profit or loss 780 – 780 Available-for-sale financial assets 96 96 – Total 876 96 780 FINANCIAL ASSETS AT FAIR VALUE THROUGH PROFIT OR LOSS € in thousands 31 Mar 2016 31 Mar 2015 Bonds 631 780 All bonds are denominated in euro (nominal currency).
  • 120.
    116 ATS AnnualReport 2015/1688 ATS Annual Report 2015/16 AVAILABLE-FOR-SALE FINANCIAL ASSETS € in thousands 2015/16 2014/15 Carrying amount at the beginning of the year 96 96 Disposals – – Realised gains/(losses) from the current period, removed from equity – – Exchange differences – – Carrying amount at the end of the year 96 96 All available-for-sale financial assets are denominated in euro. FINANCIAL INSTRUMENTS HELD TO MATURITY The held to maturity financial investments are denominated in euro and Chinese yuan renminbi (nominal currencies). They mainly consist of time deposits, wealth management products with interest and capital guarantees, and discountable bank bills with a maturity of more than three and less than twelve months. 14. CASH AND CASH EQUIVALENTS € in thousands 31 Mar 2016 31 Mar 2015 Bank balances and cash on hand 171,866 273,919 Carrying amount 171,866 273,919 The reported carrying amounts correspond to the respective fair values. 15. TRADE AND OTHER PAYABLES Remaining maturity € in thousands 31 Mar 2016 Less than 1 year Between 1 and 5 years More than 5 years Trade payables 130,668 130,668 ‒ ‒ Government grants 7,164 152 3,851 3,161 Liabilities to fiscal authorities and other state authorities 4,131 4,131 ‒ ‒ Liabilities to social security authorities 3,888 3,888 ‒ ‒ Liabilities from unconsumed vacations 5,856 5,856 ‒ ‒ Liabilities from stock options 207 207 ‒ ‒ Liabilities from stock appreciation rights 743 ‒ 743 ‒ Liabilities to employees 25,842 25,842 ‒ ‒ Other liabilities 9,513 9,513 ‒ ‒ Carrying amount 188,012 180,257 4,594 3,161
  • 121.
    117Consolidated Financial StatementsConsolidatedFinancial Statements 89 Remaining maturity € in thousands 31 Mar 2015 Less than 1 year Between 1 and 5 years More than 5 years Trade payables 97,785 97,785 ‒ ‒ Government grants 4,265 311 3,868 86 Liabilities to fiscal authorities and other state authorities 5,853 5,853 ‒ ‒ Liabilities to social security authorities 2,523 2,523 ‒ ‒ Liabilities from unconsumed vacations 5,303 5,303 ‒ ‒ Liabilities from stock options 418 54 364 ‒ Liabilities from stock appreciation rights 397 ‒ 397 ‒ Liabilities to employees 29,133 29,133 ‒ ‒ Other liabilities 8,489 8,447 42 ‒ Carrying amount 154,166 149,409 4,671 86 The carrying amounts of the reported liabilities approximate the respective fair values. GOVERNMENT GRANTS Government grants mainly relate to grants for land-use rights and property, plant and equipment and are released to profit or loss according to the useful life of the related property, plant and equipment. Furthermore, the Group received grants for project costs for several research projects which are recognised in income on a pro rata basis ac- cording to the costs incurred and the grant ratio. Associated deferred amounts are included in government grants. LIABILITIES FROM STOCK OPTIONS Due to the expiry of the stock option plan (2005 to 2008), the 1 st meeting of the Nomination and Remu- neration Committee of the Supervisory Board on 17 March 2009 passed a resolution to implement another stock option plan (SOP 2009 from 2009 to 2012) after it had been submitted for appraisal to the 55 th meeting of the Supervisory Board on 16 December 2008. Granting of stock options was possible in the period between 1 April 2009 and 1 April 2012. Each of these options entitles the holder to the right to either:  purchase shares (equity-settled share-based payment transactions) or  settlement in cash (cash-settled share-based payment transactions) at the remaining amount between the exercise price and the closing rate of ATS shares on the main stock exchange on which ATS shares are listed at the date the option is exercised by the beneficiary. The exercise price is determined at the respective date of grant and is calculated as the average ATS share price over a period of six calendar months prior to the date of grant plus 10%. The exercise price, however, corresponds at least to the nominal value of one share in the Company. Granted options vest gradually with 20% of the options after two years, 30% of the options after three years and 50% of the options after four years. The stock options may be exercised in full or in part after completion of the vesting period, not however during a restricted period. Op- tions not exercised can be exercised after the expiry of the subsequent waiting period. Options not exercised within five years after the grant date become invalid and forfeit without compensation. In the event that a restricted period comprises the end of this five-year period, this re- stricted period will interrupt the five-year period concerned. After the end of the restricted period, stock options may still be exercised for a period corresponding to the interruption. Stock options not exercised by the end of this five-year period (extended as stated above) become invalid and forfeit without compensation. The stock options could be granted in the period between 1 April 2009 and 1 April 2012. A new stock option plan starting on 1 April 2013 was not concluded.
  • 122.
    118 ATS AnnualReport 2015/1690 ATS Annual Report 2015/16 The following table shows the development of the stock options in the financial years 2015/16 and 2014/15. Date of grant 1 April 2012 1 April 2011 1 April 2010 Exercise price (in €) 9.86 16.60 7.45 31 Mar 2014 88,500 88,500 88,500 Number of options exercised – – 84,000 Number of options expired 1,500 1,500 1,500 31 Mar 2015 87,000 87,000 3,000 Number of options exercised 24,500 – – Number of options expired – – 3,000 31 Mar 2016 62,500 87,000 – Remaining contract period of stock options 1 year 3 months1) – Fair value of granted stock options at the balance sheet date (in € thousands) 31 Mar 2015 417 32 21 31 Mar 2016 194 – – 1) Restricted period ending in the middle of June after three days of exercise period. Reference is made to Note 27 “Related party transactions”. The weighted average share price on the day of execution of all options exercised in the financial year 2015/16 is € 15.36 (in the financial year 2014/15: € 9.93). These stock options are measured at fair value at the respective balance sheet date using the Monte Carlo method and based on the model assumptions and valuation parameters stated below. The values determined for the measurement of the liabilities may differ from the values later realised on the market for all stock options granted as of 1 April 2011 and 1 April 2012. Risk-free interest rate -0.47% Volatility 37.24% Volatility is calculated based on the daily share prices from 4 May 2015 until the balance sheet date. The fair value of the stock options granted is recognised as an expense over their term. At 31 March 2016, the stock options’ exercisable intrinsic value is € 58 thousand (at 31 March 2015: € 104 thousand). As at 31 March 2016, 19,000 stock options still are exercisable from the grant of 1 April 2012 and 87,000 stock options are exercisable from the grant of 1 April 2011. As at 31 March 2015, 3,000 stock options are exercisable from the grant of 1 April 2010, 43,500 stock options are exercisa- ble from the grant of 1 April 2011 and 17,400 stock options are exercisable from the grant of 1 April 2012. LIABILITIES FROM STOCK APPRECIATION RIGHTS Due to the expiry of the stock option plan (2009 to 2012), the 81 st Supervisory Board meet- ing on 3 July 2014 passed a resolution to introduce a long-term incentive programme based on stock appreciation rights (SAR). SAR relate to the value increase in share prices based on the development of the share price. SAR may be granted in the period between 1 April 2014 and 1 April 2016. Each SAR entitles the holder to the right to a cash settlement at the remaining amount between the exercise price and the closing price of the ATS share on the main stock exchange on which it is listed (currently the Vienna Stock Exchange) at the date the subscription right is exercised.
  • 123.
    119Consolidated Financial StatementsConsolidatedFinancial Statements 91 The exercise price of SAR is determined at the respective date of grant, corresponding to the average closing price of the ATS share on the Vienna Stock Exchange or at the main stock exchange on which the ATS share is listed over a period of six calendar months immediately pre- ceding the date of grant. SAR may be exercised in full or in part after the respective completion of a three-year period following the date of grant, but not during a re- stricted period. Granted stock appreciation rights not exercised within five years after the grant date become invalid and forfeit without com- pensation. SAR may only be exercised by the beneficiaries if the following requirements are met at the date of exercise:  The beneficiary’s employment contract with a company in the ATS Group remains valid. Subject to certain conditions, rights may also be exercised within a year after termination of the employment contract.  The required personal investment in the amount of 20% of the first amount granted (in SAR) in ATS shares is held. If the personal investment is not fully established by the end of the three-year waiting period, all previously granted SAR become forfeit in full. The established personal investment must be held over the complete period of participation in the programme and also applies to the grant in subsequent years. The personal investment may only be wound down when exercise is no longer possible.  The earnings per share (EPS) performance target was met. The level of attainment of the earnings per share performance indicator deter- mines how many of the granted SAR may actually be exercised. The target value is the EPS value determined in the mid-term plan for the bal- ance sheet date of the third year after the grant date. If the EPS target is attained at 100% or surpassed, the granted SAR may be exercised in full. If attainment is between 50% and 100%, the granted SAR may be exercised on a pro rata basis. If the EPS value attained is below 50%, the granted SAR become forfeit in full. Number and allocation of granted SAR: Date of grant 1 April 2015 1 April 2014 Exercise price (in €) 10.70 7.68 Number of stock appreciation rights granted – 230,000 31 Mar 2015 – 230,000 Number of stock appreciation rights granted 240,000 – Number of stock appreciation rights expired 5,000 5,000 31 Mar 2016 235,000 225,000 Remaining contract period of stock appreciation rights granted 4 years 3 years Fair value of granted stock appreciation rights as at the balance sheet date (in € thousands) 31 Mar 2015 – 1,192 31 Mar 2016 418 832 SAR are measured at fair value at the respective balance sheet date using the Monte Carlo method and based on the model assumptions and valuation parameters stated below. The values determined for calculation of the liabilities may differ from the values later realised on the mar- ket. Risk-free interest rate -0.37 to -0.47% Volatility 33.40 to 34.69% Volatility is calculated based on the daily share prices from 1 March 2013 until the balance sheet date. The fair value of the SAR granted is recognised as an expense over their term.
  • 124.
    120 ATS AnnualReport 2015/1692 ATS Annual Report 2015/16 OTHER LIABILITIES Other liabilities mainly include debtors with credit balances, accrued legal, audit and consulting fees, as well as other accru- als. 16. FINANCIAL LIABILITIES Remaining maturity € in thousands 31 Mar 2016 Less than 1 year Between 1 and 5 years More than 5 years Nominal Interest rate in % Bonds 76,798 76,798 – – 5.00 Export loans 32,000 32,000 – – 0.29 Loans from state authorities 741 213 528 – 0.75-2.00 Other bank borrowings 409,561 52,402 280,853 76,306 1.16-5.18 Derivative financial instruments1) 3,871 – 3,871 – Carrying amount 522,971 161,413 285,252 76,306 Remaining maturity € in thousands 31 Mar 2015 Less than 1 year Between 1 and 5 years More than 5 years Nominal Interest rate in % Bonds 101,505 1,822 99,683 – 5.00 Export loans 32,000 32,000 – – 0.49 Loans from state authorities 508 – 508 – 0.75-2.00 Other bank borrowings 267,515 12,215 219,116 36,184 1.15-5.76 Derivative financial instruments1) 3,777 – 2,266 1,511 Carrying amount 405,305 46,037 321,573 37,695 1) Reference is made to Note 19 “Derivative financial instruments”. The bond with a total nominal amount of € 100 million was placed by the Company on 18 November 2011 with a term to maturity of five years and is listed on the Second Regulated Market of the Vienna Stock Exchange. The bond has a denomination of € 1,000 and the annual fixed inter- est of 5.00% of the nominal value is payable on 18 November of each year in arrears. The bonds proceed is used for the general corporate pur- poses. The bond is subject to the following terms and conditions: The bondholders do not have an ordinary cancellation right. An extraordinary cancel- lation right has been agreed if the following events occur at the Company or one of its main subsidiaries:  Cessation of payments or announcement of insolvency or over-indebtedness,  Bankruptcy or other insolvency proceedings (with the exception: of court settlement) or liquidation,  Significant deterioration of the financial position and performance due to the discontinuation of the major part of operations, sale of major parts of the assets or non-arm’s length transactions with related parties  Change of control as stipulated in the Austrian Takeover Act (Übernahmegesetz), if this significantly affects the ability to meet the bond obliga- tions. € 18.0 million of the total nominal amount of € 100 million was repurchased on 22 October 2015 and € 6.5 million on 25 February 2016 ahead of schedule. Other bank borrowings mainly include long-term investment financing in addition to the current liquidity needs.
  • 125.
    121Consolidated Financial StatementsConsolidatedFinancial Statements 93 In order to refinance the capital needed for the plant in Chongqing, a long-term loan was raised under an OeKB equity financing programme in the financial year 2012/13. Loan is being repaid in semi-annual instalments between September 2014 and February 2020. 80% of the loan bears a fixed interest rate and 20% a variable interest rate, with the variable portion scheduled to be repaid first. The main contract terms are as fol- lows:  Net debt/EBITDA max. 4  Equity ratio of at least 30%  No change of control In order to secure planned investments in Chongqing and to further optimise the funding of the Group, a promissory note loan was successfully placed for a total amount of € 158 million in February 2014. Loan comprises several tranches with terms to maturity of five, seven and ten years bearing variable and fixed interest rates. The loan was concluded in euros and US dollars. The variable euro interest rate was hedged in full by interest rate swaps. The main contract terms are as follows:  Equity ratio of at least 35%  Net Debt/EBITDA 3 (step-up covenant)  Change of control within the meaning of the Austrian Takeover Act if this change of control significantly affects the ability to meet the loan obligations. If the step-up covenant is exceeded, the margin increases by 75 basis points. The promissory note loan is recognised in other bank borrowings. To further optimise the funding of the Group, the variable interest rate tranches denominated in euros of € 92 million were terminated and repaid in October 2015 and February 2016. The interest rate swaps continue to be used to secure the variable tranches of the promissory note loans placed in October 2015. Due to different maturities and amounts, no effective hedging exists. In order to secure planned investments and to further optimise the funding of the Group, a promissory note loan was successfully placed for a total amount of € 221 million in October 2015. Loan comprises several tranches with terms of maturity of five and seven years bearing variable and fixed interest rates. The loan was concluded in euros and US dollars. The main contract terms are as follows:  Net Debt/EBITDA 3 (step-up covenant)  Change of control within the meaning of the Austrian Takeover Act if this makes it illegal for the lender to maintain the loan due to mandatory statutory or regulatory provisions. If the step-up covenant is exceeded, the margin increases by 75 basis points. The promissory note loan is recognised in other bank borrowings.
  • 126.
    122 ATS AnnualReport 2015/1694 ATS Annual Report 2015/16 The contractually agreed (undiscounted) interest and redemption payments of the financial liabilities as at 31 March 2016, including interest rate hedging, are as follows in the coming financial years: € in thousands Bonds Export loans Loans from state authorities Other bank borrowings Derivative financial instruments 2016/17 Redemption 75,500 32,000 213 50,605 – Fixed interest 3,775 – 8 5,570 – Variable interest – 93 – 3,781 – 2017/18 Redemption – – 227 19,526 – Fixed interest – – 3 5,167 – Variable interest – – – 3,431 – 2018/19 Redemption – – – 76,870 2,280 Fixed interest – – 2 4,765 – Variable interest – – – 3,127 – 2019/20 Redemption – – 113 28,948 – Fixed interest – – 2 2,574 – Variable interest – – – 2,882 – 2020/21 Redemption – – 188 165,976 1,591 Fixed interest – – 1 2,289 – Variable interest – – – 2,225 – after 2020/21 Redemption – – – 76,607 – Fixed interest – – – 2,059 – Variable interest – – – 1,292 – With the exception of the export loan, which will probably be further extended, no significant deviations from the agreed interest and redemp- tion payments are expected regarding term or amount.
  • 127.
    123Consolidated Financial StatementsConsolidatedFinancial Statements 95 At the previous year’s balance sheet date of 31 March 2015, the contractually agreed (undiscounted) interest and redemption payments of the financial liabilities, including interest rate hedging, were as follows for the coming financial years: € in thousands Bonds Export loans Loans from state authorities Other bank borrowings Derivative financial instruments 2015/16 Redemption – 32,000 – 11,611 – Fixed interest 5,000 – 6 4,121 – Variable interest – 159 – 3,910 – 2016/17 Redemption 100,000 – 213 11,679 – Fixed interest 5,000 – 6 3,748 – Variable interest – – – 4,373 – 2017/18 Redemption – – 251 42,764 – Fixed interest – – 1 3,334 – Variable interest – – – 4,516 – 2018/19 Redemption – – 150 148,907 – Fixed interest – – 1 2,920 – Variable interest – – – 2,744 – 2019/20 Redemption – – 44 16,068 2,266 Fixed interest – – – 693 – Variable interest – – – 853 – after 2019/20 Redemption – – – 36,360 1,511 Fixed interest – – – 1,122 – Variable interest – – – 740 – Some of the bonds, loans from state authorities and other bank borrowings in part no longer bear market interest rates. For this reason, differ- ences may arise between their fair values and carrying amounts. Carrying amounts Fair values € in thousands 31 Mar 2016 31 Mar 2015 31 Mar 2016 31 Mar 2015 Bonds 76,798 101,505 77,388 105,000 Export loans 32,000 32,000 32,000 32,000 Loans from state authorities 741 508 745 520 Other bank borrowings 409,561 267,515 415,876 270,801 Derivative financial instruments 3,871 3,777 3,871 3,777 Total 522,971 405,305 529,880 412,098 The calculation of the fair values is based on the discounted value of future payments using current market interest rates, or the fair values are determined on the basis of listed prices.
  • 128.
    124 ATS AnnualReport 2015/1696 ATS Annual Report 2015/16 The carrying amounts of financial liabilities by currency are as follows: € in thousands 31 Mar 2016 31 Mar 2015 Euro 400,390 351,610 US Dollar 122,528 53,534 Others 53 161 Total 522,971 405,305 Bank borrowings are secured by trade receivables of € 32,000 thousand (at 31 March 2015: € 32,000 thousand). Reference is made to Note 12 “Trade and other receivables”. The Group’s unused credit lines are as follows: € in thousands 31 Mar 2016 31 Mar 2015 Export credit 8,000 8,000 Other credit 239,416 203,068 Total 247,416 211,068 LEASES Total future minimum lease payments recognised for non-cancellable operating leases and rental expenses are as follows: € in thousands 31 Mar 2016 31 Mar 2015 Less than 1 year 3,212 2,113 Between 1 and 5 years 6,388 7,133 More than 5 years 1,200 2,709 Total 10,800 11,955 The Group entered into various operating lease agreements for the rental of office space, properties and production facilities, as well as factory and office equipment and technical equipment. The obligations from operating leases mainly relate to sale and lease back transaction concluded in the financial year 2006/07 for the properties and buildings in Leoben-Hinterberg and Fehring, Austria, with a non-cancellable lease term until December 2021. The stated amounts also in- clude € 3,461 thousand at 31 March 2016 (at 31 March 2015: € 4,219 thousand) attributable to minimum lease payments from the operating lease for no longer used building spaces in Leoben-Hinterberg, which has already been included in the statement of financial position as other provisions. Reference is made to Note 18 “Other provisions”. The payments recognised as expense for non-cancellable lease and rental expenses in the financial year are as follows: € in thousands 2015/16 2014/15 Leasing and rental expenses 3,213 3,551 17. PROVISIONS FOR EMPLOYEE BENEFITS Provisions for employee benefits relate to pension commitments, severance payments and other employee benefits. DEFINED CONTRIBUTION PLANS The majority of the Group’s employees in Austria and some of its employees in India are covered by defined contribution pension plans that have been outsourced to a pension fund. For employees in Austria, the pension plans are supplemented by death and endowment insurance policies. Employer contributions are determined on the basis of a certain percentage of current remuneration.
  • 129.
    125Consolidated Financial StatementsConsolidatedFinancial Statements 97 Employer contributions under these plans amounted to € 491 thousand in the financial year 2015/16 and to € 472 thousand in the financial year 2014/15. DEFINED BENEFIT PLANS The Group operates defined benefit plans for several current and former members of the Management Board and former executive employees with no employee contribution required. The board members’ and other executive employees’ plans are partially funded through assets in pension funds and partially unfunded. Pension benefits of board members and executive employees are based on their salaries and years of service. Essentially, the Group is exposed to life expectancy and inflation risks due to future increases in pay and pensions and from the funding of deviations in yields. FUNDED SEVERANCE PAYMENTS The employees in India are entitled to severance payments upon retirement or, under certain circumstanc- es, upon leaving the company, the amount of which depends on years of service and the remuneration received by the respective member of staff. The severance payments range between half of monthly remuneration per year of service and a fixed maximum. Severance payment obli- gations are covered by a life insurance policy. The main risk to which the Group is exposed from these obligations is the risk of inflation due to future pay increases. UNFUNDED SEVERANCE PAYMENTS Employees in Austria, South Korea and China are entitled to receive severance payments, which are based upon years of service and remuneration received by the respective member of staff and are generally payable upon retirement and, under certain circumstances, upon leaving the company. For staff members having joined the company before 1 January 2003, the severance payments in Austria range from two to twelve months of monthly salary, with staff members in South Korea and China also entitled to a fixed amount depending on years of service and salary. The main risk to which the Group is exposed from these obligations is the risk of inflation due to future pay increases. For employees in Austria who joined on or after 1 January 2003, regular contributions are paid to a staff provision fund (“Mitarbeiter- vorsorgekasse”) without any further obligations on the part of the Group. The contributions for the financial year 2015/16 amounted to € 335 thousand and for the financial year 2014/15 to € 288 thousand. OTHER EMPLOYEE BENEFITS The employees of the companies in Austria and China are entitled to anniversary bonuses for long-term service, the eligibility to and amount of which in Austria are stipulated in the Collective Agreement. EXPENSES for (defined benefit) pension obligations, severance payments and other employee benefits consist of the following: Retirement benefits Severance payments Other employee benefits € in thousands 2015/16 2014/15 2015/16 2014/15 2015/16 2014/15 Current service cost 132 98 1,703 1,366 1,352 261 Interest expense 120 136 409 549 126 149 Remeasurement of obligations from other employee benefits – – – – 2,066 1,121 Expenses recognised in profit for the period 252 234 2,112 1,915 3,544 1,531 Remeasurement of obligations from post-employment benefits (905) 2,551 (1,556) 4,206 – – Expenses recognised in other comprehensive income (905) 2,551 (1,556) 4,206 – – Total (653) 2,785 556 6,121 3,544 1,531 Expenses for retirement, severance payments and other employee benefits are recognised in profit and loss under cost of sales, distribution costs, general and administrative costs and in other comprehensive income. Net interest expense on personnel-related liabilities is presented in “Finance costs – net”.
  • 130.
    126 ATS AnnualReport 2015/1698 ATS Annual Report 2015/16 Amounts accrued in the STATEMENT OF FINANCIAL POSITION are: € in thousands 31 Mar 2016 31 Mar 2015 Funded pension benefits 4,929 5,546 Unfunded pension benefits 1,394 1,493 Total pension benefits 6,323 7,039 Unfunded severance payments 22,091 22,284 Funded severance payments 252 202 Total severance payments 22,343 22,486 Other employee benefits 7,627 4,201 Provisions for employee benefits 36,293 33,726 Pension obligations and severance payments are as follows: Retirement benefits Severance payments € in thousands 31 Mar 2016 31 Mar 2015 31 Mar 2016 31 Mar 2015 Present value of funded obligations 14,941 15,862 1,055 1,014 Fair value of plan assets (10,012) (10,316) (803) (812) Funded status of funded obligations 4,929 5,546 252 202 Present value of unfunded obligations 1,394 1,493 22,091 22,284 Provisions recognised in the statement of financial position 6,323 7,039 22,343 22,486 The present value of projected pension benefits, the movement in plan assets (held to cover the pension benefits) and funded status are as follows: Funded retirement benefits Unfunded retirement benefits € in thousands 2015/16 2014/15 2015/16 2014/15 Present value of pension obligation: Present value at the beginning of the year 15,862 13,010 1,493 1,226 Current service cost 132 98 – – Interest expense 270 424 25 39 Remeasurement from the change in financial assumptions (759) 3,604 (53) 269 Remeasurement from adjustments based on past experience (230) (1,132) (8) 21 Benefits paid (334) (142) (63) (62) Present value at the end of the year 14,941 15,862 1,394 1,493 Fair value of plan assets: Fair value at the beginning of the year 10,316 9,919 Investment result (146) 211 Interest income 175 327 Benefits paid (333) (141) Fair value at the end of the year 10,012 10,316 Funded status of funded pension benefits 4,929 5,546 As at 31 March 2016, the average maturity of funded pension benefits is 16 years and of unfunded pension benefits 13 years.
  • 131.
    127Consolidated Financial StatementsConsolidatedFinancial Statements 99 Plan assets held to cover the pension obligations have been transferred to pension funds. The diversification of the portfolio is as follows: in % 31 Mar 2016 31 Mar 2015 Debt securities 54% 39% Equity securities 33% 45% Real estate 4% 4% Cash and cash equivalents 9% 12% Total 100% 100% A significant portion of plan assets is traded in an active market. The aggregate movement in funded and unfunded severance payments is as follows: Funded severance payments Unfunded severance payments € in thousands 2015/16 2014/15 2015/16 2014/15 Present value of severance payment obligation: Present value at the beginning of the year 1,014 674 22,284 16,505 Exchange differences (116) 181 (196) 354 Service cost 64 50 1,639 1,316 Interest cost 74 64 396 544 Remeasurement from the change in demographic assumptions – – 253 (369) Remeasurement from the change in financial assumptions 29 59 (1,713) 3,820 Remeasurement from adjustments based on past experience 15 12 (130) 680 Benefits paid (25) (26) (442) (566) Present value at the end of the year 1,055 1,014 22,091 22,284 Fair value of plan assets: Fair value at the beginning of the year 812 608 Exchange differences (91) 149 Contributions 36 26 Investment result 10 (4) Interest income 61 59 Benefits paid (25) (26) Fair value at the end of the year 803 812 Funded status of funded severance payments 252 202 As at 31 March 2016, the average maturity of unfunded severance payments is 12 years.
  • 132.
    128 ATS AnnualReport 2015/16100ATS Annual Report 2015/16 The aggregate movement in other employee benefits (anniversary bonuses) is as follows: € in thousands 2015/16 2014/15 Present value at the beginning of the year 4,201 3,867 Exchange differences (290) 305 Service cost 1,352 261 Interest expense 126 149 Remeasurement from the change in demographic assumptions 363 (286) Remeasurement from the change in financial assumptions (292) 493 Remeasurement from adjustments based on past experience 1,995 914 Reclassification 1,968 – Benefits paid (1,795) (1,502) Present value at the end of the year 7,628 4,201 At 31 March 2016, the average maturity of other employee benefits is 11 years. The reclassification relates to an amount of € 1,968 thousand is the transfer of the short-term part of anniversary bonuses from trade and other payables. The following weighted actuarial parameters were used for the measurement at the balance sheet date: Retirement benefits Severance payments Other employee benefits (anniversary bonuses) 31 Mar 2016 31 Mar 2015 31 Mar 2016 31 Mar 2015 31 Mar 2016 31 Mar 2015 Discount rate 2.00 % 1.70 % 2.12 % 2.10 % 2.28 % 2.15 % Expected rate of remuneration increase 2.25 % 2.25 % 2.85 % 3.40 % 5.08 % 5.00 % Expected rate of pension increase 2.00 % 2.00 % – – – – Retirement age 65 65 1) 1) – – 1) Individual according to respective local legislation 18. OTHER PROVISIONS € in thousands Total Warranty Restructuring Others Carrying amount 31 Mar 2015 12,660 2,515 8,153 1,992 Utilisation (1,421) (178) (622) (621) Reversal (1,796) (1,796) – – Addition 2,885 1,856 – 1,029 Interest effect 15 – 15 – Exchange differences (306) (199) – (107) Carrying amount 31 Mar 2016 12,037 2,198 7,546 2,293
  • 133.
    129Consolidated Financial StatementsConsolidatedFinancial Statements101 € in thousands Total Warranty Restructuring Others Carrying amount 31 Mar 2014 12,809 893 10,816 1,100 Utilisation (1,970) (240) (1,030) (700) Reversal (2,578) (530) (1,612) (436) Addition 3,978 2,005 – 1,973 Interest effect (21) – (21) – Exchange differences 442 387 – 55 Carrying amount 31 Mar 2015 12,660 2,515 8,153 1,992 € in thousands 31 Mar 2016 31 Mar 2015 thereof non-current 6,957 7,545 thereof current 5,080 5,115 Carrying amount 12,037 12,660 WARRANTY PROVISION This item relates to the costs of already existing and expected complaints about products still under warranty. The accrued amount is the best estimate of these costs based on past experience and actual facts, and is not yet recognised as a liability due to the uncertainty as to amount and timing. The amount of expected costs includes amounts assumed from product liability insurance. PROVISION FOR THE RESTRUCTURING This provision relates to future vacancy costs for no longer used building space based on the non- cancellable property lease obligation as well as to a potential loss from the utilisation of the property by the lessor which is to be borne by the lessee. In the financial year 2014/15, the value was adjusted due to the reduction in unused building space. The provision was largely recognised as the present value of the expenses expected to be incurred until the end of the non-cancellable property lease obligation in December 2021. Additionally, a provision for the closure of the plant in Klagenfurt recognised in the financial year 2013/14 was utilised in the financial year 2014/15. OTHERS This item relates to provisions for risks from pending losses on onerous contracts and to provisions for the risks associated with pension scheme contributions in Asia resulting from the uncertain legal situation there. 19. DERIVATIVE FINANCIAL INSTRUMENTS Derivative financial instruments mainly relate to foreign exchange swap contracts and interest rate swaps. Hedged items are primarily trade receivables and payables, as well as payments in connection with loans. The carrying amounts of the Group’s derivative financial instruments correspond to their fair values. The fair value corresponds to the amount that would be incurred or earned if the transaction had been settled at the balance sheet date. The fair values of the derivative financial instruments are as follows at the balance sheet date: 31 Mar 2016 31 Mar 2015 € in thousands Assets Liabilities Assets Liabilities Interest rate swaps at fair value – 3,871 – 3,777 Total market values – 3,871 – 3,777
  • 134.
    130 ATS AnnualReport 2015/16102ATS Annual Report 2015/16 The nominal amounts and the fair values of derivative financial instruments relating to hedges against interest rate fluctuations are as follows at the balance sheet date, presented by currency: 31 Mar 2016 31 Mar 2015 Currency Nominal amount in 1,000 local currency Market value € in thousands Nominal amount in 1,000 local currency Market value € in thousands Euro 92,000 (3,871) 92,000 (3,777) The remaining terms of derivative financial instruments are as follows at the balance sheet date: in months 31 Mar 2016 31 Mar 2015 Interest rate swaps 35 - 59 47 - 71 At 31 March 2016, the fixed interest rates for interest rate swaps are 1.01% and 1.405%, the variable interest rate is based on the 6-month EURIBOR. Based on the various scenarios, the Group hedges its cash flow interest rate risk by using interest rate swaps. Such interest rate swaps have the economic effect of converting loans from floating rates to fixed rates. If the Group takes out loans at floating rates, it uses swaps to convert such loans into fixed rate loans. Under these interest rate swaps, the Group agrees with other parties to exchange, at specified intervals, the differ- ence between the fixed and variable interest rates calculated by reference to the agreed nominal amounts. Through the prepayment of the variable parts of the promissory note loan in the financial year 2015/16 from 2014 the basis for hedge-accounting was eliminated. The existing interest rate swaps are now used for other variable loans. Due to the different maturity and amount there is no effective hedging relationship as defined by IAS 39 that assumes no influence on gains or losses and therefor in the financial year 2015/16, € 3.8 million of the equity was re- cognised as non-recurring in profit and loss. Gains or losses arising from the ongoing subsequent measurement of interest rate swaps were recognised in profit or loss under “finance costs”.
  • 135.
    131Consolidated Financial StatementsConsolidatedFinancial Statements131 20. ADDITIONAL DISCLOSURES ON FINANCIAL INSTRUMENTS CARRYING AMOUNTS AND FAIR VALUES BY MEASUREMENT CATEGORY The carrying amounts and fair values of financial instruments included in several items in the statement of financial position by measurement category are as follows at the balance sheet date. Unless other- wise stated, carrying amounts correspond approximately to the fair values: 31 Mar 2016 € in thousands Measurement catego- ries in accordance with IAS 39 or measurement in accordance with other IFRSs Level Carrying amount Fair value Assets Non-current assets Financial assets AFSFA 2 96 96 Current assets Trade receivables less impairments LAR 109,953 109,953 Other receivables LAR 419 419 Other receivables – 24,315 24,315 Trade and other receivables 134,687 134,687 Financial assets FAAFVPL 1 631 631 Financial assets HTMI 87,186 87,186 Financial assets 87,817 87,817 Cash and cash equivalents LAR 171,866 171,866 Cash and cash equivalents 171,866 171,866 Liabilities Bonds FLAAC 1 76,798 77,388 Other financial liabilities FLAAC 2 442,302 448,621 Derivative financial instruments DHI 2 3,871 3,871 Non-current and current financial liabilities 522,971 529,880 Trade payables FLAAC 130,668 130,668 Other payables FLAAC 25,842 25,842 Other payables – 31,502 31,502 Trade and other non-current and current payables 188,012 188,012 Aggregated by measurement categories Assets Loans and receivables LAR1) 282,238 Available-for-sale financial assets AFSFA2) 96 Financial assets at fair value through profit or loss FAAFVPL3) 631 Held-to-maturity investments HTMI4) 87,186 Liabilities Financial liabilities at amortised costs FLAAC 5) 675,610 Derivatives as hedging instruments DHI6) 3,871
  • 136.
    132 ATS AnnualReport 2015/16104ATS Annual Report 2015/16 31 Mar 2015 € in thousands Measurement catego- ries in accordance with IAS 39 or measurement in accordance with other IFRSs Level Carrying amount Fair value Assets Non-current assets Financial assets AFSFA 2 96 96 Current assets Trade receivables less impairments LAR 113,492 Other receivables LAR 609 Other receivables – 29,029 Trade and other receivables 143,130 Financial assets FAAFVPL 1 780 780 Financial assets 780 780 Cash and cash equivalents LAR 273,919 Cash and cash equivalents 273,919 Liabilities Bonds FLAAC 1 101,505 105,000 Other financial liabilities FLAAC 2 300,023 303,321 Derivative financial instruments DHI 2 3,777 3,777 Non-current and current financial liabilities 405,305 412,098 Trade payables FLAAC 97,785 Other payables FLAAC 29,133 Other payables – 27,248 Trade and other non-current and current payables 154,166 Aggregated by measurement categories Assets Loans and receivables LAR1) 388,020 Available-for-sale financial assets AFSFA2) 96 Financial assets at fair value through profit or loss FAAFVPL3) 780 Liabilities Financial liabilities at amortised costs FLAAC 5) 528,446 Derivatives as hedging instruments DHI6) 3,777 1) Loans and receivables 2) Available-for-sale financial assets 3) Financial assets at fair value through profit or loss 4) Held-to-maturity investments 5) Financial liabilities at amortised cost 6) Derivatives as hedging instruments When measuring fair value, a distinction needs to be made between three valuation hierarchies.  Level 1: The fair values are determined based on quoted market prices in an active market for identical financial instruments.  Level 2: If quoted market prices in active markets are not available, the fair values are determined based on the results of a measurement method that is based to the greatest possible extent on market prices.  Level 3: In this case, the fair values are determined using measurement models which are not based on observable market data.
  • 137.
    133Consolidated Financial StatementsConsolidatedFinancial Statements105 NET RESULTS RELATING TO FINANCIAL INSTRUMENTS BY MEASUREMENT CATEGORY Net gains or net losses relating to financial assets and liabilities by measurement category are as follows: € in thousands 2015/16 2014/15 Loans and receivables 3,499 6,815 Financial assets at fair value through profit or loss (2,223) (29) Available-for-sale financial assets 8 8 Held-to-maturity investments 1,579 – Financial liabilities at amortised cost (7,490) (8,712) Total (4,627) (1,918) The net results relating to financial instruments include dividend income, interest income and expenses, foreign exchange gains and losses, realised gains and losses on the disposal and sale, as well as income and expenses recognised in profit or loss from the measurement of financial instruments. € 121 thousand in net income (in 2014/15: € 427 thousand) of the total net result from financial instruments is included in the operating result, and € 4,747 thousand in net expense (in 2014/15: € 2,345 thousand in net expense) in “Finance costs – net”. FINANCIAL RISKS In the following, the financial risks, which comprise the financing risk, the liquidity risk, the credit risk, and the foreign exchange risk, are ad- dressed. In the Group Management Report, further risk categories and the related processes and measures are outlined. Risk management of financial risks is carried out by the central treasury department (Group Treasury) under policies approved by the Manage- ment Board. Responsibilities, authorisations and limits are governed by these internal guidelines. Group Treasury identifies, evaluates and hedg- es financial risks in close cooperation with the Group’s operating units. FINANCING RISK The financing risk relates to securing the long-term funding of the Group and to fluctuations in the value of financial in- struments. On the assets side, the Group is exposed to low interest rate risks with regard to its securities portfolio. Other liquid funds are mainly invested short-term. Reference is made to Note 13 “Financial assets” and Note 14 “Cash and cash equivalents”. On the liabilities side, 74% (in the previous year 78%) of the total bonds and bank borrowings are subject to fixed interest rates, taking into ac- count interest rate hedging instruments. Reference is made to Note 16 “Financial liabilities”. The financial liabilities of the Group are linked to loan commitments that are customary in the market. These commitments are reviewed on a quarterly basis. In the event of non-compliance with these commitments, the lenders have a right of notice. LIQUIDITY RISK In the Group, liquidity risk refers to the circumstance of insolvency. Therefore, sufficient liquidity shall be available at all times to be able to meet the current payment obligations on time. At 31 March 2016, the Group has liquidity reserves of € 507.1 million (at 31 March 2015: € 485.9 million). This comprises € 259.7 million (at 31 March 2015: € 274.8 million) in cash and cash equivalents, held-to-maturity investments, securities held for trading and available-for-sale and € 247.4 million (at 31 March 2015: € 211.1 million) in available unused credit facilities. Thus, the liquidity reserves increased by € 21.2 million year-on-year and include € 99.4 million (at 31 March 2015: € 131.7 million) in current reserves, which relate to ATS in China and are subject to specific liquidity requirements.
  • 138.
    134 ATS AnnualReport 2015/16106ATS Annual Report 2015/16 The Group has a significantly positive operating cash flow. The cash flow from operating activities for the financial year 2015/16 amounts to € 136.9 million (in 2014/15: € 143.9 million). Thus, the investments made in the reporting year could be only partly financed by the operating cash flow. CREDIT RISK In the Group, credit risk refers to the potential for payment default by customers. The Group has always managed to establish strong partnerships with its largest customers. 56% of the Group’s total revenue was attributable to its five largest customers. The share in trade receivables outstanding at the balance sheet date roughly corresponds to the shares in revenue of the individual customers. The credit risk is kept to a minimum by means of a comprehensive process. Customers are the subject to regular credit assessments and their receivables are covered by insurance to a large extent. Non-insured receivables are continuously monitored and, if any risks are identified, the deliveries are made only against advance payments or bank guarantees. In the financial year 2015/16, € 0.3 million (in 2014/15: € 0.4 million) or 0.3% (in 2014/15: 0.3%) of receivables was impaired. Reference is made to the detailed disclosures in Note 12 “Trade and other receivables”. FOREIGN EXCHANGE RISK As a globally operating entity, the ATS Group is exposed to foreign exchange risk. “Natural hedges” exist in part through local added value created at the various sites. Within the Group, transaction risks are initially managed by closing positions (net- ting). Open positions are continuously analysed and hedged by using different hedging instruments such as forward contracts, currency options and currency swaps. Sensitivity analyses are performed to assess the foreign exchange risk, with – all else being equal – the effects of percentage changes of foreign exchange rates being simulated against each other. FINANCIAL MARKET RISKS Detailed information on financial market risks and derivative financial instruments is contained in Section I.B.l. “Accounting and measurement policies: Derivative financial instruments” and in Note 19 “Derivative financial instruments”. The Group uses derivative financial instruments, such as forward contracts, options and swaps, exclusively for hedging purposes. EVALUATION OF FINANCIAL MARKET RISKS BY SENSITIVITY ANALYSES The Group applies sensitivity analyses to quantify the interest rate and currency risks. In gap analyses, the potential change in profit/loss resulting from a 1% change in price (exchange rate or interest rate) of the foreign currency or interest net position is determined. Correlations between different risk elements are not included in these analyses. The impact on profit/loss is determined taking into account income tax effects on the profit for the year after tax. If the interest rates at the balance sheet date had been 100 basis points higher (or lower), based on the financing structure at the balance sheet date, the profit for the year would have been € 1.4 million lower (or higher) (in 2014/15: € 0.9 million), provided all other variables remained constant. This would have mainly been due to higher (or lower) interest expenses for variable interest financial liabilities. The effect of this inter- est rate sensitivity analysis is based on the assumption that the interest rates would deviate by 100 basis points during an entire financial year and the new interest rates would have to be applied to the amount of equity and liabilities at the balance sheet date. A change in the US dollar exchange rate of 1% against the euro would have had an impact on the profit for the year in the amount of € 0.1 million (in 2014/15: € 0.6 million) due to the measurement of trade receivables and payables, financial balances, and derivative financial instruments measured at fair value based on US dollars. Furthermore, reference is made to the detailed disclosures in Note 12 “Trade and other receivables”. CAPITAL RISK MANAGEMENT The objectives of the Group in respect of capital management include firstly securing the company as a going concern in order to be able to continue providing the shareholders with dividends and the other stakeholders with their due services and, secondly, maintaining an appropriate capital structure in order to optimise capital costs. Therefore, the amount of the dividend payments is adjusted to the respective requirements, capital is repaid to shareholders (withdrawal of treasury shares), new shares are issued or the portfolio of other assets is changed. Based on the covenants defined in the credit agreements, the Group monitors its capital based on the equity ratio as well as the ratio of net debt to EBITDA (theoretical payback period for debts).
  • 139.
    135Consolidated Financial StatementsConsolidatedFinancial Statements107 The Group’s strategy is not to fall below an equity ratio of 40% and not to exceed a theoretical payback period for debts of 3.0 years, creating sufficient leeway to cushion the effects of adverse business developments and to secure the Company as a going concern even in times of crisis. Temporary deviations from the values are acceptable. At the balance sheet date, the equity ratio was 42.3% and thus below the previous year’s figure of 49.5%. At 1.6 years, the theoretical payback period for debts was above the previous year’s figure of 0.8 years. 21. CONTINGENT LIABILITIES AND OTHER FINANCIAL COMMITMENTS Regarding non-cancellable leasing and rental agreements, reference is made to Note 16 “Financial liabilities”. At 31 March 2016, the Group has other financial commitments amounting to € 80,127 thousand (at 31 March 2015: € 32,857 thousand) in connection with contractually binding investment projects. Furthermore, at the balance sheet date, the Group has no contingent liabilities from bank guarantees (at 31 March 2015: € 51 thousand). There were no other guar- antees or commitments relating to ordinary business operations at the balance sheet date. 22. SHARE CAPITAL Outstanding shares in thousand shares Ordinary shares € in thousands Share premium € in thousands Share capital € in thousands 31 Mar 2014 38,850 42,735 99,111 141,846 31 Mar 2015 38,850 42,735 99,111 141,846 31 Mar 2016 38,850 42,735 99,111 141,846 ORDINARY SHARES The ordinary shares of the Company as of 31 March 2016 amount to € 42,735 thousand (previous year: € 42,735 thousand) and are made up of 38,850,000 (previous year: 38,850,000) no-par value bearer shares with a notional value of € 1.10 each. APPROVED CAPITAL AND CONDITIONAL CAPITAL INCREASE By resolution passed at the 20th Annual General Meeting on 3 July 2014, the Management Board was authorised until 2 July 2019 to increase the Company's ordinary shares, subject to approval by the Superviso- ry Board, by up to € 21,367.5 thousand by way of issuing up to 19,425,000 new no-par value bearer shares against contribution in cash or in kind, in one or several tranches, also by way of indirect rights, offering after having been taken over by one or more credit institutions in accord- ance with Section 153 (6) of the Austrian Stock Corporation Act (AktG). The Management Board was authorised, subject to approval by the Su- pervisory Board, to fully or partially exclude the shareholders’ subscription right, and with approval by the Supervisory Board, to determine the detailed conditions for such issuance (in particular the issue amount, what the contribution in kind entails, the content of the share rights, the exclusion of subscription rights, etc.) (approved capital). The Supervisory Board was authorised to adopt amendments to the articles of associa- tion resulting from the issuance of shares from the approved capital. Furthermore, by resolution of the 20th Annual General Meeting on 3 July 2014, the authorisation to issue convertible bonds as resolved in the Annual General Meeting on 7 July 2010 was revoked and, simultaneously, the Management Board was authorised until 2 July 2019, subject to approval by the Supervisory Board, to issue one or several convertible bearer bonds at a total nominal amount of up to € 150,000 thousand and to grant to bearers of convertible bonds subscription rights and/or conversion rights for up to 19,425,000 new no-par value bearer shares in the Company in accordance with the convertible bond conditions to be defined by the Management Board and subject to approval by the Superviso- ry Board. The Management Board was authorised to fully or partially exclude the shareholders’ subscription right to convertible bonds. Converti- ble bonds may also be issued by a directly or indirectly 100%-owned company of AT S Austria Technologie Systemtechnik Aktiengesellschaft. In such a case, the Management Board was authorised, subject to approval by the Supervisory Board, to assume a guarantee for the convertible bonds on behalf of the issuing company and to grant conversion and/or subscription rights with regard to shares in AT S Austria Technologie Systemtechnik Aktiengesellschaft to the bearers of the convertible bonds. Furthermore, in doing so, the Company’s ordinary shares were conditionally increased by up to € 21,367.5 thousand by way of issuance of up to 19,425,000 new no-par value bearer shares in accordance with Section 159 (2) No. 1 of the Austrian Stock Corporation Act (AktG). This condi- tional capital increase will only carried out if as the bearers of convertible bonds issued based on the authorisation resolution passed at the Annual General Meeting on 3 July 2014 claim the right to conversion and/or subscription granted to them with regard to the Company's shares. Furthermore, the Management Board was authorised to determine, subject to approval by the Supervisory Board, the further details of carrying
  • 140.
    136 ATS AnnualReport 2015/16108ATS Annual Report 2015/16 out the conditional capital increase (particularly the issue amount and the content of the share rights). The Supervisory Board was authorised to adopt amendments to the articles of association resulting from the issuance of shares from the conditional capital. With regard to increasing the approved capital and/or the conditional capital increase, the following definition of amount in accordance with the resolutions passed at the 20th Annual General Meeting on 3 July 2014 is to be observed: The sum of (i) the number of shares currently issued or potentially to be issued from conditional capital in accordance with the convertible bond conditions and (ii) the number of shares issued from approved capital shall not exceed the total amount of 19,425,000. OUTSTANDING SHARES The number of shares issued amounts to 38,850,000 at 31 March 2016 (at 31 March 2015: 38,850,000). TREASURY SHARES By a resolution passed at the 21th Annual General Meeting on 9 July 2015, the Management Board was again authorised (pursuant to Section 65 (1) No. 8 of the Austrian Stock Corporation Act (AktG)) to acquire — within 30 months as from the resolution date — treasury shares to the maximum extent of up to 10% of the ordinary shares of the Company at a lowest price that may be no more than 30% lower than the average unweighted closing price of the previous 10 trading days and at a highest price per share of a maximum of up to 30% above the average unweighted closing price of the previous 10 trading days. This authorisation also includes the acquisition of shares by the Company’s subsidiaries (Section 66 AktG). The acquisition may be carried out via the stock exchange, by means of a public offering or in any other legal way and for any legal purpose. The Management Board was also authorised to withdraw repurchased treasury shares as well as treasury shares already held by the Company without any other resolution of the Annual General Meeting. This authorisation may be exercised in full, in part or in several tranches. At 31 March 2016, the Group does not hold any treasury shares. At the 21th Annual General Meeting on 9 July 2015, the Management Board, in accordance with Section 65 (1b) AktG, was again authorised, for a period of five years from the date the resolution was passed, i.e. up to and including 8 July 2020, upon approval by the Supervisory Board and without any further resolution of the Annual General Meeting, to also sell the repurchased treasury shares or treasury shares already held by the Company other than via the stock exchange or by public offer, or, most notably, to use treasury shares for the following purposes:  Issuance to employees, executive employees and members of the Management Board of the Company or of an affiliated company, including the servicing of stock transfer programmes (particularly with regard to stock options, long-term incentive plans or other participation pro- grammes),  To serve any issued convertible bonds  As consideration for the acquisition of entities, investments or other assets, and  For any other legal purpose, and by doing so, to exclude the general purchase option of shareholders (subscription right exclusion). The authorisation may be exercised in full, in part and also in several tranches and may serve multiple purposes. DIVIDEND PER SHARE In the financial year 2015/16, a dividend of € 0.36 was paid per share (in 2014/15: € 0.20).
  • 141.
    137Consolidated Financial StatementsConsolidatedFinancial Statements109 23. OTHER RESERVES The reclassification adjustments of the other comprehensive income realised in the profit for the year and the movement in other reserves are as follows: € in thousands Currency translation differences Available-for-sale financial assets Hedging instruments for cash flow hedges Remeasurement of obligations from post-employment benefits Other reserves Carrying amount 31 Mar 2014 2,268 3 (314) (3,254) (1,297) Balance of unrealised changes before reclassification, net of tax 161,339 – (2,517) – 158,822 Remeasurement of obligations from post- employment benefits – – – (6,751) (6,751) Carrying amount 31 Mar 2015 163,607 3 (2,831) (10,005) 150,774 Balance of unrealised changes before reclassification, net of tax (82,521) – 2,831 – (79,690) Remeasurement of obligations from post- employment benefits, net of tax – – – 2,659 2,659 Acquisition of non-controlling interests (50) – – (5) (55) Carrying amount 31 Mar 2016 81,036 3 – (7,351) 73,688 With regard to the presentation of income taxes attributable to the individual components of the other comprehensive income, including reclas- sification adjustments, reference is made to Note 7 “Income taxes”. 24. CASH FLOW In accordance with IAS 7, cash and cash equivalents comprise cash on hand and demand deposits and current, liquid in- vestments that can be converted into known cash amounts at any time, and are only subject to an insignificant risk of changes in value. The indirect method was used to prepare the consolidated cash flow statement. Cash flow from operating activities before changes in working capital in the financial year 2015/16 was € 145,928 thousand (in 2014/15: € 144,956 thousand). Cash flow from investing activities in the financial year 2015/16 amounts to € -342,242 thousand (in 2014/15: € -164,779 thousand) and com- prises investment activities in Chongqing and Shanghai as well as various technological reinvestments at other locations and investment of liquid funds. Net cash generated from financing activities in the financial year 2015/16 was € 111,073 thousand (in 2014/15: € 11,943 thousand), which was unusually high due to the placing of promissory note bonds of € 221.0 million. € in thousands 2015/16 2014/15 Cash flow from operating activities before changes in working capital 145,928 144,956 Cash flow from operating activities 136,925 143,870 Cash flow from investing activities (342,242) (164,779) Free cash flow (205,317) (20,909) Cash flow from financing activities 111,073 11,943 Change in cash and cash equivalents (94,244) (8,966) Currency effects on cash and cash equivalents (7,809) 22,752 Cash and cash equivalents at end of the year 171,866 273,919
  • 142.
    138 ATS AnnualReport 2015/16110ATS Annual Report 2015/16 The balance of cash and cash equivalents at end of the financial year 2015/16 was € 171,866 thousand (in 2014/15: € 273,919 thousand). This decrease was due to the very high level of investment, in spite of the very strong cash flow from operating activities. This currently very high amount is used to ensure the financing of the new plant in Chongqing and refinancing of the bond that matures on 18 November 2016. The non-cash expense/income is as follows: € in thousands 2015/16 2014/15 Changes in non-current provisions 2,492 6,079 Release of government grants (1,340) (1,189) Other non-cash expense/(income), net (576) 1,010 Non-cash expense/(income), net 576 5,900
  • 143.
    139Consolidated Financial StatementsConsolidatedFinancial Statements111 25. EARNINGS PER SHARE Earnings per share is calculated in accordance with IAS 33 “Earnings Per Share“. WEIGHTED AVERAGE OF OUTSTANDING SHARES The number of shares issued is 38,850,000. At 31 March 2016, no treasury shares are held, which would have had to be deducted in the calculation of earnings per share. The weighted average number of outstanding shares for the basic earnings per share calculation amounts to 38,850 thousand in the financial year 2015/16 and to 38,850 thousand in the financial year 2014/15. The weighted average number of outstanding shares for the diluted earnings per share calculation amounts to 38,850 in the financial year 2015/16 and to 38,850 thousand in the financial year 2014/15. The following table shows the composition of the diluted weighted average number of outstanding shares in the respective periods: in thousands 2015/16 2014/15 Weighted average number of shares outstanding – basic 38,850 38,850 Diluting effect – – Weighted average number of shares outstanding – diluted 38,850 38,850 BASIC EARNINGS PER SHARE Basic earnings per share are calculated by dividing the profit for the period attributed to the shareholders of the Company by the weighted average number of outstanding ordinary shares in the same period. 2015/16 2014/15 Profit for the year (€ in thousands) 55,951 69,279 Weighted average number of shares outstanding – basic (in thousands) 38,850 38,850 Basic earnings per share (in €) 1.44 1.78 DILUTED EARNINGS PER SHARE Diluted earnings per share are calculated by dividing the profit for the period attributed to the shareholders of the Company by the weighted average number of outstanding shares including the number of potentially outstanding ordinary shares in the same period. The potentially outstanding ordinary shares comprise the additional shares to be issued for exercisable options or subscription rights and are included in diluted earnings per share. 2015/16 2014/15 Profit for the year (€ in thousands) 55,951 69,279 Weighted average number of shares outstanding – diluted (in thousands) 38,850 38,850 Diluted earnings per share (in €) 1.44 1.78 26. MATERIAL EVENTS AFTER THE BALANCE SHEET DATE No material events occurred after the balance sheet date. V. Other Disclosures
  • 144.
    140 ATS AnnualReport 2015/16112ATS Annual Report 2015/16 27. RELATED PARTY TRANSACTIONS In connection with various projects, the Group received consulting services from companies where Supervisory Board chairman Mr. Androsch (AIC Androsch International Management Consulting GmbH) and Supervisory Board deputy chairman Mr. Dörflinger (Dörflinger Management Beteiligungs GmbH) are managing directors with the power of sole representation. The Group also received legal advice from Frotz Riedl Rechtsanwälte, where Supervisory Board member Mr. Riedl works as an independent lawyer. € in thousands 2015/16 2014/15 AIC Androsch International Management Consulting GmbH 395 380 Dörflinger Management Beteiligungs GmbH 5 8 Frotz Riedl Rechtsanwälte – 3 Total 400 391 At the balance sheet date, there are no outstanding balances or obligations to the above mentioned legal and consulting companies. MEMBERS OF THE MANAGEMENT BOARD AND THE SUPERVISORY BOARD In the financial year 2015/16 and until the issue date of these consolidated financial statements, the following persons served on the MANAGEMENT BOARD:  Andreas Gerstenmayer (Chairman)  Karl Asamer (Deputy Chairman)  Heinz Moitzi In the financial year 2015/16, the following persons were appointed members of the SUPERVISORY BOARD:  Hannes Androsch (Chairman)  Willibald Dörflinger (First Deputy Chairman)  Regina Prehofer (Second Deputy Chairman)  Karl Fink  Albert Hochleitner  Gerhard Pichler  Georg Riedl  Karin Schaupp Delegated by the Works Council:  Wolfgang Fleck  Sabine Fussi  Franz Katzbeck until 28 January 2016  Siegfried Trauch from 28 January 2016  Günther Wölfler The number of outstanding stock options and staff costs from stock options granted are as follows: Number of outstanding stock options Staff costs (€ in thousands) 31 Mar 2016 31 Mar 2015 2015/16 2014/15 Andreas Gerstenmayer 60,000 80,000 (4) 218 Heinz Moitzi 60,000 60,000 (36) 114 Total Management Board 120,000 140,000 (40) 332 Total other executive employees 29,500 37,000 (36) 99 Total 149,500 177,000 (76) 431
  • 145.
    141Consolidated Financial StatementsConsolidatedFinancial Statements113 The number of outstanding stock appreciation rights and staff costs from stock appreciation rights granted are as follows: Number of outstanding stock appreciation rights Staff costs (€ in thousands) 31 Mar 2016 31 Mar 2015 2015/16 2014/15 Andreas Gerstenmayer 80,000 40,000 65 69 Karl Asamer 60,000 30,000 48 52 Heinz Moitzi 60,000 30,000 47 52 Total Management Board 200,000 100,000 160 173 Total other executive employees 260,000 130,000 186 224 Total 460,000 230,000 346 397 Reference is made to the comments on the stock option plans under Note 15 “Trade and other payables”. Total compensation to the members of the Management Board and to executive employees in the financial year in accordance with IAS 24: 2015/16 2014/15 € in thousands Fixed Variable Total Fixed Variable Total Andreas Gerstenmayer 430 457 887 429 506 935 Karl Asamer 376 277 653 3741) 301 675 Heinz Moitzi 360 289 649 359 361 720 Executive employees 4,419 2,259 6,678 4,134 1,996 6,130 Total 5,585 3,282 8,867 5,296 3,164 8,460 1) The prior year figure has been adjusted slightly for a pro rata 13 th and 14 th monthly salary due to joining the Board on 1 April 2014 In accordance with IAS 24, these are key management personnel having direct or indirect authority and responsibility for planning, directing and controlling the activities of the entity, including any managing director of that entity. Expenses for severance payments and retirement benefits for members of the Management Board and executive employees are as follows: Severance payments Financial year Pensions Financial year € in thousands 2015/16 2014/15 2015/16 2014/15 Expenses recognised in profit for the period 202 165 345 328 Remeasurement recognised in other comprehensive income (267) 381 (905) 2,550
  • 146.
    142 ATS AnnualReport 2015/16 Total remuneration for services rendered personally by members of the Supervisory Board attributable to the financial year and proposed to the Annual General Meeting: 2015/16 2014/15 € in thousands Fixed Variable Total Fixed Variable Total Hannes Androsch 63 24 87 35 19 54 Willibald Dörflinger 49 16 65 28 9 37 Regina Prehofer 51 16 67 25 9 34 Karl Fink 29 12 41 24 9 33 Albert Hochleitner 30 12 42 25 9 34 Gerhard Pichler 33 12 45 25 9 34 Georg Riedl 36 12 48 25 9 34 Karin Schaupp 30 12 42 22 9 31 Total 321 116 437 209 82 291 Shareholdings and stock options of members of the Management Board and the Supervisory Board at 31 March 2016: Shares Stock options Total shares and stock options % capital Management Board members 24,000 120,000 144,000 0.37 Supervisory Board members: Hannes Androsch 599,699 – 599,699 1.54 Other members of the Supervisory Board 42,250 – 42,250 0.11 Total Supervisory Board members 641,949 – 641,949 1.65 Private foundations: Androsch Privatstiftung 6,339,896 – 6,339,896 16.32 Dörflinger Privatstiftung 6,902,380 – 6,902,380 17.77 Total private foundations 13,242,276 – 13,242,276 34.09 Total 13,908,225 120,000 14,028,225 36.11 28. EXPENSES FOR THE GROUP AUDITOR The expenses for the financial year for the group auditor are as follows: € in thousands 2015/16 2014/15 Audit of consolidated and separate financial statements 137 137 Other assurance services 6 2 Other services 7 48 Total 150 187 This item does not include expenses for other network members of the group auditor, e.g. for the audit of financial statements of subsidiaries or tax consulting services.
  • 147.
    143Consolidated Financial StatementsConsolidatedFinancial Statements115 29. NUMBER OF STAFF The average numbers of staff in the financial year are as follows: 2015/16 2014/15 Waged workers 6,754 5,924 Salaried employees 2,005 1,714 Total 8,759 7,638 The calculation of the number of staff includes an average of 3,059 leased personnel for the financial year 2015/16 and an average of 3,264 for the financial year 2014/15. Leoben-Hinterberg, 9 May 2016 The Management Board Andreas Gerstenmayer m.p. Karl Asamer m.p. Heinz Moitzi m.p.
  • 148.
    144 Statement ofall Legal Representatives116ATS Annual Report 2015/16 We confirm to the best of our knowledge that the consolidated financial statements give a true and fair view of the assets, liabilities, financial position and profit or loss of the Group as required by the applicable accounting standards and that the Group Management report gives a true and fair view of the development and performance of the business and the position of the Group, together with a description of the principal risks and uncertainties the Group faces. Leoben-Hinterberg, 9 May 2016 The Management Board Andreas Gerstenmayer m.p. Chief Executive Officer Karl Asamer m.p. Chief Financial Officer Heinz Moitzi m.p. Chief Operations Officer Statement of all Legal Representatives
  • 149.
    145Auditor’s ReportAuditor’s Report117 REPORTON THE CONSOLIDATED FINANCIAL STATEMENTS We have audited the accompanying consolidated financial statements of AT S Austria Technologie Systemtechnik Aktiengesellschaft, Leoben-Hinterberg, which comprise the consolidated balance sheet as of March 31, 2016, the separate consolidated income statement, the consolidated statement of comprehensive income, the consolidated cash flow statement and the consolidated statement of changes in equity for the fiscal year then ended, and the notes to the consolidated financial state- ments. MANAGEMENT’S RESPONSIBILITY FOR THE CONSOLIDATED FINANCIAL STATEMENTS Management is responsible for the preparation and fair presentation of the consolidated financial statements in accordance with International Financial Reporting Standards (IFRSs) as adopted by the EU, and the additional requirements under Section 245a UGB, and for such internal control as management determines is necessary to enable the preparation of consolidated financial statements that are free from material misstatement, whether du to fraud or error. AUDITOR’S RESPONSIBILITY Our responsibility is to express an opinion on these consolidated financial statements based on our audit. We conducted our audit in accordance with Austrian generally accepted auditing standards. These standards require the application of the Interna- tional Standards on Auditing according to which we are to comply with ethical requirements and to plan and perform the audit to obtain reason- able assurance whether the consolidated financial statements are free from material misstatement. An audit involves performing procedures to obtain audit evidence about the amounts and disclosures in the consolidated financial statements. The procedures selected depend on the auditor's judgment, including the assessment of the risks of material misstatement of the consolidated financial statements, whether due to fraud or error. In making those risk assessments, the auditor considers internal control relevant to the Group's preparation and fair presentation of the consolidated financial statements in order to design audit procedures that are appropriate in the circumstances, but not for the purpose of expressing an opinion on the effectiveness of the Group's internal control. An audit also includes evaluating the appropriateness of accounting policies used and the reasonableness of accounting estimates made by management, as well as evaluating the overall presentation of the consolidated financial statements. We believe that the audit evidence we have obtained is sufficient and appropriate to provide a basis for our audit opinion. OPINION Our audit did not give rise to any objections. In our opinion, the consolidated financial statements comply with legal requirements and give a true and fair view of the financial position of the Group as of March 31, 2016 and of its financial performance and its cash flows for the fiscal year then ended in accordance with International Financial Reporting Standards (IFRSs) as adopted by the EU and the additional require- ments under Section 245a UGB. COMMENTS ON THE MANAGEMENT REPORT FOR THE GROUP Pursuant to statutory provisions, the management report for the Group is to be audited as to whether it is consistent with the consolidated financial statements and as to whether the other disclosures are not misleading with respect to the Group's position. The auditor's report also has to contain a statement as to whether the management report for the Group is consistent with the consolidated financial statements and whether the disclosures pursuant to Section 243a UGB are appropriate. In our opinion, the management report for the Group is consistent with the consolidated financial statements. The disclosures pursuant to Sec- tion 243a UGB are appropriate. Vienna, 9 May 2016 PwC Wirtschaftsprüfung GmbH signed: Jürgen Schauer Austrian Certified Public Accountant We draw attention to the fact that the English translation of this auditor's report according to Section 274 of the Austrian Commercial Code (UGB) is presented for the convenience of the reader only and that the German wording is the only legally binding version. Disclosure, publication and duplication of the consolidated financial statements together with the auditor's report according to Section 281 (2) UGB in a form not in accordance with statutory requirements and differing from the version audited by us is not permitted. Reference to our audit may not be made without prior written permission from us. Auditor’s Report
  • 150.
    146 ATS AnnualReport 2015/16118ATS Annual Report 2015/16 Actuators Drive sections which convert electrical signals into mechanical movement. Advanced Packaging Active and passive electrical components are embedded in printed circuit boards and interconnected via microvias and conducting lines instead of being assembled on the printed circuit board. This technology enables space-saving, high-performance applications for a wide range of customer segments. All-in-one module All the components needed for an end device are connected in an integrated module, combining various interconnection technologies. Assembly service Assembling of components on (or inside) the printed circuit board. ATX Global Players A free float weighted price index made up of all stocks traded on the Vienna Stock Exchange and listed in the Prime Market, which generate at least 20 percent of sales outside of Europe. ATX Prime A Vienna Stock Exchange capital-weighted index comprising all securities traded in the Prime Market seg- ment. This is a broadly-based index for all stocks that meet the minimum capitalisation requirements and satisfy the stricter disclosure and reporting obligations. Bare dies Unpackaged part of a semiconductor silicon wafer. BGA substrates Ball Grid Array substrate. This substrate is at least 1.2 times as large as the chip placed on it. CAPEX CAPEX refers to the cash investments in property, plant and equipment and intangible assets, meaning that the asset acquisition is adjusted to exclude non-cash effects. Carbon footprint The carbon footprint refers to the amount of greenhouse gas emissions produced over the entire life cycle of a product. Cash earnings For calculation, please refer to the Group Management Report. CEMs Contract electronic manufacturers: companies which provide production services – primarily printed circuit board assembly – to the customer. Chip-on-board and/or chip-on-flex interconnection platforms Method for the direct assembly of unpackaged semiconductors on printed circuit boards. Corporate citizenship Civic engagement in and by companies that follow a mid and long-term corporate strategy based on respon- sible business operations and which, as a good citizen, are actively engaged even beyond their business activities in the local community, for example, in environmental or cultural pursuits. Glossary
  • 151.
    147GlossaryGlossary 119 Corporate GovernanceCode A set of rules for the responsible management and control of business enterprises. Companies voluntarily undertake to comply with the principles of the Code. Corporate social responsibility (CSR) The contribution of a business enterprise to sustainable development, beyond the statutory requirements. CSR should promote responsible corporate behaviour in business activities – with respect to the environ- ment, relationships with staff (the workplace), and the dialogue with other stakeholders and interest groups. COSO standard Internationally recognised standard for Internal Control Systems (ICS) and risk management published by the Committee of Sponsoring Organizations of the Treadway Commission (COSO). Covenants (financial) A covenant is an obligation of a borrower to the creditor not to exceed or fall below certain criteria. The most common covenants are the equity ratio and net debt/EBITDA. Coverage Company analysis with assessment by financial analysts. CSP substrates Chip Scale Packaging Substrate; this substrate is no more than 1.2 times as large as the chip placed on it. Dividend record date Date on which the company declares who is a shareholder in the company and therefore entitled to divi- dends. Duration The average repayment time for financial liabilities. EBIT Operating result = earnings before net finance costs and taxes (Earnings Before Interest and Taxes). EBIT margin EBIT as a percentage of total revenue. EBITDA Operating result before depreciation and amortisation (Earnings Before Interest, Taxes, Depreciation and Amortisation). EBITDA margin EBITDA as a percentage of total revenue. ECP® technology Embedded component packaging technology developed by ATS in order to embed active and/or passive components inside printed circuit boards (® registered trademark AT 255868). Embedded die packaging Technology used to embed active and passive components in a printed circuit board.
  • 152.
    148 ATS AnnualReport 2015/16120ATS Annual Report 2015/16 Embedded interposer Interconnection between the printed circuit board and substrate with embedded components, to compen- sate different structure levels. Embedding Integrating active and/or passive electronic components inside printed circuit boards. Ex-dividend date If shares are purchased on the ex-dividend date, there is no entitlement to dividends. Foreign exchange Conversion from one currency into another. HDI printed circuit boards Printed circuit boards with structures smaller than 100 micrometres (0.1 mm) – high density interconnection. Hedging Financial transactions providing protection against risks such as exchange rate or interest rate fluctuations. High-end segment Technologically demanding market segment on which ATS focuses as a technology leader. IC substrates IC substrates are multi-layered, electrically conducting circuit substrates for silicon semiconductors also known as chips or integrated circuits/ICs and serve as the connection between the chip(s) and the main printed circuit board. IFRS International Financial Reporting Standards are the international accounting rules which are mandatory for ATS as an exchange-listed company. IGBT applicators An insulated-gate bipolar transistor (IGBT) is a semiconductor component used in power electronics. IIA standard Standards for measures and the assessment of the quality of internal auditing specified by the Institute of Internal Auditors (IIA). Intellectual property In contrast to tangible property, intellectual property is the right to intangible property such as a technical invention. Internet of Everything Most of the connected devices in use today require active interaction by the user and are mainly used for acquiring information or entertainment. The majority of the 50 billion connected things in 2020 will be used to link and direct systems in a variety of areas such as industry, smart homes, smart cities, smart energy, smart healthcare, wearables and much more. Internet of Things A trend based on how internet-connected devices are used to improve the exchange of data, automate com- plex processes in industry and generate valuable information.
  • 153.
    149GlossaryGlossary 121 IRR The InnovationRevenue Rate represents the share of total revenue generated from products that feature new, innovative technologies and have been introduced in the past three years. ISIN Alphanumerical securities identification number (International Securities Identification Number). ISO International Organisation for Standardisation. Key Performance Indicators Key indicators for managing corporate targets and measuring progress and/or achievement. Lean Six Sigma Management system for efficiency and process improvement. The core element of the system is the descrip- tion, measurement, analysis, improvement and monitoring of business processes using statistical methods. L/S Line/space: line width and spacing of circuit paths. LTI Long-term incentive: long-term-oriented bonus system. Manufacturing Execution System (MES) Computer systems which gather and process data in a production process – from the raw material to the final product – in real time. MEMS Microelectromechanical system. Microvia Microvias are minute holes drilled by a laser to generate the electrical connection between the layers in a multilayer circuit board. Miniaturisation Trend towards even more densely printed circuit board structures on ever smaller surfaces. Modularisation Individual components packaged into modules. MOSFET Metal-oxide semiconductor field-effect transistor which amplifies or converts electronic signals. Motherboard The main printed circuit board in a computer. Multilayer Multilayer printed circuit board. Net CAPEX Capital expenditure net of receipts from the disposal of property, plant and equipment and intangible assets.
  • 154.
    150 ATS AnnualReport 2015/16122ATS Annual Report 2015/16 Net debt For calculation, please refer to the key data section in the Group Management Report. Net gearing For calculation, please refer to the Group Management Report. NOPAT Net operating profit after tax represents annual profit adjusted to exclude net finance costs. For calculation, please refer to the Group Management Report. ÖCGK Austrian Corporate Governance Code (Österreichischer Corporate Governance Kodex). OEMs Original Equipment Manufacturers – manufacturers of original electronic end devices. OHSAS 18001 Occupational Health and Safety Assessment Series. Original Device or Design Manufacturer Manufactures products commissioned by other companies, some of which are developed in-house, that are ultimately sold under the brand name of the customer. OSATs Outsourced assembly and test: manufacturers that offer integrated IC (Integrated Circuit) Packaging solutions (see Advanced Packaging). Prepreg Fibreglass mats saturated with epoxy resin which are cured using heat and pressure. They provide – apart from copper foils – the base material for the production of printed circuit boards. Prime Market Stocks admitted to trading on the Vienna Stock Exchange on the Official Market or Second Regulated Market and subject to additional, more stringent requirements. Promissory note loan A large bond-like loan with a medium to long term. The lenders are usually banks or insurance companies. The loan is certified with the borrower's promissory note. Ramp-up Start-up phase of a manufacturing plant. RD Research and Development. Retail bonds Corporate bonds whose subscribers can be either private or institutional investors. RFID Radio Frequency Identification – technology for transceiver systems for the automatic and contactless identi- fication of objects using radio waves.
  • 155.
    151GlossaryGlossary 123 Risk exposure Thesituation of being exposed to risk. Used as a factor in risk management to indicate risks: a combination of the potential impact and the probability of a risk occurring. ROCE Return on capital employed measures how effectively a company generates returns from the capital it uses. For calculation, please refer to the Group Management Report. Sale-and-lease-back Special form of leasing: an enterprise sells property or moveable assets to a leasing company and leases it back for use in the business. Solder-resist mask Finish that protects the surface of the printed circuit board. Sourcing strategy Strategy for sourcing goods and services for a company from various suppliers. Stock options Options to buy or sell particular stocks. Substrate-like printed circuit boards The next generation of high-end HDI printed circuit boards with even finer structures in the 20–30 micro- metre range. They enable applications such as SiP (System in Package) for mobile applications and wearables. Swap A swap is a derivative financial instrument under which future payment streams are exchanged. Typically, currencies (currency swap) or fixed and variable interest payments (interest swap) are exchanged. System in Board (SiB) When passive and/or active components are embedded inside printed circuit boards. System in Package (SiP) Consists of one or more semiconductors and passive components that form a system or a functional block. Tier 1 manufacturers Automotive suppliers. WACC Weighted Average Cost of Capital represents the average cost that a company has to pay to obtain equity or debt capital. Wearable devices Electronic devices that can be worn. Wire-bond substrate Substrate on which a semiconductor is connected with wires.
  • 156.
    152 ATS AnnualReport 2015/16 AT S Austria Technologie Systemtechnik Aktiengesellschaft Fabriksgasse 13 8700 Leoben Austria Phone: +43 (0)3842 200-0 ir@ats.net www.ats.net Published by and responsible for content AT S Austria Technologie Systemtechnik Aktiengesellschaft Fabriksgasse 13 8700 Leoben Austria Concept and design (general section) Mensalia Unternehmensberatungs GmbH, Vienna Photos Andreas Jakwerth: pages 1, 5, 8, 11, 22, 30, 50, 90 ATS: pages 7, 42, 49, 153 Daniel Novotny: page 23 Helmut Jokesch: page 35 Klaus Vyhnalek: page 35 Werbeagentur DMP: pages 12, 13 Illustrations Stefanie Hilgarth/carolineseidler.com: pages 3, 14, 15, 21 Werbeagentur DMP: pages 2, 28, 63, 76 Disclaimer This report contains forward-looking statements which were made on the basis of the information available at the time of publication. These can be identified by the use of such expressions as “expects”, “plans”, “an- ticipates”, “intends”, “could”, “will”, “aim” and “estimation” or other similar words. These statements are based on current expectations and assumptions. Such statements are by their very nature subject to known and unknown risks and uncertainties. As a result, actual developments may vary significantly from the for- ward-looking statements made in this report. Recipients of this report are expressly cautioned not to place undue reliance on such statements. Neither ATS nor any other entity accept any responsibility for the cor- rectness and completeness of the forward-looking statements contained in this report. ATS undertakes no obligation to update or revise any forward-looking statements, whether as a result of changed assumptions or expectations, new information or future events. Percentages and individual items presented in this report are rounded, which may result in rounding differences. Formulations attributable to people are to be understood as gender-neutral. This report in no way represents an invitation or recommendation to buy or sell shares in ATS. The report is published in German and English. In case of doubt, the German version is binding. No responsibility accepted for errors or omissions. Published on 9 June 2016 Contact/Imprint