Download as PDF, PPTX


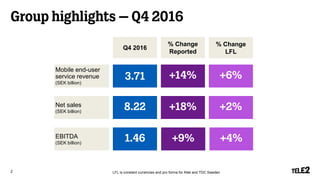
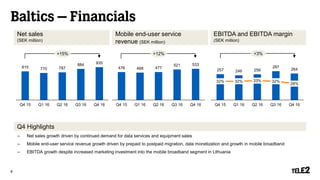
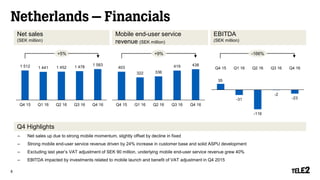
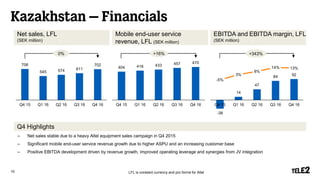

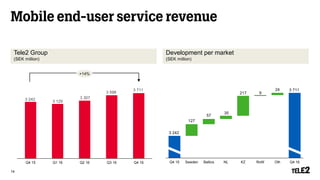
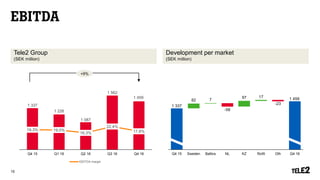
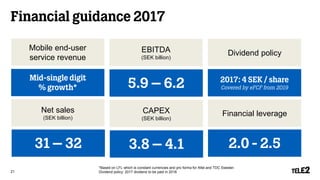


Tele2 reported financial results for the fourth quarter of 2016. Mobile end-user service revenue increased 14% to SEK 3.71 billion driven by growth in Sweden, the Baltics, and the Netherlands. EBITDA increased 9% to SEK 1.46 billion despite investments related to the acquisition of TDC Sweden and the mobile launch in the Netherlands. Looking ahead, Tele2 provided financial guidance for 2017 forecasting mid-single digit growth in mobile end-user service revenue and EBITDA between SEK 5.9-6.2 billion.


