The document summarizes an investment analysis report on BT Group PLC, a major UK telecommunications company. It provides an overview of BT's financial performance, acquisition of EE, strategy to improve customer service and invest in growth areas. The analysis recommends a buy rating for BT's stock, viewing the acquisition positively despite short-term debt risks, and anticipating long-term returns as strategic initiatives emerge over 12 months. Key catalysts include network integration and benefits from the Premier League and rugby rights acquisitions.


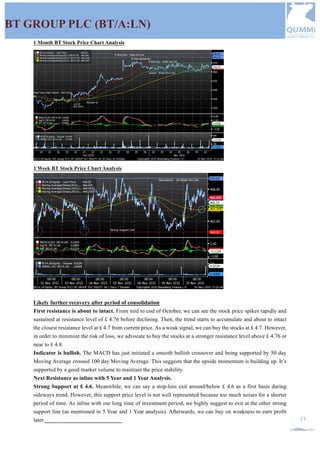
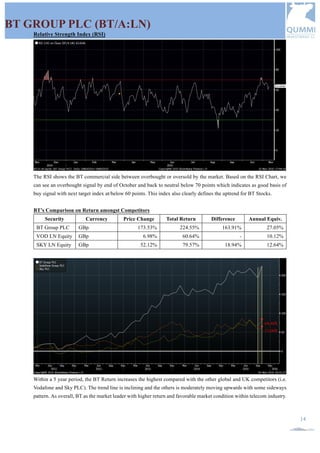


![[2016 Outlook] Media Advertisement](https://cdn.slidesharecdn.com/ss_thumbnails/201512102016outlookmediaadvertisementoverweight1-151222013450-thumbnail.jpg?width=640&height=640&fit=bounds)


