Download as PDF, PPTX

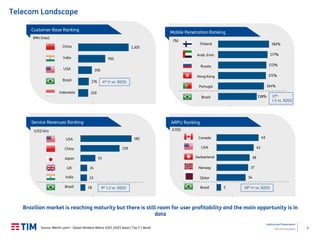
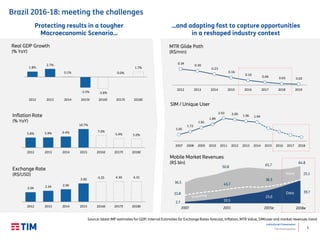
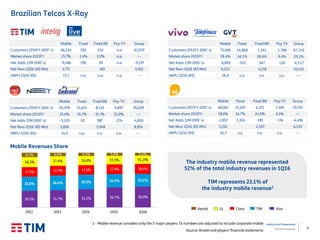
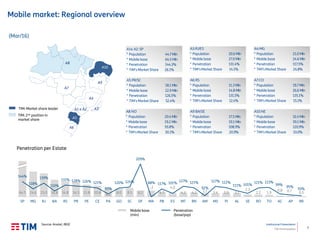

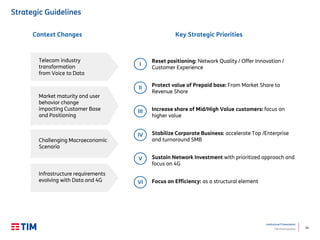
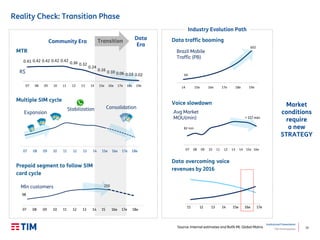
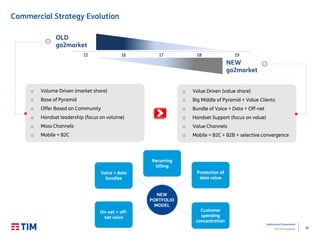
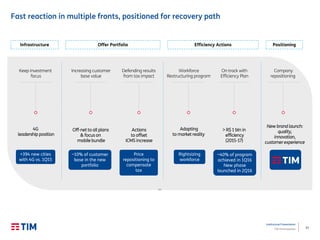


This document provides an institutional presentation from TIM Participações covering the first quarter of 2016. It includes the following sections: 1. An overview of the Brazilian telecom landscape, TIM's market share and performance metrics compared to other operators. 2. Details on TIM Brasil, including its operations, growth history, values, governance practices and focus on sustainability. 3. TIM's strategic priorities to respond to changes in the market as it transitions from voice to data, including resetting its positioning around network quality, innovating offers, improving the customer experience, focusing on higher value customers and sustaining network investment.


![[ls머트리얼즈]LS Materials 417200 Algorithm Investment Report](https://cdn.slidesharecdn.com/ss_thumbnails/lsmaterials417200algorithminvestmentreport-260202182715-66072c7b-thumbnail.jpg?width=640&height=640&fit=bounds)


