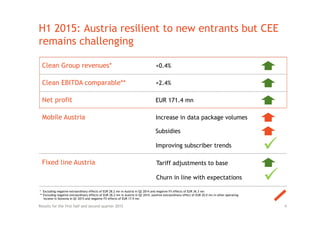
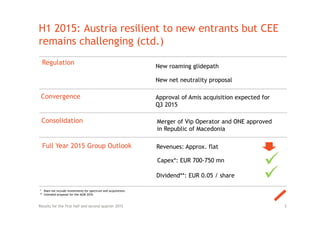
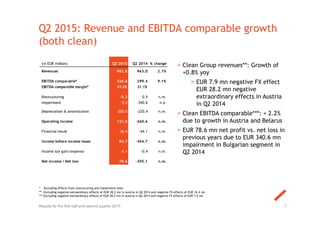
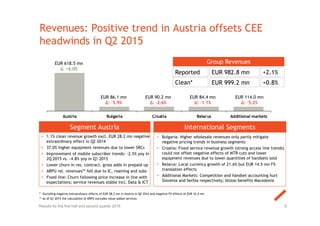
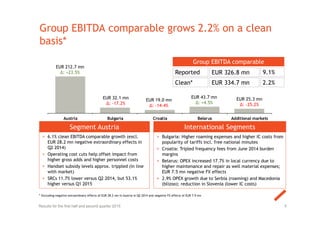
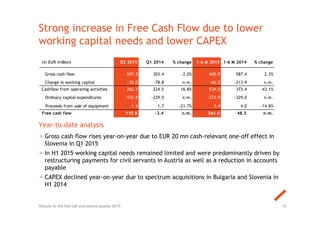
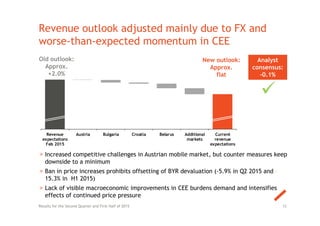
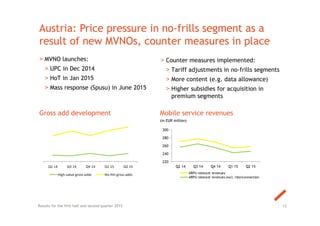
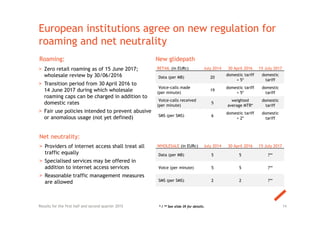
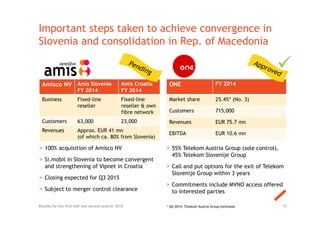
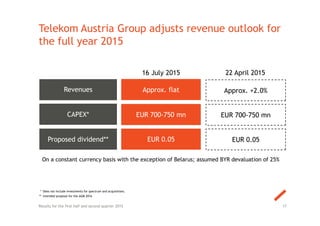
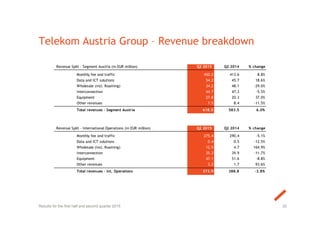
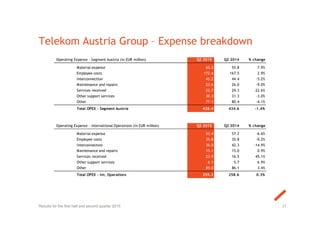
Vienna, 16 July 2015
Results for the first half and
second quarter 2015
Cautionary statement
'This presentation contains forward-looking statements. These forward-looking
statements are usually accompanied by words such as 'believe', 'intend', 'anticipate',
'plan', 'expect' and similar expressions. Actual events may differ materially from those
anticipated in these forward-looking statements as a result of a number of factors.
Forward-looking statements involve inherent risks and uncertainties. A number of
important factors could cause actual results or outcomes to differ materially from those
expressed in any forward-looking statement. Neither Telekom Austria Group nor any
other person accepts any liability for any such forward-looking statements. Telekom
Austria Group will not update these forward-looking statements, whether due to changed
factual circumstances, changes in assumptions or expectations. This presentation does
not constitute a recommendation or invitation to purchase or sell securities of Telekom
Austria Group.'
2Results for the first half and second quarter 2015
Operational and financial highlights for the
first half and second quarter 2015
3Results for the first half and second quarter 2015
H1 2015: Austria resilient to new entrants but CEE
remains challenging
4Results for the first half and second quarter 2015
* Excluding negative extraordinary effects of EUR 28.2 mn in Austria in Q2 2014 and negative FX effects of EUR 36.3 mn
** Excluding negative extraordinary effects of EUR 28.2 mn in Austria in Q2 2014, positive extraordinary effect of EUR 20.0 mn in other operating
income in Slovenia in Q1 2015 and negative FX effects of EUR 17.9 mn
Clean Group revenues* +0.4%
Clean EBITDA comparable** +2.4%
Net profit EUR 171.4 mn
Mobile Austria Increase in data package volumes
Subsidies
Improving subscriber trends


Fixed line Austria
Churn in line with expectations
Tariff adjustments to base
H1 2015: Austria resilient to new entrants but CEE
remains challenging (ctd.)
5Results for the first half and second quarter 2015
Regulation
New roaming glidepath
New net neutrality proposal
Convergence Approval of Amis acquisition expected for
Q3 2015
Consolidation Merger of Vip Operator and ONE approved
in Republic of Macedonia
* Does not include investments for spectrum and acquisitions
** Intended proposal for the AGM 2016
Full Year 2015 Group Outlook Revenues: Approx. flat
Capex*: EUR 700-750 mn
Dividend**: EUR 0.05 / share


Key financial developments in the
first half and second quarter 2015
6Results for the first half and second quarter 2015
(in EUR million) Q2 2015 Q2 2014 % change
Revenues 982.8 963.0 2.1%
EBITDA comparable* 326.8 299.4 9.1%
EBITDA comparable margin* 33.3% 31.1%
Restructuring -5.3 0.9 n.m.
Impairment 0.0 -340.6 n.a.
Depreciation & amortisation -200.5 -220.4 n.m.
Operating income 121.0 -260.6 n.m.
Financial result -36.4 -44.1 n.m.
Income before income taxes 84.7 -304.7 n.m.
Income tax gain/expense -6.1 -0.4 n.m.
Net income / Net loss 78.6 -305.1 n.m.
Q2 2015: Revenue and EBITDA comparable growth
(both clean)
7Results for the first half and second quarter 2015
> Clean Group revenues**: Growth of
+0.8% yoy
> EUR 7.9 mn negative FX effect
EUR 28.2 mn negative
extraordinary effects in Austria
in Q2 2014
> Clean EBITDA comparable***: + 2.2%
due to growth in Austria and Belarus
> EUR 78.6 mn net profit vs. net loss in
previous years due to EUR 340.6 mn
impairment in Bulgarian segment in
Q2 2014
* Excluding effects from restructuring and impairment tests
** Excluding negative extraordinary effects of EUR 28.2 mn in Austria in Q2 2014 and negative FX effects of EUR 16.4 mn
*** Excluding negative extraordinary effects of EUR 28.2 mn in Austria in Q2 2014 and negative FX effects of EUR 7.9 mn
Austria Bulgaria Croatia Belarus Additional markets
> Bulgaria: Higher wholesale revenues only partly mitigate
negative pricing trends in business segments
> Croatia: Fixed service revenue growth (strong access line trends)
could not offset negative effects of MTR cuts and lower
equipment revenues due to lower quantities of handsets sold
> Belarus: Local currency growth of 21.6% but EUR 14.5 mn FX
translation effects
> Additional Markets: Competition and handset accounting hurt
Slovenia and Serbia respectively; blizoo benefits Macedonia
> 1.1% clean revenue growth excl. EUR 28.2 mn negative
extraordinary effect in Q2 2014
> 37.0% higher equipment revenues due to lower SRCs
> Improvement of mobile subscriber trends: -2.5% yoy in
2Q 2015 vs. -4.8% yoy in Q1 2015
> Lower churn in res. contract, gross adds in prepaid up
> ARPU rel. revenues** fell due to IC, roaming and subs
> Fixed line: Churn following price increase in line with
expectations; service revenues stable incl. Data & ICT
Segment Austria International Segments
Revenues: Positive trend in Austria offsets CEE
headwinds in Q2 2015
8Results for the first half and second quarter 2015
EUR 618.5 mn
Δ: +6.0%
EUR 86.1 mn
Δ: -5.9%
EUR 90.2 mn
Δ: -2.6%
EUR 84.4 mn
Δ: -1.1%
EUR 114.0 mn
Δ: -5.2%
Group Revenues
Reported
Clean*
EUR 982.8 mn
EUR 999.2 mn
+2.1%
+0.8%
* Excluding negative extraordinary effects of EUR 28.2 mn in Austria in Q2 2014 and negative FX effects of EUR 16.4 mn
** As of Q1 2015 the calculation of ARPU excludes value-added services
Austria Bulgaria Croatia Belarus Additional markets
> Bulgaria: Higher roaming expenses and higher IC costs from
popularity of tariffs incl. free national minutes
> Croatia: Tripled frequency fees from June 2014 burden
margins
> Belarus: OPEX increased 17.7% in local currency due to
higher maintenance and repair as well material expenses;
EUR 7.5 mn negative FX effects
> 2.9% OPEX growth due to Serbia (roaming) and Macedonia
(blizoo); reduction in Slovenia (lower IC costs)
Group EBITDA comparable grows 2.2% on a clean
basis*
9
> 6.1% clean EBITDA comparable growth (excl.
EUR 28.2 mn negative extraordinary effects in
Q2 2014)
> Operating cost cuts help offset impact from
higher gross adds and higher personnel costs
> Handset subsidy levels approx. trippled (in line
with market)
> SRCs 11.7% lower versus Q2 2014, but 53.1%
higher versus Q1 2015
Segment Austria International Segments
Results for the first half and second quarter 2015
EUR 212.7 mn
Δ: +23.5%
EUR 32.1 mn
Δ: -17.2%
EUR 19.0 mn
Δ: -14.4%
EUR 43.7 mn
Δ: +4.5%
EUR 25.3 mn
Δ: -25.2%
Group EBITDA comparable
Reported
Clean*
EUR 326.8 mn
EUR 334.7 mn
9.1%
2.2%
* Excluding negative extraordinary effects of EUR 28.2 mn in Austria in Q2 2014 and negative FX effects of EUR 7.9 mn
(in EUR million) Q2 2015 Q1 2014 % change 1-6 M 2015 1-6 M 2014 % change
Gross cash flow 297.3 303.4 -2.0% 600.9 587.4 2.3%
Change in working capital -35.0 -78.8 n.m. -66.5 -213.9 n.m.
Cashflow from operating activities 262.3 224.5 16.8% 534.5 373.4 43.1%
Ordinary capital expenditures -152.8 -229.5 n.m. -273.9 -329.0 n.m.
Proceeds from sale of equipment 1.3 1.7 -21.7% 3.4 4.0 -14.8%
Free cash flow 110.8 -3.4 n.m. 264.0 48.5 n.m.
Strong increase in Free Cash Flow due to lower
working capital needs and lower CAPEX
10
Year-to-date analysis
> Gross cash flow rises year-on-year due to EUR 20 mn cash-relevant one-off effect in
Slovenia in Q1 2015
> In H1 2015 working capital needs remained limited and were predominantly driven by
restructuring payments for civil servants in Austria as well as a reduction in accounts
payable
> CAPEX declined year-on-year due to spectrum acquisitions in Bulgaria and Slovenia in
H1 2014
Results for the first half and second quarter 2015
11
Focus points
Results for the first half and second quarter 2015
Revenue outlook adjusted mainly due to FX and
worse-than-expected momentum in CEE
> Increased competitive challenges in Austrian mobile market, but counter measures keep
downside to a minimum
> Ban in price increases prohibits offsetting of BYR devaluation (-5.9% in Q2 2015 and -
15.3% in H1 2015)
> Lack of visible macroeconomic improvements in CEE burdens demand and intensifies
effects of continued price pressure
12Results for the Second Quarter and First Half of 2015
Exp. yoy 
change:
+ 2,0%
Exp. yoy 
change:
+ 0,0 ‐ 0,5%
Revenue
expectations
Feb 2015
Austria Bulgaria Croatia Belarus Additional
markets
Current
revenue
expectations
Old outlook:
Approx.
+2.0%
New outlook:
Approx.
flat
Analyst
consensus:
-0.1%

13Results for the first half and second quarter 2015
Austria: Price pressure in no-frills segment as a
result of new MVNOs, counter measures in place
> MVNO launches:
> UPC in Dec 2014
> HoT in Jan 2015
> Mass response (Spusu) in June 2015
Mobile service revenues
(in EUR million)
220
240
260
280
300
Q2 14 Q3 14 Q4 14 Q1 15 Q2 15
ARPU relevant revenues
ARPU relevant revenues excl. interconnection
Gross add development
Q2 14 Q3 14 Q4 14 Q1 15 Q2 15
High‐value gross adds No‐frill gross adds
> Counter measures implemented:
> Tariff adjustments in no-frills segments
> More content (e.g. data allowance)
> Higher subsidies for acquisition in
premium segments
RETAIL (in EURc) July 2014 30 April 2016 15 July 2017
Data (per MB) 20
domestic tariff
+ 5*
domestic
tariff
Voice-calls made
(per minute)
19
domestic tariff
+ 5*
domestic
tariff
Voice-calls received
(per minute)
5
weighted
average MTR*
domestic
tariff
SMS (per SMS) 6
domestic tariff
+ 2*
domestic
tariff
WHOLESALE (in EURc) July 2014 30 April 2016 15 July 2017
Data (per MB) 5 5 ?**
Voice (per minute) 5 5 ?**
SMS (per SMS) 2 2 ?**
European institutions agree on new regulation for
roaming and net neutrality
> Zero retail roaming as of 15 June 2017;
wholesale review by 30/06/2016
> Transition period from 30 April 2016 to
14 June 2017 during which wholesale
roaming caps can be charged in addition to
domestic rates
> Fair use policies intended to prevent abusive
or anomalous usage (not yet defined)
14Results for the first half and second quarter 2015
New glidepathRoaming:
Net neutrality:
> Providers of internet access shall treat all
traffic equally
> Specialised services may be offered in
addition to internet access services
> Reasonable traffic management measures
are allowed
* / ** See slide 39 for details.
Important steps taken to achieve convergence in
Slovenia and consolidation in Rep. of Macedonia
15Results for the first half and second quarter 2015
Amisco NV Amis Slovenia
FY 2014
Amis Croatia
FY 2014
Business Fixed-line
reseller
Fixed-line
reseller & own
fibre network
Customers 63,000 23,000
Revenues Approx. EUR 41 mn
(of which ca. 80% from Slovenia)
ONE FY 2014
Market share 25.4%* (No. 3)
Customers 715,000
Revenues EUR 75.7 mn
EBITDA EUR 10.6 mn
> 100% acquisition of Amisco NV
> Si.mobil in Slovenia to become convergent
and strengthening of Vipnet in Croatia
> Closing expected for Q3 2015
> Subject to merger control clearance
> 55% Telekom Austria Group (sole control),
45% Telekom Slovenije Group
> Call and put options for the exit of Telekom
Slovenije Group within 3 years
> Commitments include MVNO access offered
to interested parties
* Q4 2014, Telekom Austria Group estimates

Outlook for the full year 2015
16Results for the first half and second quarter 2015
* Does not include investments for spectrum and acquisitions.
** Intended proposal for the AGM 2016
17
Telekom Austria Group adjusts revenue outlook for
the full year 2015
Approx. flat
EUR 0.05
EUR 700-750 mn
Revenues
CAPEX*
Proposed Dividend**
Revenues
CAPEX*
Proposed dividend**
16 July 2015
Results for the first half and second quarter 2015
On a constant currency basis with the exception of Belarus; assumed BYR devaluation of 25%
EUR 0.05
Approx. +2.0%
EUR 700-750 mn
22 April 2015
Appendix 1
18Results for the first half and second quarter 2015
19
as of 30 June 2015
(in ‘000, in %)
The leading regional communications player
providing convergent telecommunication services
Mobile:
> Market share: 40.1% (Q2 2014: 41.5%)
> Subscriber base: 5,369 (Q2 2014: 5,510)
Fixed Line:
> Access Lines: 2,282 (Q2 2014: 2,275)
Austria
Mobile:
> Market share: 39.0% (Q2 2014: 38.1%)
> Subscriber base: 4.305 (Q2 2014: 4,108)
Fixed Line:
> Access Lines: 183 (Q2 2014: 153)
Bulgaria*
Mobile:
> Market share: 42.4% (Q2 2014: 42.5%)
> Subscriber base: 4,912 (Q2 2014: 4,940)
Belarus
Mobile:
> Market share: 36.5% (Q2 2014: 36.7%)
> Subscriber base: 1,756 (Q2 2014: 1,829)
Fixed Line:
> Access Lines: 238 (Q2 2014: 208)
Croatia
Republic of Macedonia
Mobile:
> Market share: 28.4% (Q2 2014: 28.2%)
> Subscriber base: 608 (Q2 2014: 620)
Fixed Line:
> Access Lines: 87 (Q2 2014: na)
Mobile:
> Market share: 29.5% (Q2 2014: 29.8%)
> Subscriber base: 690 (Q2 2014: 680)
Slovenia
Republic of Serbia
Mobile:
> Market share: 22.4% (Q2 2014: 22.0%)
> Subscriber base: 2,103 (Q2 2014: 2,037)
Results for the first half and second quarter 2015
Revenue Split - Segment Austria (in EUR million) Q2 2015 Q2 2014 % change
Monthly fee and traffic 450.2 413.6 8.8%
Data and ICT solutions 54.2 45.7 18.6%
Wholesale (incl. Roaming) 34.2 48.1 -29.0%
Interconnection 44.7 47.3 -5.5%
Equipment 27.8 20.3 37.0%
Other revenues 7.5 8.4 -11.5%
Total revenues - Segment Austria 618.5 583.5 6.0%
Revenue Split - International Operations (in EUR million) Q2 2015 Q2 2014 % change
Monthly fee and traffic 275.4 290.4 -5.1%
Data and ICT solutions 0.4 0.5 -12.5%
Wholesale (incl. Roaming) 12.5 4.7 164.9%
Interconnection 35.3 39.9 -11.7%
Equipment 47.1 51.6 -8.8%
Other revenues 3.2 1.7 93.6%
Total revenues - int. Operations 373.9 388.8 -3.8%
Telekom Austria Group – Revenue breakdown
20Results for the first half and second quarter 2015
Telekom Austria Group – Expense breakdown
21Results for the first half and second quarter 2015
Operating Expense - Segment Austria (in EUR million) Q2 2015 Q2 2014 % change
Material expense 60.2 55.8 7.9%
Employee costs 172.4 167.5 2.9%
Interconnection 42.2 44.4 -5.2%
Maintenance and repairs 23.6 26.0 -9.0%
Services received 22.7 29.3 -22.6%
Other support services 30.3 31.3 -3.0%
Other 77.1 80.4 -4.1%
Total OPEX - Segment Austria 428.4 434.6 -1.4%
Operating Expense - International Operations (in EUR million) Q2 2015 Q2 2014 % change
Material expense 53.4 57.2 -6.6%
Employee costs 35.8 35.8 -0.2%
Interconnection 36.0 42.3 -14.9%
Maintenance and repairs 15.1 15.0 0.9%
Services received 23.9 16.5 45.1%
Other support services 6.1 5.7 6.9%
Other 89.0 86.1 3.4%
Total OPEX - int. Operations 259.3 258.6 0.3%
Telekom Austria Group – Headcount development
* Including corporates
22Results for the first half and second quarter 2015
Austria 8,683 8,854 -1.9%
International 7,295 7,034 3.7%
Telekom Austria Group* 16,158 16,062 0.6%
FTE (End of period) Q2 2015 Q2 2014 % change
Austria 8,655 8,837 -2.1%
International 7,246 7,035 3.0%
Telekom Austria Group* 16,080 16,044 0.2%
Capital Expenditures (in EUR million) Q2 2015 Q2 2014 % change
Segment Austria 97.6 79.9 22.2%
Segment Bulgaria 15.6 41.2 -62.2%
Segment Croatia 12.3 18.4 -33.2%
Segment Belarus 10.6 7.3 44.3%
Segment Additional Markets 16.8 82.8 -79.7%
Slovenia 5.0 70.6 -92.9%
Republic of Serbia 8.8 10.6 -17.7%
Republic of Macedonia 3.1 1.4 112.9%
Eliminations additional markets 0.0 0.0 n.a.
Corporate, Others & Elimination 0.0 0.0 n.a.
Total capital expenditures 152.8 229.5 -33.4%
Thereof tangible 126.8 106.3 19.3%
Thereof intangible 26.1 123.3 -78.9%
Telekom Austria Group – Capital expenditures split
23Results for the first half and second quarter 2015
Telekom Austria Group – Net debt
24
EUR 600 mn non-call 5 years hybrid bond qualified as 100% equity
under IFRS
Results for the first half and second quarter 2015
* As of 31 December 2014 long-term financial investments, instalment sales receivables and financial leasing are no longer included in the calculation of net debt;
comparative figures have been restated accordingly
** As of 30 June 2015 a deferred consideration for the acquisitions of the cable operators in Macedonia in the amount of EUR 0.4 million is included in short-term
borrowings.
Net debt* (in EUR million) 30 June 2015 31 December 2014 % change
Long-term debt 2,635.1 3,385.0 -22.2%
Short-term borrowings** 1,058.6 340.8 210.6%
Cash and cash equivalents and short-term investments -1,185.7 -1,032.5 n.m.
Net Debt of Telekom Austria Group 2,508.0 2,693.3 -6.9%
* EUR 600 mn non-call 5 years hybrid bond qualified as 100% equity under IFRS
** As of 30 June 2015 a deferred consideration for the acquisitions of the cable operators in Macedonia in the amount of EUR 0.4 million is included in short-term
borrowings.
Telekom Austria Group – Debt maturity profile
Debt Maturity Profile (Including accrued interest)*
(in EUR million)
> EUR 3,693.7 mn of short- and long-term borrowings as of 30 June 2015**
> Average cost of debt of approximately 4.28%
> Cash and cash equivalents and short-term investments of EUR 1,185.7 mn
> Average term to maturity of 4.02 years
25Results for the first half and second quarter 2015
270.6
840.7
546.3
205.3
47.3
0.0
743.3 742.2
298.0
2015 2016 2017 2018 2019 2020 2021 2022 2023
Telekom Austria Group – Debt profile
Overview debt instruments Fixed-floating mix
> S&P: BBB (outlook stable)
> Moody’s: Baa2 (outlook stable)
Lines of credit Ratings
> Undrawn committed credit lines
amounting to EUR 1,000 mn
> Average term to maturity of
approx. 4.4 years
26Results for the first half and second quarter 2015
16.4%
83.6%
Loans Bonds
100.0%
Fixed
1,046 1,044 1,050 1,050 1,058
241.6 243.9 251.8 255.7 259.1
150.00
200.00
250.00
300.00
350.00
0.00
200.00
400.00
600.00
800.00
1000.00
1200.00
Q2 14 Q3 14 Q4 14 Q1 15 Q2 15
37 37 36 36 35
1,388 1,405 1,433 1,453 1,462
245 242 239 240 238
Q2 14 Q3 14 Q4 14 Q1 15 Q2 15
2,275 2,275 2,287 2,289 2,282
Q2 14 Q3 14 Q4 14 Q1 15 Q2 15
30.3 30.2 30.5
29.5 29.3
207.4 206.0
208.5
202.7 200.5
Q2 14 Q3 14 Q4 14 Q1 15 Q2 15
Fixed broadband access lines
(in ‘000)
Bundle subscriber growth
(in ‘000)
Unbundled lines
Segment Austria – Fixed-line key performance
indicators
ARPL & ARPL-relevant revenues
(in EUR, in EUR million)
Total fixed access lines & net adds
(in ‘000)
27
ARPL ARPL-relevant revenues
Fixed retail broadband lines
Fixed wholesale broadband lines
Bundles A1 TV
Total fixed access lines Net adds
Results for the first half and second quarter 2015
-12.6
0.4
11.6
1.8 -6.7
156.3% 156.2%
155.1% 155.3%
156.5%
Q2 14 Q3 14 Q4 14 Q1 15 Q2 15
743.9
722.9 714.9
692.1 682.1
Q2 14 Q3 14 Q4 14 Q1 15 Q2 15
137.8 139.0 141.0
137.6 136.4
Q2 14 Q3 14 Q4 14 Q1 15 Q2 15
16.2 16.9 16.5 15.7 16.0
270.2
277.4 268.6
254.1 257.9
Q2 14 Q3 14 Q4 14 Q1 15 Q2 15
Segment Austria – Mobile key performance
indicators
ARPU & ARPU-relevant revenues*
(in EUR)
MoU per subscriber**
(in min)
Mobile broadband customers
(in ‘000)
Mobile penetration
(in %)
28
ARPU ARPU relevant revenues
Results for the first half and second quarter 2015
* As of Q1 2015 ARPU relevant revenues excluding mobile value added services (immaterial).
** As of Q1 2015 the calculation methodology of MOU has changed. To ensure comparability, historical numbers for the year 2014 have been restated accordingly.
34.7% 30.2%
41.9% 43.7%
16.3% 17.6%
7.1% 6.2%
Q2 14 Q2 15
Tele.ring
T-mobile
Hutchison
A1
58.1% 58.5%
5.0% 4.6%
22.4% 22.3%
14.5% 14.6%
Q2 14 Q2 15
Others
UPC
Tele2/UTA
A1
30.6% 30.8%
0.8% 0.7%
16.4% 14.4%
16.6% 16.7%
4.7% 4.3%
30.8% 33.1%
Q2 14 Q2 15
Mobile Broadband
Other Operations
Unbundled Lines
Cable
A1 Mobile
Broadband
A1 Fixed
Wholesale
A1 Fixed Retail
Market share fixed-line broadband
(in %)
Segment Austria – Broadband market split
29
Market share total broadband
(in %)
Market share mobile broadband
(in %)
Results for the first half and second quarter 2015
59.9% 60.5%
22.3% 23.0%
3.9% 3.4%
13.9% 13.1%
Q2 14 Q2 15
A1 Tele2/UTA UPC Others
8.2% 7.8%
5.2% 4.8%
86.7% 87.4%
Q2 14 Q2 15
Fixed Line Telekom Austria Fixed Line Others Mobile
Segment Austria – Voice market split
Market share total minutes
(in %)
30
Market share fixed-line minutes
(in %)
Results for the first half and second quarter 2015
153.0 151.3 153.6
170.4
183.5
Q2 14 Q3 14 Q4 14 Q1 15 Q2 15
148.5 147.5 145.1
150.8 152.6
Q2 14 Q3 14 Q4 14 Q1 15 Q2 15
14.5 14.4 14.4 13.4
11.7
6.7 6.6 6.6 6.5
6.3
Q2 14 Q3 14 Q4 14 Q1 15 Q2 15
Segment Bulgaria – Fixed-line key performance
indicators
ARPL & ARPL-relevant revenues
(in EUR, in EUR million)
Fixed broadband retail access lines
(in ‘000)
Total fixed access lines
(in ‘000)
ARPL ARPL-relevant revenues
31
TV subscribers
(in ‘000)
Results for the first half and second quarter 2015
78.8 80.7
84.3
97.3
111.8
Q2 14 Q3 14 Q4 14 Q1 15 Q2 15
Segment Bulgaria – Mobile key performance
indicators
ARPU
(in EUR)
MoU per subscriber
(in min)
Mobile broadband customers
(in ‘000)
Mobile penetration
(in %)
32Results for the first half and second quarter 2015
6.2 6.2
5.9
5.5 5.5
Q2 14 Q3 14 Q4 14 Q1 15 Q2 15
129.6 129.7 129.6 127.5
134.4
Q2 14 Q3 14 Q4 14 Q1 15 Q2 15
217.1
227.8
248.9
271.2
287.4
Q2 14 Q3 14 Q4 14 Q1 15 Q2 15
146.1%
148.6%
152.7%
149.8%
150.5%
Q2 14 Q3 14 Q4 14 Q1 15 Q2 15
Segment Croatia – Fixed-line key performance
indicators
ARPL & ARPL-relevant revenues
(in EUR, in EUR million)
Fixed broadband retail access lines
(in ‘000)
Total fixed access lines
(in ‘000)
ARPL ARPL-relevant revenues
33
TV subscribers
(in ‘000)
Results for the first half and second quarter 2015
21.3 21.1 21.4 21.2
21.9
13.2 13.3
13.9 14.3
15.3
Q2 14 Q3 14 Q4 14 Q1 15 Q2 15
208.0
212.3
219.9
228.9
237.8
Q2 14 Q3 14 Q4 14 Q1 15 Q2 15
121.0
127.6
136.0
145.5
154.5
Q2 14 Q3 14 Q4 14 Q1 15 Q2 15
162.9 163.4
167.7 171.5 174.4
Q2 14 Q3 14 Q4 14 Q1 15 Q2 15
Segment Croatia – Mobile key performance
indicators
ARPU
(in EUR)
MoU per subscriber
(in min)
Mobile broadband customers
(in ‘000)
Mobile penetration
(in %)
34Results for the first half and second quarter 2015
11.1
11.4 11.2
10.7
11.5
Q2 14 Q3 14 Q4 14 Q1 15 Q2 15
146.6 145.0
150.7 154.4
160.6
Q2 14 Q3 14 Q4 14 Q1 15 Q2 15
173.6 178.4
144.2 140.4
154.7
Q2 14 Q3 14 Q4 14 Q1 15 Q2 15
116.1% 117.6%
112.6% 110.9%
113.8%
Q2 14 Q3 14 Q4 14 Q1 15 Q2 15
Segment Belarus – Mobile key performance
indicators
ARPU
(in EUR)
MoU per subscriber*
(in min)
Mobile penetration
(in %)
Mobile broadband customers
(in ‘000)
35Results for the first half and second quarter 2015
5.0
6.2
4.5 4.6
5.0
Q2 14 Q3 14 Q4 14 Q1 15 Q2 15
197.7 198.8 201.4
187.8
199.6
Q2 14 Q3 14 Q4 14 Q1 15 Q2 15
262.3
272.4
284.1 282.9 289.2
Q2 14 Q3 14 Q4 14 Q1 15 Q2 15
122.8% 123.1% 123.3%
121.9% 122.1%
Q2 14 Q3 14 Q4 14 Q1 15 Q2 15
Segment Additional Markets – Mobile key
performance indicators
Slovenia - ARPU
(in EUR)
Republic of Serbia - ARPU
(in EUR)
Slovenia - MoU per subscriber
(in min)
Republic of Macedonia - ARPU
(in EUR)
36Results for the first half and second quarter 2015
192.2 188.0 190.4 190.3 189.1
Q2 14 Q3 14 Q4 14 Q1 15 Q2 15
19.8 19.6
17.3
15.8 16.2
Q2 14 Q3 14 Q4 14 Q1 15 Q2 15
7.1 7.3
6.7
6.0
6.7
Q2 14 Q3 14 Q4 14 Q1 15 Q2 15
7.0 7.2
6.7
6.1
6.7
Q2 14 Q3 14 Q4 14 Q1 15 Q2 15
Appendix 2 –
Regulatory topics
37Results for the first half and second quarter 2015
38
* National MTRs stated. International MTRs differ
** Belarus values: peak times/off-peak times – the medium weighted MTR value amounts to BYR 150 per minute
Glide Path of Mobile Termination Rates
EU Pressure on National Regulatory Authorities to Further Decrease Rates
Jan
2014
Jul
2014
Sep
2014
Jan
2015
Jul
2015
Austria (EUR) 0.008049 0.008049 0.008049 0.008049 0.008049
Bulgaria (BGN) 0.02 0.02 0.02 0.019 0.019
Croatia (HRK) 0.1282* 0.1282* 0.1282* 0.063* 0.063*
Belarus (BYR) 180/90** 180/90** 180/90** 180/90** 180/90**
Slovenia (EUR) 0.0324 0.0324 0.0114 0.0114 0.0114
Serbia (RSD) 3.95 3.95 3.95 3.43 3.43
Macedonia (MKD) 1.20 1.20 0.90 0.90 0.90
Results for the first half and second quarter 2015
39
RETAIL (in EURc) Before July 2012 July 2013 July 2014 30 April 2016 15 July 2017
Data (per MB) none 70 45 20
domestic tariff
+ 5*
domestic tariff
Voice-calls made
(per minute)
35 29 24 19
domestic tariff
+ 5*
domestic tariff
Voice-calls received
(per minute)
11 8 7 5
weighted
average MTR*
domestic tariff
SMS (per SMS) 11 9 8 6
domestic tariff
+ 2*
domestic tariff
WHOLESALE (in EURc) Before July 2012 July 2013 July 2014 30 April 2016 15 July 2017
Data (per MB) 50 25 15 5 5 ?**
Voice (per minute) 18 14 10 5 5 ?**
SMS (per SMS) 4 3 2 2 2 ?**
* Sum of the domestic retail price and any surcharge applied for regulated roaming calls made, regulated roaming SMS messages sent or
regulated data roaming services shall not exceed EUR 0,19 per minute, EUR 0,06 per SMS message and EUR 0,20 per megabyte used.
Any surcharge applied for calls received shall not exceed the weighted average of maximum mobile termination rates across the Union.
** Upon entry into force of the new Regulation, the Commission shall initiate a review of the wholesale roaming market with a view to assessing
measures necessary to enable abolition of retail roaming surcharges.
EU roaming price regulation
40
Planned/Expected Comments
Austria 2019 (2100 MHz) -
Bulgaria 2015 (1800 MHz)
2600 MHz band planned to be free from 1st Sept. 2015;
allocation procedure currently undecided
Croatia
2015 (1800 MHz)
2016-2017 (2100 MHz)
2017-2018 (2600 MHz)
2100 MHz: dependent on LTE roll out dynamics and traffic
development (on request of at least one operator) as well as
fulfilment of 2015 plan (spectrum acquisition for 1800 MHz)
2600 MHz: dependent on traffic development
Belarus 2015 (2100 MHz)
2100 MHz: 4th block countrywide
LTE license only awarded to B-cloud, allocation to other
operators not expected before 2016
Slovenia 2017
NRA announced preparation of a new tender for public
spectrum auction of ‘leftovers’ 700 MHz, 1400 MHz, 1800 MHz,
2100MHz, 2300 MHz, 3500 MHz and 3700 MHz
Republic of Serbia
2015 (800 MHz)
2016 (900 MHz)
Public debate related Draft Bylaw on technical and market
conditions for issuing permits for using radio-frequency
spectrum on 800 MHz is expected in July/Aug 2015.
Republic of Macedonia 2016-2017 (900 MHz & 1800 MHz)
900 MHz (2x10) & 1800 MHz (2x10): Prolongations (Vip
operator licenses in these spectrum valid until 22.03.2017).
Potential consolidation and change of spectrum holdings in
case of acquisition of One.
Upcoming spectrum tenders / prolongations /
assignments
Results for the first half and second quarter 2015
Appendix 3 –
Personnel restructuring in Austria
41Results for the first half and second quarter 2015
721.9
888.8 852.7 810.0 809.5 791.1 773.7
2010 2011 2012 2013 2014 Q1 2015 Q2 2015
Quarterly overview – Restructuring charges and
provision vs. FTE
Overview restructuring charges
(in EUR million)
FTEs addressed
42
Overview restructuring provision**
(in EUR million)
Provisioned FTEs
* Including EUR 15.0 mn due to the judgment of the European Court of Justice from November 11, 2014 regarding the remuneration and legal rights of civil servants
(‘Vorrückungsstichtag’)
** Including liabilities for transfer of civil servants to government bodies since 2010
Results for the first half and second quarter 2015
*
2010 2011 2012 2013 2014
Q1
2015
Q2
2015
Transfer to
government
158 106 44 22 52 10 18
Social plans 28 685 94 409 199 7 49
Staff released
from work
27 0 0 0 0 0 0
Total 213 791 138 431 251 17 67
2010 2011 2012 2013 2014
Q1
2015
Q2
2015
Transfer to
government
158 264 308 330 242 195 207
Social plans 299 922 1,030 1,315 1,460 1,460 1,512
Staff released
from work
763 649 510 410 350 345 314
Total 1,220 1,835 1,848 2,055 2,052 2,000 2,033
2010 2011 2012 2013 2014
Q1
2015
Q2
2015
FTE effect 76.9 274.3 49.9 149.0 86.4* 4.5 17.4
Servicekom 0.0 -40.6 -76.7 -103.8 -39.4 -0.6 -12.1
Interest rate
adjustments
47.2 0.0 61.4 0.0 42.6 0.0 0.0
Total
124.1 233.7 34.7 45.2 89.6 3.9 5.3
* *
Overview – Cash flow impact of restructuring
Overview cash flow impact*
(in EUR million)
43
> Total cash flow impact comprises old
and new programmes
> Cash flow impact for Q2 2015 of
EUR 25.6 mn
> Total expected cash flow impact for
2015 of approximately EUR 100 - 110
mn
* Historical numbers have been restated since 2011 to fully reflect all payments from the transfer of civil servants to government bodies.
Results for the first half and second quarter 2015
Total cash-flow impact
2010 57.9
2011 93.4
2012 104.0
2013 108.0
2014 107.1
Q1 2015 25.2
Q2 2015 25.6
Appendix 4 –
Corporate sustainability
44Results for the first half and second quarter 2015
Alignment with core business and materiality
analysis define sustainability strategy
45Results for the first half and second quarter 2015
Key figures
46
Selected Group-wide KPIs
Environment: Living Green 2014
Total CO2 Emissions (Scope 1+2 in tonnes) 170,842
Energy efficiency index (in Mwh/terabyte) 0.8
Paper consumption (in tonnes) 1,771
Collected old mobile phones (in pcs) 17,880
E-billing share (in %) 64
Employees: Empowering People 2014
Share of femal employees (in %) 38
Share of femal executives (in %) 29
Internally hired positions 133
Society: Creating Equal Opportunities 2014
Participants in trainings on media literacy* 20,814
Local educational projects over 30
* Since the beginning of the initiative
Ratings
Memberships
›Classification: B
(93 points out of
100)
Indices
›Classification: C+
Results for the first half and second quarter 2015

TKA results presentation Q2 2015

  • 1.
    Vienna, 16 July2015 Results for the first half and second quarter 2015
  • 2.
    Cautionary statement 'This presentationcontains forward-looking statements. These forward-looking statements are usually accompanied by words such as 'believe', 'intend', 'anticipate', 'plan', 'expect' and similar expressions. Actual events may differ materially from those anticipated in these forward-looking statements as a result of a number of factors. Forward-looking statements involve inherent risks and uncertainties. A number of important factors could cause actual results or outcomes to differ materially from those expressed in any forward-looking statement. Neither Telekom Austria Group nor any other person accepts any liability for any such forward-looking statements. Telekom Austria Group will not update these forward-looking statements, whether due to changed factual circumstances, changes in assumptions or expectations. This presentation does not constitute a recommendation or invitation to purchase or sell securities of Telekom Austria Group.' 2Results for the first half and second quarter 2015
  • 3.
    Operational and financialhighlights for the first half and second quarter 2015 3Results for the first half and second quarter 2015
  • 4.
    H1 2015: Austriaresilient to new entrants but CEE remains challenging 4Results for the first half and second quarter 2015 * Excluding negative extraordinary effects of EUR 28.2 mn in Austria in Q2 2014 and negative FX effects of EUR 36.3 mn ** Excluding negative extraordinary effects of EUR 28.2 mn in Austria in Q2 2014, positive extraordinary effect of EUR 20.0 mn in other operating income in Slovenia in Q1 2015 and negative FX effects of EUR 17.9 mn Clean Group revenues* +0.4% Clean EBITDA comparable** +2.4% Net profit EUR 171.4 mn Mobile Austria Increase in data package volumes Subsidies Improving subscriber trends   Fixed line Austria Churn in line with expectations Tariff adjustments to base
  • 5.
    H1 2015: Austriaresilient to new entrants but CEE remains challenging (ctd.) 5Results for the first half and second quarter 2015 Regulation New roaming glidepath New net neutrality proposal Convergence Approval of Amis acquisition expected for Q3 2015 Consolidation Merger of Vip Operator and ONE approved in Republic of Macedonia * Does not include investments for spectrum and acquisitions ** Intended proposal for the AGM 2016 Full Year 2015 Group Outlook Revenues: Approx. flat Capex*: EUR 700-750 mn Dividend**: EUR 0.05 / share  
  • 6.
    Key financial developmentsin the first half and second quarter 2015 6Results for the first half and second quarter 2015
  • 7.
    (in EUR million)Q2 2015 Q2 2014 % change Revenues 982.8 963.0 2.1% EBITDA comparable* 326.8 299.4 9.1% EBITDA comparable margin* 33.3% 31.1% Restructuring -5.3 0.9 n.m. Impairment 0.0 -340.6 n.a. Depreciation & amortisation -200.5 -220.4 n.m. Operating income 121.0 -260.6 n.m. Financial result -36.4 -44.1 n.m. Income before income taxes 84.7 -304.7 n.m. Income tax gain/expense -6.1 -0.4 n.m. Net income / Net loss 78.6 -305.1 n.m. Q2 2015: Revenue and EBITDA comparable growth (both clean) 7Results for the first half and second quarter 2015 > Clean Group revenues**: Growth of +0.8% yoy > EUR 7.9 mn negative FX effect EUR 28.2 mn negative extraordinary effects in Austria in Q2 2014 > Clean EBITDA comparable***: + 2.2% due to growth in Austria and Belarus > EUR 78.6 mn net profit vs. net loss in previous years due to EUR 340.6 mn impairment in Bulgarian segment in Q2 2014 * Excluding effects from restructuring and impairment tests ** Excluding negative extraordinary effects of EUR 28.2 mn in Austria in Q2 2014 and negative FX effects of EUR 16.4 mn *** Excluding negative extraordinary effects of EUR 28.2 mn in Austria in Q2 2014 and negative FX effects of EUR 7.9 mn
  • 8.
    Austria Bulgaria CroatiaBelarus Additional markets > Bulgaria: Higher wholesale revenues only partly mitigate negative pricing trends in business segments > Croatia: Fixed service revenue growth (strong access line trends) could not offset negative effects of MTR cuts and lower equipment revenues due to lower quantities of handsets sold > Belarus: Local currency growth of 21.6% but EUR 14.5 mn FX translation effects > Additional Markets: Competition and handset accounting hurt Slovenia and Serbia respectively; blizoo benefits Macedonia > 1.1% clean revenue growth excl. EUR 28.2 mn negative extraordinary effect in Q2 2014 > 37.0% higher equipment revenues due to lower SRCs > Improvement of mobile subscriber trends: -2.5% yoy in 2Q 2015 vs. -4.8% yoy in Q1 2015 > Lower churn in res. contract, gross adds in prepaid up > ARPU rel. revenues** fell due to IC, roaming and subs > Fixed line: Churn following price increase in line with expectations; service revenues stable incl. Data & ICT Segment Austria International Segments Revenues: Positive trend in Austria offsets CEE headwinds in Q2 2015 8Results for the first half and second quarter 2015 EUR 618.5 mn Δ: +6.0% EUR 86.1 mn Δ: -5.9% EUR 90.2 mn Δ: -2.6% EUR 84.4 mn Δ: -1.1% EUR 114.0 mn Δ: -5.2% Group Revenues Reported Clean* EUR 982.8 mn EUR 999.2 mn +2.1% +0.8% * Excluding negative extraordinary effects of EUR 28.2 mn in Austria in Q2 2014 and negative FX effects of EUR 16.4 mn ** As of Q1 2015 the calculation of ARPU excludes value-added services
  • 9.
    Austria Bulgaria CroatiaBelarus Additional markets > Bulgaria: Higher roaming expenses and higher IC costs from popularity of tariffs incl. free national minutes > Croatia: Tripled frequency fees from June 2014 burden margins > Belarus: OPEX increased 17.7% in local currency due to higher maintenance and repair as well material expenses; EUR 7.5 mn negative FX effects > 2.9% OPEX growth due to Serbia (roaming) and Macedonia (blizoo); reduction in Slovenia (lower IC costs) Group EBITDA comparable grows 2.2% on a clean basis* 9 > 6.1% clean EBITDA comparable growth (excl. EUR 28.2 mn negative extraordinary effects in Q2 2014) > Operating cost cuts help offset impact from higher gross adds and higher personnel costs > Handset subsidy levels approx. trippled (in line with market) > SRCs 11.7% lower versus Q2 2014, but 53.1% higher versus Q1 2015 Segment Austria International Segments Results for the first half and second quarter 2015 EUR 212.7 mn Δ: +23.5% EUR 32.1 mn Δ: -17.2% EUR 19.0 mn Δ: -14.4% EUR 43.7 mn Δ: +4.5% EUR 25.3 mn Δ: -25.2% Group EBITDA comparable Reported Clean* EUR 326.8 mn EUR 334.7 mn 9.1% 2.2% * Excluding negative extraordinary effects of EUR 28.2 mn in Austria in Q2 2014 and negative FX effects of EUR 7.9 mn
  • 10.
    (in EUR million)Q2 2015 Q1 2014 % change 1-6 M 2015 1-6 M 2014 % change Gross cash flow 297.3 303.4 -2.0% 600.9 587.4 2.3% Change in working capital -35.0 -78.8 n.m. -66.5 -213.9 n.m. Cashflow from operating activities 262.3 224.5 16.8% 534.5 373.4 43.1% Ordinary capital expenditures -152.8 -229.5 n.m. -273.9 -329.0 n.m. Proceeds from sale of equipment 1.3 1.7 -21.7% 3.4 4.0 -14.8% Free cash flow 110.8 -3.4 n.m. 264.0 48.5 n.m. Strong increase in Free Cash Flow due to lower working capital needs and lower CAPEX 10 Year-to-date analysis > Gross cash flow rises year-on-year due to EUR 20 mn cash-relevant one-off effect in Slovenia in Q1 2015 > In H1 2015 working capital needs remained limited and were predominantly driven by restructuring payments for civil servants in Austria as well as a reduction in accounts payable > CAPEX declined year-on-year due to spectrum acquisitions in Bulgaria and Slovenia in H1 2014 Results for the first half and second quarter 2015
  • 11.
    11 Focus points Results forthe first half and second quarter 2015
  • 12.
    Revenue outlook adjustedmainly due to FX and worse-than-expected momentum in CEE > Increased competitive challenges in Austrian mobile market, but counter measures keep downside to a minimum > Ban in price increases prohibits offsetting of BYR devaluation (-5.9% in Q2 2015 and - 15.3% in H1 2015) > Lack of visible macroeconomic improvements in CEE burdens demand and intensifies effects of continued price pressure 12Results for the Second Quarter and First Half of 2015 Exp. yoy  change: + 2,0% Exp. yoy  change: + 0,0 ‐ 0,5% Revenue expectations Feb 2015 Austria Bulgaria Croatia Belarus Additional markets Current revenue expectations Old outlook: Approx. +2.0% New outlook: Approx. flat Analyst consensus: -0.1% 
  • 13.
    13Results for thefirst half and second quarter 2015 Austria: Price pressure in no-frills segment as a result of new MVNOs, counter measures in place > MVNO launches: > UPC in Dec 2014 > HoT in Jan 2015 > Mass response (Spusu) in June 2015 Mobile service revenues (in EUR million) 220 240 260 280 300 Q2 14 Q3 14 Q4 14 Q1 15 Q2 15 ARPU relevant revenues ARPU relevant revenues excl. interconnection Gross add development Q2 14 Q3 14 Q4 14 Q1 15 Q2 15 High‐value gross adds No‐frill gross adds > Counter measures implemented: > Tariff adjustments in no-frills segments > More content (e.g. data allowance) > Higher subsidies for acquisition in premium segments
  • 14.
    RETAIL (in EURc)July 2014 30 April 2016 15 July 2017 Data (per MB) 20 domestic tariff + 5* domestic tariff Voice-calls made (per minute) 19 domestic tariff + 5* domestic tariff Voice-calls received (per minute) 5 weighted average MTR* domestic tariff SMS (per SMS) 6 domestic tariff + 2* domestic tariff WHOLESALE (in EURc) July 2014 30 April 2016 15 July 2017 Data (per MB) 5 5 ?** Voice (per minute) 5 5 ?** SMS (per SMS) 2 2 ?** European institutions agree on new regulation for roaming and net neutrality > Zero retail roaming as of 15 June 2017; wholesale review by 30/06/2016 > Transition period from 30 April 2016 to 14 June 2017 during which wholesale roaming caps can be charged in addition to domestic rates > Fair use policies intended to prevent abusive or anomalous usage (not yet defined) 14Results for the first half and second quarter 2015 New glidepathRoaming: Net neutrality: > Providers of internet access shall treat all traffic equally > Specialised services may be offered in addition to internet access services > Reasonable traffic management measures are allowed * / ** See slide 39 for details.
  • 15.
    Important steps takento achieve convergence in Slovenia and consolidation in Rep. of Macedonia 15Results for the first half and second quarter 2015 Amisco NV Amis Slovenia FY 2014 Amis Croatia FY 2014 Business Fixed-line reseller Fixed-line reseller & own fibre network Customers 63,000 23,000 Revenues Approx. EUR 41 mn (of which ca. 80% from Slovenia) ONE FY 2014 Market share 25.4%* (No. 3) Customers 715,000 Revenues EUR 75.7 mn EBITDA EUR 10.6 mn > 100% acquisition of Amisco NV > Si.mobil in Slovenia to become convergent and strengthening of Vipnet in Croatia > Closing expected for Q3 2015 > Subject to merger control clearance > 55% Telekom Austria Group (sole control), 45% Telekom Slovenije Group > Call and put options for the exit of Telekom Slovenije Group within 3 years > Commitments include MVNO access offered to interested parties * Q4 2014, Telekom Austria Group estimates 
  • 16.
    Outlook for thefull year 2015 16Results for the first half and second quarter 2015
  • 17.
    * Does notinclude investments for spectrum and acquisitions. ** Intended proposal for the AGM 2016 17 Telekom Austria Group adjusts revenue outlook for the full year 2015 Approx. flat EUR 0.05 EUR 700-750 mn Revenues CAPEX* Proposed Dividend** Revenues CAPEX* Proposed dividend** 16 July 2015 Results for the first half and second quarter 2015 On a constant currency basis with the exception of Belarus; assumed BYR devaluation of 25% EUR 0.05 Approx. +2.0% EUR 700-750 mn 22 April 2015
  • 18.
    Appendix 1 18Results forthe first half and second quarter 2015
  • 19.
    19 as of 30June 2015 (in ‘000, in %) The leading regional communications player providing convergent telecommunication services Mobile: > Market share: 40.1% (Q2 2014: 41.5%) > Subscriber base: 5,369 (Q2 2014: 5,510) Fixed Line: > Access Lines: 2,282 (Q2 2014: 2,275) Austria Mobile: > Market share: 39.0% (Q2 2014: 38.1%) > Subscriber base: 4.305 (Q2 2014: 4,108) Fixed Line: > Access Lines: 183 (Q2 2014: 153) Bulgaria* Mobile: > Market share: 42.4% (Q2 2014: 42.5%) > Subscriber base: 4,912 (Q2 2014: 4,940) Belarus Mobile: > Market share: 36.5% (Q2 2014: 36.7%) > Subscriber base: 1,756 (Q2 2014: 1,829) Fixed Line: > Access Lines: 238 (Q2 2014: 208) Croatia Republic of Macedonia Mobile: > Market share: 28.4% (Q2 2014: 28.2%) > Subscriber base: 608 (Q2 2014: 620) Fixed Line: > Access Lines: 87 (Q2 2014: na) Mobile: > Market share: 29.5% (Q2 2014: 29.8%) > Subscriber base: 690 (Q2 2014: 680) Slovenia Republic of Serbia Mobile: > Market share: 22.4% (Q2 2014: 22.0%) > Subscriber base: 2,103 (Q2 2014: 2,037) Results for the first half and second quarter 2015
  • 20.
    Revenue Split -Segment Austria (in EUR million) Q2 2015 Q2 2014 % change Monthly fee and traffic 450.2 413.6 8.8% Data and ICT solutions 54.2 45.7 18.6% Wholesale (incl. Roaming) 34.2 48.1 -29.0% Interconnection 44.7 47.3 -5.5% Equipment 27.8 20.3 37.0% Other revenues 7.5 8.4 -11.5% Total revenues - Segment Austria 618.5 583.5 6.0% Revenue Split - International Operations (in EUR million) Q2 2015 Q2 2014 % change Monthly fee and traffic 275.4 290.4 -5.1% Data and ICT solutions 0.4 0.5 -12.5% Wholesale (incl. Roaming) 12.5 4.7 164.9% Interconnection 35.3 39.9 -11.7% Equipment 47.1 51.6 -8.8% Other revenues 3.2 1.7 93.6% Total revenues - int. Operations 373.9 388.8 -3.8% Telekom Austria Group – Revenue breakdown 20Results for the first half and second quarter 2015
  • 21.
    Telekom Austria Group– Expense breakdown 21Results for the first half and second quarter 2015 Operating Expense - Segment Austria (in EUR million) Q2 2015 Q2 2014 % change Material expense 60.2 55.8 7.9% Employee costs 172.4 167.5 2.9% Interconnection 42.2 44.4 -5.2% Maintenance and repairs 23.6 26.0 -9.0% Services received 22.7 29.3 -22.6% Other support services 30.3 31.3 -3.0% Other 77.1 80.4 -4.1% Total OPEX - Segment Austria 428.4 434.6 -1.4% Operating Expense - International Operations (in EUR million) Q2 2015 Q2 2014 % change Material expense 53.4 57.2 -6.6% Employee costs 35.8 35.8 -0.2% Interconnection 36.0 42.3 -14.9% Maintenance and repairs 15.1 15.0 0.9% Services received 23.9 16.5 45.1% Other support services 6.1 5.7 6.9% Other 89.0 86.1 3.4% Total OPEX - int. Operations 259.3 258.6 0.3%
  • 22.
    Telekom Austria Group– Headcount development * Including corporates 22Results for the first half and second quarter 2015 Austria 8,683 8,854 -1.9% International 7,295 7,034 3.7% Telekom Austria Group* 16,158 16,062 0.6% FTE (End of period) Q2 2015 Q2 2014 % change Austria 8,655 8,837 -2.1% International 7,246 7,035 3.0% Telekom Austria Group* 16,080 16,044 0.2%
  • 23.
    Capital Expenditures (inEUR million) Q2 2015 Q2 2014 % change Segment Austria 97.6 79.9 22.2% Segment Bulgaria 15.6 41.2 -62.2% Segment Croatia 12.3 18.4 -33.2% Segment Belarus 10.6 7.3 44.3% Segment Additional Markets 16.8 82.8 -79.7% Slovenia 5.0 70.6 -92.9% Republic of Serbia 8.8 10.6 -17.7% Republic of Macedonia 3.1 1.4 112.9% Eliminations additional markets 0.0 0.0 n.a. Corporate, Others & Elimination 0.0 0.0 n.a. Total capital expenditures 152.8 229.5 -33.4% Thereof tangible 126.8 106.3 19.3% Thereof intangible 26.1 123.3 -78.9% Telekom Austria Group – Capital expenditures split 23Results for the first half and second quarter 2015
  • 24.
    Telekom Austria Group– Net debt 24 EUR 600 mn non-call 5 years hybrid bond qualified as 100% equity under IFRS Results for the first half and second quarter 2015 * As of 31 December 2014 long-term financial investments, instalment sales receivables and financial leasing are no longer included in the calculation of net debt; comparative figures have been restated accordingly ** As of 30 June 2015 a deferred consideration for the acquisitions of the cable operators in Macedonia in the amount of EUR 0.4 million is included in short-term borrowings. Net debt* (in EUR million) 30 June 2015 31 December 2014 % change Long-term debt 2,635.1 3,385.0 -22.2% Short-term borrowings** 1,058.6 340.8 210.6% Cash and cash equivalents and short-term investments -1,185.7 -1,032.5 n.m. Net Debt of Telekom Austria Group 2,508.0 2,693.3 -6.9%
  • 25.
    * EUR 600mn non-call 5 years hybrid bond qualified as 100% equity under IFRS ** As of 30 June 2015 a deferred consideration for the acquisitions of the cable operators in Macedonia in the amount of EUR 0.4 million is included in short-term borrowings. Telekom Austria Group – Debt maturity profile Debt Maturity Profile (Including accrued interest)* (in EUR million) > EUR 3,693.7 mn of short- and long-term borrowings as of 30 June 2015** > Average cost of debt of approximately 4.28% > Cash and cash equivalents and short-term investments of EUR 1,185.7 mn > Average term to maturity of 4.02 years 25Results for the first half and second quarter 2015 270.6 840.7 546.3 205.3 47.3 0.0 743.3 742.2 298.0 2015 2016 2017 2018 2019 2020 2021 2022 2023
  • 26.
    Telekom Austria Group– Debt profile Overview debt instruments Fixed-floating mix > S&P: BBB (outlook stable) > Moody’s: Baa2 (outlook stable) Lines of credit Ratings > Undrawn committed credit lines amounting to EUR 1,000 mn > Average term to maturity of approx. 4.4 years 26Results for the first half and second quarter 2015 16.4% 83.6% Loans Bonds 100.0% Fixed
  • 27.
    1,046 1,044 1,0501,050 1,058 241.6 243.9 251.8 255.7 259.1 150.00 200.00 250.00 300.00 350.00 0.00 200.00 400.00 600.00 800.00 1000.00 1200.00 Q2 14 Q3 14 Q4 14 Q1 15 Q2 15 37 37 36 36 35 1,388 1,405 1,433 1,453 1,462 245 242 239 240 238 Q2 14 Q3 14 Q4 14 Q1 15 Q2 15 2,275 2,275 2,287 2,289 2,282 Q2 14 Q3 14 Q4 14 Q1 15 Q2 15 30.3 30.2 30.5 29.5 29.3 207.4 206.0 208.5 202.7 200.5 Q2 14 Q3 14 Q4 14 Q1 15 Q2 15 Fixed broadband access lines (in ‘000) Bundle subscriber growth (in ‘000) Unbundled lines Segment Austria – Fixed-line key performance indicators ARPL & ARPL-relevant revenues (in EUR, in EUR million) Total fixed access lines & net adds (in ‘000) 27 ARPL ARPL-relevant revenues Fixed retail broadband lines Fixed wholesale broadband lines Bundles A1 TV Total fixed access lines Net adds Results for the first half and second quarter 2015 -12.6 0.4 11.6 1.8 -6.7
  • 28.
    156.3% 156.2% 155.1% 155.3% 156.5% Q214 Q3 14 Q4 14 Q1 15 Q2 15 743.9 722.9 714.9 692.1 682.1 Q2 14 Q3 14 Q4 14 Q1 15 Q2 15 137.8 139.0 141.0 137.6 136.4 Q2 14 Q3 14 Q4 14 Q1 15 Q2 15 16.2 16.9 16.5 15.7 16.0 270.2 277.4 268.6 254.1 257.9 Q2 14 Q3 14 Q4 14 Q1 15 Q2 15 Segment Austria – Mobile key performance indicators ARPU & ARPU-relevant revenues* (in EUR) MoU per subscriber** (in min) Mobile broadband customers (in ‘000) Mobile penetration (in %) 28 ARPU ARPU relevant revenues Results for the first half and second quarter 2015 * As of Q1 2015 ARPU relevant revenues excluding mobile value added services (immaterial). ** As of Q1 2015 the calculation methodology of MOU has changed. To ensure comparability, historical numbers for the year 2014 have been restated accordingly.
  • 29.
    34.7% 30.2% 41.9% 43.7% 16.3%17.6% 7.1% 6.2% Q2 14 Q2 15 Tele.ring T-mobile Hutchison A1 58.1% 58.5% 5.0% 4.6% 22.4% 22.3% 14.5% 14.6% Q2 14 Q2 15 Others UPC Tele2/UTA A1 30.6% 30.8% 0.8% 0.7% 16.4% 14.4% 16.6% 16.7% 4.7% 4.3% 30.8% 33.1% Q2 14 Q2 15 Mobile Broadband Other Operations Unbundled Lines Cable A1 Mobile Broadband A1 Fixed Wholesale A1 Fixed Retail Market share fixed-line broadband (in %) Segment Austria – Broadband market split 29 Market share total broadband (in %) Market share mobile broadband (in %) Results for the first half and second quarter 2015
  • 30.
    59.9% 60.5% 22.3% 23.0% 3.9%3.4% 13.9% 13.1% Q2 14 Q2 15 A1 Tele2/UTA UPC Others 8.2% 7.8% 5.2% 4.8% 86.7% 87.4% Q2 14 Q2 15 Fixed Line Telekom Austria Fixed Line Others Mobile Segment Austria – Voice market split Market share total minutes (in %) 30 Market share fixed-line minutes (in %) Results for the first half and second quarter 2015
  • 31.
    153.0 151.3 153.6 170.4 183.5 Q214 Q3 14 Q4 14 Q1 15 Q2 15 148.5 147.5 145.1 150.8 152.6 Q2 14 Q3 14 Q4 14 Q1 15 Q2 15 14.5 14.4 14.4 13.4 11.7 6.7 6.6 6.6 6.5 6.3 Q2 14 Q3 14 Q4 14 Q1 15 Q2 15 Segment Bulgaria – Fixed-line key performance indicators ARPL & ARPL-relevant revenues (in EUR, in EUR million) Fixed broadband retail access lines (in ‘000) Total fixed access lines (in ‘000) ARPL ARPL-relevant revenues 31 TV subscribers (in ‘000) Results for the first half and second quarter 2015 78.8 80.7 84.3 97.3 111.8 Q2 14 Q3 14 Q4 14 Q1 15 Q2 15
  • 32.
    Segment Bulgaria –Mobile key performance indicators ARPU (in EUR) MoU per subscriber (in min) Mobile broadband customers (in ‘000) Mobile penetration (in %) 32Results for the first half and second quarter 2015 6.2 6.2 5.9 5.5 5.5 Q2 14 Q3 14 Q4 14 Q1 15 Q2 15 129.6 129.7 129.6 127.5 134.4 Q2 14 Q3 14 Q4 14 Q1 15 Q2 15 217.1 227.8 248.9 271.2 287.4 Q2 14 Q3 14 Q4 14 Q1 15 Q2 15 146.1% 148.6% 152.7% 149.8% 150.5% Q2 14 Q3 14 Q4 14 Q1 15 Q2 15
  • 33.
    Segment Croatia –Fixed-line key performance indicators ARPL & ARPL-relevant revenues (in EUR, in EUR million) Fixed broadband retail access lines (in ‘000) Total fixed access lines (in ‘000) ARPL ARPL-relevant revenues 33 TV subscribers (in ‘000) Results for the first half and second quarter 2015 21.3 21.1 21.4 21.2 21.9 13.2 13.3 13.9 14.3 15.3 Q2 14 Q3 14 Q4 14 Q1 15 Q2 15 208.0 212.3 219.9 228.9 237.8 Q2 14 Q3 14 Q4 14 Q1 15 Q2 15 121.0 127.6 136.0 145.5 154.5 Q2 14 Q3 14 Q4 14 Q1 15 Q2 15 162.9 163.4 167.7 171.5 174.4 Q2 14 Q3 14 Q4 14 Q1 15 Q2 15
  • 34.
    Segment Croatia –Mobile key performance indicators ARPU (in EUR) MoU per subscriber (in min) Mobile broadband customers (in ‘000) Mobile penetration (in %) 34Results for the first half and second quarter 2015 11.1 11.4 11.2 10.7 11.5 Q2 14 Q3 14 Q4 14 Q1 15 Q2 15 146.6 145.0 150.7 154.4 160.6 Q2 14 Q3 14 Q4 14 Q1 15 Q2 15 173.6 178.4 144.2 140.4 154.7 Q2 14 Q3 14 Q4 14 Q1 15 Q2 15 116.1% 117.6% 112.6% 110.9% 113.8% Q2 14 Q3 14 Q4 14 Q1 15 Q2 15
  • 35.
    Segment Belarus –Mobile key performance indicators ARPU (in EUR) MoU per subscriber* (in min) Mobile penetration (in %) Mobile broadband customers (in ‘000) 35Results for the first half and second quarter 2015 5.0 6.2 4.5 4.6 5.0 Q2 14 Q3 14 Q4 14 Q1 15 Q2 15 197.7 198.8 201.4 187.8 199.6 Q2 14 Q3 14 Q4 14 Q1 15 Q2 15 262.3 272.4 284.1 282.9 289.2 Q2 14 Q3 14 Q4 14 Q1 15 Q2 15 122.8% 123.1% 123.3% 121.9% 122.1% Q2 14 Q3 14 Q4 14 Q1 15 Q2 15
  • 36.
    Segment Additional Markets– Mobile key performance indicators Slovenia - ARPU (in EUR) Republic of Serbia - ARPU (in EUR) Slovenia - MoU per subscriber (in min) Republic of Macedonia - ARPU (in EUR) 36Results for the first half and second quarter 2015 192.2 188.0 190.4 190.3 189.1 Q2 14 Q3 14 Q4 14 Q1 15 Q2 15 19.8 19.6 17.3 15.8 16.2 Q2 14 Q3 14 Q4 14 Q1 15 Q2 15 7.1 7.3 6.7 6.0 6.7 Q2 14 Q3 14 Q4 14 Q1 15 Q2 15 7.0 7.2 6.7 6.1 6.7 Q2 14 Q3 14 Q4 14 Q1 15 Q2 15
  • 37.
    Appendix 2 – Regulatorytopics 37Results for the first half and second quarter 2015
  • 38.
    38 * National MTRsstated. International MTRs differ ** Belarus values: peak times/off-peak times – the medium weighted MTR value amounts to BYR 150 per minute Glide Path of Mobile Termination Rates EU Pressure on National Regulatory Authorities to Further Decrease Rates Jan 2014 Jul 2014 Sep 2014 Jan 2015 Jul 2015 Austria (EUR) 0.008049 0.008049 0.008049 0.008049 0.008049 Bulgaria (BGN) 0.02 0.02 0.02 0.019 0.019 Croatia (HRK) 0.1282* 0.1282* 0.1282* 0.063* 0.063* Belarus (BYR) 180/90** 180/90** 180/90** 180/90** 180/90** Slovenia (EUR) 0.0324 0.0324 0.0114 0.0114 0.0114 Serbia (RSD) 3.95 3.95 3.95 3.43 3.43 Macedonia (MKD) 1.20 1.20 0.90 0.90 0.90 Results for the first half and second quarter 2015
  • 39.
    39 RETAIL (in EURc)Before July 2012 July 2013 July 2014 30 April 2016 15 July 2017 Data (per MB) none 70 45 20 domestic tariff + 5* domestic tariff Voice-calls made (per minute) 35 29 24 19 domestic tariff + 5* domestic tariff Voice-calls received (per minute) 11 8 7 5 weighted average MTR* domestic tariff SMS (per SMS) 11 9 8 6 domestic tariff + 2* domestic tariff WHOLESALE (in EURc) Before July 2012 July 2013 July 2014 30 April 2016 15 July 2017 Data (per MB) 50 25 15 5 5 ?** Voice (per minute) 18 14 10 5 5 ?** SMS (per SMS) 4 3 2 2 2 ?** * Sum of the domestic retail price and any surcharge applied for regulated roaming calls made, regulated roaming SMS messages sent or regulated data roaming services shall not exceed EUR 0,19 per minute, EUR 0,06 per SMS message and EUR 0,20 per megabyte used. Any surcharge applied for calls received shall not exceed the weighted average of maximum mobile termination rates across the Union. ** Upon entry into force of the new Regulation, the Commission shall initiate a review of the wholesale roaming market with a view to assessing measures necessary to enable abolition of retail roaming surcharges. EU roaming price regulation
  • 40.
    40 Planned/Expected Comments Austria 2019(2100 MHz) - Bulgaria 2015 (1800 MHz) 2600 MHz band planned to be free from 1st Sept. 2015; allocation procedure currently undecided Croatia 2015 (1800 MHz) 2016-2017 (2100 MHz) 2017-2018 (2600 MHz) 2100 MHz: dependent on LTE roll out dynamics and traffic development (on request of at least one operator) as well as fulfilment of 2015 plan (spectrum acquisition for 1800 MHz) 2600 MHz: dependent on traffic development Belarus 2015 (2100 MHz) 2100 MHz: 4th block countrywide LTE license only awarded to B-cloud, allocation to other operators not expected before 2016 Slovenia 2017 NRA announced preparation of a new tender for public spectrum auction of ‘leftovers’ 700 MHz, 1400 MHz, 1800 MHz, 2100MHz, 2300 MHz, 3500 MHz and 3700 MHz Republic of Serbia 2015 (800 MHz) 2016 (900 MHz) Public debate related Draft Bylaw on technical and market conditions for issuing permits for using radio-frequency spectrum on 800 MHz is expected in July/Aug 2015. Republic of Macedonia 2016-2017 (900 MHz & 1800 MHz) 900 MHz (2x10) & 1800 MHz (2x10): Prolongations (Vip operator licenses in these spectrum valid until 22.03.2017). Potential consolidation and change of spectrum holdings in case of acquisition of One. Upcoming spectrum tenders / prolongations / assignments Results for the first half and second quarter 2015
  • 41.
    Appendix 3 – Personnelrestructuring in Austria 41Results for the first half and second quarter 2015
  • 42.
    721.9 888.8 852.7 810.0809.5 791.1 773.7 2010 2011 2012 2013 2014 Q1 2015 Q2 2015 Quarterly overview – Restructuring charges and provision vs. FTE Overview restructuring charges (in EUR million) FTEs addressed 42 Overview restructuring provision** (in EUR million) Provisioned FTEs * Including EUR 15.0 mn due to the judgment of the European Court of Justice from November 11, 2014 regarding the remuneration and legal rights of civil servants (‘Vorrückungsstichtag’) ** Including liabilities for transfer of civil servants to government bodies since 2010 Results for the first half and second quarter 2015 * 2010 2011 2012 2013 2014 Q1 2015 Q2 2015 Transfer to government 158 106 44 22 52 10 18 Social plans 28 685 94 409 199 7 49 Staff released from work 27 0 0 0 0 0 0 Total 213 791 138 431 251 17 67 2010 2011 2012 2013 2014 Q1 2015 Q2 2015 Transfer to government 158 264 308 330 242 195 207 Social plans 299 922 1,030 1,315 1,460 1,460 1,512 Staff released from work 763 649 510 410 350 345 314 Total 1,220 1,835 1,848 2,055 2,052 2,000 2,033 2010 2011 2012 2013 2014 Q1 2015 Q2 2015 FTE effect 76.9 274.3 49.9 149.0 86.4* 4.5 17.4 Servicekom 0.0 -40.6 -76.7 -103.8 -39.4 -0.6 -12.1 Interest rate adjustments 47.2 0.0 61.4 0.0 42.6 0.0 0.0 Total 124.1 233.7 34.7 45.2 89.6 3.9 5.3 * *
  • 43.
    Overview – Cashflow impact of restructuring Overview cash flow impact* (in EUR million) 43 > Total cash flow impact comprises old and new programmes > Cash flow impact for Q2 2015 of EUR 25.6 mn > Total expected cash flow impact for 2015 of approximately EUR 100 - 110 mn * Historical numbers have been restated since 2011 to fully reflect all payments from the transfer of civil servants to government bodies. Results for the first half and second quarter 2015 Total cash-flow impact 2010 57.9 2011 93.4 2012 104.0 2013 108.0 2014 107.1 Q1 2015 25.2 Q2 2015 25.6
  • 44.
    Appendix 4 – Corporatesustainability 44Results for the first half and second quarter 2015
  • 45.
    Alignment with corebusiness and materiality analysis define sustainability strategy 45Results for the first half and second quarter 2015
  • 46.
    Key figures 46 Selected Group-wideKPIs Environment: Living Green 2014 Total CO2 Emissions (Scope 1+2 in tonnes) 170,842 Energy efficiency index (in Mwh/terabyte) 0.8 Paper consumption (in tonnes) 1,771 Collected old mobile phones (in pcs) 17,880 E-billing share (in %) 64 Employees: Empowering People 2014 Share of femal employees (in %) 38 Share of femal executives (in %) 29 Internally hired positions 133 Society: Creating Equal Opportunities 2014 Participants in trainings on media literacy* 20,814 Local educational projects over 30 * Since the beginning of the initiative Ratings Memberships ›Classification: B (93 points out of 100) Indices ›Classification: C+ Results for the first half and second quarter 2015