Download to read offline

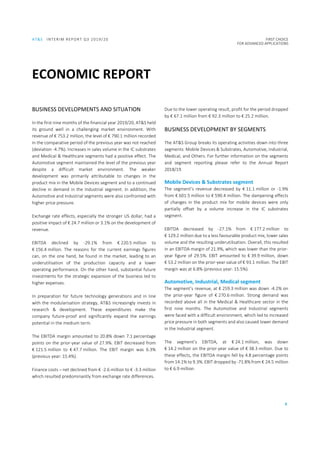
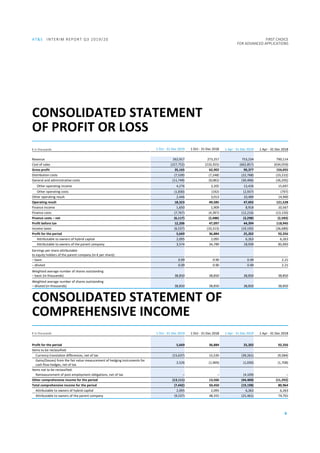
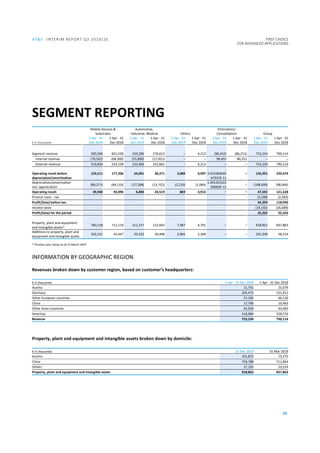


- AT&S reported lower revenue and earnings for the first nine months of the 2019/20 financial year compared to the same period last year, due to market upheavals and the economic climate. Revenue was down 4.7% and EBITDA declined 29.1%. - While some segments like IC substrates and medical saw increases, declines were seen in the mobile devices and industrial segments due to changes in product mix and price pressure. - AT&S adjusted its outlook for the full financial year due to the effects of the coronavirus, and now expects revenue of €960 million and an EBITDA margin of 18-20%. Medium-term growth targets were maintained.


