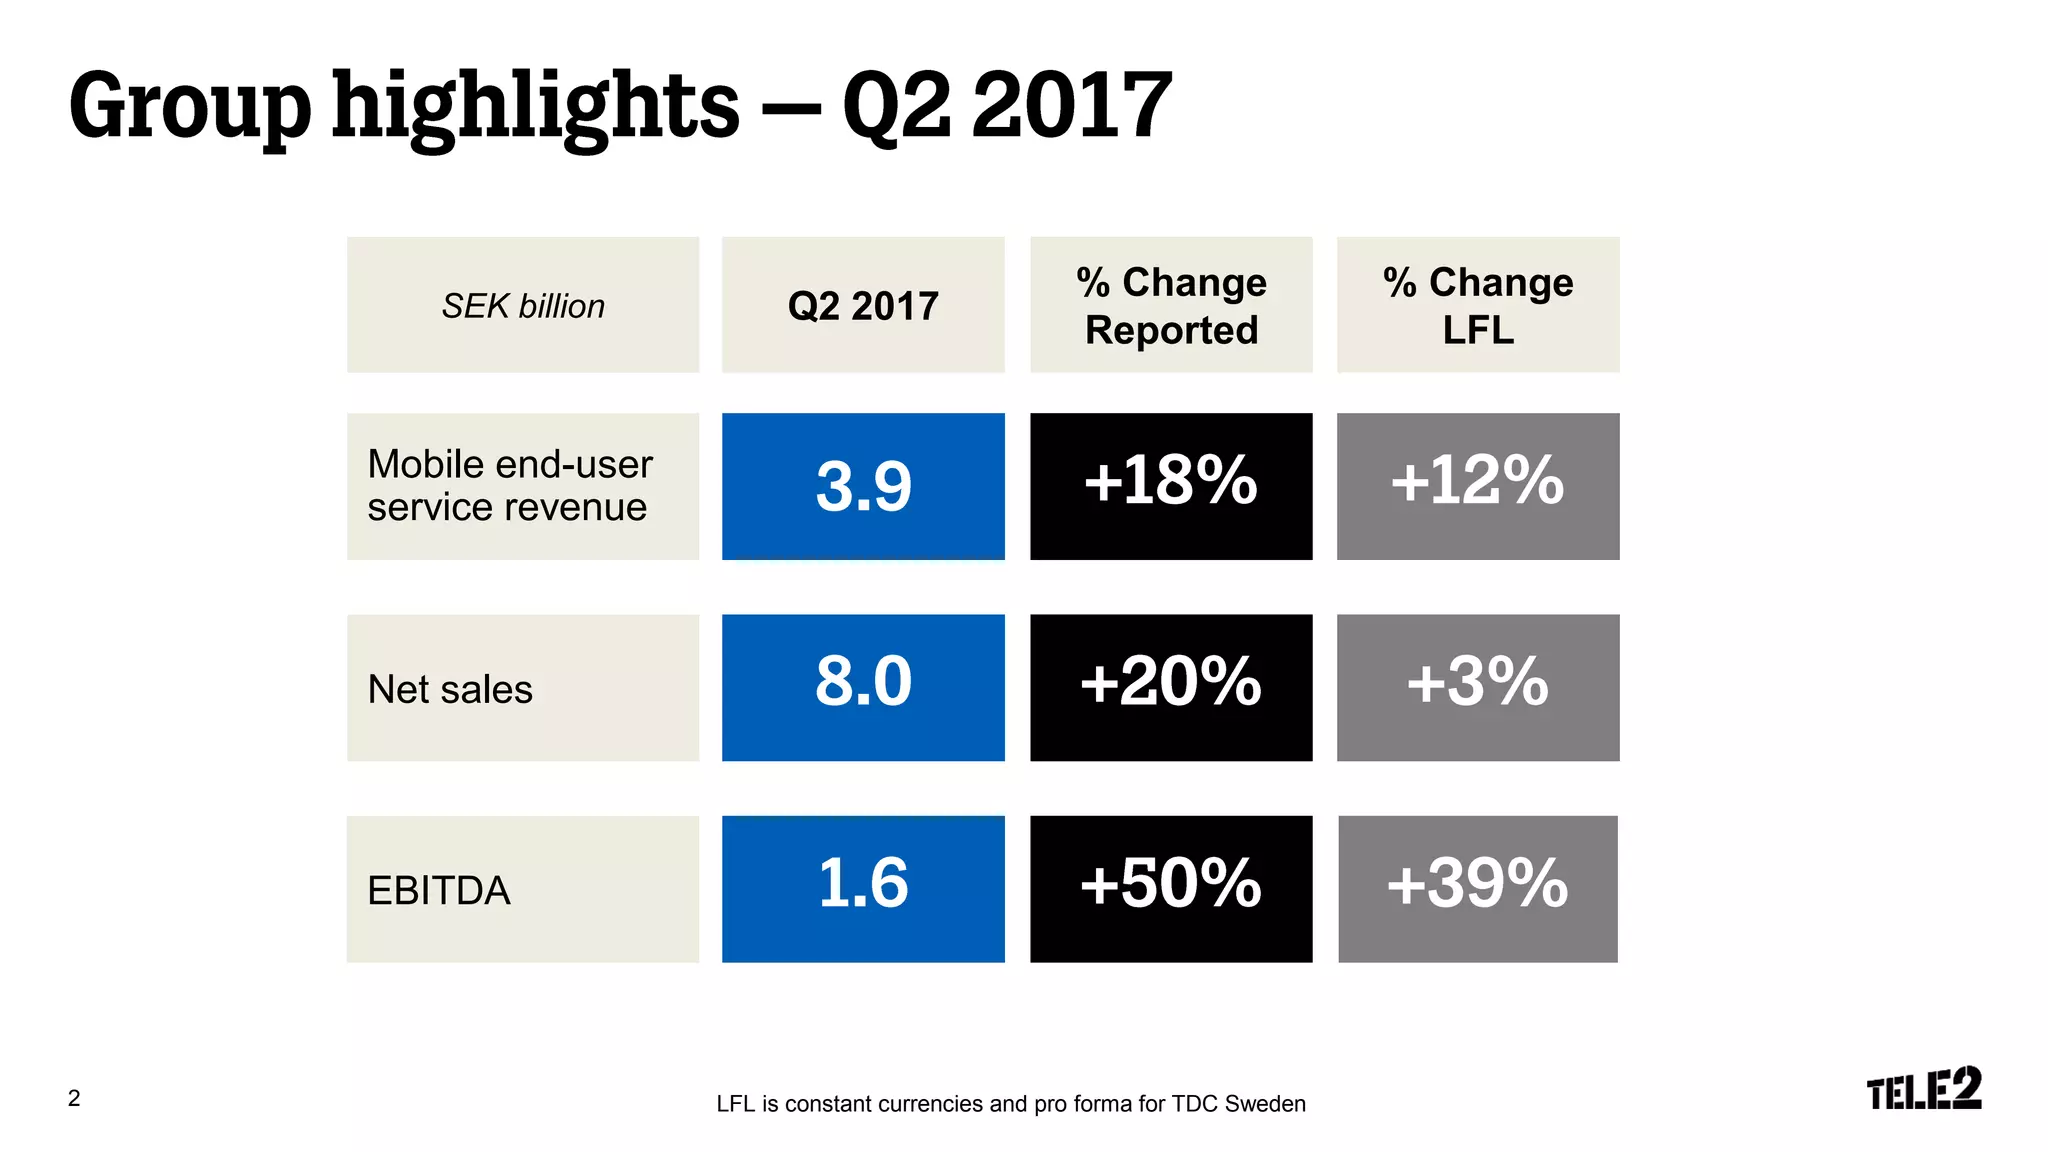
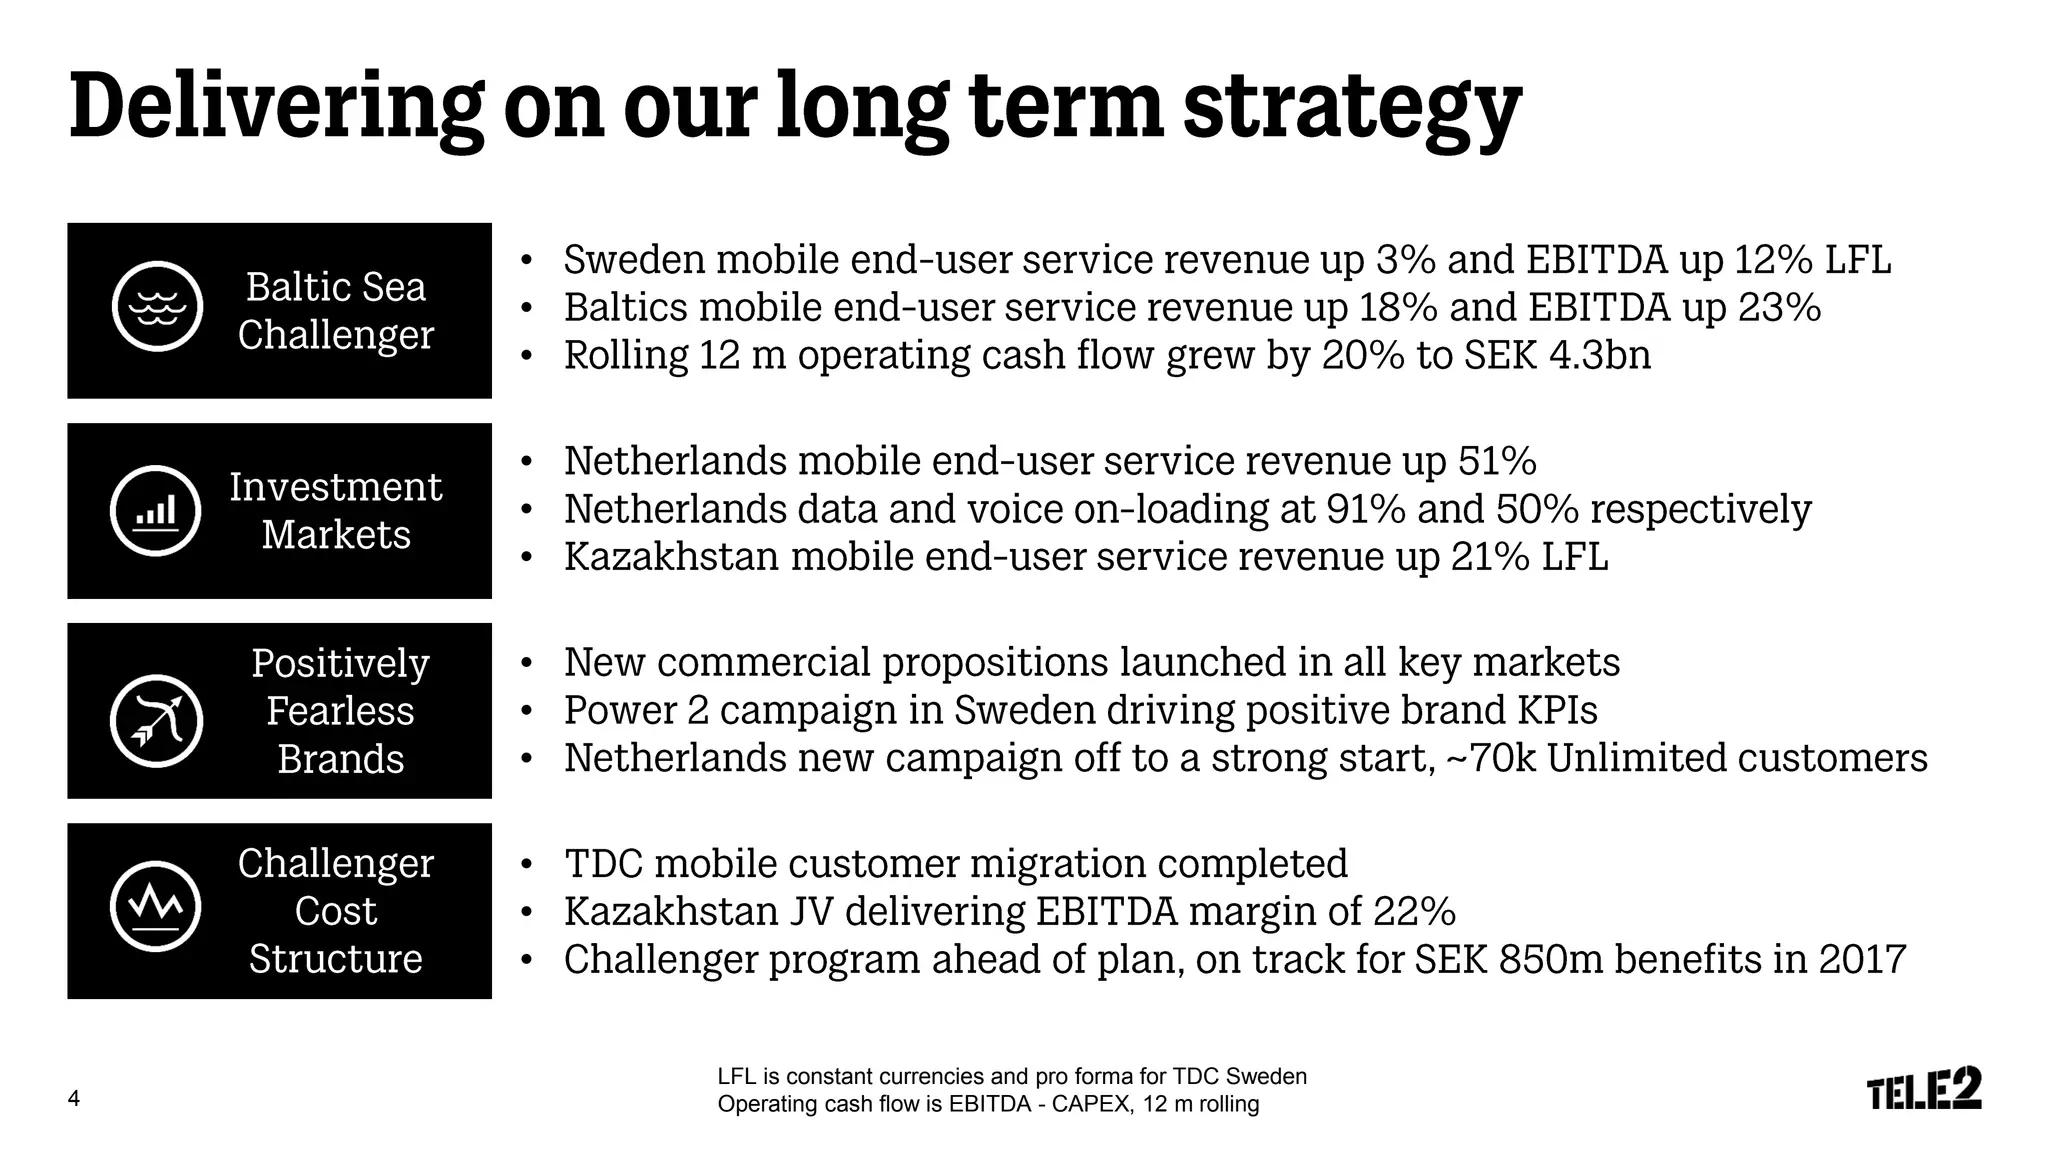
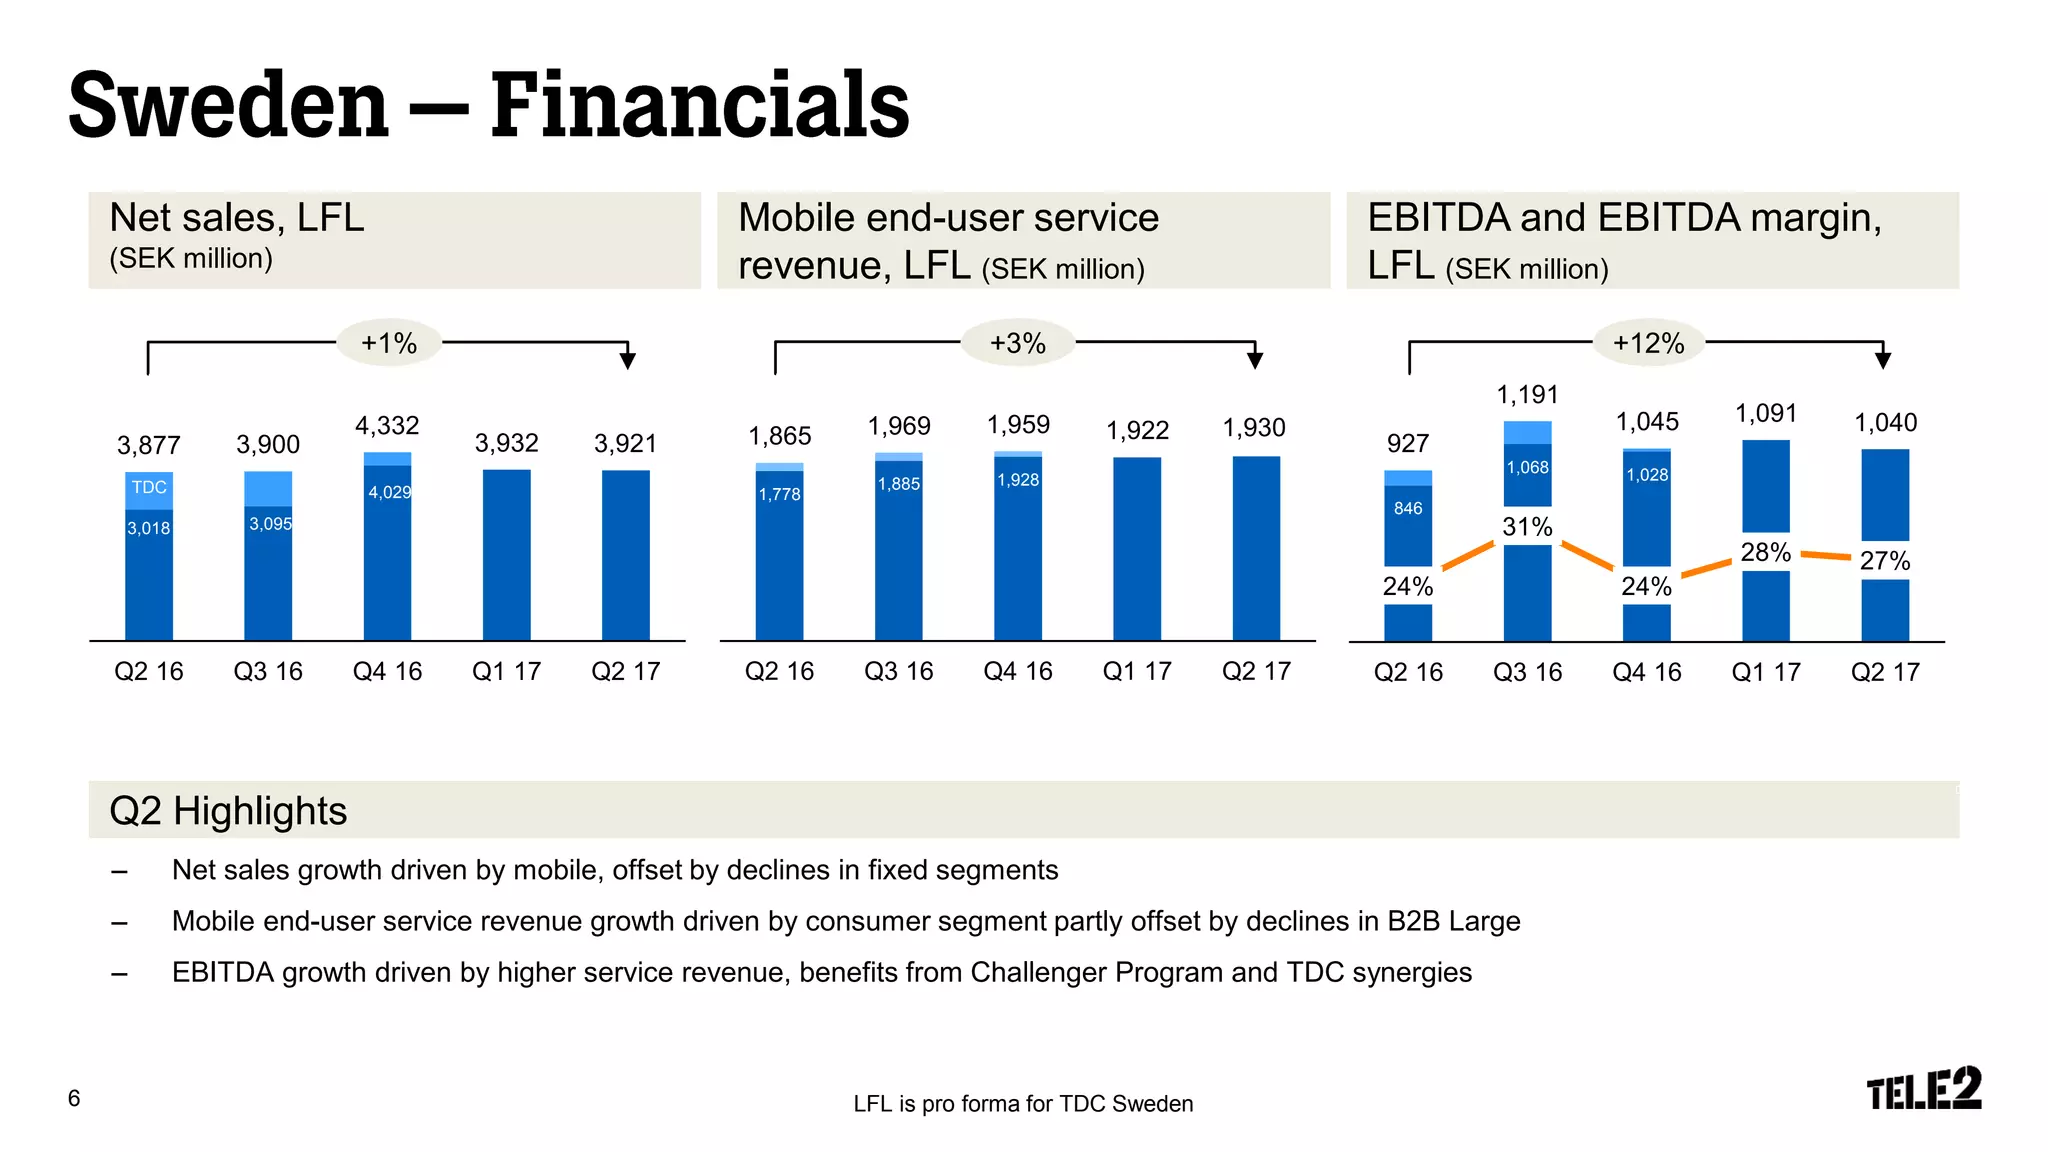
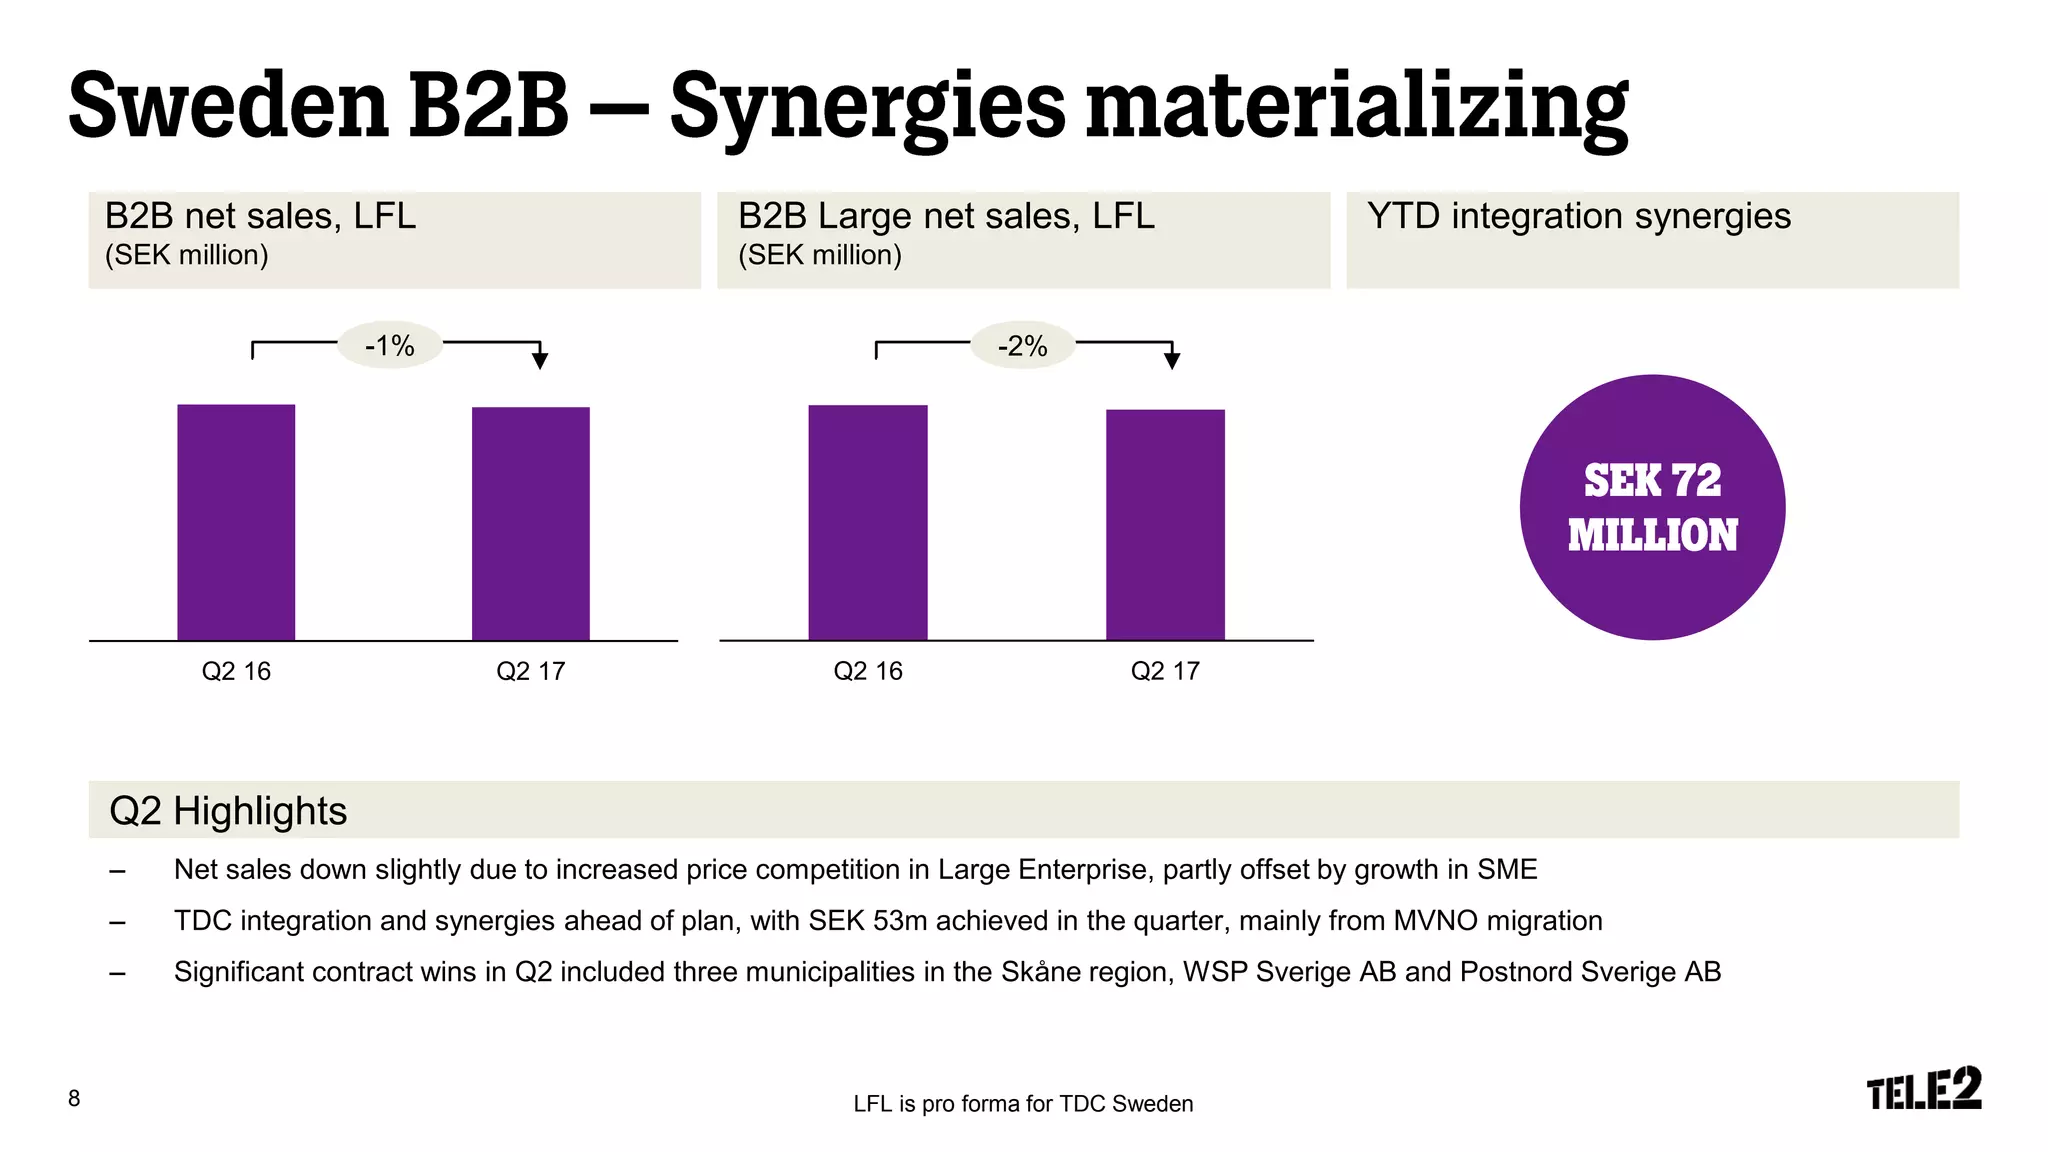
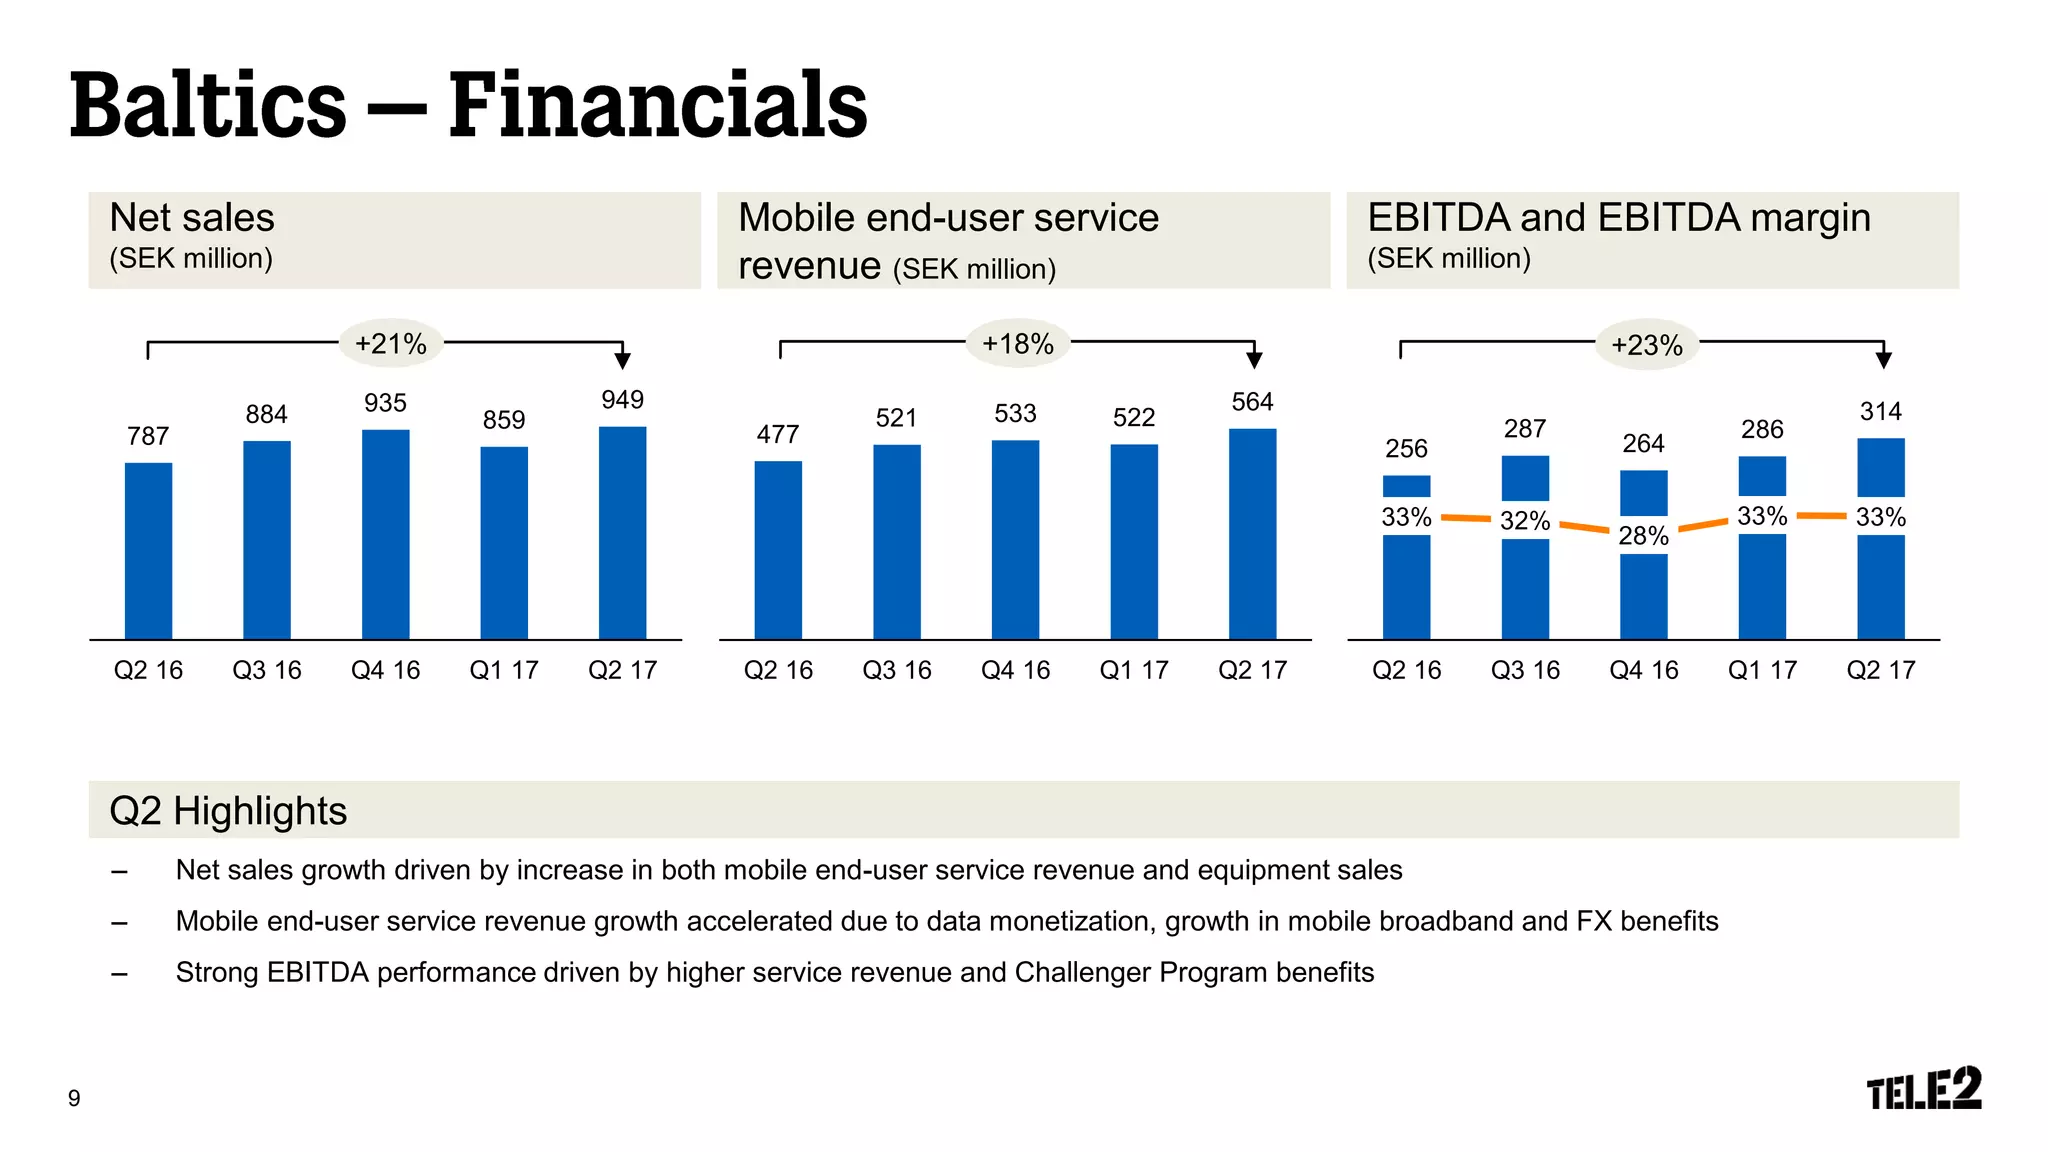
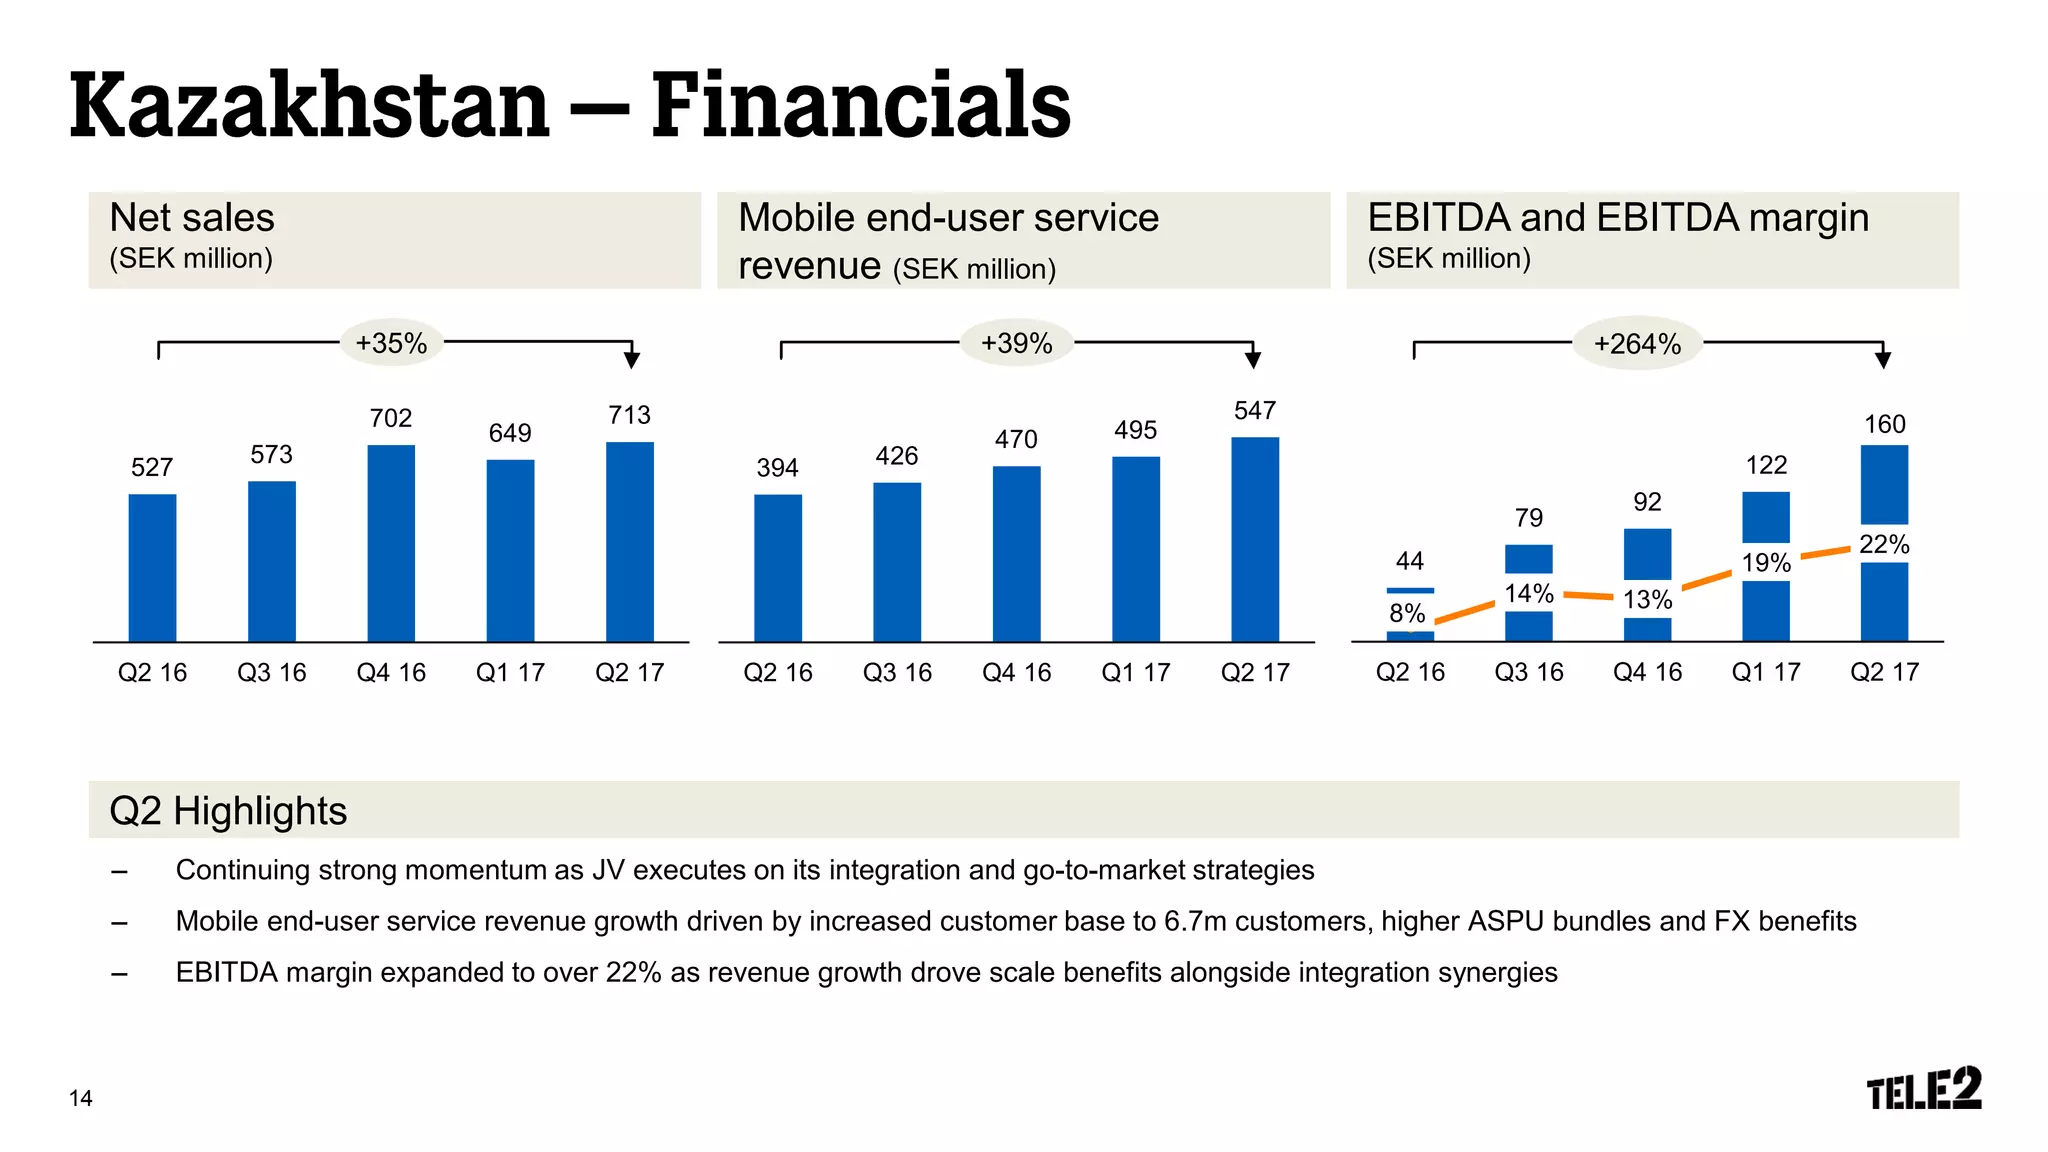
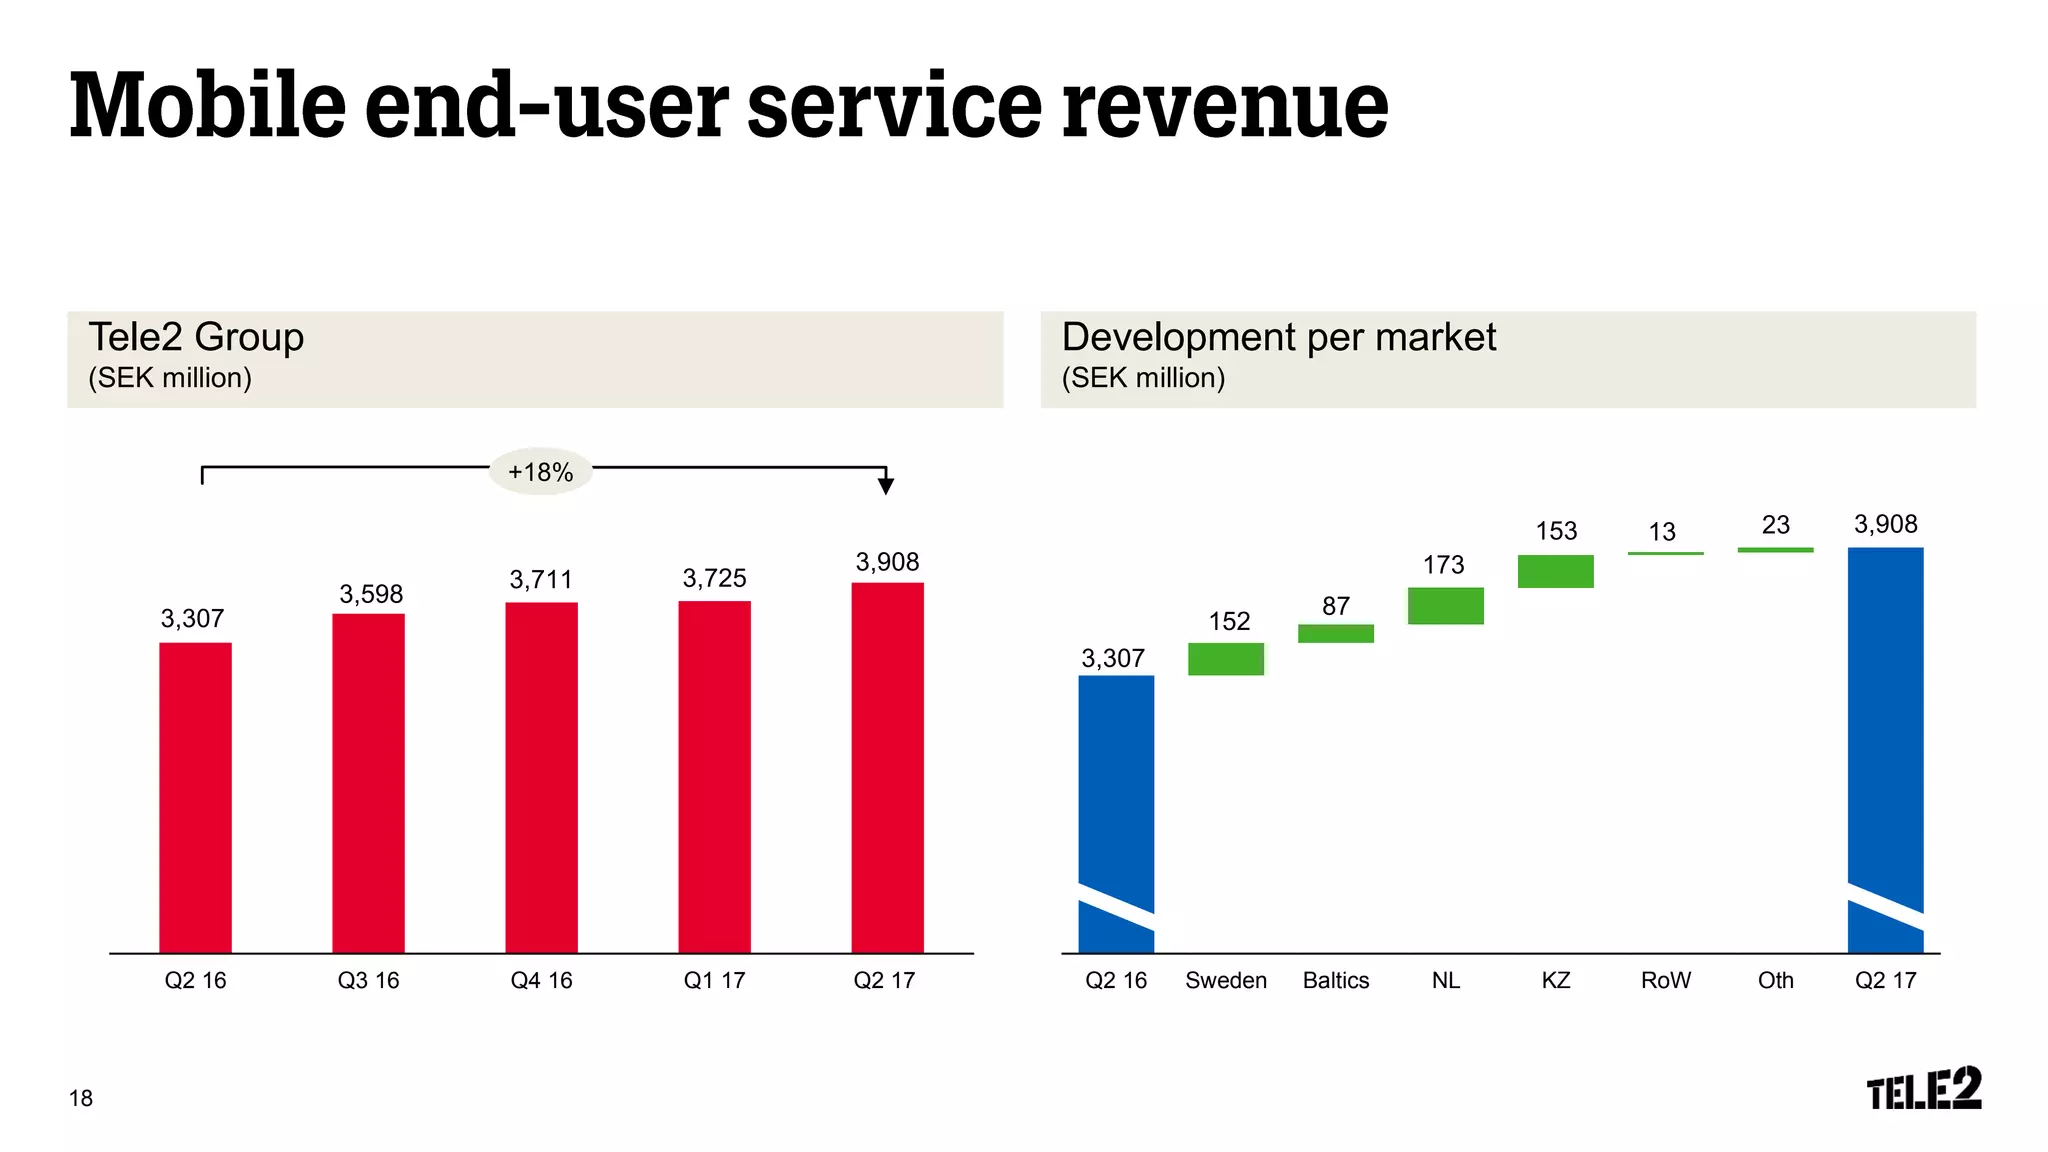
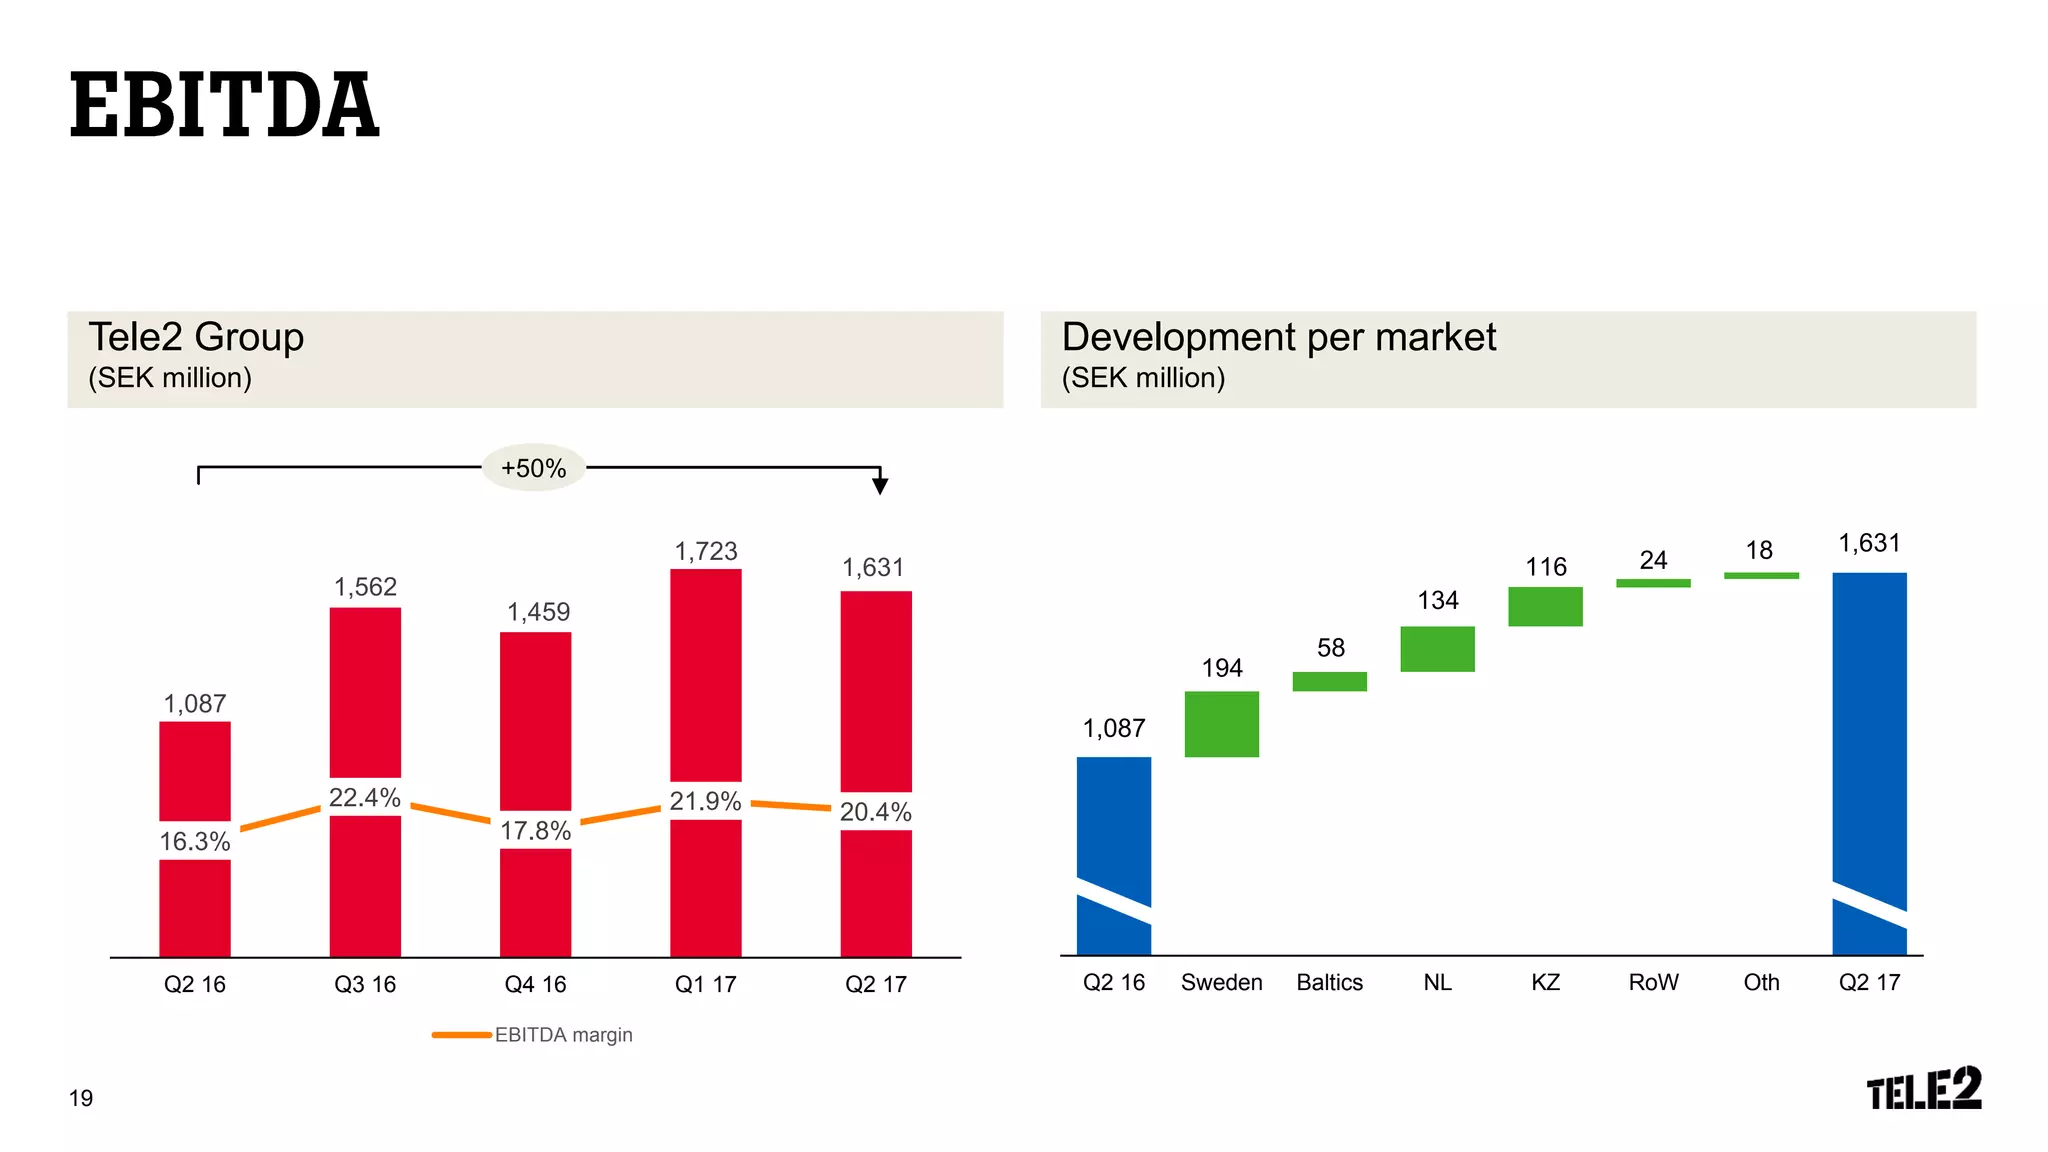
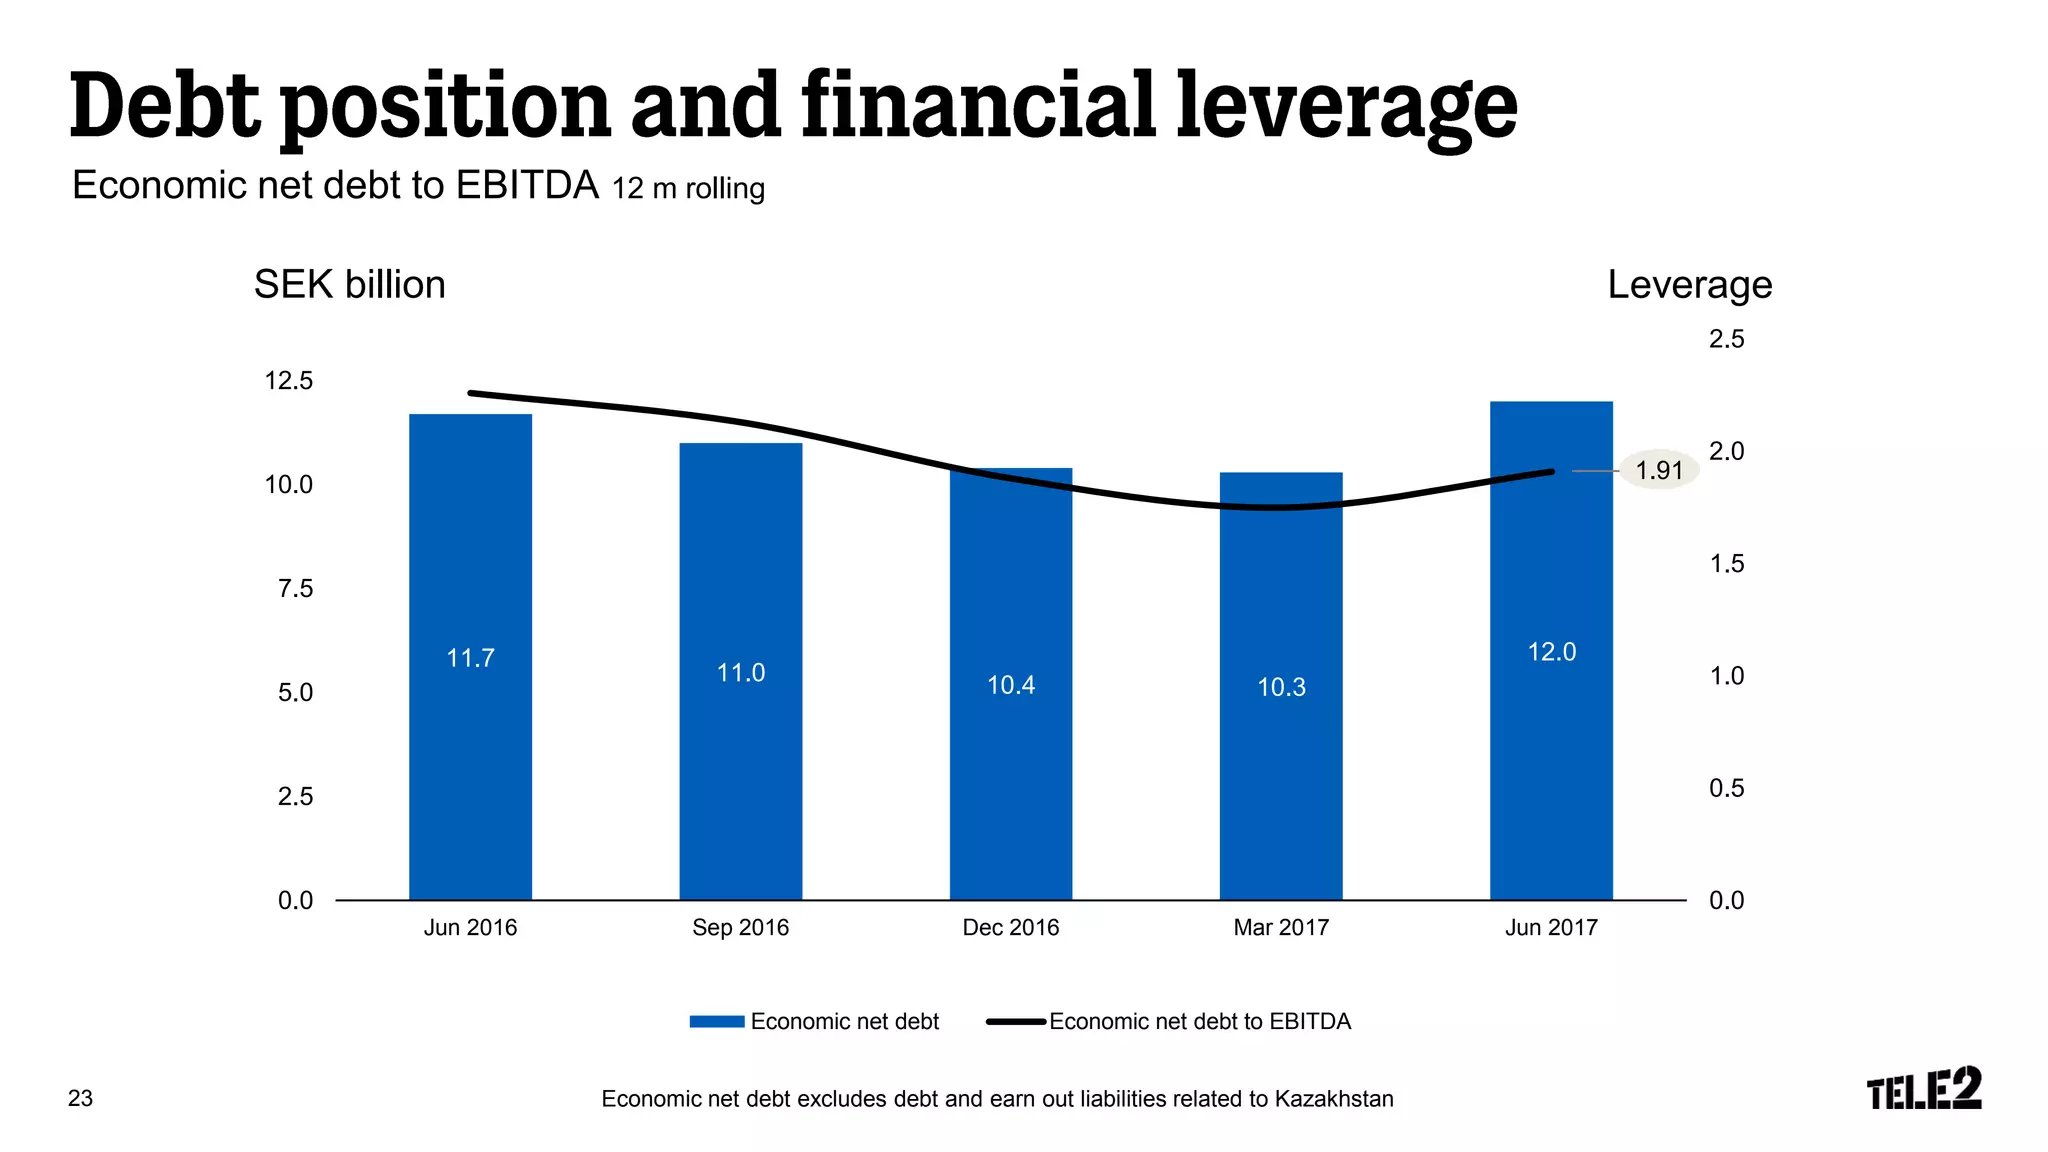
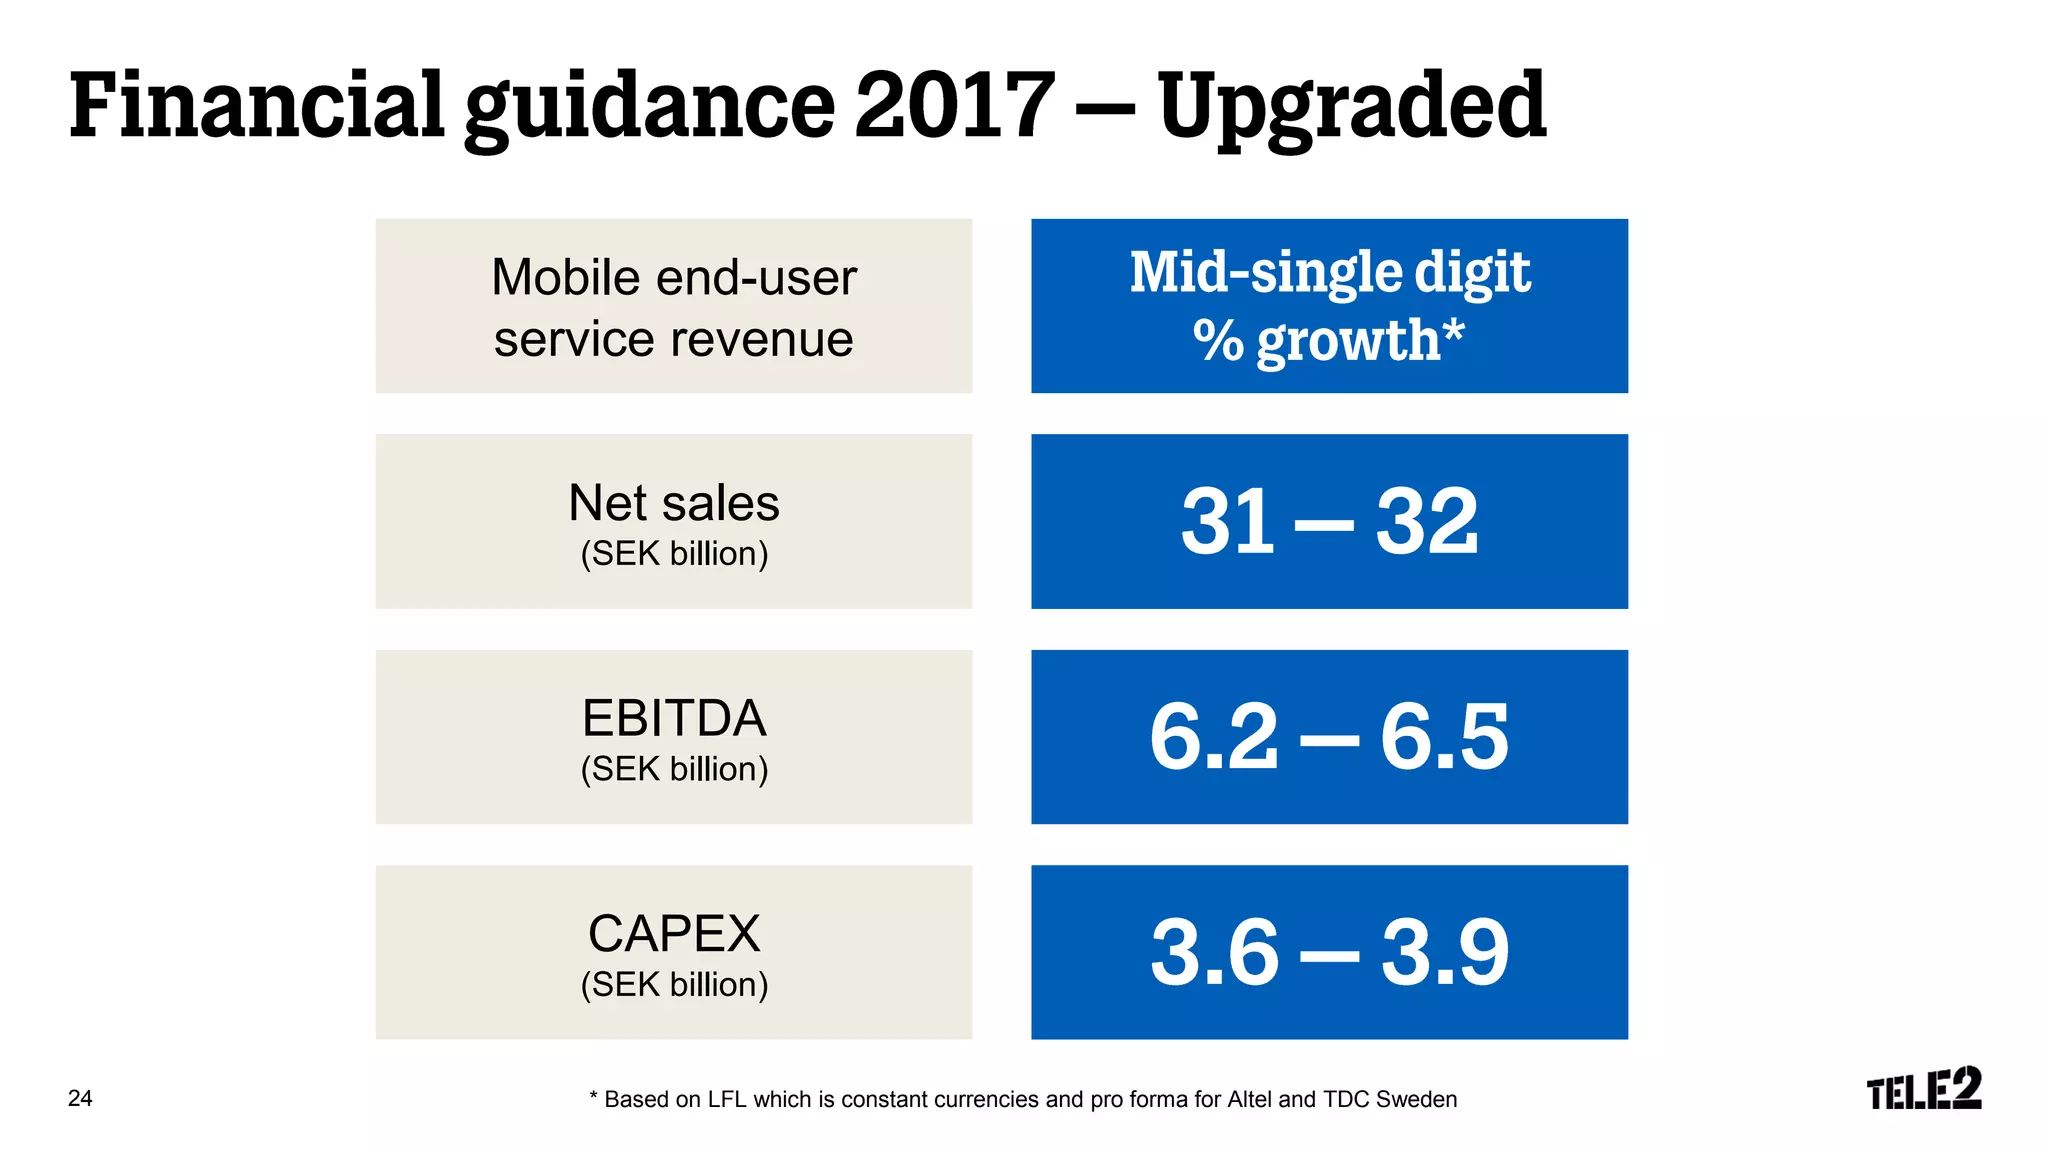
The document provides financial and operational highlights for Tele2 AB for Q2 2017:
- Net sales grew 18% driven by increases in mobile end-user service revenue and EBITDA increased 50% due to higher service revenue and integration synergies.
- Mobile end-user service revenue growth was driven by increases in the consumer segment, higher ASPU, and a larger share of customers opting for bundles over 3GB of data.
- Integration synergies from the TDC acquisition were ahead of plan, achieving SEK 53 million in the quarter mainly from migrating MVNO customers.
- The Kazakhstan joint venture continued its strong momentum, growing net sales 35% and EBITDA 39% through
Com Hem - Interim Report Q2 2014 – Presentationcomhemgroup
Com Hem reports second quarter results – Revenue up 8 percent. Revenue totaled SEK 1,198m (1,108), an increase by 8.1% versus second quarter 2013. Underlying EBITDA was SEK 566m (547), an increase of 3.5% versus second quarter of 2013. Operating free cash flow was SEK 327m (344). Net result for the period was SEK -718m (-279) affected by one-off costs of SEK 680m associated with the IPO and refinancing of debt. Earnings per share were SEK -6.53 (-2.79). Pro forma earnings per share(1) were SEK -0.90 (-1.34)
Com Hem - Interim Report Q3 2014 - Presentationcomhemgroup
Increased customer intake – delivering on the plan. Third quarter summary. Revenue totaled SEK 1,210m (1,104), an increase of 9.6% over the third quarter of 2013. Underlying EBITDA was SEK 576m (569), an increase of 1.1% over the third quarter of 2013. Operating free cash flow was SEK 318m (302), an increase of 5.3% over the third quarter of 2013. Net result for the period was SEK 7m (-82). Earnings per share were SEK 0.03 (-0.82). Pro forma earnings per share were1) SEK 0.02 (-0.39).
ASSA ABLOY Q4 2014 investors presentation 5 February 2015ASSA ABLOY
The ASSA ABLOY Group released its 2014 Year-end and interim report for the forth quarter on Thursday 5 February 2015 at 08.00 am (CET). This presentation was held at the combined investors’ and analyst meeting. Welcome to visit our Investor pages on http://www.assaabloy.com/investors/.
Essentials of Automations: Optimizing FME Workflows with ParametersSafe Software
Are you looking to streamline your workflows and boost your projects’ efficiency? Do you find yourself searching for ways to add flexibility and control over your FME workflows? If so, you’re in the right place.
Join us for an insightful dive into the world of FME parameters, a critical element in optimizing workflow efficiency. This webinar marks the beginning of our three-part “Essentials of Automation” series. This first webinar is designed to equip you with the knowledge and skills to utilize parameters effectively: enhancing the flexibility, maintainability, and user control of your FME projects.
Here’s what you’ll gain:
- Essentials of FME Parameters: Understand the pivotal role of parameters, including Reader/Writer, Transformer, User, and FME Flow categories. Discover how they are the key to unlocking automation and optimization within your workflows.
- Practical Applications in FME Form: Delve into key user parameter types including choice, connections, and file URLs. Allow users to control how a workflow runs, making your workflows more reusable. Learn to import values and deliver the best user experience for your workflows while enhancing accuracy.
- Optimization Strategies in FME Flow: Explore the creation and strategic deployment of parameters in FME Flow, including the use of deployment and geometry parameters, to maximize workflow efficiency.
- Pro Tips for Success: Gain insights on parameterizing connections and leveraging new features like Conditional Visibility for clarity and simplicity.
We’ll wrap up with a glimpse into future webinars, followed by a Q&A session to address your specific questions surrounding this topic.
Don’t miss this opportunity to elevate your FME expertise and drive your projects to new heights of efficiency.
Epistemic Interaction - tuning interfaces to provide information for AI supportAlan Dix
Paper presented at SYNERGY workshop at AVI 2024, Genoa, Italy. 3rd June 2024
https://alandix.com/academic/papers/synergy2024-epistemic/
As machine learning integrates deeper into human-computer interactions, the concept of epistemic interaction emerges, aiming to refine these interactions to enhance system adaptability. This approach encourages minor, intentional adjustments in user behaviour to enrich the data available for system learning. This paper introduces epistemic interaction within the context of human-system communication, illustrating how deliberate interaction design can improve system understanding and adaptation. Through concrete examples, we demonstrate the potential of epistemic interaction to significantly advance human-computer interaction by leveraging intuitive human communication strategies to inform system design and functionality, offering a novel pathway for enriching user-system engagements.
GraphRAG is All You need? LLM & Knowledge GraphGuy Korland
Guy Korland, CEO and Co-founder of FalkorDB, will review two articles on the integration of language models with knowledge graphs.
1. Unifying Large Language Models and Knowledge Graphs: A Roadmap.
https://arxiv.org/abs/2306.08302
2. Microsoft Research's GraphRAG paper and a review paper on various uses of knowledge graphs:
https://www.microsoft.com/en-us/research/blog/graphrag-unlocking-llm-discovery-on-narrative-private-data/
Neuro-symbolic is not enough, we need neuro-*semantic*Frank van Harmelen
Neuro-symbolic (NeSy) AI is on the rise. However, simply machine learning on just any symbolic structure is not sufficient to really harvest the gains of NeSy. These will only be gained when the symbolic structures have an actual semantics. I give an operational definition of semantics as “predictable inference”.
All of this illustrated with link prediction over knowledge graphs, but the argument is general.
Kubernetes & AI - Beauty and the Beast !?! @KCD Istanbul 2024Tobias Schneck
As AI technology is pushing into IT I was wondering myself, as an “infrastructure container kubernetes guy”, how get this fancy AI technology get managed from an infrastructure operational view? Is it possible to apply our lovely cloud native principals as well? What benefit’s both technologies could bring to each other?
Let me take this questions and provide you a short journey through existing deployment models and use cases for AI software. On practical examples, we discuss what cloud/on-premise strategy we may need for applying it to our own infrastructure to get it to work from an enterprise perspective. I want to give an overview about infrastructure requirements and technologies, what could be beneficial or limiting your AI use cases in an enterprise environment. An interactive Demo will give you some insides, what approaches I got already working for real.
"Impact of front-end architecture on development cost", Viktor TurskyiFwdays
I have heard many times that architecture is not important for the front-end. Also, many times I have seen how developers implement features on the front-end just following the standard rules for a framework and think that this is enough to successfully launch the project, and then the project fails. How to prevent this and what approach to choose? I have launched dozens of complex projects and during the talk we will analyze which approaches have worked for me and which have not.
Let's dive deeper into the world of ODC! Ricardo Alves (OutSystems) will join us to tell all about the new Data Fabric. After that, Sezen de Bruijn (OutSystems) will get into the details on how to best design a sturdy architecture within ODC.
UiPath Test Automation using UiPath Test Suite series, part 3DianaGray10
Welcome to UiPath Test Automation using UiPath Test Suite series part 3. In this session, we will cover desktop automation along with UI automation.
Topics covered:
UI automation Introduction,
UI automation Sample
Desktop automation flow
Pradeep Chinnala, Senior Consultant Automation Developer @WonderBotz and UiPath MVP
Deepak Rai, Automation Practice Lead, Boundaryless Group and UiPath MVP
PHP Frameworks: I want to break free (IPC Berlin 2024)Ralf Eggert
In this presentation, we examine the challenges and limitations of relying too heavily on PHP frameworks in web development. We discuss the history of PHP and its frameworks to understand how this dependence has evolved. The focus will be on providing concrete tips and strategies to reduce reliance on these frameworks, based on real-world examples and practical considerations. The goal is to equip developers with the skills and knowledge to create more flexible and future-proof web applications. We'll explore the importance of maintaining autonomy in a rapidly changing tech landscape and how to make informed decisions in PHP development.
This talk is aimed at encouraging a more independent approach to using PHP frameworks, moving towards a more flexible and future-proof approach to PHP development.
Smart TV Buyer Insights Survey 2024 by 91mobiles.pdf91mobiles
91mobiles recently conducted a Smart TV Buyer Insights Survey in which we asked over 3,000 respondents about the TV they own, aspects they look at on a new TV, and their TV buying preferences.
Builder.ai Founder Sachin Dev Duggal's Strategic Approach to Create an Innova...Ramesh Iyer
In today's fast-changing business world, Companies that adapt and embrace new ideas often need help to keep up with the competition. However, fostering a culture of innovation takes much work. It takes vision, leadership and willingness to take risks in the right proportion. Sachin Dev Duggal, co-founder of Builder.ai, has perfected the art of this balance, creating a company culture where creativity and growth are nurtured at each stage.
2. 2
Q2 2017
% Change
Reported
LFL is constant currencies and pro forma for TDC Sweden
% Change
LFL
Mobile end-user
service revenue
EBITDA
Net sales
SEK billion
6. 3,018 3,095
4,029
3,877 3,900
4,332
3,932 3,921
Q2 16 Q3 16 Q4 16 Q1 17 Q2 17
TDC
Net sales, LFL
(SEK million)
Mobile end-user service
revenue, LFL (SEK million)
Q2 Highlights
EBITDA and EBITDA margin,
LFL (SEK million)
6
1,778
1,885 1,928
1,865 1,969 1,959 1,922 1,930
Q2 16 Q3 16 Q4 16 Q1 17 Q2 17
846
1,068 1,028
927
1,191
1,045 1,091 1,040
24%
31%
24%
28% 27%
0%
5%
10%
15%
20%
25%
30%
35%
40%
45%
50%
Q2 16 Q3 16 Q4 16 Q1 17 Q2 17
– Net sales growth driven by mobile, offset by declines in fixed segments
– Mobile end-user service revenue growth driven by consumer segment partly offset by declines in B2B Large
– EBITDA growth driven by higher service revenue, benefits from Challenger Program and TDC synergies
+1% +3% +12%
LFL is pro forma for TDC Sweden
7. 87% 85%83% 84%
Q2 16 Q2 17
Tele2 Comviq
Consumer mobile end-user
service revenue
Share of sales with bundle
>3GB
Q2 Highlights
Customer satisfaction
(Tele2 Media & Insight)
7
– New Tele2 campaign and product portfolio launched in April with early positive consumer response
– Consumer mobile end-user service revenue up 8% (5% excl. Q2 16 non-recurring item) driven by continued success of Comviq postpaid
– Continued strong demand for more data across both brands, with 66% of customers opting for more than 3GB
– Customer satisfaction stable at high levels for both brands
60%
66%
Q2 16 Q2 17Q2 16 Q2 17
+8%
8. Q2 16 Q2 17 Q2 16 Q2 17
B2B net sales, LFL
(SEK million)
B2B Large net sales, LFL
(SEK million)
Q2 Highlights
YTD integration synergies
8
– Net sales down slightly due to increased price competition in Large Enterprise, partly offset by growth in SME
– TDC integration and synergies ahead of plan, with SEK 53m achieved in the quarter, mainly from MVNO migration
– Significant contract wins in Q2 included three municipalities in the Skåne region, WSP Sverige AB and Postnord Sverige AB
LFL is pro forma for TDC Sweden
-1% -2%
9. Q2 Highlights
9
Net sales
(SEK million)
EBITDA and EBITDA margin
(SEK million)
Mobile end-user service
revenue (SEK million)
477
521 533 522
564
Q2 16 Q3 16 Q4 16 Q1 17 Q2 17
0
100
200
300
400
500
600
256
287
264
286
314
33% 32%
28%
33% 33%
0%
10%
20%
30%
40%
50%
60%
Q2 16 Q3 16 Q4 16 Q1 17 Q2 17
0
50
100
150
200
250
300
350
787
884 935
859
949
Q2 16 Q3 16 Q4 16 Q1 17 Q2 17
0
100
200
300
400
500
600
700
800
900
1,000
– Net sales growth driven by increase in both mobile end-user service revenue and equipment sales
– Mobile end-user service revenue growth accelerated due to data monetization, growth in mobile broadband and FX benefits
– Strong EBITDA performance driven by higher service revenue and Challenger Program benefits
+18% +23%+21%
10. 10
ASPU development Share of 4G capable
smartphones in base
Q2 Highlights
MBB end-user service revenue
– Strong ASPU growth driven by continued prepaid to postpaid migration and larger buckets
– Strong increase in smartphone penetration, with room for further growth
– Rapid mobile broadband growth on the back of investments in previous quarters
Q2 16 Q2 17
28%
41%
Q2 16 Q2 17 Q2 16 Q2 17
+13% +51%
11.
12. Q2 Highlights
– Net sales increase driven by higher mobile service revenue, offset by lower equipment sales and lower fixed revenue
– Mobile end-user service revenue growth driven by 19% increase in customer base, ASPU growth of 21% and FX benefits
– EBITDA positively impacted by higher mobile service revenue and lower expansion costs
– Fixed broadband EBITDA negatively affected by a SEK 64m provision related to a legal dispute regarding historical copper line rental fees
12
Net sales
(SEK million)
EBITDA
(SEK million)
Mobile end-user service
revenue (SEK million)
336
419 438 451
509
Q2 16 Q3 16 Q4 16 Q1 17 Q2 17
0
100
200
300
400
500
600
-116
-2
-23
151
18
Q2 16 Q3 16 Q4 16 Q1 17 Q2 17
-150
-100
-50
0
50
100
150
200
1,452 1,478
1,583 1,577 1,489
Q2 16 Q3 16 Q4 16 Q1 17 Q2 17
0
200
400
600
800
1,000
1,200
1,400
1,600
1,800
+51%+3% +134m
13. Spontaneous brand awareness
& brand consideration (Memo2)
Share of total new postpaid
(GfK)
Usage on own network
Q2 Highlights
– New campaign and new propositions launched on May 17th contributed to strong mobile intake of 51k and a doubling of SIM only intake share
– Unlimited proposition has ~70k subscribers within six weeks of launch
– Data on-loading at 91% and voice on-loading at 50% with ~500k active VoLTE customers
– Network rollout continued now at 99.6% outdoor and 91.7% indoor population coverage
13
41% 40%
49%
52%
Q2 16 Q2 17
Awareness Consideration
0%
50%
67%
91%
June 16 June 17
Voice Data
27% 28%
10%
15%
May 16 May 17
Handset SIM only
14. 44
79
92
122
160
8%
14% 13%
19%
22%
0%
5%
10%
15%
20%
25%
30%
35%
40%
45%
50%
Q2 16 Q3 16 Q4 16 Q1 17 Q2 17-30
20
70
120
170
220
– Continuing strong momentum as JV executes on its integration and go-to-market strategies
– Mobile end-user service revenue growth driven by increased customer base to 6.7m customers, higher ASPU bundles and FX benefits
– EBITDA margin expanded to over 22% as revenue growth drove scale benefits alongside integration synergies
14
Q2 Highlights
Net sales
(SEK million)
EBITDA and EBITDA margin
(SEK million)
Mobile end-user service
revenue (SEK million)
394 426
470 495
547
Q2 16 Q3 16 Q4 16 Q1 17 Q2 17
0
100
200
300
400
500
600
527
573
702
649
713
Q2 16 Q3 16 Q4 16 Q1 17 Q2 17
0
100
200
300
400
500
600
700
800
+35% +39% +264%
15. 6,402 6,753
Q2 16 Q2 17
ASPU development Integration
Q2 Highlights
15
Customer base
(thousands)
– Dual brand strategy driving customer growth
– Altel brand re-launched in April to strengthen its premium position in the market
– Larger data buckets are driving data monetization
– Network integration accelerated, with a further 800 base stations merged
Q2 16 Q2 17
+16%+5%
16. 16
Key progress areas since inception
Sales & marketing efficiency
Network & IT consolidation
Procurement scope increase
Customer service optimization
Administration efficiency
New revenue streams
Simplify
% of products harmonized
on shared platforms
Discipline
% of spend strategically
sourced & procured
Consolidate
% of reduction in IT OpEx
as share of revenue
Transform
% of staff in
Shared Operations
2016 actual 2018 targetBaseline
23. Economic net debt to EBITDA 12 m rolling
23 Economic net debt excludes debt and earn out liabilities related to Kazakhstan
1,88
LeverageSEK billion
11.7
11.0 10.4 10.3
12.0
0.0
0.5
1.0
1.5
2.0
2.5
0.0
2.5
5.0
7.5
10.0
12.5
Jun 2016 Sep 2016 Dec 2016 Mar 2017 Jun 2017
Economic net debt Economic net debt to EBITDA
1.91
24. * Based on LFL which is constant currencies and pro forma for Altel and TDC Sweden24
Net sales
(SEK billion)
EBITDA
(SEK billion)
CAPEX
(SEK billion)
Mobile end-user
service revenue