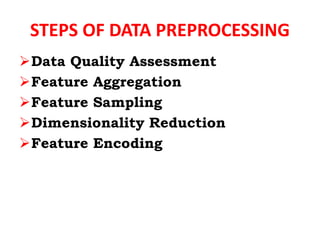
SlideShare a Scribd company logo
Data Preprocessing : Concepts
 Data is truly considered a resource in
today’s world.
 As per the World Economic Forum, by 2025
we will be generating about 463 exabytes of
data globally per day!
 But is all this data fit enough to be used by
machine learning algorithms?
 How do we decide that?
 Data preprocessing — transforming the
data such that it becomes machine-
readable…
What is Data Preprocessing?
 Usually think of some large datasets with
huge number of rows and columns. While
that is a likely scenario, it is not always
the case
 Data could be in so many different
forms: Structured Tables, Images, Audio
files, Videos etc..
 Machines don’t understand free text,
image or video data as it is, they
understand 1s and0s.
What is Data Preprocessing?
 In any Machine Learning process, Data
Preprocessing is that step in which the
data gets transformed, or Encoded, to
bring it to such a state that now the
machine can easily parse it.
 In other words, the features of the data
can now be easily interpreted by the
algorithm.
Features in Machine Learning
 A dataset can be viewed as a collection of
data objects, which are often also called as a
records, points, vectors, patterns, events,
cases, samples, observations, or entities.
 Data objects are described by a number of
features, that capture the basic
characteristics of an object, such as the mass
of a physical object or the time at which an
event occurred, etc.. Features are often
called as variables, characteristics, fields,
attributes, or dimensions.
Features in Machine Learning
 A dataset can be viewed as a collection of data
objects, which are often also called as a records,
points, vectors, patterns, events, cases,
samples, observations, or entities.
 Data objects are described by a number of
features, that capture the basic characteristics
of an object, such as the mass of a physical
object or the time at which an event occurred,
etc.. Features are often called as variables,
characteristics, fields, attributes, or
dimensions.
 A feature is an individual measurable property
or characteristic of a phenomenon being
observed
Statistical Data Types
 Categorical : Features whose values are taken
from a defined set of values.
 For instance, days in a week : {Monday,
Tuesday, Wednesday, Thursday, Friday,
Saturday, Sunday} is a category because its
value is always taken from this set.
 Another example could be the Boolean set :
{True, False}
Statistical Data Types
 Numerical : Features whose values are
continuous or integer-valued.
 They are represented by numbers and possess
most of the properties of numbers.
 For instance, number of steps you walk in a
day, or the speed at which you are driving your
car at.
Statistical Data Types
STEPS OF DATA PREPROCESSING
Data Quality Assessment
Feature Aggregation
Feature Sampling
Dimensionality Reduction
Feature Encoding
STEPS OF DATA PREPROCESSING
 Data Quality Assessment: Because data is often
taken from multiple sources which are normally not
too reliable and that too in different formats, more
than half our time is consumed in dealing with data
quality issues when working on a machine learning
problem.
 It is simply unrealistic to expect that the data will
be perfect.
 There may be problems due to human error,
limitations of measuring devices, or flaws in the
data collection process.
 Let’s go over a few of them and methods to deal
with them :
MISSING VALUES
 It is very much usual to have missing values in your dataset.
It may have happened during data collection, or maybe due
to some data validation rule, but regardless missing values
must be taken into consideration.
 Eliminate rows with missing data : Simple and sometimes
effective strategy. Fails if many objects have missing values.
If a feature has mostly missing values, then that feature
itself can also be eliminated.
 Estimate missing values : If only a reasonable percentage of
values are missing, then we can also run simple
interpolation methods to fill in those values.
 However, most common method of dealing with missing
values is by filling them in with the mean, median or mode
value of the respective feature.
INCONSISTENT VALUES
 We know that data can contain inconsistent values.
Most probably we have already faced this issue at
some point.
 For instance, the ‘Address’ field contains the ‘Phone
number’.
 It may be due to human error or maybe the
information was misread while being scanned from a
handwritten form.
 It is therefore always advised to perform data
assessment like knowing what the data type of the
features should be and whether it is the same for all
the data objects.
DUPLICATE VALUES
 A dataset may include data objects which are
duplicates of one another.
 It may happen when say the same person submits a
form more than once.
 The term de duplication is often used to refer to the
process of dealing with duplicates.
 In most cases, the duplicates are removed so as to
not give that particular data object an advantage or
bias, when running machine learning algorithms.
FEATURE AGGREGATION
 Feature Aggregations are performed so as to take
the aggregated values in order to put the data in a
better perspective.
 Think of transactional data, suppose we have day-
to-day transactions of a product from recording the
daily sales of that product in various store
locations over the year.
 Aggregating the transactions to single store-wide
monthly or yearly transactions will help us
reducing hundreds or potentially thousands of
transactions that occur daily at a specific store,
thereby reducing the number of data objects.
 This results in reduction of memory consumption
and processing time Aggregations provide us with a
high-level view of the data as the behavior of
groups or aggregates is more stable than individual
data objects
FEATURE SAMPLING
 Sampling is a very common method for
selecting a subset of the dataset that we are
analyzing.
 In most cases, working with the complete
dataset can turn out to be too expensive
considering the memory and time
constraints.
 Using a sampling algorithm can help us
reduce the size of the dataset to a point
where we can use a better, but more
expensive, machine learning algorithm.
FEATURE SAMPLING
The key principle here is that the sampling should be
done in such a manner that the sample generated
should have approximately the same properties as the
original dataset, meaning that the sample is
representative. This involves choosing the correct
sample size and sampling strategy. Simple Random
Sampling dictates that there is an equal probability of
selecting any particular entity. It has two main
variations as well :
Sampling without Replacement : As each item is
selected, it is removed from the set of all the objects
that form the total dataset.
Sampling with Replacement : Items are not removed
from the total dataset after getting selected. This
means they can get selected more than once.
 Fail to output a representative sample when the
dataset includes object types which vary
drastically in ratio.
 This can cause problems when the sample needs
to have a proper representation of all object types,
for example, when we have an imbalanced dataset.
 It is critical that the rarer classes be adequately
represented in the sample.
 In these cases, there is another sampling
technique which we can use, called Stratified
Sampling, which begins with predefined groups of
objects.
 There are different versions of Stratified Sampling
too, with the simplest version suggesting equal
number of objects be drawn from all the groups
even though the groups are of different sizes. For
more on sampling check out this article by Team
AV.
 Most real world datasets have a large number of
features.
 For example, consider an image processing
problem, we might have to deal with thousands
of features, also called as dimensions.
 As the name suggests, dimensionality reduction
aims to reduce the number of features - but not
simply by selecting a sample of features from the
feature-set, which is something else — Feature
Subset Selection or simply Feature Selection.
 Conceptually, dimension refers to the number of
geometric planes the dataset lies in, which could
be high so much so that it cannot be visualized
with pen and paper.
 More the number of such planes, more is the
complexity of the dataset.
THE CURSE OF DIMENSIONALITY
 This refers to the phenomena that generally data
analysis tasks become significantly harder as the
dimensionality of the data increases.
 As the dimensionality increases, the number
planes occupied by the data increases thus adding
more and more sparsity to the data which is
difficult to model and visualize.
 What dimension reduction essentially does is that
it maps the dataset to a lower-dimensional space,
which may very well be to a number of planes
which can now be visualized, say 2D.
THE CURSE OF DIMENSIONALITY
 The basic objective of techniques which are used
for this purpose is tor educe the dimensionality of
a dataset by creating new features which are a
combination of the old features.
 In other words, the higher-dimensional feature-
space is mapped to a lower-dimensional feature-
space.
 Principal Component Analysis and Singular Value
Decomposition are two widely accepted
techniques.
THE CURSE OF DIMENSIONALITY
 A few major benefits of dimensionality reduction
are :
 Data Analysis algorithms work better if the
dimensionality of the dataset is lower.
 This is mainly because irrelevant features and
noise have now been eliminated.
 The models which are built on top of lower
dimensional data are more understandable and
explainable.
 The data may now also get easier to visualize!
Features can always be taken in pairs or triplets
for visualization purposes, which makes more
sense if the feature set is not that big.
FEATURE ENCODING
 As mentioned before, the whole purpose of data
preprocessing is to encode the data in order to
bring it to such a state that the machine now
understands it.
 Feature encoding is basically performing
transformations on the data such that it can be
easily accepted as input for machine learning
algorithms while still retaining its original
meaning.
 There are some general norms or rules which are
followed when performing feature encoding.
FEATURE ENCODING
 For Continuous variables :
 Nominal : Any one-to-one mapping can be done
which retains the meaning. For instance, a
permutation of values like in One-Hot Encoding.
 Ordinal : An order-preserving change of values.
The notion of small, medium and large can be
represented equally well with the help of a new
function, that is,<new_value = f(old_value)> -
 For example, {0, 1, 2} or maybe {1, 2, 3}.
For Numeric variables:
 Interval : Simple mathematical transformation
like using the equation <new_value= a*old_value +
b>, a and b being constants. For example,
Fahrenheit and Celsius scales, which differ in
their Zero values size of a unit, can be encoded in
this manner.
 Ratio : These variables can be scaled to any
particular measures, of course while still
maintaining the meaning and ratio of their
values. Simple mathematical transformations
work in this case as well, like the transformation
<new_value =a*old_value>. For, length can be
measured in meters or feet, money can be taken
indifferent currencies.
FEATURE ENCODING
TRAIN / VALIDATION / TEST SPLIT
 After feature encoding is done, our dataset is
ready for the exciting machine learning
algorithms!
 But before we start deciding the algorithm which
should be used, it is always advised to split the
dataset into 2 or sometimes 3 parts. algorithm for
that matter, has to be first trained on the data
distribution available and then validated and
tested, before it can be deployed to deal with real-
world data.
TRAIN / VALIDATION / TEST SPLIT
 Training data : This is the part on which your
machine learning algorithms are actually trained
to build a model.
 The model tries to learn the dataset and its
various characteristics and intricacies, which also
raises the issue of Over fitting v/s Under fitting.
 Validation data : This is the part of the dataset
which is used to validate our various model fits.
 In simpler words, we use validation data to
choose and improve our model hyper parameters.
 The model does not learn the validation set but
uses it to get to a better state of hyper
parameters.
 Test data : This part of the dataset is used to test
our model hypothesis.
 It is left untouched and unseen until the model
and hyper parameters are decided, and only after
that the model is applied on the test data to get
an accurate measure of how it would perform
when deployed on real-world data.
TRAIN / VALIDATION / TEST SPLIT
 Split Ratio : Data is split as per a split ratio which
is highly dependent on the type of model we are
building and the dataset itself.
 If our dataset and model are such that a lot of
training is required, then we use a larger chunk of
the data just for training purposes(usually the
case) — For instance, training on textual data,
image data, or video data usually involves
thousands of features!
 If the model has a lot of hyper parameters that can
be tuned, then keeping a higher percentage of data
for the validation set is advisable.
TRAIN / VALIDATION / TEST SPLIT
 Models with less number of hyper parameters are
easy to tune and update, and so we can keep a
smaller validation set.
 Like many other things in Machine Learning, the
split ratio is highly dependent on the problem we
are trying to solve and must be decided after
taking into account all the various details about
the model and the dataset in hand.
TRAIN / VALIDATION / TEST SPLIT
Machine Learning algorithms, or any12/29/2020 Data
Preprocessing : Concepts. Introduction to the concepts
of Data… | by Pranjal Pandey | Towards Data
Sciencehttps://towardsdatascience.com/data-
preprocessing-concepts-fa946d11c825 12/14

More Related Content

Similar to Data .pptx

Lecture-1-Introduction to Deep learning.pptx
Lecture-1-Introduction to Deep learning.pptxLecture-1-Introduction to Deep learning.pptx
Lecture-1-Introduction to Deep learning.pptx
JayChauhan100
 
Data Processing & Explain each term in details.pptx
Data Processing & Explain each term in details.pptxData Processing & Explain each term in details.pptx
Data Processing & Explain each term in details.pptx
PratikshaSurve4
 
Data Reduction
Data ReductionData Reduction
Data Reduction
Rajan Shah
 
Top 30 Data Analyst Interview Questions.pdf
Top 30 Data Analyst Interview Questions.pdfTop 30 Data Analyst Interview Questions.pdf
Top 30 Data Analyst Interview Questions.pdf
ShaikSikindar1
 
End-to-End Machine Learning Project
End-to-End Machine Learning ProjectEnd-to-End Machine Learning Project
End-to-End Machine Learning Project
Eng Teong Cheah
 
ETL QA
ETL QAETL QA
ETL QA
dillip kar
 
Exploratory Data Analysis - Satyajit.pdf
Exploratory Data Analysis - Satyajit.pdfExploratory Data Analysis - Satyajit.pdf
Exploratory Data Analysis - Satyajit.pdf
AmmarAhmedSiddiqui2
 
Lesson 1 - Overview of Machine Learning and Data Analysis.pptx
Lesson 1 - Overview of Machine Learning and Data Analysis.pptxLesson 1 - Overview of Machine Learning and Data Analysis.pptx
Lesson 1 - Overview of Machine Learning and Data Analysis.pptx
cloudserviceuit
 
Business analyst
Business analystBusiness analyst
Business analyst
Hemanth Kumar
 
Knowledge discovery claudiad amato
Knowledge discovery claudiad amatoKnowledge discovery claudiad amato
Knowledge discovery claudiad amato
SSSW
 
Analysis using r
Analysis using rAnalysis using r
Analysis using r
Priya Mohan
 
Data preprocessing
Data preprocessingData preprocessing
Data preprocessing
suganmca14
 
Dimensional Modeling
Dimensional ModelingDimensional Modeling
Dimensional Modeling
Sunita Sahu
 
Tutorial Knowledge Discovery
Tutorial Knowledge DiscoveryTutorial Knowledge Discovery
Tutorial Knowledge Discovery
SSSW
 
Unit II.pdf
Unit II.pdfUnit II.pdf
Unit II.pdf
KennyPratheepKumar
 
BigData Analytics_1.7
BigData Analytics_1.7BigData Analytics_1.7
BigData Analytics_1.7
Rohit Mittal
 
Machine learning module 2
Machine learning module 2Machine learning module 2
Machine learning module 2
Gokulks007
 
Metopen 6
Metopen 6Metopen 6
Metopen 6
Ali Murfi
 
Alteryx Tableau Integration | Clean Your Data Faster for Tableau with Alteryx
Alteryx Tableau Integration | Clean Your Data Faster for Tableau with AlteryxAlteryx Tableau Integration | Clean Your Data Faster for Tableau with Alteryx
Alteryx Tableau Integration | Clean Your Data Faster for Tableau with Alteryx
( BPM Northwest ) Business Performance Management
 
Data mining and data warehouse lab manual updated
Data mining and data warehouse lab manual updatedData mining and data warehouse lab manual updated
Data mining and data warehouse lab manual updated
Yugal Kumar
 

Similar to Data .pptx (20)

Lecture-1-Introduction to Deep learning.pptx
Lecture-1-Introduction to Deep learning.pptxLecture-1-Introduction to Deep learning.pptx
Lecture-1-Introduction to Deep learning.pptx
 
Data Processing & Explain each term in details.pptx
Data Processing & Explain each term in details.pptxData Processing & Explain each term in details.pptx
Data Processing & Explain each term in details.pptx
 
Data Reduction
Data ReductionData Reduction
Data Reduction
 
Top 30 Data Analyst Interview Questions.pdf
Top 30 Data Analyst Interview Questions.pdfTop 30 Data Analyst Interview Questions.pdf
Top 30 Data Analyst Interview Questions.pdf
 
End-to-End Machine Learning Project
End-to-End Machine Learning ProjectEnd-to-End Machine Learning Project
End-to-End Machine Learning Project
 
ETL QA
ETL QAETL QA
ETL QA
 
Exploratory Data Analysis - Satyajit.pdf
Exploratory Data Analysis - Satyajit.pdfExploratory Data Analysis - Satyajit.pdf
Exploratory Data Analysis - Satyajit.pdf
 
Lesson 1 - Overview of Machine Learning and Data Analysis.pptx
Lesson 1 - Overview of Machine Learning and Data Analysis.pptxLesson 1 - Overview of Machine Learning and Data Analysis.pptx
Lesson 1 - Overview of Machine Learning and Data Analysis.pptx
 
Business analyst
Business analystBusiness analyst
Business analyst
 
Knowledge discovery claudiad amato
Knowledge discovery claudiad amatoKnowledge discovery claudiad amato
Knowledge discovery claudiad amato
 
Analysis using r
Analysis using rAnalysis using r
Analysis using r
 
Data preprocessing
Data preprocessingData preprocessing
Data preprocessing
 
Dimensional Modeling
Dimensional ModelingDimensional Modeling
Dimensional Modeling
 
Tutorial Knowledge Discovery
Tutorial Knowledge DiscoveryTutorial Knowledge Discovery
Tutorial Knowledge Discovery
 
Unit II.pdf
Unit II.pdfUnit II.pdf
Unit II.pdf
 
BigData Analytics_1.7
BigData Analytics_1.7BigData Analytics_1.7
BigData Analytics_1.7
 
Machine learning module 2
Machine learning module 2Machine learning module 2
Machine learning module 2
 
Metopen 6
Metopen 6Metopen 6
Metopen 6
 
Alteryx Tableau Integration | Clean Your Data Faster for Tableau with Alteryx
Alteryx Tableau Integration | Clean Your Data Faster for Tableau with AlteryxAlteryx Tableau Integration | Clean Your Data Faster for Tableau with Alteryx
Alteryx Tableau Integration | Clean Your Data Faster for Tableau with Alteryx
 
Data mining and data warehouse lab manual updated
Data mining and data warehouse lab manual updatedData mining and data warehouse lab manual updated
Data mining and data warehouse lab manual updated
 

Recently uploaded

An Introduction to the Compiler Designss
An Introduction to the Compiler DesignssAn Introduction to the Compiler Designss
An Introduction to the Compiler Designss
ElakkiaU
 
Null Bangalore | Pentesters Approach to AWS IAM
Null Bangalore | Pentesters Approach to AWS IAMNull Bangalore | Pentesters Approach to AWS IAM
Null Bangalore | Pentesters Approach to AWS IAM
Divyanshu
 
Data Driven Maintenance | UReason Webinar
Data Driven Maintenance | UReason WebinarData Driven Maintenance | UReason Webinar
Data Driven Maintenance | UReason Webinar
UReason
 
SCALING OF MOS CIRCUITS m .pptx
SCALING OF MOS CIRCUITS m                 .pptxSCALING OF MOS CIRCUITS m                 .pptx
SCALING OF MOS CIRCUITS m .pptx
harshapolam10
 
一比一原版(osu毕业证书)美国俄勒冈州立大学毕业证如何办理
一比一原版(osu毕业证书)美国俄勒冈州立大学毕业证如何办理一比一原版(osu毕业证书)美国俄勒冈州立大学毕业证如何办理
一比一原版(osu毕业证书)美国俄勒冈州立大学毕业证如何办理
upoux
 
Mechanical Engineering on AAI Summer Training Report-003.pdf
Mechanical Engineering on AAI Summer Training Report-003.pdfMechanical Engineering on AAI Summer Training Report-003.pdf
Mechanical Engineering on AAI Summer Training Report-003.pdf
21UME003TUSHARDEB
 
AI for Legal Research with applications, tools
AI for Legal Research with applications, toolsAI for Legal Research with applications, tools
AI for Legal Research with applications, tools
mahaffeycheryld
 
IEEE Aerospace and Electronic Systems Society as a Graduate Student Member
IEEE Aerospace and Electronic Systems Society as a Graduate Student MemberIEEE Aerospace and Electronic Systems Society as a Graduate Student Member
IEEE Aerospace and Electronic Systems Society as a Graduate Student Member
VICTOR MAESTRE RAMIREZ
 
2008 BUILDING CONSTRUCTION Illustrated - Ching Chapter 08 Doors and Windows.pdf
2008 BUILDING CONSTRUCTION Illustrated - Ching Chapter 08 Doors and Windows.pdf2008 BUILDING CONSTRUCTION Illustrated - Ching Chapter 08 Doors and Windows.pdf
2008 BUILDING CONSTRUCTION Illustrated - Ching Chapter 08 Doors and Windows.pdf
Yasser Mahgoub
 
TIME TABLE MANAGEMENT SYSTEM testing.pptx
TIME TABLE MANAGEMENT SYSTEM testing.pptxTIME TABLE MANAGEMENT SYSTEM testing.pptx
TIME TABLE MANAGEMENT SYSTEM testing.pptx
CVCSOfficial
 
Optimizing Gradle Builds - Gradle DPE Tour Berlin 2024
Optimizing Gradle Builds - Gradle DPE Tour Berlin 2024Optimizing Gradle Builds - Gradle DPE Tour Berlin 2024
Optimizing Gradle Builds - Gradle DPE Tour Berlin 2024
Sinan KOZAK
 
CEC 352 - SATELLITE COMMUNICATION UNIT 1
CEC 352 - SATELLITE COMMUNICATION UNIT 1CEC 352 - SATELLITE COMMUNICATION UNIT 1
CEC 352 - SATELLITE COMMUNICATION UNIT 1
PKavitha10
 
Advanced control scheme of doubly fed induction generator for wind turbine us...
Advanced control scheme of doubly fed induction generator for wind turbine us...Advanced control scheme of doubly fed induction generator for wind turbine us...
Advanced control scheme of doubly fed induction generator for wind turbine us...
IJECEIAES
 
CompEx~Manual~1210 (2).pdf COMPEX GAS AND VAPOURS
CompEx~Manual~1210 (2).pdf COMPEX GAS AND VAPOURSCompEx~Manual~1210 (2).pdf COMPEX GAS AND VAPOURS
CompEx~Manual~1210 (2).pdf COMPEX GAS AND VAPOURS
RamonNovais6
 
Computational Engineering IITH Presentation
Computational Engineering IITH PresentationComputational Engineering IITH Presentation
Computational Engineering IITH Presentation
co23btech11018
 
Redefining brain tumor segmentation: a cutting-edge convolutional neural netw...
Redefining brain tumor segmentation: a cutting-edge convolutional neural netw...Redefining brain tumor segmentation: a cutting-edge convolutional neural netw...
Redefining brain tumor segmentation: a cutting-edge convolutional neural netw...
IJECEIAES
 
2008 BUILDING CONSTRUCTION Illustrated - Ching Chapter 02 The Building.pdf
2008 BUILDING CONSTRUCTION Illustrated - Ching Chapter 02 The Building.pdf2008 BUILDING CONSTRUCTION Illustrated - Ching Chapter 02 The Building.pdf
2008 BUILDING CONSTRUCTION Illustrated - Ching Chapter 02 The Building.pdf
Yasser Mahgoub
 
Prediction of Electrical Energy Efficiency Using Information on Consumer's Ac...
Prediction of Electrical Energy Efficiency Using Information on Consumer's Ac...Prediction of Electrical Energy Efficiency Using Information on Consumer's Ac...
Prediction of Electrical Energy Efficiency Using Information on Consumer's Ac...
PriyankaKilaniya
 
132/33KV substation case study Presentation
132/33KV substation case study Presentation132/33KV substation case study Presentation
132/33KV substation case study Presentation
kandramariana6
 
一比一原版(uofo毕业证书)美国俄勒冈大学毕业证如何办理
一比一原版(uofo毕业证书)美国俄勒冈大学毕业证如何办理一比一原版(uofo毕业证书)美国俄勒冈大学毕业证如何办理
一比一原版(uofo毕业证书)美国俄勒冈大学毕业证如何办理
upoux
 

Recently uploaded (20)

An Introduction to the Compiler Designss
An Introduction to the Compiler DesignssAn Introduction to the Compiler Designss
An Introduction to the Compiler Designss
 
Null Bangalore | Pentesters Approach to AWS IAM
Null Bangalore | Pentesters Approach to AWS IAMNull Bangalore | Pentesters Approach to AWS IAM
Null Bangalore | Pentesters Approach to AWS IAM
 
Data Driven Maintenance | UReason Webinar
Data Driven Maintenance | UReason WebinarData Driven Maintenance | UReason Webinar
Data Driven Maintenance | UReason Webinar
 
SCALING OF MOS CIRCUITS m .pptx
SCALING OF MOS CIRCUITS m                 .pptxSCALING OF MOS CIRCUITS m                 .pptx
SCALING OF MOS CIRCUITS m .pptx
 
一比一原版(osu毕业证书)美国俄勒冈州立大学毕业证如何办理
一比一原版(osu毕业证书)美国俄勒冈州立大学毕业证如何办理一比一原版(osu毕业证书)美国俄勒冈州立大学毕业证如何办理
一比一原版(osu毕业证书)美国俄勒冈州立大学毕业证如何办理
 
Mechanical Engineering on AAI Summer Training Report-003.pdf
Mechanical Engineering on AAI Summer Training Report-003.pdfMechanical Engineering on AAI Summer Training Report-003.pdf
Mechanical Engineering on AAI Summer Training Report-003.pdf
 
AI for Legal Research with applications, tools
AI for Legal Research with applications, toolsAI for Legal Research with applications, tools
AI for Legal Research with applications, tools
 
IEEE Aerospace and Electronic Systems Society as a Graduate Student Member
IEEE Aerospace and Electronic Systems Society as a Graduate Student MemberIEEE Aerospace and Electronic Systems Society as a Graduate Student Member
IEEE Aerospace and Electronic Systems Society as a Graduate Student Member
 
2008 BUILDING CONSTRUCTION Illustrated - Ching Chapter 08 Doors and Windows.pdf
2008 BUILDING CONSTRUCTION Illustrated - Ching Chapter 08 Doors and Windows.pdf2008 BUILDING CONSTRUCTION Illustrated - Ching Chapter 08 Doors and Windows.pdf
2008 BUILDING CONSTRUCTION Illustrated - Ching Chapter 08 Doors and Windows.pdf
 
TIME TABLE MANAGEMENT SYSTEM testing.pptx
TIME TABLE MANAGEMENT SYSTEM testing.pptxTIME TABLE MANAGEMENT SYSTEM testing.pptx
TIME TABLE MANAGEMENT SYSTEM testing.pptx
 
Optimizing Gradle Builds - Gradle DPE Tour Berlin 2024
Optimizing Gradle Builds - Gradle DPE Tour Berlin 2024Optimizing Gradle Builds - Gradle DPE Tour Berlin 2024
Optimizing Gradle Builds - Gradle DPE Tour Berlin 2024
 
CEC 352 - SATELLITE COMMUNICATION UNIT 1
CEC 352 - SATELLITE COMMUNICATION UNIT 1CEC 352 - SATELLITE COMMUNICATION UNIT 1
CEC 352 - SATELLITE COMMUNICATION UNIT 1
 
Advanced control scheme of doubly fed induction generator for wind turbine us...
Advanced control scheme of doubly fed induction generator for wind turbine us...Advanced control scheme of doubly fed induction generator for wind turbine us...
Advanced control scheme of doubly fed induction generator for wind turbine us...
 
CompEx~Manual~1210 (2).pdf COMPEX GAS AND VAPOURS
CompEx~Manual~1210 (2).pdf COMPEX GAS AND VAPOURSCompEx~Manual~1210 (2).pdf COMPEX GAS AND VAPOURS
CompEx~Manual~1210 (2).pdf COMPEX GAS AND VAPOURS
 
Computational Engineering IITH Presentation
Computational Engineering IITH PresentationComputational Engineering IITH Presentation
Computational Engineering IITH Presentation
 
Redefining brain tumor segmentation: a cutting-edge convolutional neural netw...
Redefining brain tumor segmentation: a cutting-edge convolutional neural netw...Redefining brain tumor segmentation: a cutting-edge convolutional neural netw...
Redefining brain tumor segmentation: a cutting-edge convolutional neural netw...
 
2008 BUILDING CONSTRUCTION Illustrated - Ching Chapter 02 The Building.pdf
2008 BUILDING CONSTRUCTION Illustrated - Ching Chapter 02 The Building.pdf2008 BUILDING CONSTRUCTION Illustrated - Ching Chapter 02 The Building.pdf
2008 BUILDING CONSTRUCTION Illustrated - Ching Chapter 02 The Building.pdf
 
Prediction of Electrical Energy Efficiency Using Information on Consumer's Ac...
Prediction of Electrical Energy Efficiency Using Information on Consumer's Ac...Prediction of Electrical Energy Efficiency Using Information on Consumer's Ac...
Prediction of Electrical Energy Efficiency Using Information on Consumer's Ac...
 
132/33KV substation case study Presentation
132/33KV substation case study Presentation132/33KV substation case study Presentation
132/33KV substation case study Presentation
 
一比一原版(uofo毕业证书)美国俄勒冈大学毕业证如何办理
一比一原版(uofo毕业证书)美国俄勒冈大学毕业证如何办理一比一原版(uofo毕业证书)美国俄勒冈大学毕业证如何办理
一比一原版(uofo毕业证书)美国俄勒冈大学毕业证如何办理
 

Data .pptx

  • 1. Data Preprocessing : Concepts  Data is truly considered a resource in today’s world.  As per the World Economic Forum, by 2025 we will be generating about 463 exabytes of data globally per day!  But is all this data fit enough to be used by machine learning algorithms?  How do we decide that?  Data preprocessing — transforming the data such that it becomes machine- readable…
  • 2. What is Data Preprocessing?  Usually think of some large datasets with huge number of rows and columns. While that is a likely scenario, it is not always the case  Data could be in so many different forms: Structured Tables, Images, Audio files, Videos etc..  Machines don’t understand free text, image or video data as it is, they understand 1s and0s.
  • 3. What is Data Preprocessing?  In any Machine Learning process, Data Preprocessing is that step in which the data gets transformed, or Encoded, to bring it to such a state that now the machine can easily parse it.  In other words, the features of the data can now be easily interpreted by the algorithm.
  • 4. Features in Machine Learning  A dataset can be viewed as a collection of data objects, which are often also called as a records, points, vectors, patterns, events, cases, samples, observations, or entities.  Data objects are described by a number of features, that capture the basic characteristics of an object, such as the mass of a physical object or the time at which an event occurred, etc.. Features are often called as variables, characteristics, fields, attributes, or dimensions.
  • 5. Features in Machine Learning  A dataset can be viewed as a collection of data objects, which are often also called as a records, points, vectors, patterns, events, cases, samples, observations, or entities.  Data objects are described by a number of features, that capture the basic characteristics of an object, such as the mass of a physical object or the time at which an event occurred, etc.. Features are often called as variables, characteristics, fields, attributes, or dimensions.  A feature is an individual measurable property or characteristic of a phenomenon being observed
  • 7. Statistical Data Types  Categorical : Features whose values are taken from a defined set of values.  For instance, days in a week : {Monday, Tuesday, Wednesday, Thursday, Friday, Saturday, Sunday} is a category because its value is always taken from this set.  Another example could be the Boolean set : {True, False}
  • 8. Statistical Data Types  Numerical : Features whose values are continuous or integer-valued.  They are represented by numbers and possess most of the properties of numbers.  For instance, number of steps you walk in a day, or the speed at which you are driving your car at.
  • 10. STEPS OF DATA PREPROCESSING Data Quality Assessment Feature Aggregation Feature Sampling Dimensionality Reduction Feature Encoding
  • 11. STEPS OF DATA PREPROCESSING  Data Quality Assessment: Because data is often taken from multiple sources which are normally not too reliable and that too in different formats, more than half our time is consumed in dealing with data quality issues when working on a machine learning problem.  It is simply unrealistic to expect that the data will be perfect.  There may be problems due to human error, limitations of measuring devices, or flaws in the data collection process.  Let’s go over a few of them and methods to deal with them :
  • 12. MISSING VALUES  It is very much usual to have missing values in your dataset. It may have happened during data collection, or maybe due to some data validation rule, but regardless missing values must be taken into consideration.  Eliminate rows with missing data : Simple and sometimes effective strategy. Fails if many objects have missing values. If a feature has mostly missing values, then that feature itself can also be eliminated.  Estimate missing values : If only a reasonable percentage of values are missing, then we can also run simple interpolation methods to fill in those values.  However, most common method of dealing with missing values is by filling them in with the mean, median or mode value of the respective feature.
  • 13. INCONSISTENT VALUES  We know that data can contain inconsistent values. Most probably we have already faced this issue at some point.  For instance, the ‘Address’ field contains the ‘Phone number’.  It may be due to human error or maybe the information was misread while being scanned from a handwritten form.  It is therefore always advised to perform data assessment like knowing what the data type of the features should be and whether it is the same for all the data objects.
  • 14. DUPLICATE VALUES  A dataset may include data objects which are duplicates of one another.  It may happen when say the same person submits a form more than once.  The term de duplication is often used to refer to the process of dealing with duplicates.  In most cases, the duplicates are removed so as to not give that particular data object an advantage or bias, when running machine learning algorithms.
  • 15. FEATURE AGGREGATION  Feature Aggregations are performed so as to take the aggregated values in order to put the data in a better perspective.  Think of transactional data, suppose we have day- to-day transactions of a product from recording the daily sales of that product in various store locations over the year.  Aggregating the transactions to single store-wide monthly or yearly transactions will help us reducing hundreds or potentially thousands of transactions that occur daily at a specific store, thereby reducing the number of data objects.  This results in reduction of memory consumption and processing time Aggregations provide us with a high-level view of the data as the behavior of groups or aggregates is more stable than individual data objects
  • 16. FEATURE SAMPLING  Sampling is a very common method for selecting a subset of the dataset that we are analyzing.  In most cases, working with the complete dataset can turn out to be too expensive considering the memory and time constraints.  Using a sampling algorithm can help us reduce the size of the dataset to a point where we can use a better, but more expensive, machine learning algorithm.
  • 17. FEATURE SAMPLING The key principle here is that the sampling should be done in such a manner that the sample generated should have approximately the same properties as the original dataset, meaning that the sample is representative. This involves choosing the correct sample size and sampling strategy. Simple Random Sampling dictates that there is an equal probability of selecting any particular entity. It has two main variations as well : Sampling without Replacement : As each item is selected, it is removed from the set of all the objects that form the total dataset. Sampling with Replacement : Items are not removed from the total dataset after getting selected. This means they can get selected more than once.
  • 18.  Fail to output a representative sample when the dataset includes object types which vary drastically in ratio.  This can cause problems when the sample needs to have a proper representation of all object types, for example, when we have an imbalanced dataset.  It is critical that the rarer classes be adequately represented in the sample.  In these cases, there is another sampling technique which we can use, called Stratified Sampling, which begins with predefined groups of objects.  There are different versions of Stratified Sampling too, with the simplest version suggesting equal number of objects be drawn from all the groups even though the groups are of different sizes. For more on sampling check out this article by Team AV.
  • 19.  Most real world datasets have a large number of features.  For example, consider an image processing problem, we might have to deal with thousands of features, also called as dimensions.  As the name suggests, dimensionality reduction aims to reduce the number of features - but not simply by selecting a sample of features from the feature-set, which is something else — Feature Subset Selection or simply Feature Selection.  Conceptually, dimension refers to the number of geometric planes the dataset lies in, which could be high so much so that it cannot be visualized with pen and paper.  More the number of such planes, more is the complexity of the dataset.
  • 20. THE CURSE OF DIMENSIONALITY  This refers to the phenomena that generally data analysis tasks become significantly harder as the dimensionality of the data increases.  As the dimensionality increases, the number planes occupied by the data increases thus adding more and more sparsity to the data which is difficult to model and visualize.  What dimension reduction essentially does is that it maps the dataset to a lower-dimensional space, which may very well be to a number of planes which can now be visualized, say 2D.
  • 21. THE CURSE OF DIMENSIONALITY  The basic objective of techniques which are used for this purpose is tor educe the dimensionality of a dataset by creating new features which are a combination of the old features.  In other words, the higher-dimensional feature- space is mapped to a lower-dimensional feature- space.  Principal Component Analysis and Singular Value Decomposition are two widely accepted techniques.
  • 22. THE CURSE OF DIMENSIONALITY  A few major benefits of dimensionality reduction are :  Data Analysis algorithms work better if the dimensionality of the dataset is lower.  This is mainly because irrelevant features and noise have now been eliminated.  The models which are built on top of lower dimensional data are more understandable and explainable.  The data may now also get easier to visualize! Features can always be taken in pairs or triplets for visualization purposes, which makes more sense if the feature set is not that big.
  • 23. FEATURE ENCODING  As mentioned before, the whole purpose of data preprocessing is to encode the data in order to bring it to such a state that the machine now understands it.  Feature encoding is basically performing transformations on the data such that it can be easily accepted as input for machine learning algorithms while still retaining its original meaning.  There are some general norms or rules which are followed when performing feature encoding.
  • 24. FEATURE ENCODING  For Continuous variables :  Nominal : Any one-to-one mapping can be done which retains the meaning. For instance, a permutation of values like in One-Hot Encoding.  Ordinal : An order-preserving change of values. The notion of small, medium and large can be represented equally well with the help of a new function, that is,<new_value = f(old_value)> -  For example, {0, 1, 2} or maybe {1, 2, 3}.
  • 25. For Numeric variables:  Interval : Simple mathematical transformation like using the equation <new_value= a*old_value + b>, a and b being constants. For example, Fahrenheit and Celsius scales, which differ in their Zero values size of a unit, can be encoded in this manner.  Ratio : These variables can be scaled to any particular measures, of course while still maintaining the meaning and ratio of their values. Simple mathematical transformations work in this case as well, like the transformation <new_value =a*old_value>. For, length can be measured in meters or feet, money can be taken indifferent currencies. FEATURE ENCODING
  • 26. TRAIN / VALIDATION / TEST SPLIT  After feature encoding is done, our dataset is ready for the exciting machine learning algorithms!  But before we start deciding the algorithm which should be used, it is always advised to split the dataset into 2 or sometimes 3 parts. algorithm for that matter, has to be first trained on the data distribution available and then validated and tested, before it can be deployed to deal with real- world data.
  • 27. TRAIN / VALIDATION / TEST SPLIT  Training data : This is the part on which your machine learning algorithms are actually trained to build a model.  The model tries to learn the dataset and its various characteristics and intricacies, which also raises the issue of Over fitting v/s Under fitting.
  • 28.  Validation data : This is the part of the dataset which is used to validate our various model fits.  In simpler words, we use validation data to choose and improve our model hyper parameters.  The model does not learn the validation set but uses it to get to a better state of hyper parameters.  Test data : This part of the dataset is used to test our model hypothesis.  It is left untouched and unseen until the model and hyper parameters are decided, and only after that the model is applied on the test data to get an accurate measure of how it would perform when deployed on real-world data. TRAIN / VALIDATION / TEST SPLIT
  • 29.  Split Ratio : Data is split as per a split ratio which is highly dependent on the type of model we are building and the dataset itself.  If our dataset and model are such that a lot of training is required, then we use a larger chunk of the data just for training purposes(usually the case) — For instance, training on textual data, image data, or video data usually involves thousands of features!  If the model has a lot of hyper parameters that can be tuned, then keeping a higher percentage of data for the validation set is advisable. TRAIN / VALIDATION / TEST SPLIT
  • 30.  Models with less number of hyper parameters are easy to tune and update, and so we can keep a smaller validation set.  Like many other things in Machine Learning, the split ratio is highly dependent on the problem we are trying to solve and must be decided after taking into account all the various details about the model and the dataset in hand. TRAIN / VALIDATION / TEST SPLIT
  • 31. Machine Learning algorithms, or any12/29/2020 Data Preprocessing : Concepts. Introduction to the concepts of Data… | by Pranjal Pandey | Towards Data Sciencehttps://towardsdatascience.com/data- preprocessing-concepts-fa946d11c825 12/14