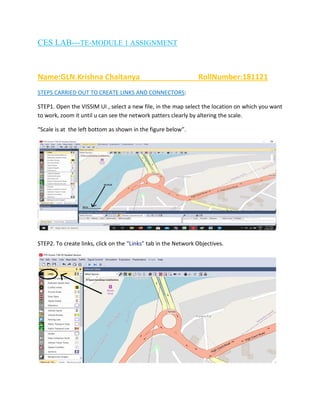
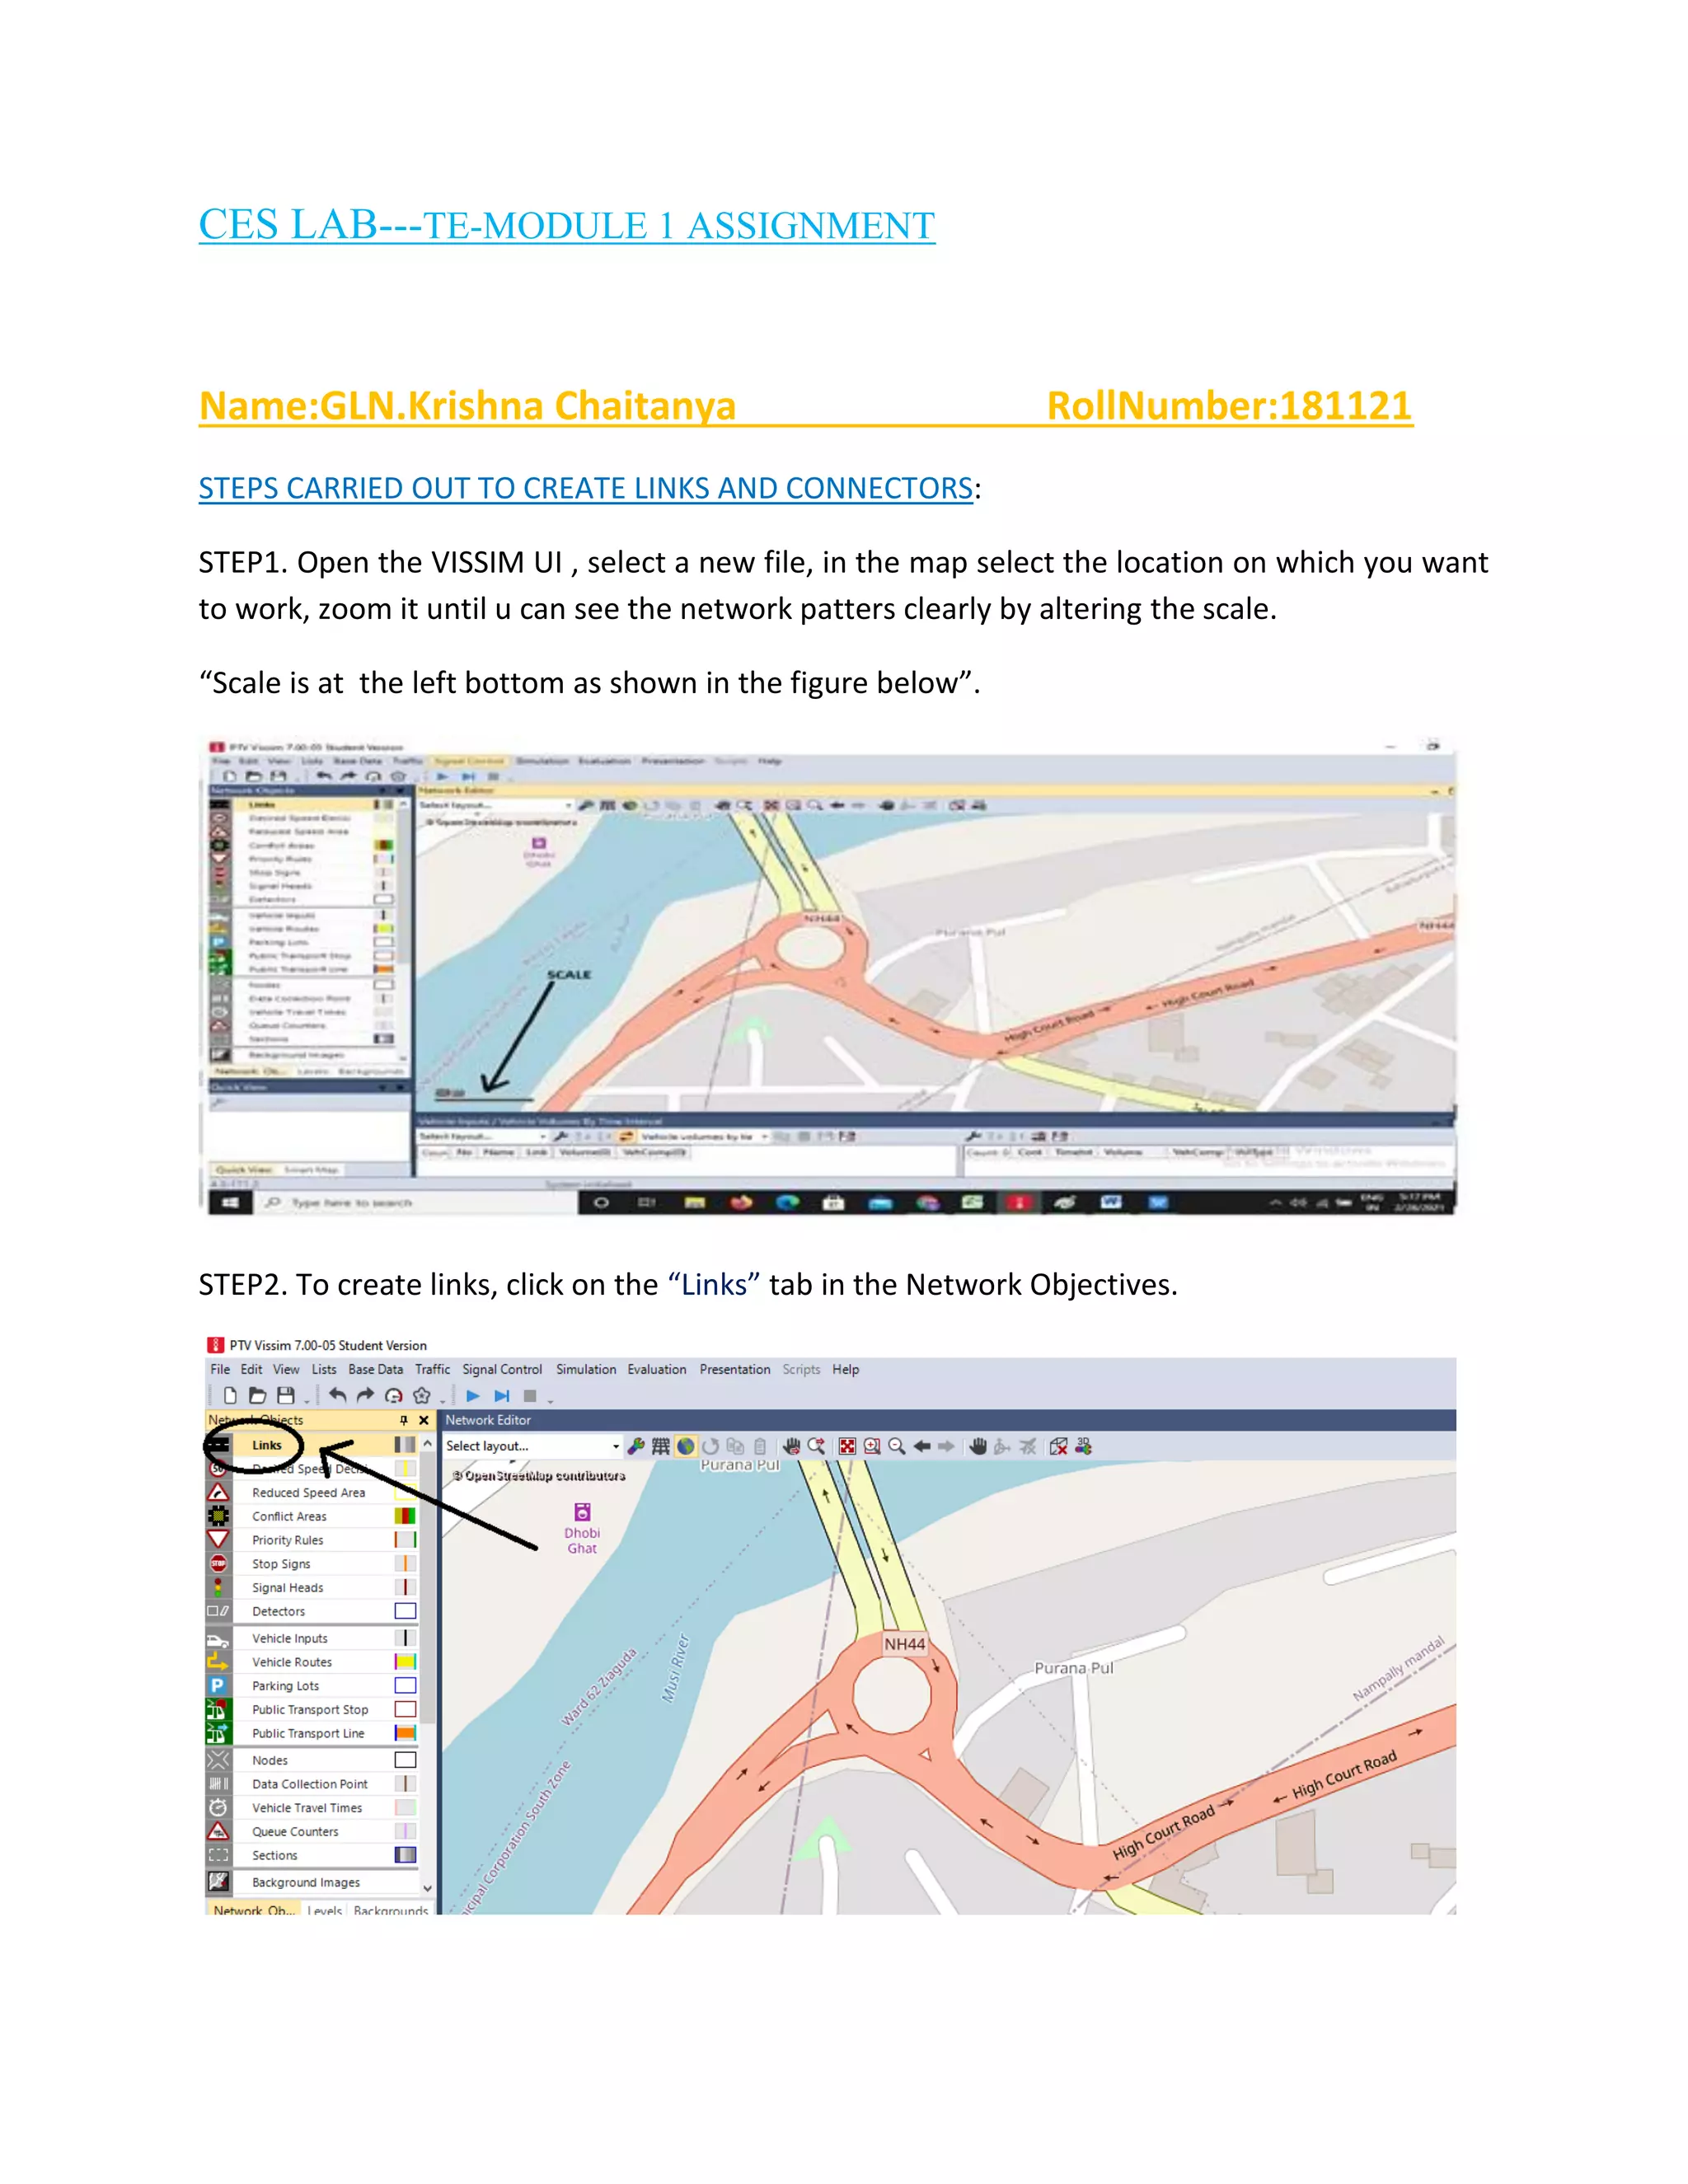
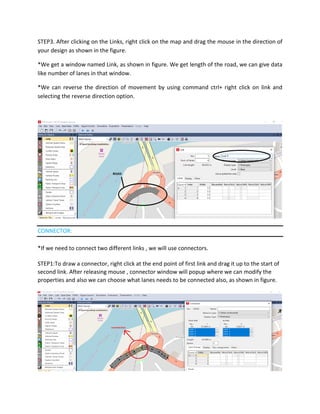
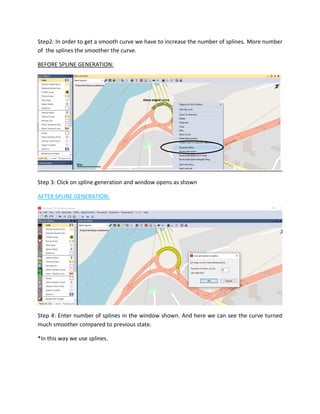
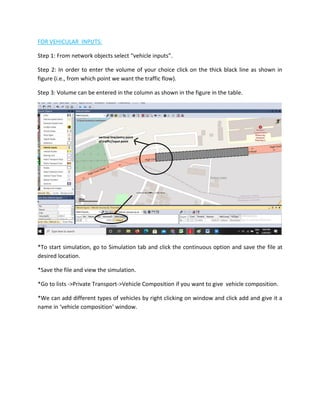
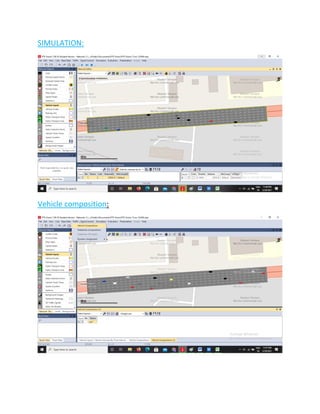
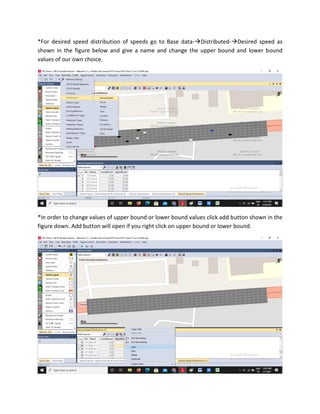
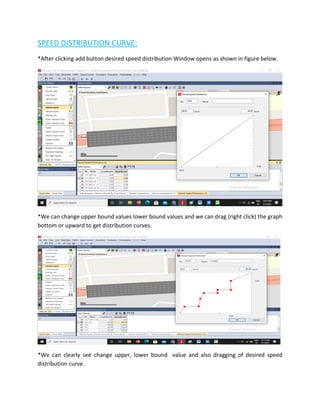
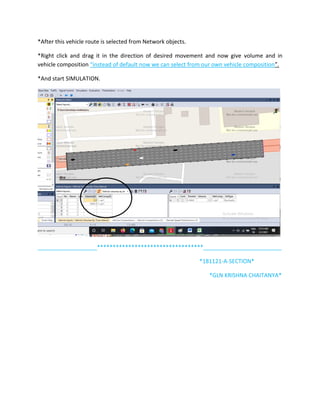
CES LAB---TE-MODULE 1 ASSIGNMENT
Name:GLN.Krishna Chaitanya RollNumber:181121
STEPS CARRIED OUT TO CREATE LINKS AND CONNECTORS:
STEP1. Open the VISSIM UI , select a new file, in the map select the location on which you want
to work, zoom it until u can see the network patters clearly by altering the scale.
“Scale is at the left bottom as shown in the figure below”.
STEP2. To create links, click on the “Links” tab in the Network Objectives.
STEP3. After clicking on the Links, right click on the map and drag the mouse in the direction of
your design as shown in the figure.
*We get a window named Link, as shown in figure. We get length of the road, we can give data
like number of lanes in that window.
*We can reverse the direction of movement by using command ctrl+ right click on link and
selecting the reverse direction option.
CONNECTOR:
*If we need to connect two different links , we will use connectors.
STEP1:To draw a connector, right click at the end point of first link and drag it up to the start of
second link. After releasing mouse , connector window will popup where we can modify the
properties and also we can choose what lanes needs to be connected also, as shown in figure.
Step2: In order to get a smooth curve we have to increase the number of splines. More number
of the splines the smoother the curve.
BEFORE SPLINE GENERATION:
Step 3: Click on spline generation and window opens as shown
AFTER SPLINE GENERATION:
Step 4: Enter number of splines in the window shown. And here we can see the curve turned
much smoother compared to previous state.
*In this way we use splines.
FOR VEHICULAR INPUTS:
Step 1: From network objects select “vehicle inputs”.
Step 2: In order to enter the volume of your choice click on the thick black line as shown in
figure (i.e., from which point we want the traffic flow).
Step 3: Volume can be entered in the column as shown in the figure in the table.
*To start simulation, go to Simulation tab and click the continuous option and save the file at
desired location.
*Save the file and view the simulation.
*Go to lists ->Private Transport->Vehicle Composition if you want to give vehicle composition.
*We can add different types of vehicles by right clicking on window and click add and give it a
name in ‘vehicle composition’ window.
SIMULATION:
Vehicle composition:
*For desired speed distribution of speeds go to Base data-Distributed-Desired speed as
shown in the figure below and give a name and change the upper bound and lower bound
values of our own choice.
*In order to change values of upper bound or lower bound values click add button shown in the
figure down. Add button will open if you right click on upper bound or lower bound.
SPEED DISTRIBUTION CURVE:
*After clicking add button desired speed distribution Window opens as shown in figure below.
*We can change upper bound values lower bound values and we can drag (right click) the graph
bottom or upward to get distribution curves.
*We can clearly see change upper, lower bound value and also dragging of desired speed
distribution curve.
*After this vehicle route is selected from Network objects.
*Right click and drag it in the direction of desired movement and now give volume and in
vehicle composition “instead of default now we can select from our own vehicle composition”.
*And start SIMULATION.
___________________**********************************_________________________
*181121-A-SECTION*
*GLN KRISHNA CHAITANYA*

Introduction of vissim software - SlideShare Ptv vissim student version_basics guide

  • 1.
    CES LAB---TE-MODULE 1ASSIGNMENT Name:GLN.Krishna Chaitanya RollNumber:181121 STEPS CARRIED OUT TO CREATE LINKS AND CONNECTORS: STEP1. Open the VISSIM UI , select a new file, in the map select the location on which you want to work, zoom it until u can see the network patters clearly by altering the scale. “Scale is at the left bottom as shown in the figure below”. STEP2. To create links, click on the “Links” tab in the Network Objectives.
  • 2.
    STEP3. After clickingon the Links, right click on the map and drag the mouse in the direction of your design as shown in the figure. *We get a window named Link, as shown in figure. We get length of the road, we can give data like number of lanes in that window. *We can reverse the direction of movement by using command ctrl+ right click on link and selecting the reverse direction option. CONNECTOR: *If we need to connect two different links , we will use connectors. STEP1:To draw a connector, right click at the end point of first link and drag it up to the start of second link. After releasing mouse , connector window will popup where we can modify the properties and also we can choose what lanes needs to be connected also, as shown in figure.
  • 3.
    Step2: In orderto get a smooth curve we have to increase the number of splines. More number of the splines the smoother the curve. BEFORE SPLINE GENERATION: Step 3: Click on spline generation and window opens as shown AFTER SPLINE GENERATION: Step 4: Enter number of splines in the window shown. And here we can see the curve turned much smoother compared to previous state. *In this way we use splines.
  • 4.
    FOR VEHICULAR INPUTS: Step1: From network objects select “vehicle inputs”. Step 2: In order to enter the volume of your choice click on the thick black line as shown in figure (i.e., from which point we want the traffic flow). Step 3: Volume can be entered in the column as shown in the figure in the table. *To start simulation, go to Simulation tab and click the continuous option and save the file at desired location. *Save the file and view the simulation. *Go to lists ->Private Transport->Vehicle Composition if you want to give vehicle composition. *We can add different types of vehicles by right clicking on window and click add and give it a name in ‘vehicle composition’ window.
  • 5.
  • 6.
    *For desired speeddistribution of speeds go to Base data-Distributed-Desired speed as shown in the figure below and give a name and change the upper bound and lower bound values of our own choice. *In order to change values of upper bound or lower bound values click add button shown in the figure down. Add button will open if you right click on upper bound or lower bound.
  • 7.
    SPEED DISTRIBUTION CURVE: *Afterclicking add button desired speed distribution Window opens as shown in figure below. *We can change upper bound values lower bound values and we can drag (right click) the graph bottom or upward to get distribution curves. *We can clearly see change upper, lower bound value and also dragging of desired speed distribution curve.
  • 8.
    *After this vehicleroute is selected from Network objects. *Right click and drag it in the direction of desired movement and now give volume and in vehicle composition “instead of default now we can select from our own vehicle composition”. *And start SIMULATION. ___________________**********************************_________________________ *181121-A-SECTION* *GLN KRISHNA CHAITANYA*