The paper presents a method utilizing Particle Swarm Optimization (PSO) for feature reduction in heart disease prediction, leveraging artificial neural networks to classify patients as diseased or non-diseased. The results indicate that applying PSO enhances the network's performance, and future work suggests a hybrid approach integrating PSO with rough set theory. The study highlights the critical role of data mining techniques in improving healthcare outcomes related to heart disease diagnosis.
![© 2014, IJARCSSE All Rights Reserved Page | 610
Volume 4, Issue 9, September 2014 ISSN: 2277 128X International Journal of Advanced Research in Computer Science and Software Engineering
Research Paper
Available online at: www.ijarcsse.com
PSO - An Intellectual Technique for Feature Reduction on Heart Malady Anticipation Data
1Sivagowry.S *, 2Dr. Durairaj.M
1Department of Computer Science, Engineering and Technology, Bharathidasan University, India
2Department of Computer Science, Engineering and Technology, Bharathidasan University, India
Abstract— Heart disease is a group of condition affecting the structure and functions of the heart and has many root causes. Heart disease is the leading cause of death in all over the world in recent years. Researchers have developed many data mining techniques for diagnosing heart disease. This paper proposes Particle Swarm Optimization (PSO) algorithm for Feature Reduction. Artificial Neural Network is used for classifying the patient as diseased and non- diseased. The network is trained under two conditions like before applying PSO and after applying PSO on training data. The performance of the network is analysed by using the techniques of Regression, Performance plot, Confusion Matrix and ROC Value. It is evident that the performance of the whole network is increased after the application of PSO for Feature Reduction. As future direction of this paper, a hybrid technique which combines PCO with Rough Set theory is suggested.
Keywords— Heart Disease, Particle Swarm Optimization, Feature Reduction, Artificial Neural Network, hybrid Technique.
I. INTRODUCTION
Data Mining is a computational progression to ascertain patterns in hefty data sets. It is the examination of hefty datasets to excerpt concealed and previously mysterious patterns, relationships and knowledge that are difficult to perceive with traditional statistics [1]. Data mining techniques are the result of a long process of research and product development [2]. The overall goal of the Data Mining process is to extort information from the data set and transform it into a comprehensible format for further use. Data Mining is explained to be a computational process, which is used to discover patterns in large data sets. The role of Data Mining in health care data is massive. The human decision making is optimal, but it is poor when the amount of data to be classified is huge. The enormous stress and overwork load resulted in poor / inaccurate decision making which may lead to disastrous consequences and cannot be allowed in medical field.
The most exorbitant and harmful mistake is performing decision making process based on improper information acquired from medical data [3]. Institute of Medicine estimated that the effect of medical error accounts for about $17 to $29 billion, which is not declined since then. Medical history data, which comprise of number of tests and previous examination cycles, is essential to diagnose and devise future course of treatments on particular disease. It is conceivable to increase the benefit of Data mining [4], [5], [6] in health care by employing it as an intellectual symptomatic tool [7]. The researchers in the medical field have prospered in categorizing and prophesying the syndrome with the encouragement of Data mining techniques [8]. Association rules of Data Mining have been significantly used in health care data prediction [9], [10], [11]. The eventual goal of knowledge discovery is to identify factors which tend to improve the quality and effectiveness of health care system.
II. HEART DISEASE
The rise of health care cost is one of the universally confronting problems. The therapeutic term for Heart Disease / Heart Attack is Myocardial Infarction (MI) or Acute Myocardial Infarction (AMI). Heart attack emerges when there is indiscretion in the flow of blood and bruised heart muscles due to inadequate oxygen supply [12]. Jeopardy factors for Myocardial Infarction include smoking, high blood pressure, cholesterol, Diabetes, Family history, etc.,. Cardio Vascular Disease (CVD) clinical guidelines spotlight on the management of single risk factors [13]. In majority of cases, it doesn‟t work since risk factors crop up in clusters, that is, the presence of single risk factor which indicates the presence of other risk factors too. It is apparent that the presence of multiple risk factors increases the sternness of CVD. World Health Organization (WHO) in the year 2008 testified that 30% of total global bereavements are due to Cardio Vascular Disease (CVD). WHO has announced India as global CVD capital [9]. Rapid urbanization and industrialization have led to the major cause of demise in India due to CVD [10]. It is estimated that numeral of CVD patients will increase from 300 million to 600 million by 2020 [16]. By 2030, almost 25 million people will die from CVDs, mainly from heart disease and stroke [17], [18]. These are projected to remain the CVD is the single leading cause of death. The CVD is also expected to be the leading cause of deaths in developing countries due to changes in lifestyle, work culture and food habits. Hence, more careful and efficient methods of diagnosing cardiac diseases and periodic examination are of high importance [19] [20] to take preventive care.](https://image.slidesharecdn.com/ijarcsse-141024051707-conversion-gate02/75/PSO-An-Intellectual-Technique-for-Feature-Reduction-on-Heart-Malady-Anticipation-Data-1-2048.jpg)
![Sivagowry et al., International Journal of Advanced Research in Computer Science and Software Engineering 4(9),
September - 2014, pp. 610-621
© 2014, IJARCSSE All Rights Reserved Page | 611
The paper is organized as follows: Section II gives the magnitude about Artificial Neural Network. Section III gives
detail information about the Particle Swarm Optimization. Section IV describes the data set collected for
experimentation. Section V evaluates the methodology applied for Feature Reduction and Section VI discusses the
results. Section VII concludes the paper.
III. ARTIFICIAL NEURAL NETWORK
The indication for mounting the Neural Network was obtained from scrutinizing the clear pre-eminence of brain over
conventional computers [21]. The reckoning speed of Neural Network is more than the conventional computer because
of its parallel computing nature. The encumbrance of the network can be concocted by using the efficient algorithms.
Neural Network architecture generally falls under two categories namely Feed Forward and Feedback architecture. The
three layers like input layer, one or more hidden layers and an output layer contribute to modelling a structure for Neural
Network [22] [23]. The complexity of the system and study defines the number of hidden layers and neurons. The Fig 1,
shows a simple Artificial Neural Network diagram.
Fig. 1 A sample Neural Network diagram
IV. PARTICLE SWARM OPTIMIZATION
Particle Swarm Optimization (PSO) is a conventional and semi-robotic algorithm. It is based on the social behaviour
associated with bird‟s flocking for optimization problem. A social behaviour pattern of organisms that live and interact
within large groups is the inspiration for PSO. The PSO is easier to lay into operation than Genetic Algorithm. It is for
the motivation that PSO doesn‟t have mutation or crossover operators and movement of particles is effected by using
velocity function [24]. In PSO, each particle adjusts its own flying memory and its companion‟s flying involvement in
order to flying in the search space with velocity. The precise functioning of PSO is as depicted in Fig 2.
In the basic PSO, Particle Swarm consists of „n‟ particles. The position of each particle stands for potential solution in
D-dimensional space, individuals, potential solutions and flow through hyper dimensional search space. The experience
or acquired knowledge about its neighbour‟s influences the changes in a particle within the swarm. The PSO algorithm
involves just three steps, which are being replicated until stopping condition, they are as follows.
(i) Evaluate the fitness of each particle.
(ii) Update individual and global best functions.
(iii) Update velocity and position of each particle.
The position of each particle is influenced by the best-fit particle of the entire swarm [25]. Each individual particle i
[1… n] where n > 1, has current position in search space xi, a current velocity vi and a personal best position Pbest,i where
i is the smallest value determined by objective function f. By using the Pbest,i, the global best position Gbest is calculated,
which is the buck value obtained by comparing all the Pbest, i.
The Pbest,i is calculated by using the formula
{ - - - - (1) best,i best,i
i best,i
P ( ) P
, x ( ) P
i
i
if f x
best i if f x p
The formula used to calculate Global Best Position Gbest is
n 1 - - - - (2)
{min { P }, i [1, .... ..., n] where best,i
G where best
Velocity can be updated by using the formula
[ ( ) ( )] - - (3)
wv ( ) [ ( ) ( )
2 2
i 1 1
1
c r g t x t
V t c r x t x t
i
i i
t
i](https://image.slidesharecdn.com/ijarcsse-141024051707-conversion-gate02/75/PSO-An-Intellectual-Technique-for-Feature-Reduction-on-Heart-Malady-Anticipation-Data-2-2048.jpg)
![Sivagowry et al., International Journal of Advanced Research in Computer Science and Software Engineering 4(9),
September - 2014, pp. 610-621
© 2014, IJARCSSE All Rights Reserved Page | 612
where vi(t) is the velocity, w, c1 and c2 are user supplied co-efficient. The r1 and r2 are random values xi(t) is the individual best solution, g(t) is the swarm‟s global best candidate solution. ) is known as inertia component. The inertia component is responsible for keeping the particle moving in same direction, it was originally heading. Inertia component value lies between 0.8 and 1.2. Lower the values of inertia component, it speeds up the convergence of swarm to optima. But higher value encourages the exploration of entire search space. c1r1 [(xi(t)-xi(t)] is known as cognitive component. It pretence as a particle‟s memory and it verge to return to the region of search space, where it experiences high individual factors. c2r2 [(g(t)-xi(t)] is known as social component, which causes the particle to move to the best region the swarm has found so far. The pseudo code of the Particle Swarm Optimization Algorithm is as given below.
Algorithm PSO
Input
m: the swarm size; c1, c2 : positive acceleration constants; w: inertia weight
MaxV: maximum velocity of particles
MaxGen: maximum generation
MaxFit: maximum fitness value
Output:
Pgbest: Global best position
Begin
Swarms {xid, vid} =Generate (m); /*Initialize a population of particles with random positions and velocities on S dimensions */
Pbest(i)=0; i = 1,….,m,d=1,…..,S
Gbest = 0; Iter = 0;
While (Iter<MaxGen and Gbest < MaxFit)
{For (every particle i)
{Fitness(i)=Evaluate(i);
IF(Fitness(i)>Pbest(i))
{Pbest(i)=Fitness(i);pid=xid; d=1,…..,S}
IF(Fitness(i)>Gbest(i))
{Gbest(i)=Fitness(i);gbest=i;
}
For (every particle i)
{For(every d){
vid = w*vid + c1*rand()*(pid-xid)+c2*Rand()*(pgd-xid)
IF (vid > MaxV) { vid = MaxV;}
IF (vid <- MaxV) { vid =- MaxV;}
xid = xid+ vid
}
}
Iter=Iter+1;
}/* rand() and Rand() are two random functions in the range [0,1]*/
Return P_{gbest}
End](https://image.slidesharecdn.com/ijarcsse-141024051707-conversion-gate02/75/PSO-An-Intellectual-Technique-for-Feature-Reduction-on-Heart-Malady-Anticipation-Data-3-2048.jpg)
![Sivagowry et al., International Journal of Advanced Research in Computer Science and Software Engineering 4(9),
September - 2014, pp. 610-621
© 2014, IJARCSSE All Rights Reserved Page | 613
Fig 2. Working of PSO
V. LITERATURE REVIEW
Works related to various applications of Data Mining, Neural Network and Particle Swarm Optimization on diagnosing Heart Disease are deliberated below: Subhagata Chattopadhyay [26] has mined some important pre-disposing factors of heart attack. 300 real world cases were taken for study. 12 factors were taken. Divisive Hierarchical Clustering (DHC) techniques was used to cluster the sample as „single‟ , „average‟ and „complete‟ linkage. It was observed from their results that male with age group of 23- 60 are prone to suffer severe and moderate heart attack, where women over 50 years are affected mostly with mild attacks. A modified Multi Swarm PSO [27] was studied to crack discrete problems with number of sub swarm and a multi swarm scheduler that can scrutinize and control each sub swarm using the rule. For Feature Selection, Improved Feature Selection (IFS) algorithm was incorporated with Multi Swarm PSO and Support Vector Machine was integrated with F- Score. Recital of the anticipated method was compared with Standard PSO, Genetic Algorithm and Grid search. The proposed method performs drastically in terms of classification accuracy rate. Xiangyang Wang [28] proposed a feature selection strategy based on rough sets and PSO. PSORSFS (Particle Swarm Optimization with Rough Set Feature Selection) algorithm and other feature selection algorithm were implemented using Matlab. PSO was found to obtain optimal solution so quickly. It was observed that inertia weight and maximum velocity have an imperative brunt in the performance of PSO. PSO was combined with K-Nearest Neighbor (PSOK-NN) classifier [29] to determine Coronary artery disease by using exercise stress testing data. It was composed of two steps. At the first step, a particle was generated which demonstrates the whole sample optimally in training data for both health and unhealthy patients. Then the class of test sample was determined by using the distance of the test sample generated by utilizing K-Nearest Neighbor algorithm. The accuracy obtained while using PSOK-NN was 92.49%. Benxian Yue and et. al., [30] depict that PSO can be used as a solution to find the appropriate features by using Rough Set Theory. The proposed method observed the change of positive region as the particles proceed through the search space. The performance of the algorithm is evaluated with Genetic Algorithm. The fitness of each individual is evaluated during search procedure. When compared with Genetic Algorithm, it is perceived that PSO requires shorter time to obtain better results.](https://image.slidesharecdn.com/ijarcsse-141024051707-conversion-gate02/75/PSO-An-Intellectual-Technique-for-Feature-Reduction-on-Heart-Malady-Anticipation-Data-4-2048.jpg)
![Sivagowry et al., International Journal of Advanced Research in Computer Science and Software Engineering 4(9),
September - 2014, pp. 610-621
© 2014, IJARCSSE All Rights Reserved Page | 614
In [31], a hybrid filter-wrapper feature subset selection algorithm is presented which is based on PSO. Maximum relevance minimum redundancy PSO (mr2PSO) uses the mutual information available from the filter model to weigh the bit selection probabilities in discrete PSO. This method integrated mutual information filter model within the PSO based wrapper model. Mutual dependence of two variables is measured by the quantity called mutual information. The mutual information is expressed as a composite measure of feature relevance and redundancy. The probability of the features is weighed by using feature relevance and redundancy, which enhances the convergence rate and solution quality of feature subset selection. A stratified 10-fold cross validation is recommended. In [32], it is recommended that hill climbing rough set approach is inadequate to find optimum solution. It is not feasible for complete search even in medium-sized data set. The PSO interacts with individuals in the population to find the optimal region in complex search space. The main pro of PSO over GA is that it doesn‟t require cross over or mutation operation and also inexpensive in terms of both memory and run time. Experimental results show that PSO is efficient for rough set based feature selection. In [33], a computer aided diagnosis system has been introduced for the heart valve disease by using binary PSO and Support Vector Machine (SVM) algorithm in conjunction with K-nearest neighbor and leave-one-out cross validation. The most weighted feature is selected by using binary PSO algorithm. SVM is used to classify the outcome into two classes as healthy and having heart valve disease. The proposed method helps to optimize the feature selection process. It can also be used an ideal preprocessing tool since it increase the classification accuracy. Weighted Fuzzy rule based Clinical Decision Support System (CDSS) is proposed [34]. It consists of two phases. The first phase is automated approach for the generation of fuzzy rules and the second is developing a fuzzy rule based on Decision Support System. The CDSS is compared with Neural Network based system by Sensitivity, Specificity and Accuracy. Cleveland, Hungarian and Switzerland Data sets are used. The sensitivity of Neural Network (NN) and CDSS is 52.47% and 45.22%, Specificity is 52.46% and 68.75%, Accuracy is 53.86% and 57.85%. Data Mining Classification [35], [36] is based on a supervised machine learning algorithm. Tanagra tool is used to classify the data and evaluated using 10 fold cross validation. Naïve Bayes, K-nn [37], Decision List Algorithm is taken and the performance of these algorithms is analyzed based on accuracy and time taken to build the model. Naïve bayes is considered to be better since it takes only lesser time to calculate accuracy than other algorithms. It also resulted in lower error rates. The Naïve Bayes algorithm gives 52.23% of accurate result. Intelligent Heart Disease Prediction System (IHDPS) [38] is developed using Data Mining Techniques namely Decision Tree, Naïve Bayes and Neural Network. Each technique has its own strength in realizing the objectives of Data Mining. DMX Query language is used which answers complex “What if” queries where Decision Support System can‟t. Five Data mining rules are defined and evaluated using the three models. Naïve bayes is found to the most effective in Heart Disease diagnosis. MisClassification Analysis [39] is used for Data Cleaning. The Complementary Neural Network is used to enhance the performance of network classifier. Two techniques are used. Falsity NN is obtained by complementing the target output of training data. True NN and False NN are trained for membership values. In the first technique, new training data are obtained by eliminating all misclassification patterns. In the second technique, only the misclassification patterns are eliminated. The classification accuracy is improved after Data cleaning. Technique II showed much accuracy than Technique I. Ripper Incremental Pruning to Produce Error Reduction (RIPPER) [40], [41], Support Vector Machine (SVM), Decision Tree and Artificial Neural Network are compared. The performances of the algorithms are compared with each other based on Sensitivity, Specificity, Accuracy, Error rate, True Positive rate and False Positive rate. SVM predicts with least error rate and highest accuracy.
VI. DATA SETS
The Data set used for experimentation is taken from Data mining repository of the University of California, Irvine (UCI). Data of Cleveland Data set, Hungary Data set, Switzerland Data set, Long beach and Statlog Data set are collected. Cleveland, Hungary, Switzerland and Va Long Beach data set contain 76 attributes. Among all the 76 attributes, 14 attributes are taken for experimentation, since all the published experiments refer to using subset of 14 attributes. Researchers in the medical domain mostly use Cleveland data set and Statlog data set for testing purpose. This is because all the other data set has more number of missing values than Cleveland data set [42]. The Table 1 describes the data attributes used in this work. Table 1: Description of the Data Attributes
No
Name
Description
1
Age
Age in Years
2
Sex
1=male, 0=female
3
Cp
Chest pain type(1 = typical angina, 2 =atypical angina, 3 = non-anginal pain, 4 = asymptomatic)
4
Trestbps
Resting blood sugar(in mm Hg on admission to hospital)
5
Chol
Serum cholesterol in mg/dl
6
Fbs
Fasting blood sugar>120 mg/dl(1= true, 0=false)](https://image.slidesharecdn.com/ijarcsse-141024051707-conversion-gate02/75/PSO-An-Intellectual-Technique-for-Feature-Reduction-on-Heart-Malady-Anticipation-Data-5-2048.jpg)
![Sivagowry et al., International Journal of Advanced Research in Computer Science and Software Engineering 4(9),
September - 2014, pp. 610-621
© 2014, IJARCSSE All Rights Reserved Page | 615
7
Restecg
Resting electrocardiographic results(0 = normal, 1 = having ST-T wave abnormality, 2 = left ventricularhypertrophy)
8
Thalach
Maximum heart rate
9
Exang
Exercise induced angina
10
Oldpeak
ST depression induced by exercise relative to rest
11
Slope
Slope of the peak exercise ST segment (1=upsloping, 2=flat, 3= downsloping)
12
Ca
Number of major vessels colored by fluoroscopy
13
Thal
3= normal, 6=fixed defect, 7= reversible defect
14
Num
Class(0=healthy, 1=have heart disease)
VII. EVALUATION SETUP Data Preprocessing [41] plays a trivial role in Data Mining. The training phase in the Data Mining during Knowledge Discovery will be very complicated if the data contains irrelevant or redundant information or more noisy and unreliable data. The medical data contain many missing values. So preprocess is an obligatory step before training the medical data. The data set is preprocessed to remove the missing values and noisy data. After preprocessing, a total of 303 instances with 13 attributes are trained before applying Feature Reduction algorithm. The subsequent steps are to be shadowed: 1. To improve a system and to heighten the system to get more exactitude after testing. 2. To equate the consequences of customary Neural Network with Enhanced Neural Network. 3. The Swarm Intelligence algorithm (i.e.) PSO is used for optimization. 4. To progress better and more perfect anticipated system. Mean Squared Error and Regression are the two parameters that are used to measure the network performance. Mean Squared Error is the average squared difference between outputs and targets. Lower values are better. Zero means no error. Regression R values measure the correlation between outputs and targets. An R value of 1 means a close relationship, 0 a random relationship. The 3, 5 and 10 hidden neurons spectacle some auspicious consequences than the other number of neurons. Depending on the intricacy of the problems 10 hidden neurons is determined for training the network. The underneath Table 2 list out the R and MSE value achieved while training the network with different number of hidden neurons and also vindicate the consumption of 10 hidden neurons in network training. Table 2: R & MSE Values Obtained With Different Number of Hidden Neurons
No. of Hidden Neurons
NN Training before PSO
NN Training with PSO
R
MSE
R
MSE 3 7.63870e-1 6.26836e-1 1.00000e-0 1.40069e-18 4 7.47725e-1 6.66003e-1 9.99999e-1 8.17511e-12 5 7.70613e-1 6.16903e-1 9.99999e-1 2.38654e-6 6 7.75251e-1 6.01267e-1 9.99999e-1 9.83401e-8 8 6.54997e-1 8.64386e-1 9.99999e-1 4.15585e-7 10 7.41822e-1 6.79545e-1 1.00000e-0 1.30016e-15
13
6.99018e-1
7.09521e-1
9.99999e-1
1.11826e-12
16
7.18929e-1
7.37573e-1
9.99999e-1
9.20804e-13
20
7.91213e-1
5.84062e-1
9.99999e-1
2.79762e-12
26
7.49856e-1
7.00141e-1
1.00000e-0
2.41863e-17
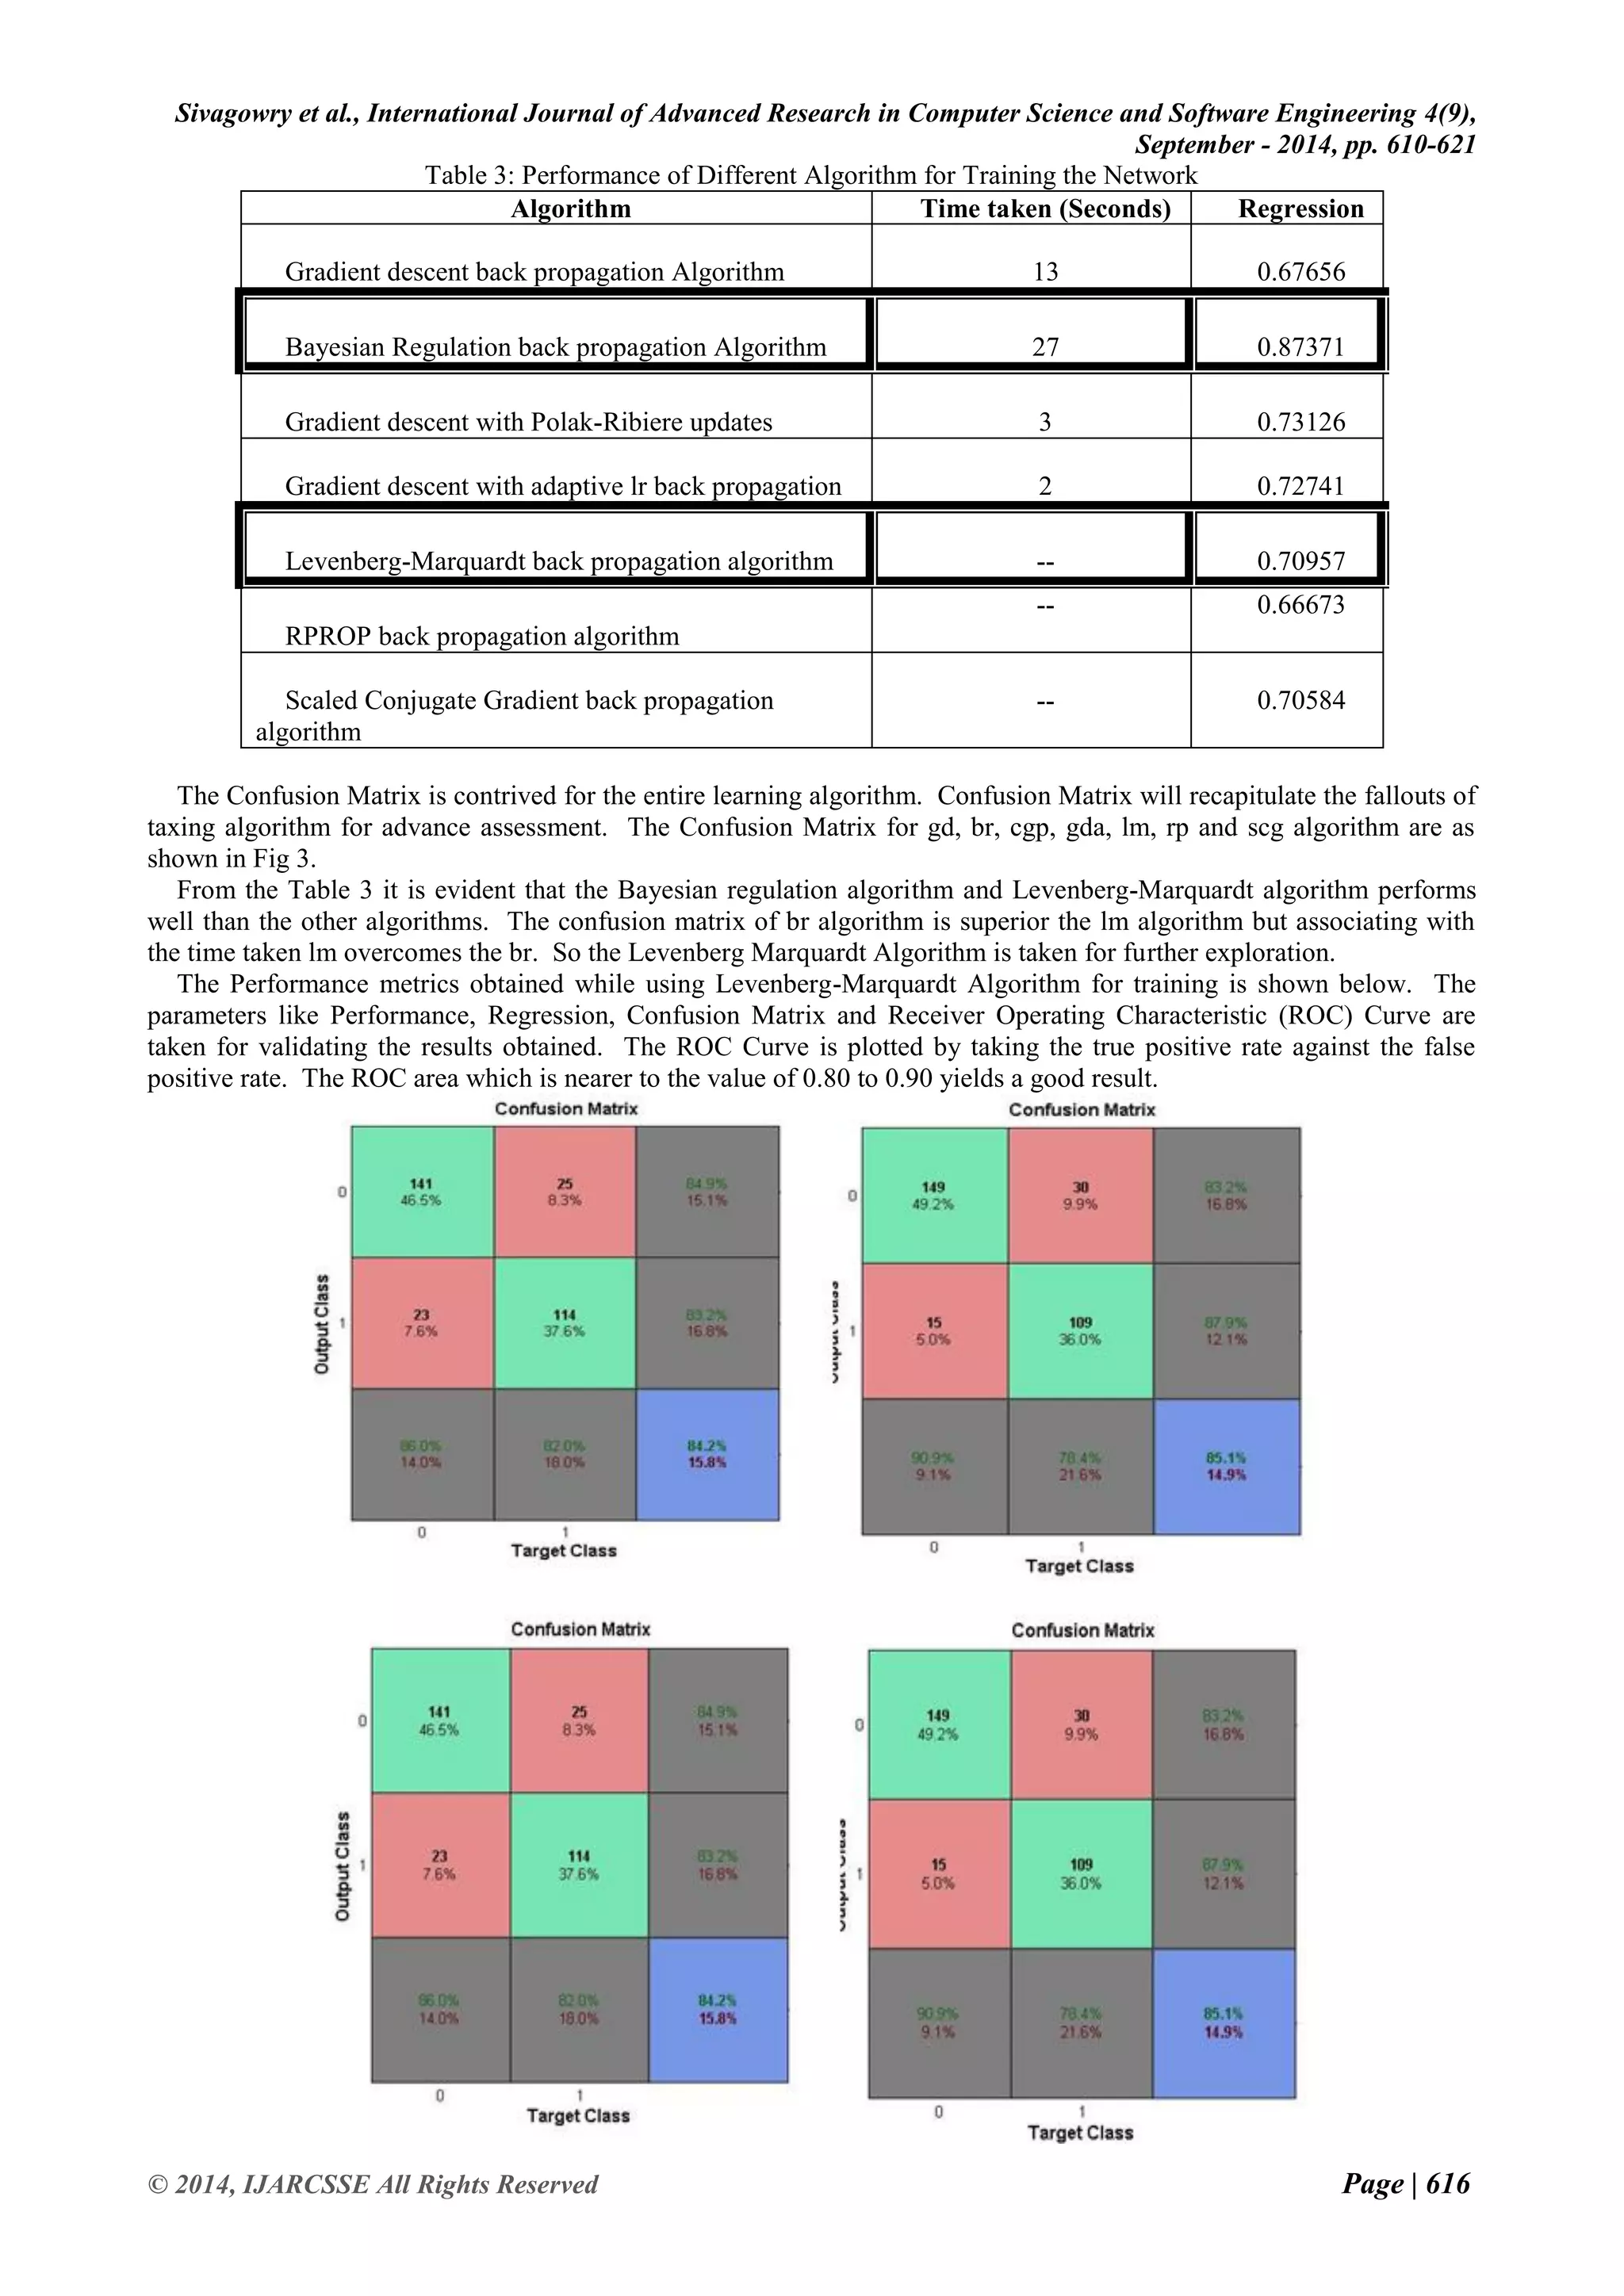
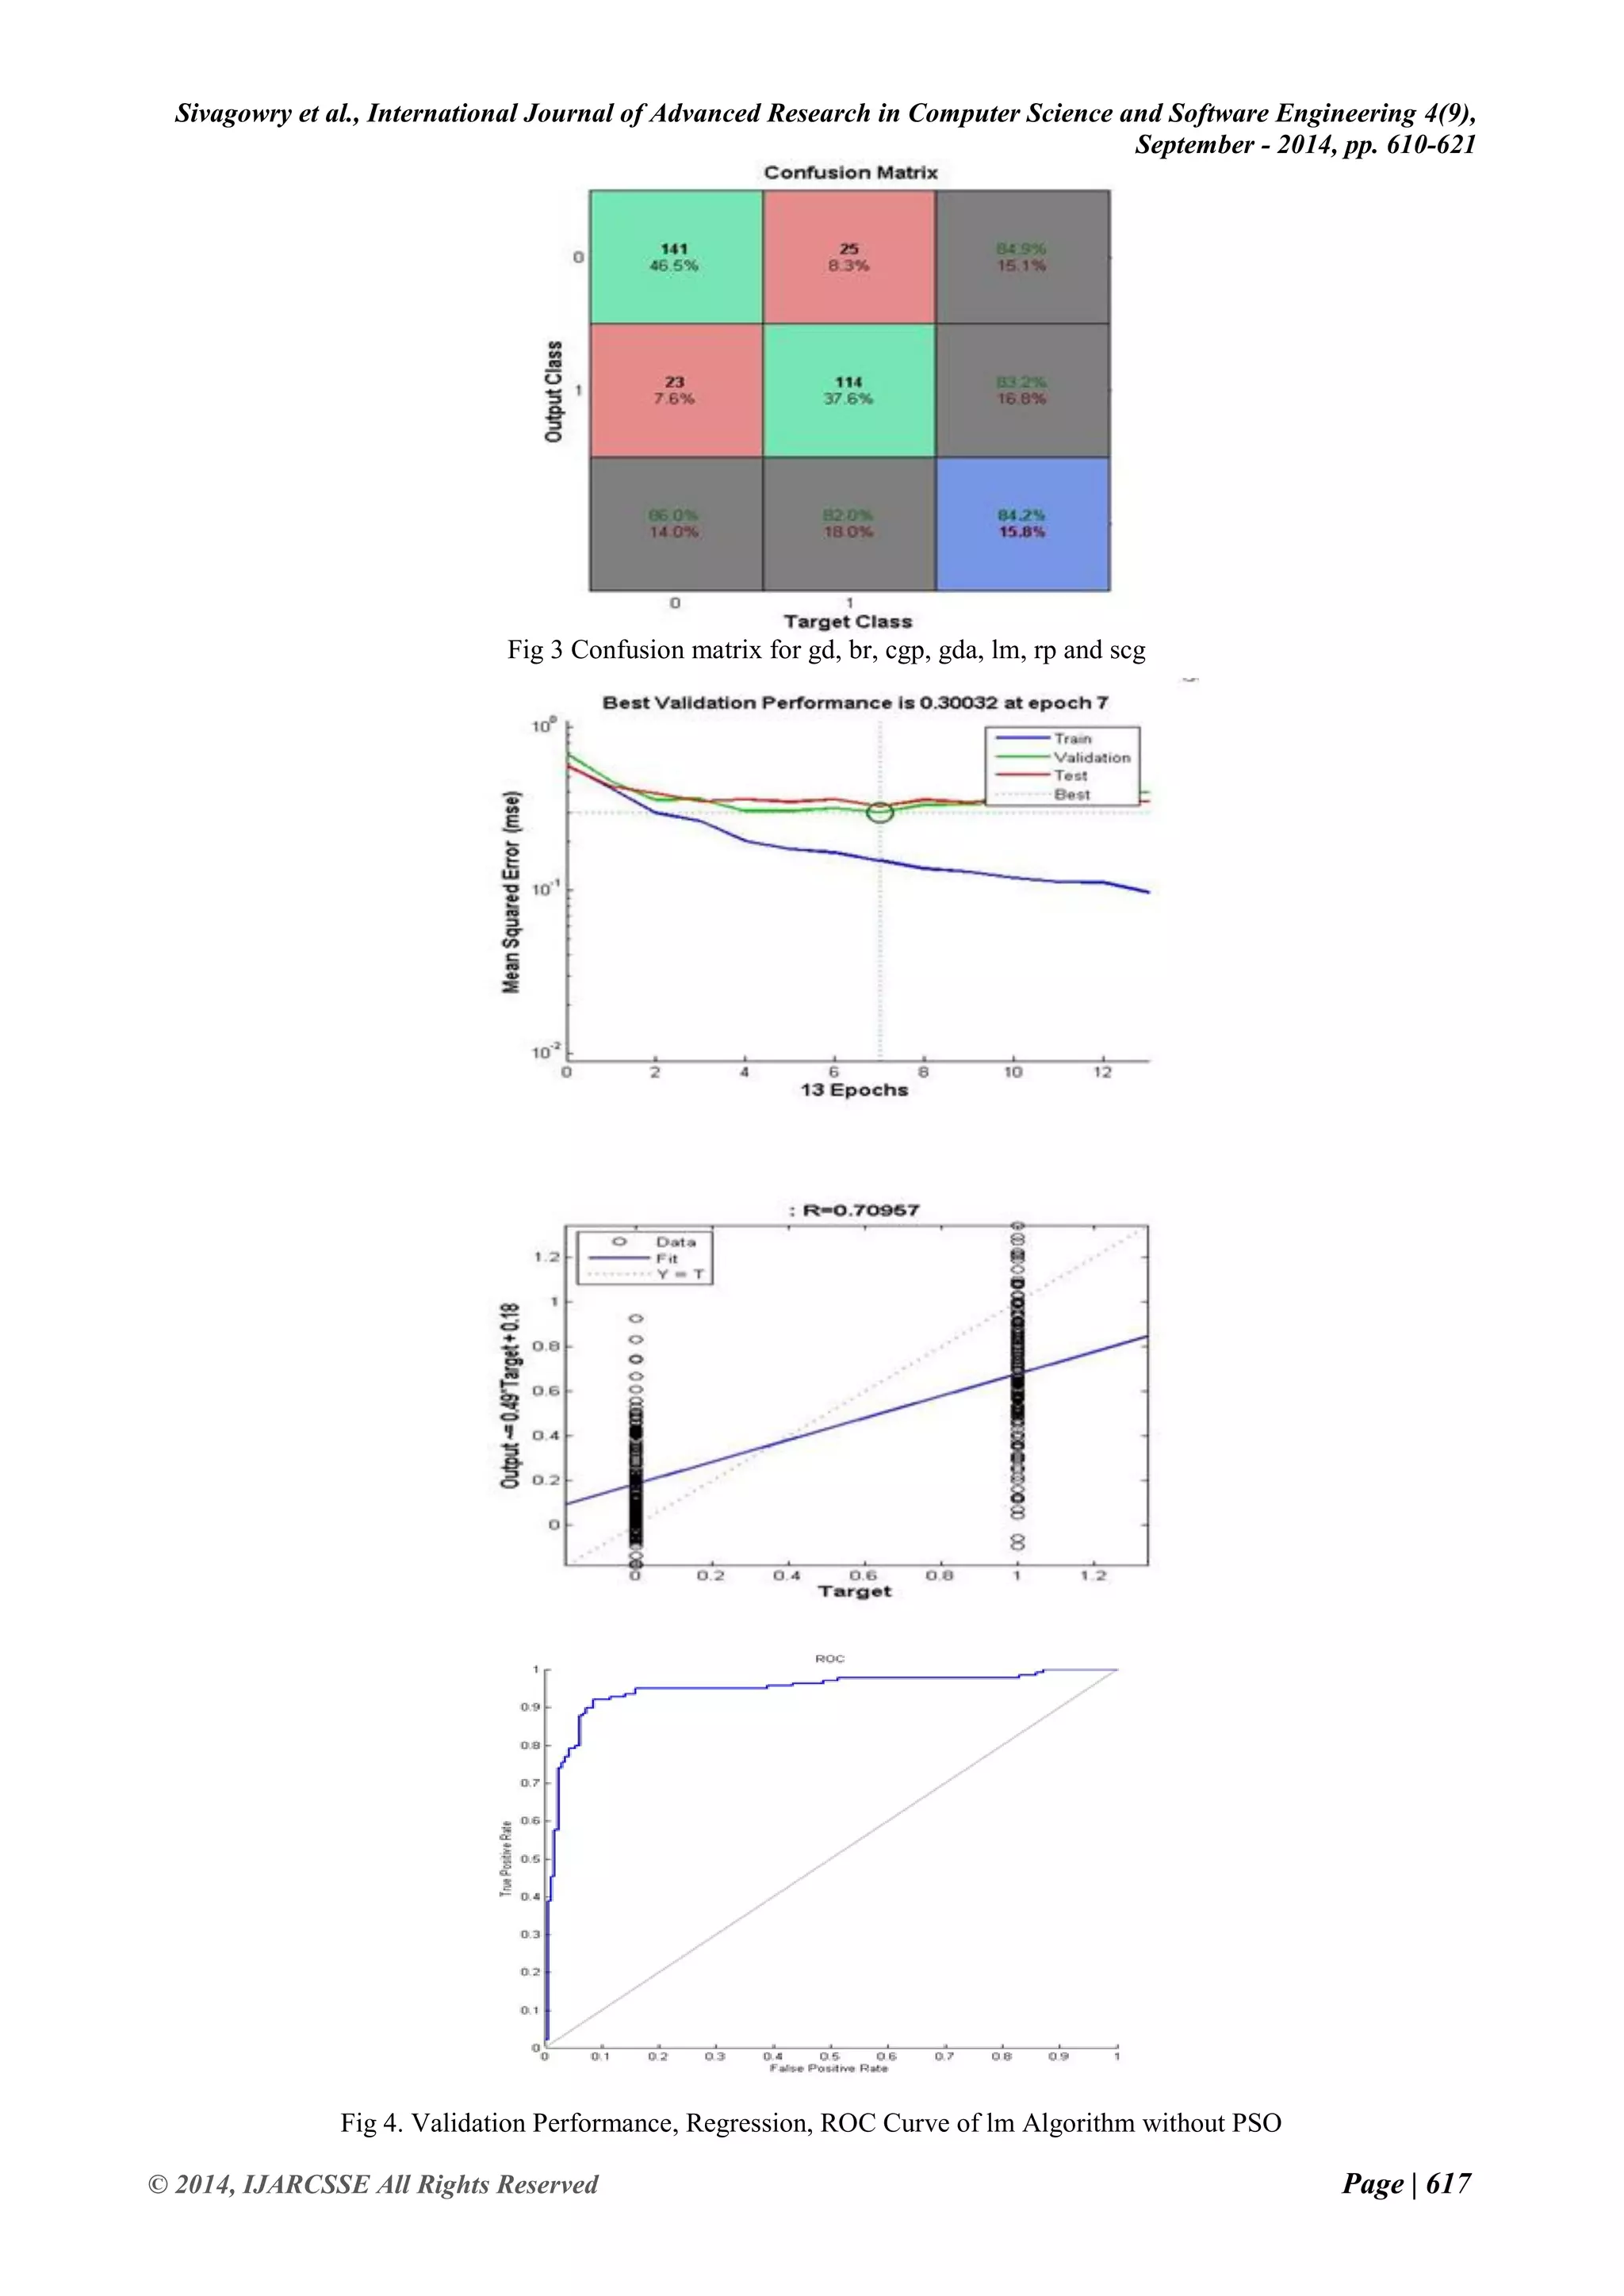
Before pre-processing the data set using PSO, the network is trained to test the accuracy obtained with the data attributes. Copious algorithms are accessible to train the neural network models. Bayesian Regulation back propagation algorithm (br), Gradient descent with Polak –Ribiere updates (cgp), Gradient descent back propagation algorithm (gd), Gradient descent with adaptive linear back propagation (gda), Levenberg-Marquardt back propagation algorithm (lm), RPROP back propagation algorithm (rp) and scaled conjugate gradient back propagation algorithm (scg) are taken to train the Network. The performance of the algorithm is given in the Table 3.](https://image.slidesharecdn.com/ijarcsse-141024051707-conversion-gate02/75/PSO-An-Intellectual-Technique-for-Feature-Reduction-on-Heart-Malady-Anticipation-Data-6-2048.jpg)
![Sivagowry et al., International Journal of Advanced Research in Computer Science and Software Engineering 4(9),
September - 2014, pp. 610-621
© 2014, IJARCSSE All Rights Reserved Page | 620
IX. CONCLUSION
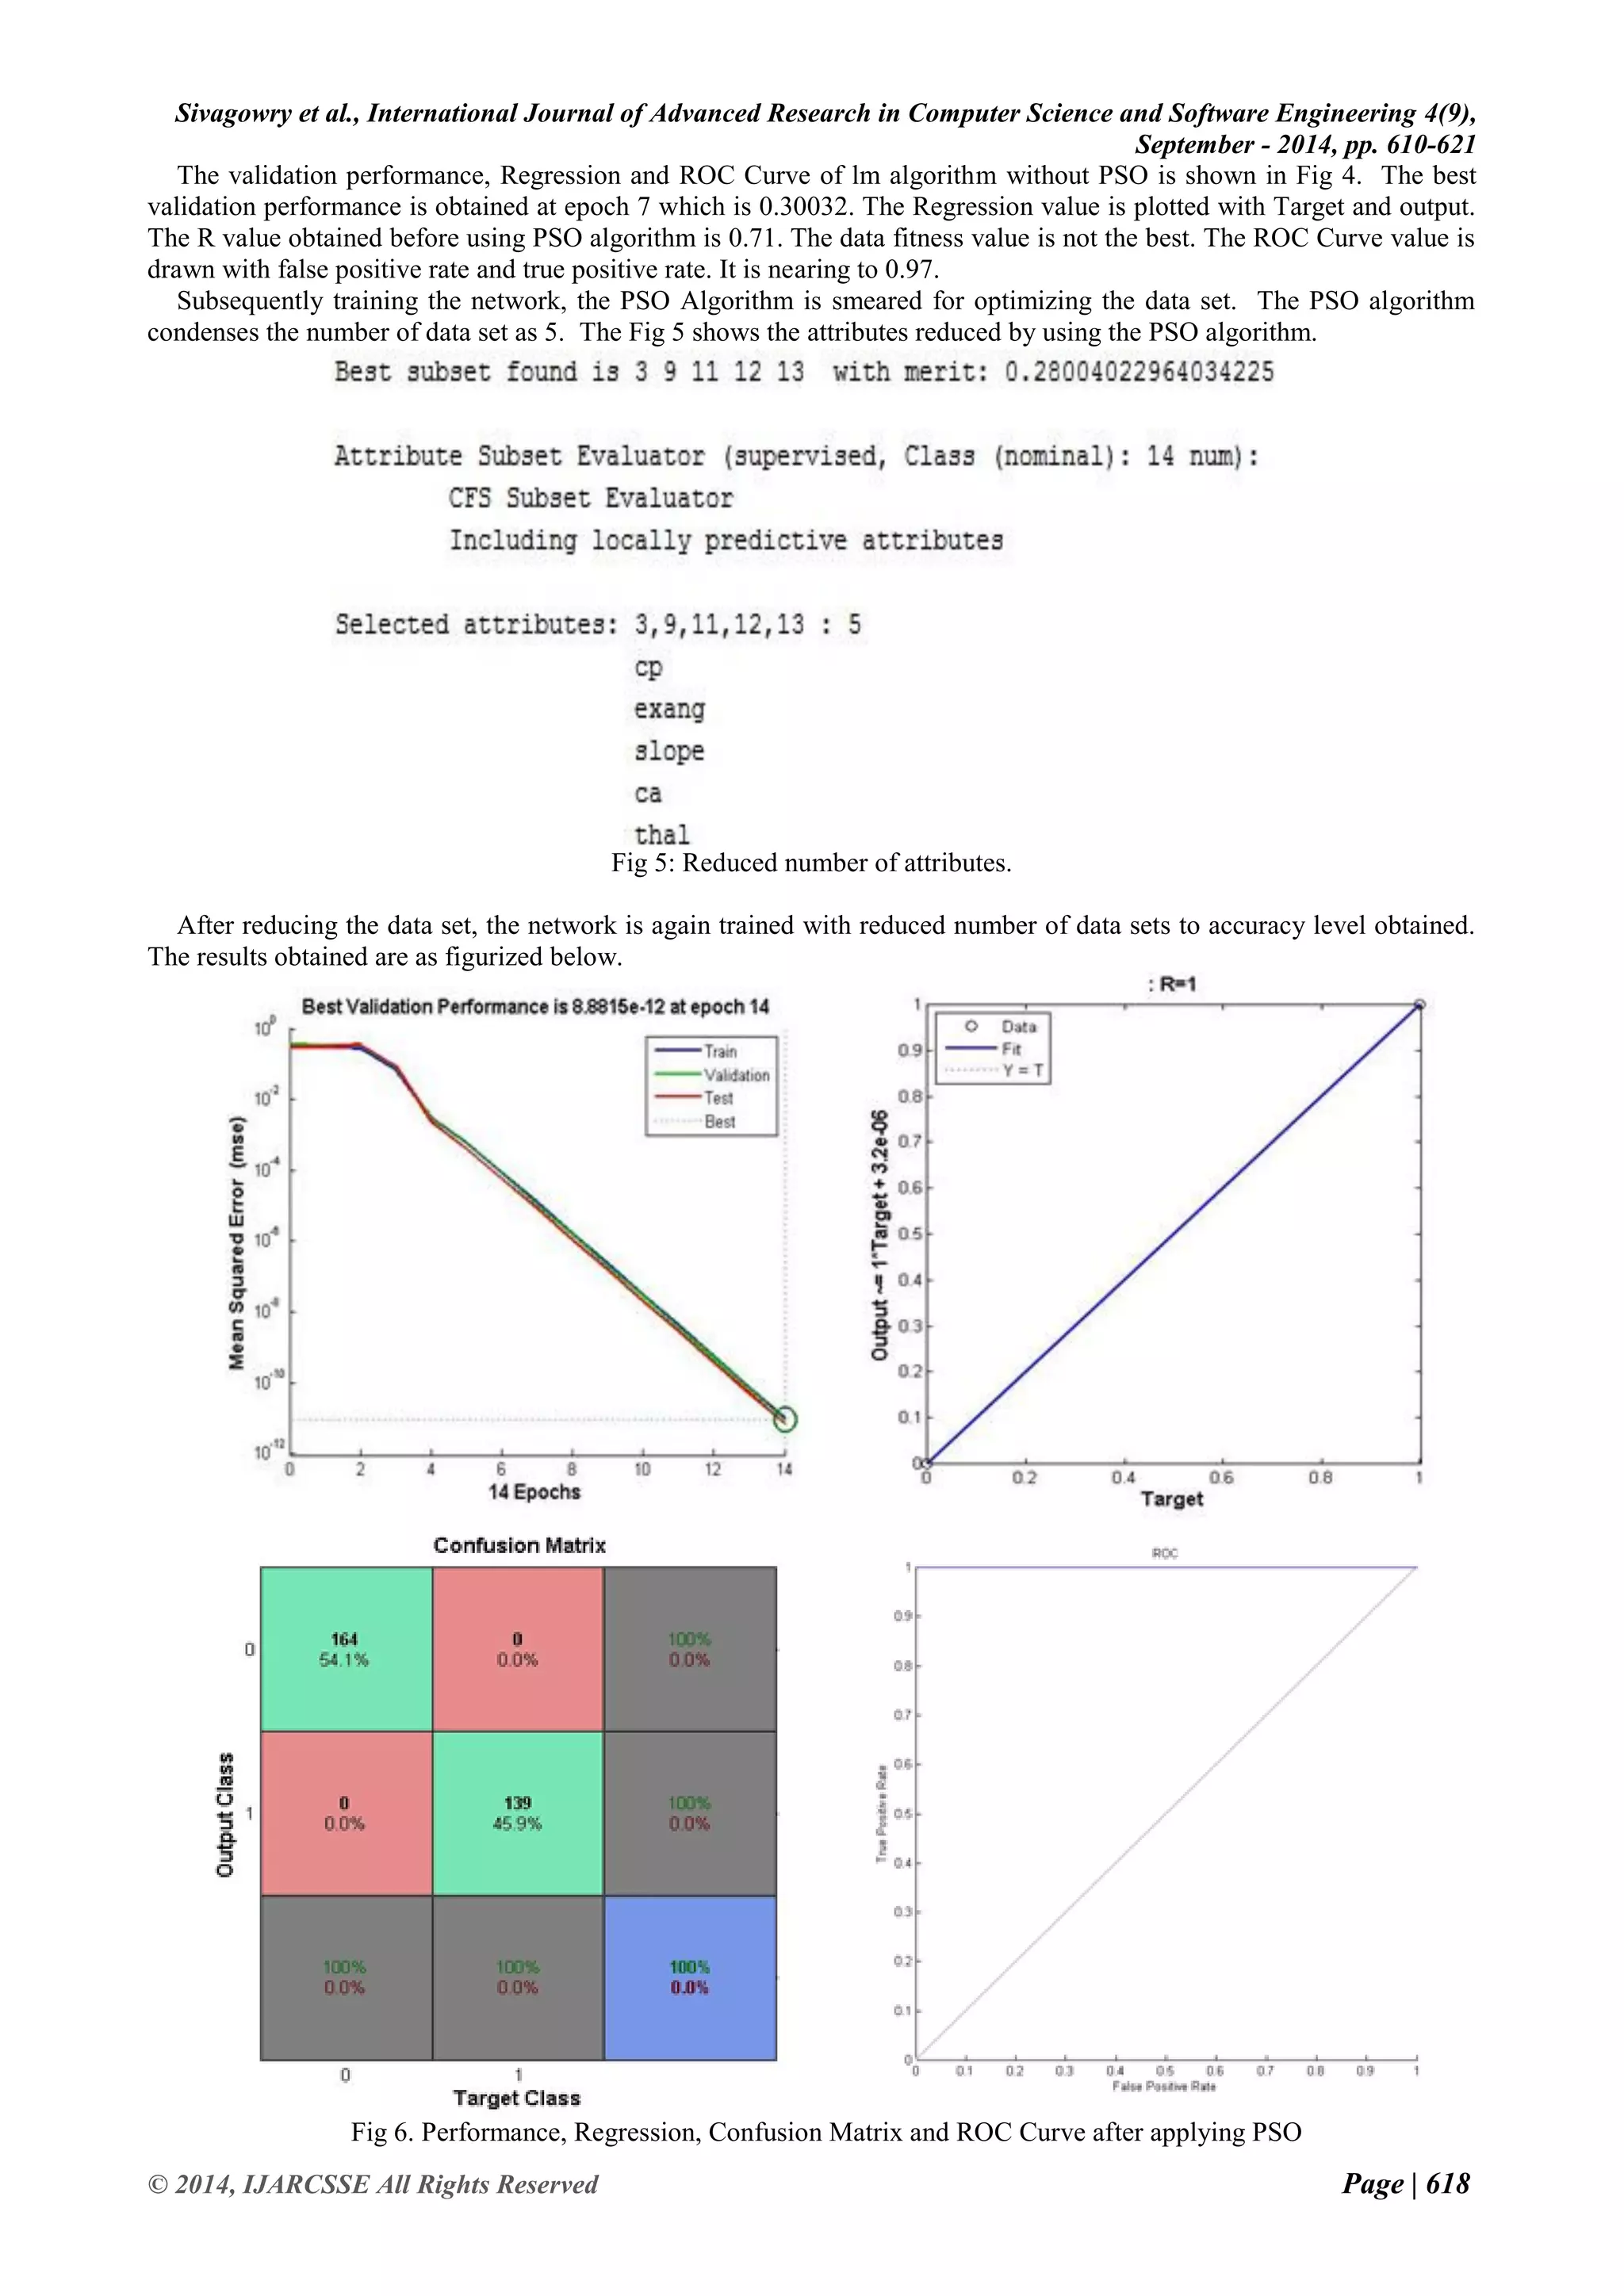
Prophesying heart disease by applying Data Mining techniques is the most exigent chore. After applying the PSO, it is found that the overall performance of the network is increased. The Levenberg-Marquardt algorithm yields promising results during the network training which takes the minimum time to train. In this work, reducing the number of attributes without affecting the accuracy is the problem taken to study. The Particle Swarm Optimization algorithm is taken to study. Removing and correcting all the boisterous data and extracting information from the medical data would help medical practitioners in many ways. From the experiments, it is observed that the PSO algorithm is very effective in pre-processing the medical data. The pre-processed data using PSO algorithm increases overall Network performances. To improve the prediction accuracy level further, hybridizing PSO with Rough Set theory may yield better result, which is the future direction of this work. In the future work, the experiments will be carried out with real time data set under concern medical investigators. REFERENCES
[1] Jabbar M.A., “Knowledge discovery from mining association rules for Heart disease Prediction”, JATIT, Vol 41(2), pp 166-174, 2012.
[2] Bhagyashree Ambulkar and Vaishali Borkar “Data Mining in Cloud Computing”, MPGINMC, Recent Trends in Computing, ISSN 0975-8887, pp 23-26,2012.
[3] www.nytimes.com/2009/07/29/opinim/29hall.html.
[4] K.Rajeswari, “Prediction of Risk Score for Heart Disease in India using Machine Intelligence”,IPCSIT, Vol 4, 2011
[5] Latha Parthiban and R.Subramanian, “Intelligent Heart Disease Prediction System using CANFIS and Genetic Algorithm”, International Journal of Biological and Life Sciences, Vol 3(3), pp157-160,2007.
[6] Liangxiao. J, Harry.Z, Zhihua.C and Jiang.S “One Dependency Augmented Naïve Bayes”, ADMA, pp 186-194, 2005.
[7] Huan Liu and Hiroshi Motoda, Rudy Setiono and Zheng Zhao. “Feature Selection: An Everlasting Frontier in Data Mining”, JMLR: The 4th Workshop on Feature Selection and Data Mining, 2010.
[8] Rafiah Awang and Palaniappan. S “Web based Heart Disease Decision Support System using Data Mining Classification Modeling techniques” , Proceedings of iiWAS, pp 177-187, 2007
[9] Carlos Ordonez, Edward Omincenski and Levien de Braal “Mining Constraint Association Rules to Predict Heart Disease”, Proceeding of 2001, IEEE International Conference of Data Mining, IEEE Computer Society, ISBN-0-7695-1119-8, 2001, pp: 433-440
[10] Deepika. N, “Association Rule for Classification of Heart Attack patients”, IJAEST, Vol 11(2), pp 253-257, 2011.
[11] Durairaj.M, and Meena.K” A Hybrid Prediction System using Rough Sets and Artificial Neural Network”, International Journal of Innovative Technology and Creative Engineering, Vol 1(7), July 2011.
[12] Sudha.A, Gayathri.p and Jaishankar. N “Utilization of Data Mining Approaches for prediction of life Threatening Disease Survivability”, IJAC (0975-8887), Vol 14(17), March 2012.
[13] Rafiah Awang and Palaniappan. S “Intelligent Heart Disease Prediction System Using Data Mining techniques”, IJCSNS, Vol 8(8), pp 343-350, Aug 2008.
[14] K. Raj Mohan, Ilango Paramasivam, Subhashini Sathya Narayanan, “ Prediction and Diagnosis of CVD- A Critical Survey”, World Congress in Computing and Communication Technologies, pp 246-251, 2014.
[15] Deepthy.S and Aswathy Rajkumar, “Computation Methods for the Diagnosis and Prognosis of Heart Disease”, IJCA, Vol 95 (19), pp 5-9, June 2014.
[16] World Health Organization. Strategic priorities of the WHO Cardiovascular Disease programme. Available online at URL: http://www.who.int/whr/200. Last accessed February 2006.
[17] Chen A.H., “HDPS: Heart Disease Prediction System”, Computing in Cardiology, ISSN 0276-6574, pp 557- 560, 2011.
[18] en.wikipedia.org/wiki/myocardial_infarction
[19] Nidhi Bhatia and Kiran Jyothi, “A Novel Approach for heart disease diagnosis using Data Mining and Fuzzy logic”, IJCA, Vol 54(17), pp 16-21, September 2012.
[20] Rafiah Awang and Palaniappan. S “Intelligent Heart Disease Prediction System Using Data Mining techniques”, IJCSNS, Vol 8(8), pp 343-350, Aug 2008.
[21] Amir Aditya, “Learning Algorithm for Neural Network”, Ph.D Thesis, 1991.
[22] Ms. Preethi Gupta, Putinam Bajaj, “ Heart Disease Diagnosis based on Data Mining and Neural Network”, IJESRT, pp 172-176, June 2014.
[23] Punam Bajaj and Prethi Gupta, “ Review on Heart Disease Diagnosis based on Data Mining Techniques”, IJSR, Vol. 3 (5), pp 1593-1596, May 2014.
[24] Alper unler, Alper Murat and Ratna Babu Chinnam, “m2PSO: A maximum relevance minimum redundancy feature selection method based on Swarm Intellignce for SVM Classification”, Elsevier, 2011, pp 4625-4641.
[25] Xiangyang Wang, Jie Yang, Xialong Tens and Weijan Xia, Richard Jension, “ Feature selection basedon Rough Set and Particle Swarm Optimization”, Pattern Recognition Letters, 2007, pp: 459-471.
[26] Subhagata Chatropadhyay, “Mining the risk of heart attack : A comprehensive study”, International Journal of BioMedical Engineering and Technology, Vol 1(4), 2013.](https://image.slidesharecdn.com/ijarcsse-141024051707-conversion-gate02/75/PSO-An-Intellectual-Technique-for-Feature-Reduction-on-Heart-Malady-Anticipation-Data-11-2048.jpg)
![Sivagowry et al., International Journal of Advanced Research in Computer Science and Software Engineering 4(9),
September - 2014, pp. 610-621
© 2014, IJARCSSE All Rights Reserved Page | 621
[27] Yuanning Liu, Gang Wang, Huiling Chen, Hao Dong, Xiaodong Zhu andSujing Wang “ An improved Particle Swarm Optimization for Feature Selection”, Journal of Bionic Engineering, Vol 8(2), 2011.
[28] Xiangyang Wang, Jie Yang, Xialong Tens and Weijan Xia, Richard Jension, “ Feature selection basedon Rough Set and Particle Swarm Optimization”, Pattern Recognition Letters, 2007, pp: 459-471.
[29] Ismail Babaoglu, Oguz Findik, Erkan Ulker and Nazef Aygul, “ A Novel Hybrid Classification Method with PSO and K-nn algorithm for diagnosis of Coronary artery disease using exercise stress test data”, International journal of Innovative Computing, Volume 8(5), May 2012.
[30] Benxian Yue, Weihong Yao, Ajith Abraham and Hongbo Liu, “ A New Rough Set Reduct Algorithm based on Particle Swarm Optimization”, IWINAC ’07, LNCS 4527, pp 397-409, © Springer Verlog, 2007.
[31] Alper unler, Alper Murat and Ratna Babu Chinnam, “m2PSO: A maximum relevance minimum redundancy feature selection method based on Swarm Intellignce for SVM Classification”, Elsevier, 2011, pp 4625-4641.
[32] Xiangyang Wang, “Feature Selection based on Rough Sets and Particle Swarm Optimization”, Elsevier, Volume 4(1), March 2007.
[33] Mona Nagy Elbedwedhy, Hossam M.Zawbaa, Naveen Ghali and About Ella Hassanien, “ Detection of Heart Disease using Binary Particle Swarm Optimization “, Proceedings of Federated Conference on Computer Science and Information System, pp 177-182, © IEEE, 2012.
[34] Annoj P.K.,” Clinical decision support system: Risk level prediction of heart disease using Data Mining Algorithms”, Journal of King Saud University- Computer and Information Sciences, 2012, pp 27-40.
[35] Asha Rajkumar and Mrs. Sophia Reena, “Diagnosis of Heart Disease using Data Mining Algorithms”, Global Journal of Computer Science and Technology, vol. 10(10), 2010, pp 38-43.
[36] Chaltrali S. Dangare and Sulabha, “Improved Study of Heart Disease Prediction System using Data Mining Classification Techniques”, IJCA, Vol 47(10), pp 44-48, June 2012
[37] R. Setthukkarase and Kannan “An Intelligent System for mining Temporal rules in Clinical database using Fuzzy neural network”,European Journal of Scientific Research, ISSN 1450-216, Vol 70(3), pp 386-395, 2012.
[38] Chen A.H., “HDPS: Heart Disease Prediction System”, Computing in Cardiology, ISSN 0276-6574, pp 557- 560, 2011.
[39] Piyqwqk Jeatrakul, Kok Wai Wong and Chun Che Fung, “Using MisClassification Analysis for Data Cleaning”, International Workshop on Advanced Computational, Intelligence and Intelligent Informatics, Tokyo, 2009.
[40] Jyothi. S, Ujma.A, Dipesh. S and Sunita. S “Predictive Data Mining for Medical Diagnosis: An Overview of Heart Disease Prediction”, IJCA, Vol 17(8), pp 43-48, March 2011.
[41] K.Rajeswari, “Prediction of Risk Score for Heart Disease in India using Machine Intelligence”, IPCSIT, Vol 4, 2011.
[42] UCI machine learning repository: http://archive.ics.uci.edu/ml/datasets/Heart+Disease: Last visited 8th August, 2014.
[43] Sivagowry.S, Durairaj.M, Persia.A, “An empirical study on applying Data Mining Techniques for the analysis and prediction of heart Disease”, ICICES, pp 265-270, Feb 2013.](https://image.slidesharecdn.com/ijarcsse-141024051707-conversion-gate02/75/PSO-An-Intellectual-Technique-for-Feature-Reduction-on-Heart-Malady-Anticipation-Data-12-2048.jpg)


![[IJCT-V3I2P26] Authors: Sunny Sharma](https://cdn.slidesharecdn.com/ss_thumbnails/ijct-v3i2p26-160609063241-thumbnail.jpg?width=640&height=640&fit=bounds)


