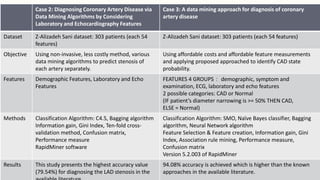
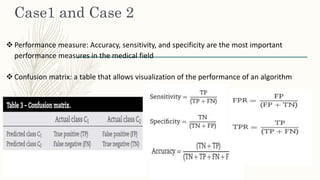
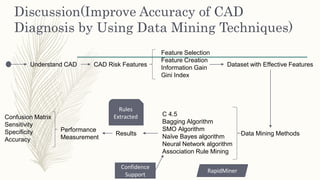
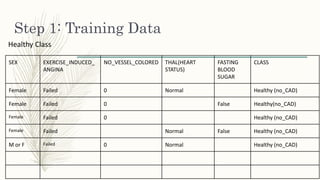
The document discusses using data mining techniques to diagnose coronary artery disease (CAD) through three case studies. Case 1 uses association rule mining on the Cleveland dataset to identify risk factors for CAD. Case 2 uses decision trees and bagging algorithms on laboratory and echocardiography features to diagnose CAD. Case 3 applies classification algorithms like SMO and Naive Bayes as well as feature selection and creation to the Z-Alizadeh Sani dataset to predict artery stenosis. The studies demonstrate how data mining can effectively analyze medical data and extract rules to diagnose CAD.

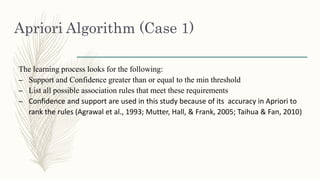
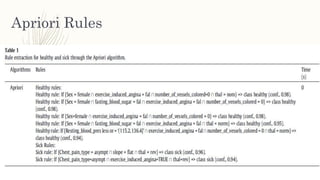
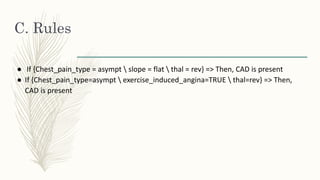
![C. Rules
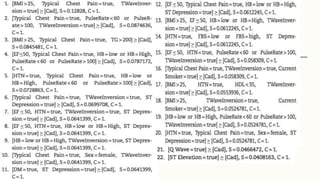
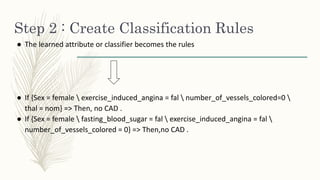
● If {Sex = female fasting_blood_sugar = fal exercise_induced_angina = fal thal =
norm} => Then, no CAD
● If {Resting_blood_pres less or = ‘(115.2, 136.4]’ exercise_induced_angina = fal
number_of_vessels_colored = 0 thal = norm} => Then, no CAD
● If {Sex=female exercise_induced_angina = fal number_of_vessels_colored = 0} =>
Then, no CAD](https://image.slidesharecdn.com/dataminingtechniquesonheartfailurediagnosis-161124180325/85/Data-mining-techniques-on-heart-failure-diagnosis-18-320.jpg)