1. An observation is using your senses to take in details without forming conclusions, while an inference is forming a conclusion based on observations.
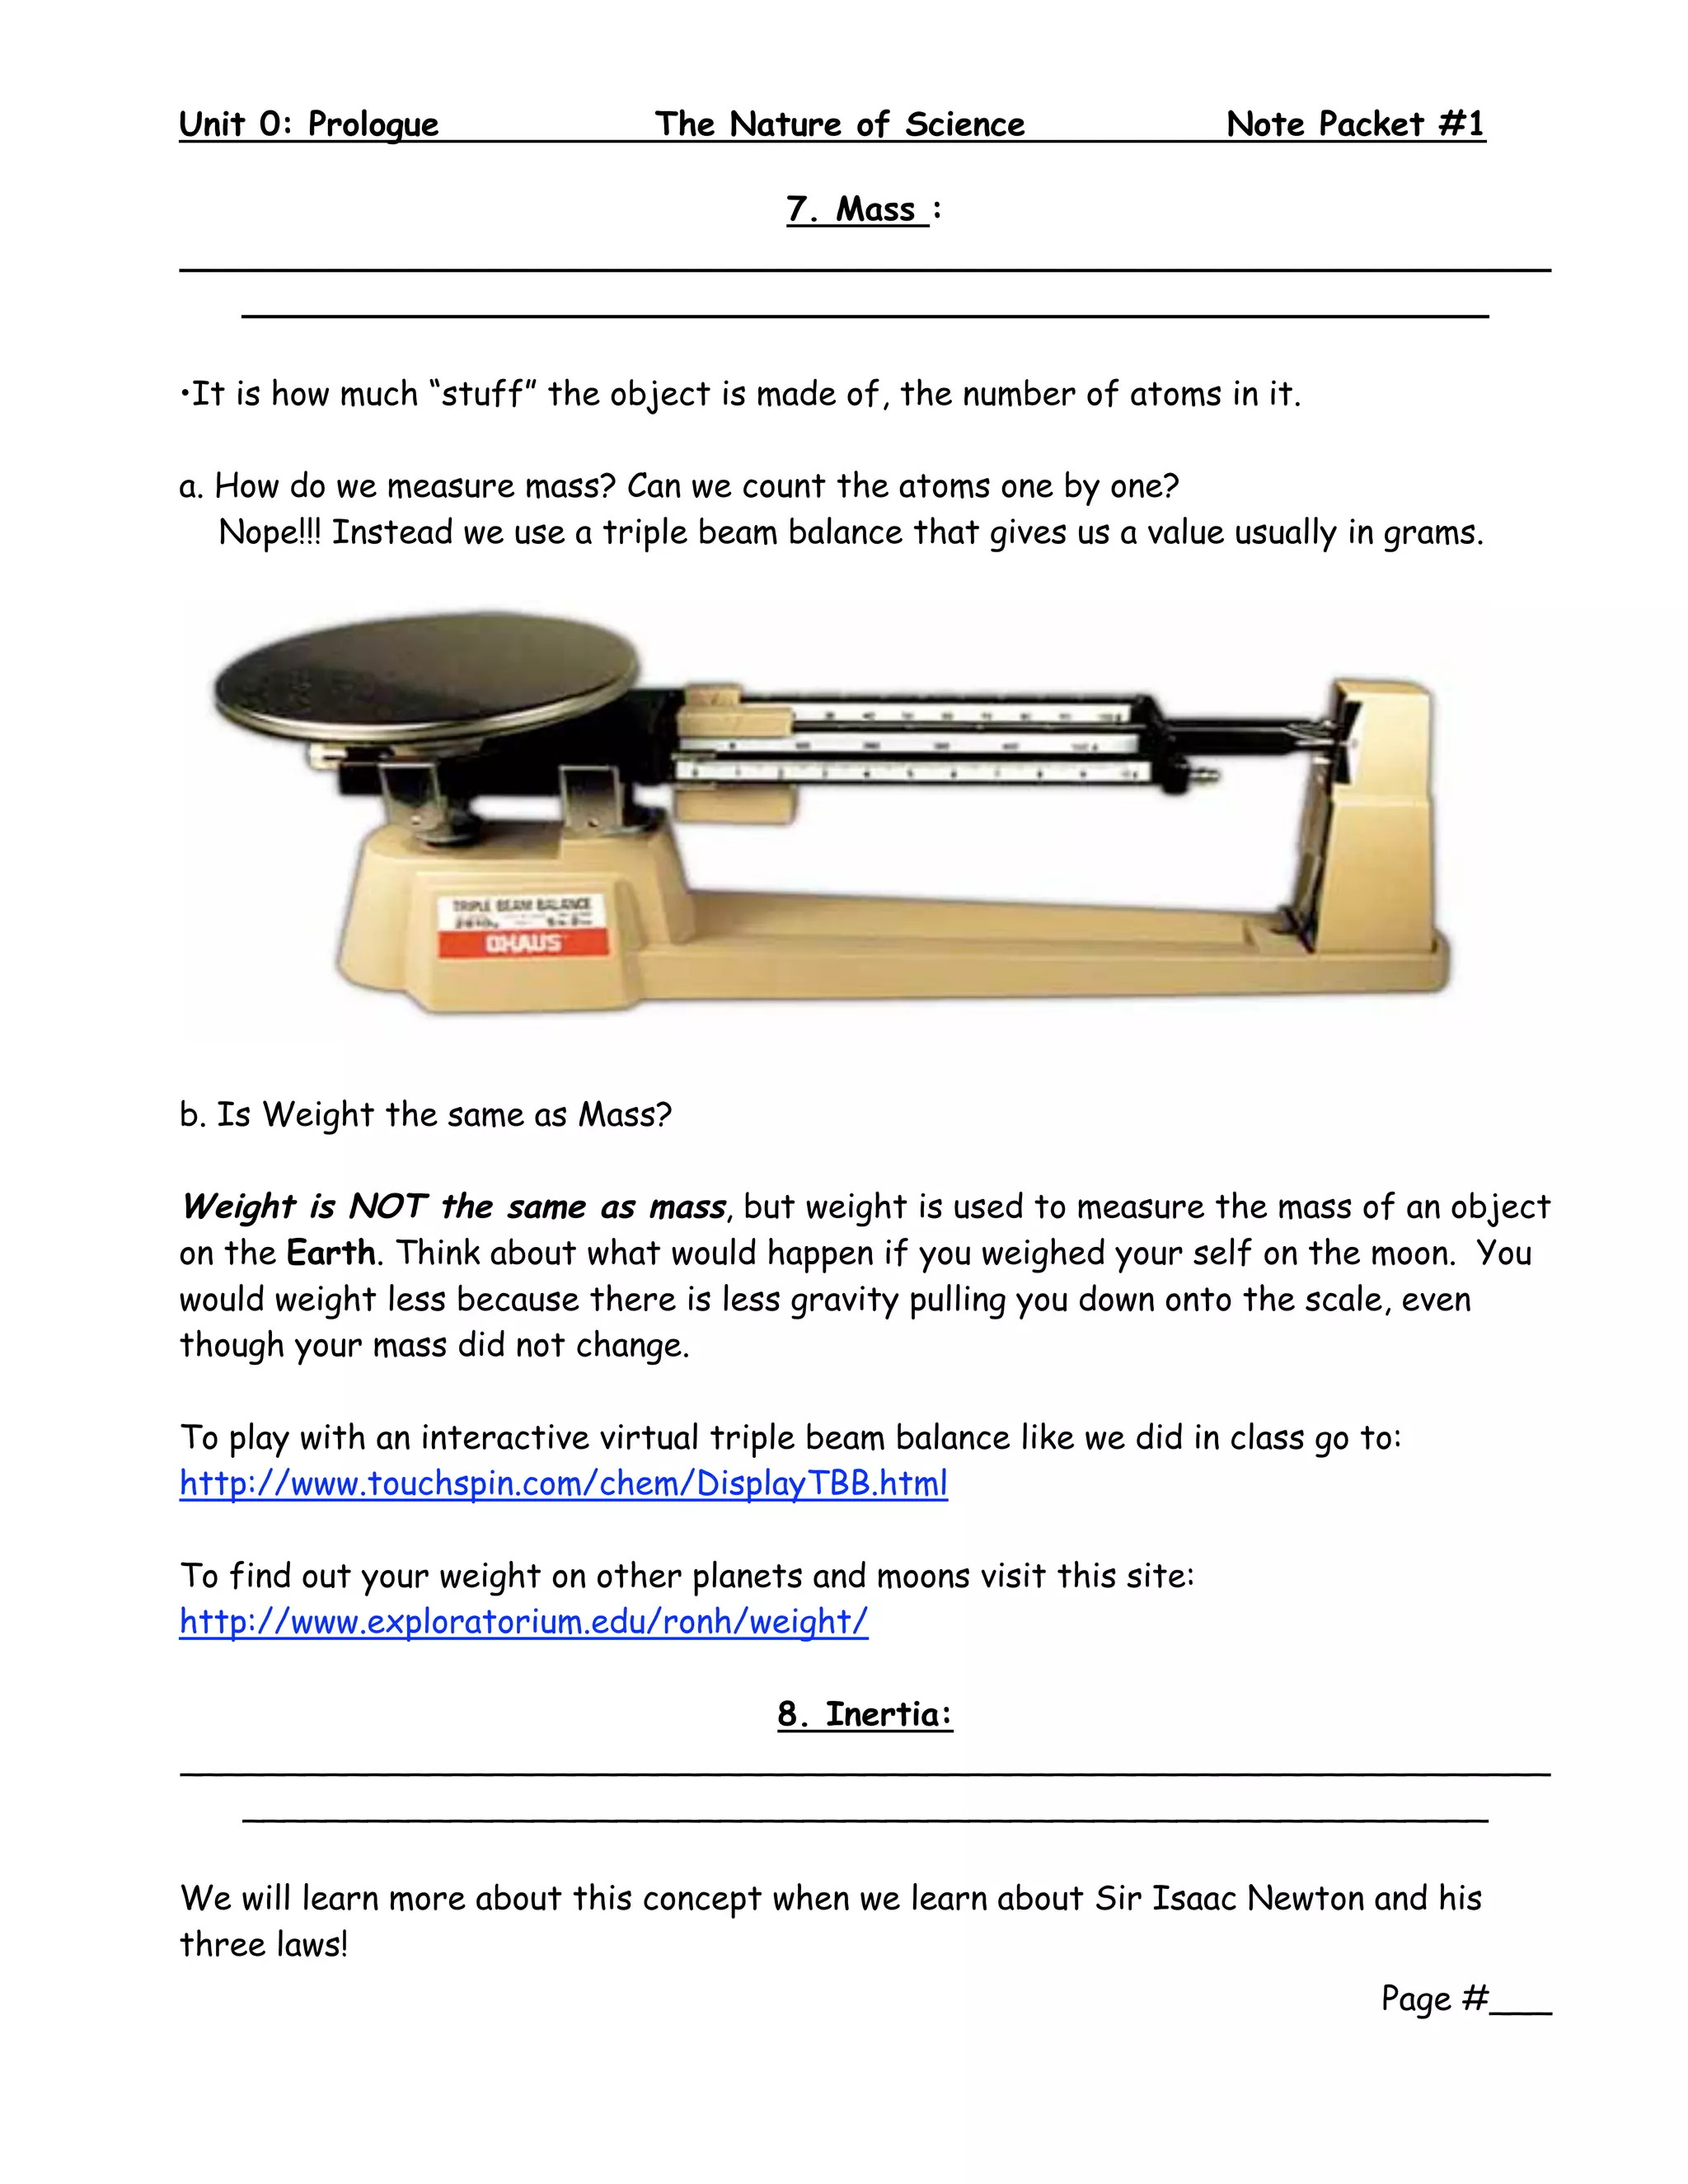
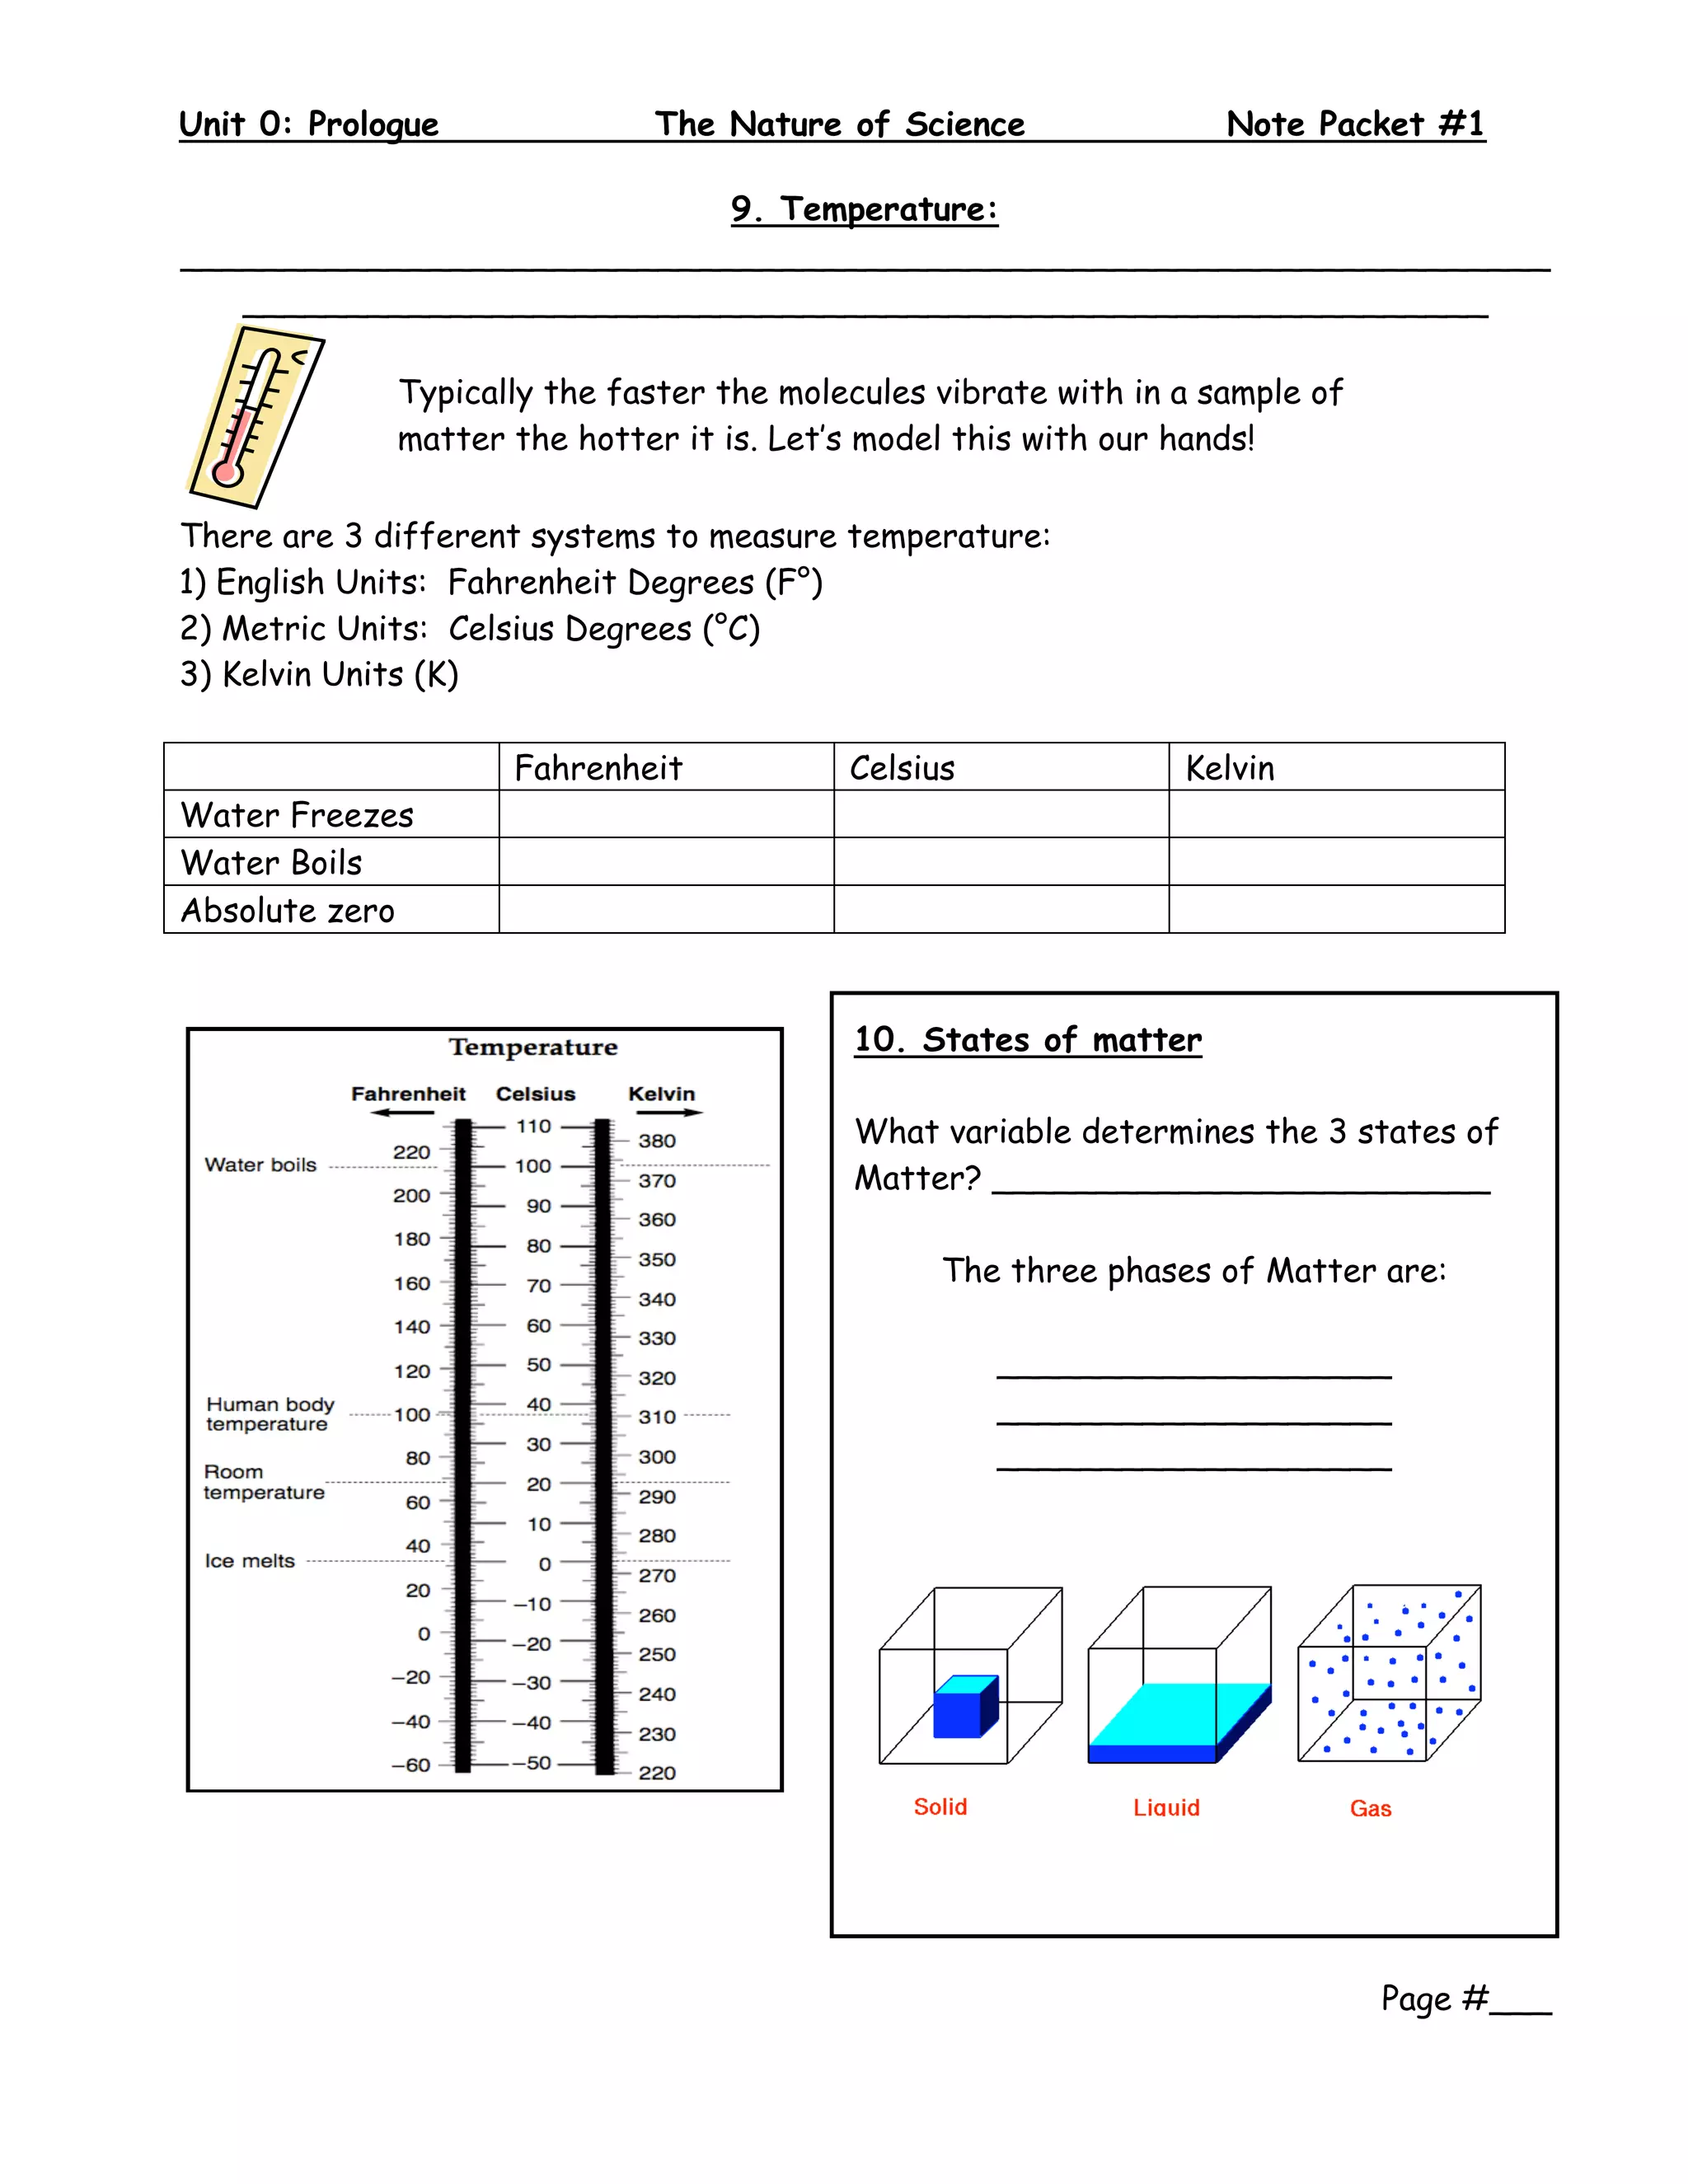
2. The document provides examples and definitions for key scientific concepts like classification, measurements using tools like rulers and thermometers, and states of matter being solid, liquid, or gas depending on molecular motion.
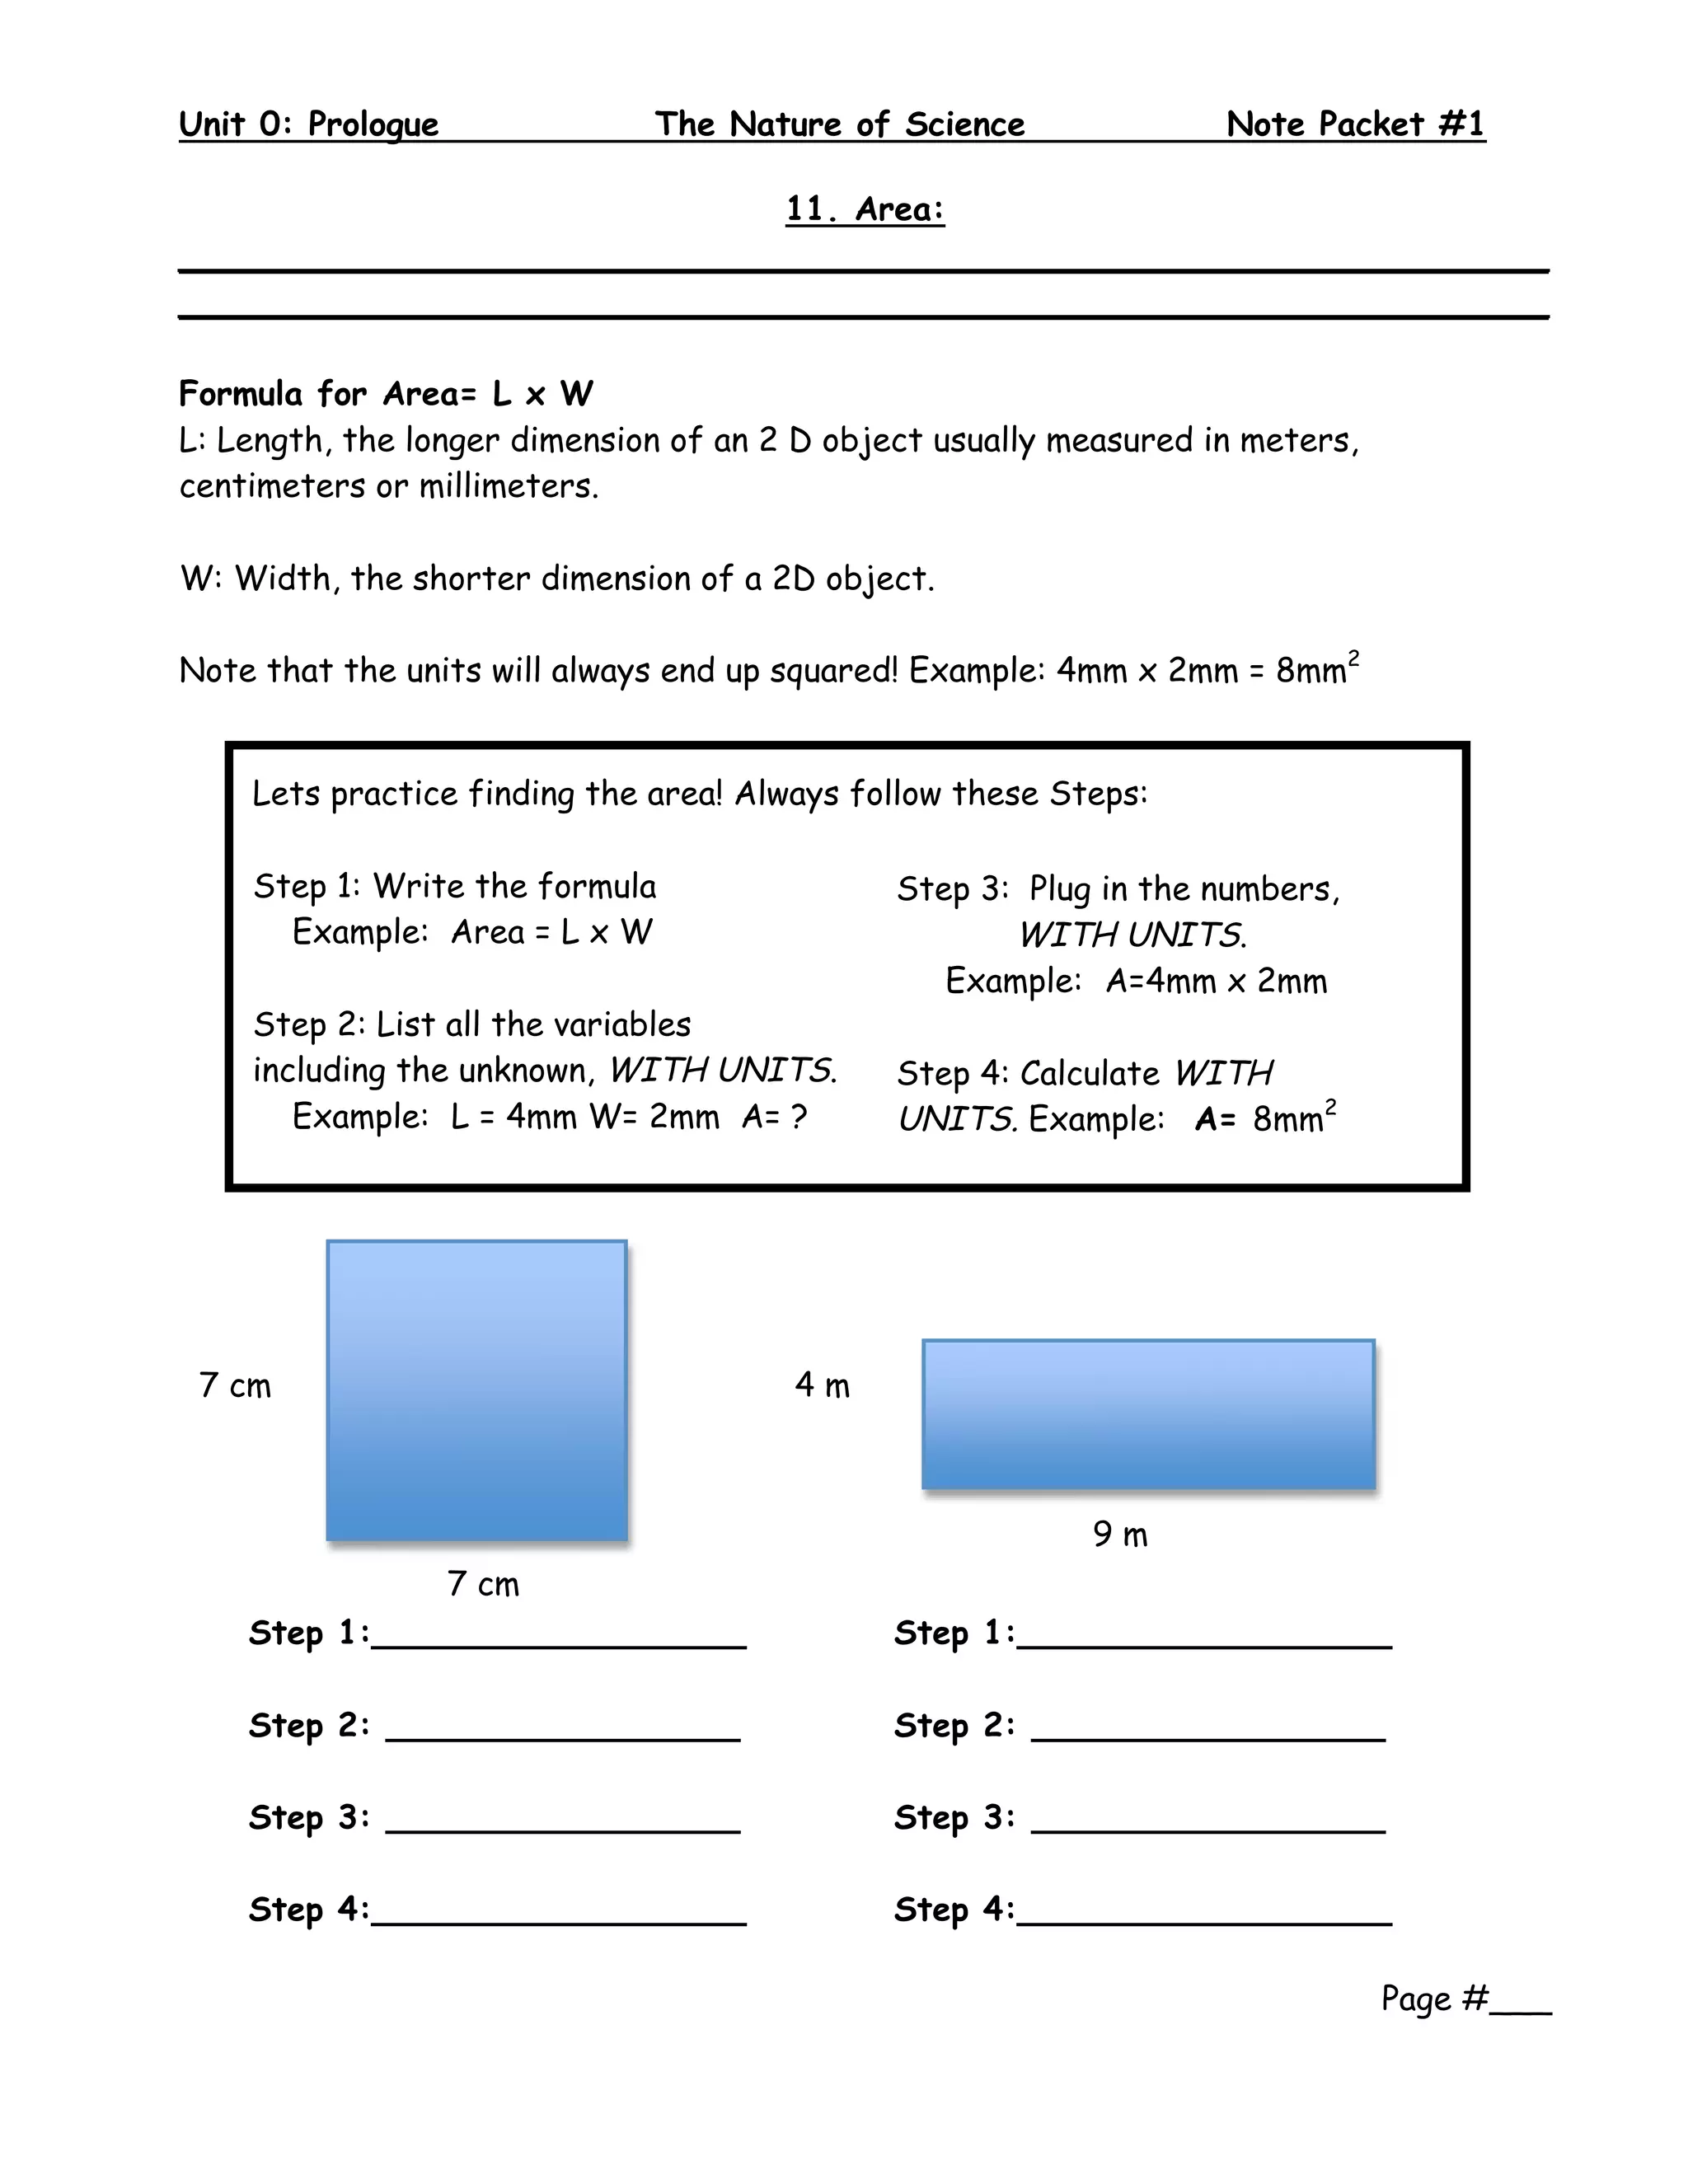
3. Formulas are given for finding area by multiplying length by width, with practice problems provided to work through the steps.