Downloaded 402 times

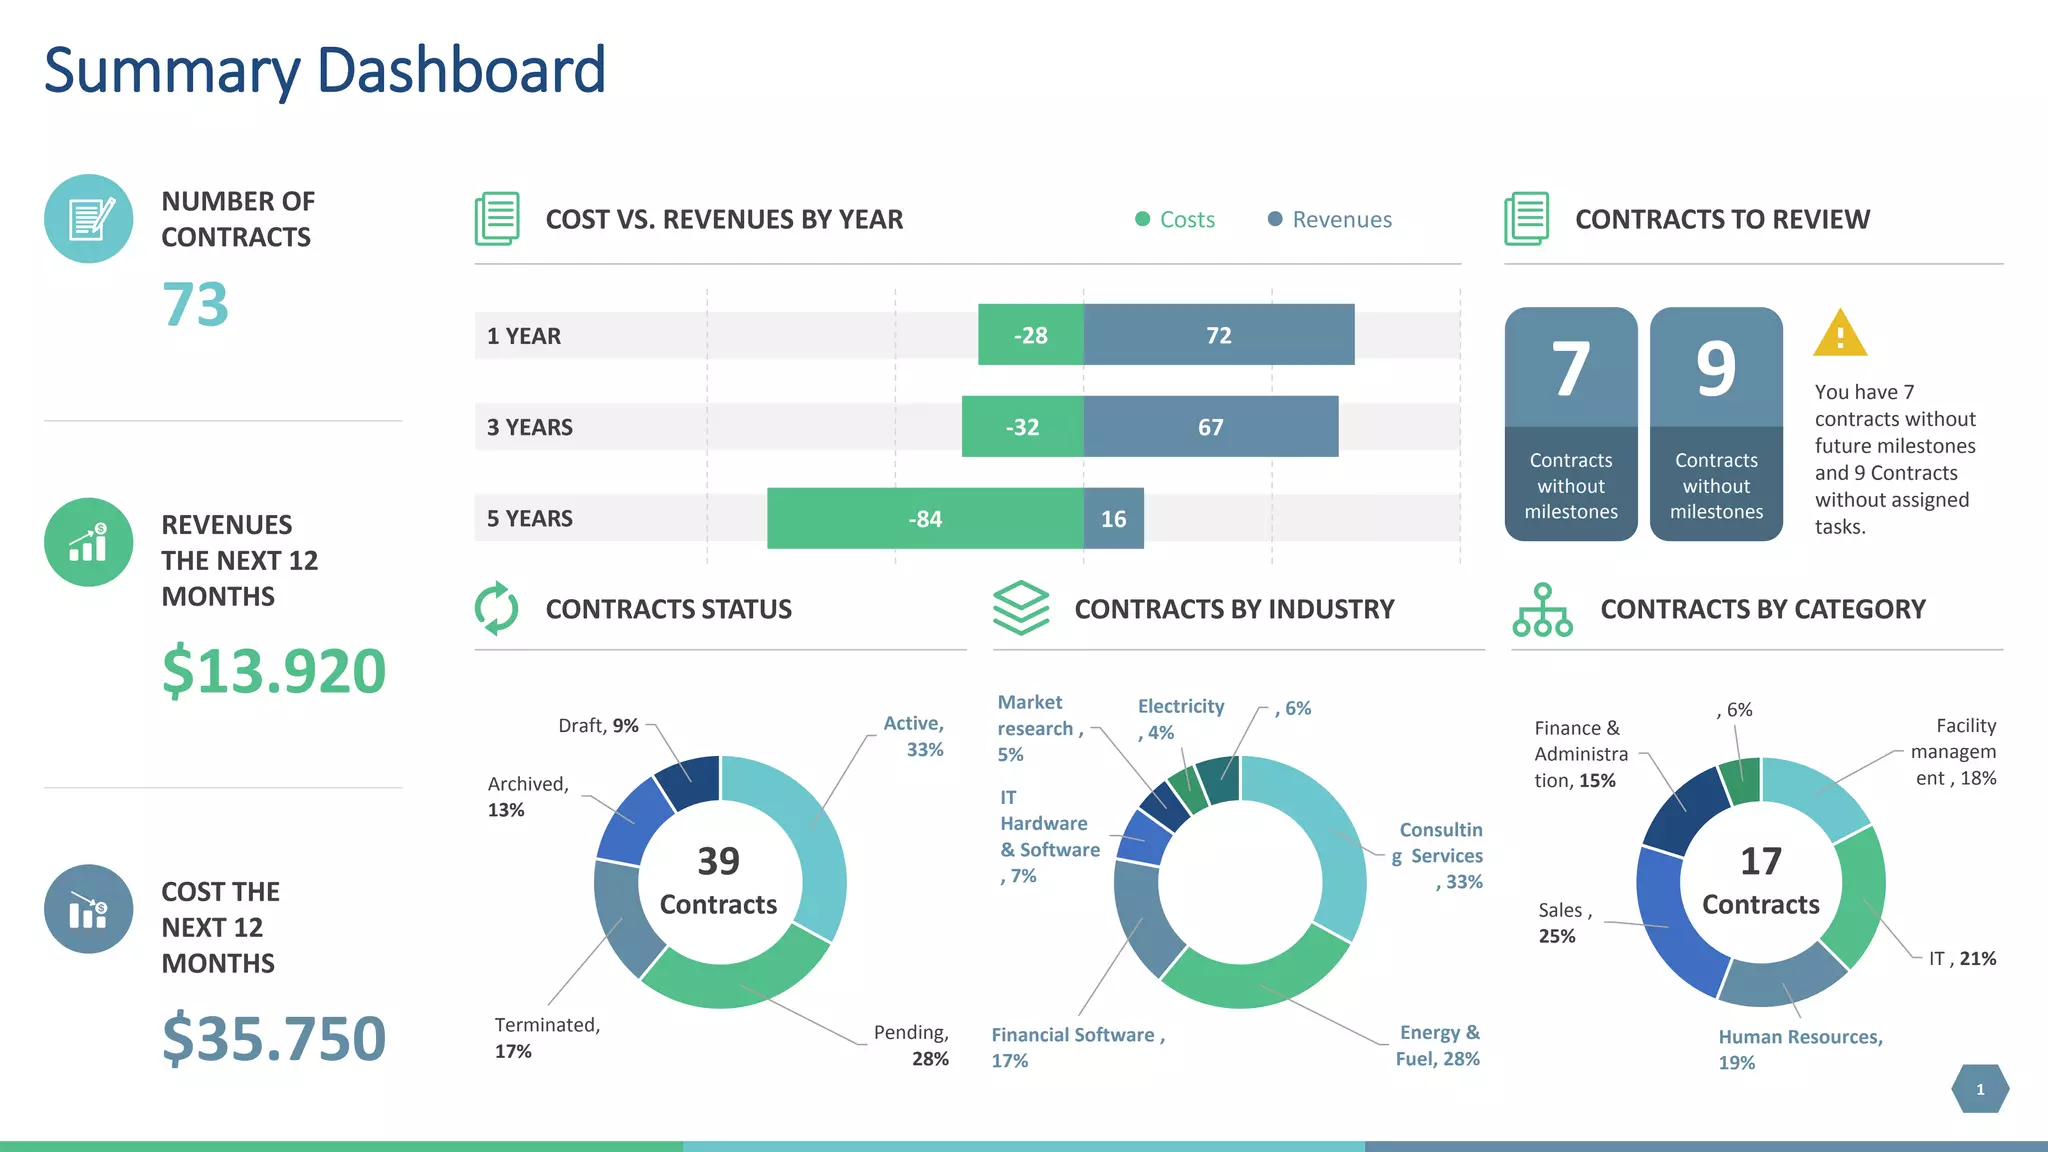


The document is a summary dashboard that provides an overview of contracts and their performance. It shows that there are currently 73 contracts worth $13.9 million in revenue over the next 12 months but costing $35.7 million over the same period. It also indicates that there are 7 contracts without future milestones and 9 contracts without assigned tasks that require review. The contracts are spread across different industries and categories.