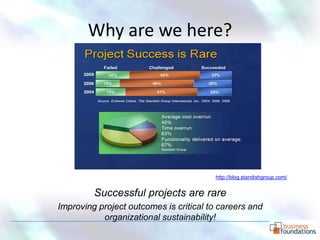
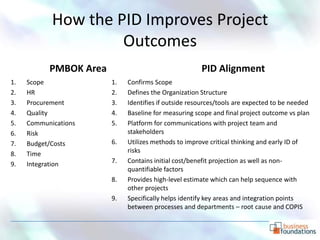
Problem-Solving 101

   Initiating Projects
Background and Expectations
• Active engagement increases learning and outcomes
   – Ask questions!


• The material presented should be considered an
  outline, a framework
   – It will need adaptation to match your specific organization’s needs


• Continuous improvement applies to all areas of a
  business
   – The concepts presented have been refined over 15 years
   – Feedback on what works/doesn’t work for you is requested!
Why are we here?


                                        http://blog.standishgroup.com/


         Successful projects are rare
Improving project outcomes is critical to careers and
           organizational sustainability!
What’s the Problem?
• Organizations continue to increase integration of
  processes, technologies and staff roles in the name of
  “do more with less”

• As organizations increase integration, understanding
  the relationships between roles, technologies and
  processes become complicated
   – Defining root-cause problems and project dependencies
     becomes highly complex

• Result – Projects are initiated and scope, budgets and
  timelines modified in-flight
What’s the Solution?
• Focus efforts on the front-end stages of a project and ensure the project
  team, leadership and stakeholders understand the problem
    – In the front-end of a project fewer resources are engaged, it’s easier to change direction
      and the cost impact is minimized


• Having a standard framework with templates, methods, and tools helps
  organizational learning and outcomes
    – Adopting a standard template to communicate project goals, scope, organization, etc. is
      a basis for continuous improvement
    – Individuals and teams can be trained on use of tools to improve skills
    – Teams can benefit by using checklists to help ensure comprehensive understanding of
      organizational needs before initiating and planning a project


Note: Templates need to be adapted for each company; organizations vary in
use of terminology, critical focus areas (risk, budget, …), etc.
Before you climb the ladder….. make
sure it’s leaning against the right wall!


  Today’s presentation is focused on the project initiation
Use of a Project Initiation Document
      (PID) can help reduce risk
• The contents provide a checklist to ensure critical
  project areas are considered during planning

• Quality Management methods and “lean” tools
  can help by increasing rigor in identifying root-
  cause problem and defining scope
   – The “Five-Why’s” method is often helpful getting input
     from a range of team members
   – Fish-bone and SIPOC/COPIS tools are proven to be
     effective to decompose processes and understand
     dependencies
Templates need to be adapted for your
            organization


                                                  PMBOK – 4th Edition


  Leading practice is to consider all project management areas
Sample Template – PID
         (Project Initiation Document)
• Initial sections define the business problem, its impact and the
  project objective
    – QM tools are leveraged through-out the template to ensure teams
      focus on eliminating non-value added activities.

• After the problem is defined, the scope of the solution is confirmed
  and “ideal-state outcomes” are defined
    – Focusing on the future, “ideal-state” establishes a vision which is
      helpful in managing organizational change

• With the business problem and ideal state solution defined, the
  basis is set for risk identification and business case development
    – Identify the costs associated with the problem
    – Identify the benefits of the ideal state process helps
    – Include quantifiable and non-quantifiable costs and benefit
Contents
•   Problem Statement and Impact
•   Project Objective
•   Ideal State Process
•   COPIS
•   Scope
•   Risks and Dependencies
•   Project Organization Structure
•   High-level Timeline
•   Business Case
Problem Statement
                                   •   The problem statement identifies the current pain and
                                       challenges it creates for the organization
Problem
• Development of product (services) roadmaps is inconsistently performed across
   different functions

Impact
• Lack of a road-mapping process is inhibiting revenue growth and eroding value
    –   We are too slow to vet and commercialize our very best ideas
    –   We are failing to make big, bold bets and instead fragment resources on sub-scale improvements
    –   We fail to update roadmaps when plans change
    –   We lack tight coordination across initiatives resulting in confusion and waste; half-hearted initiatives
        that go nowhere, duplicative work, reinventing the wheel and lack scale advantages
    –   We lack consistent roadmap formats – roadmaps have various timelines
    –   We’re unable to prioritize across roadmaps because lack of standard format creates communications
        problems across the groups
                                                    •   Outlining the impact of the problem helps
                                                        ensure department and process complexities
                                                        are understood
Root Cause Diagram
                                                    • Facilitate meetings to decompose
                                                      problem and understand scope

                                                    • Use Root-Cause tools (Ishaikawa)
                                                      to visualize relationships


Note: Use the template available in Visio, simple to prepare
Project Objective Statement
• Design and implement a corporate-wide
  standard business process for managing
  and presenting roadmaps across
  Regions, and business areas
  (services, products, etc.) to deliver 30-35%
  faster output
  – In parallel with business process design, select
    IT Tools needed to automate the common
    business process for roadmap development
           •   Objective statements communicate the criticality of the project
               and impact to the organization
Ideal State Process
• The product roadmap is the front-end of the Phase
  Management Planning process and is the essential element in
  translating the business strategy into major programs to be
  pursued. The output is reviewed in a meeting that is
  conducted every 3-4 months. Marketing “owns” the Planning
  process and leads the meeting.
• In each meeting the overall product portfolio is reviewed as
  well as the man-power and development capacity needed to
  meet the target dates.
                   •   Develop an ideal state definition to set the end-state
                       vision, success criteria and helps with organizational change
                       management
Use COPIS/SIPOC* to identify
      customer and supplier processes


In this example, the focus is processes involved in road map development
(AKA, the problem)

                             * Customer-Output-Process-Input-Supplier, Or Supplier-Input-Process-Output-Customer
Sample Cascading COPIS
     Supplier (s)             Inputs               Process               Outputs            Customer (s)

                      Voice of Customer        Phase Management     Resource Balanced Outbound Marketing
Customer
                      Requirements                  Process             Portfolio     and Sales

                                                                  Updated Portfolio
Inbound Marketing     Product Roadmap                                                   Inbound Marketing
                                                                  Roadmap


                                                                  Approved and funded Phase Management
R&D Engineering       Strategic Technologies
                                                                  development projects Plan


     Supplier (s)             Inputs               Process               Outputs            Customer (s)

Service and Product   Portfolio of              Product/Service   Resource Balanced        Phase Management
strategy              Proposed Projects            Roadmaps       Portfolio – LOB specific        Plan


Competitor Actions    VOC and Customer                             Integrated Roadmap – Capacity Planning and
and Offerings         Experience data                             cross LOB             portfolio selection

                      Cost/ Revenue                                                     C/V/P models
                      projections for each                                              projecting cost and
Customer Input
                      project                                                           revenues from new
                                                                                        products
Scope
                                    •   Scope has multiple dimensions;
                                        defining the areas helps ensure
                                        completeness and can be used
• Geographic Scope                      as a check-list

  – Which regions and/or design centers are included

• Functional Scope
  – Which business functions and processes are included

• Technical Scope
  – Which IT Systems are included
Scope Is/Is Not
                                    •   Including a definition of
                                        what is and is not in scope
             Is                         Is Not
                                        drives out ambiguity

• Detailed list of specific   • Detailed list of specific
  items to be addressed         items NOT to be
                                addressed
Solution Approach
•   Define business process and requirements
•   Evaluate current processes and tools
•   Review and confirm VS fit with requirements
•   Finalize Cost/Benefit/ROI model
•   Pilot Solution in one area
•   Refine implementation plan to align with IT Implementation
    of VS and roll-out
                  •   Development of a solution approach early in a project requires the
                      team to consider all areas needed – reducing risk of future surprises.

                  Note: Detailed project plans are required, these are created in later steps
Risk and Dependencies
                 Risks                                       Dependencies
               (Process and Tool)                                (Process and Tool)

• Identify risks that would limit the          • Identify up-stream or down-
  success of the ideal state                     stream dependencies in either
                                                 business processes or tools
• Identify risks that would impact
  the expected benefit                         • Identify external dependencies
                                                 (software
                                                 providers, suppliers, etc)


           •   Definition of risks and dependencies ensures the team considers
               challenges that may develop; risks that are identified can be
               planned for in schedule and budget
Project Organization Chart
                              Business Sponsor
                                    TBD    • Preliminary definition of the project
                                                   team structure and resource needs
                                                   and can help reduce contention for
                                                   resources.

                                               •   Additionally, outside resource needs
                   Project Manager                 are identified which help with
                         TBD                       business case development


     Process Design Team       VS Configuration                Implementation
        Consumer SBU                Team                            Team
         Service SBU            Consumer SBU                   Consumer SBU
                                 Service SBU                    Service SBU

p.
21
Project Timeline – TBD (Depends on scope and resources)

                            Q1             Q2              Q3               Q4


Bus. Case Approval
Project Planning
Product Configuration
Testing and Training
Pilot Deployment
Company-wide rollout

                        •    Understanding scope and resources a preliminary schedule can
                             be developed.

                        •    The schedule can help set/manage expectations and drive
                             discussions on trade-offs involving budget/resources (if needed)
Business Case
                                        One Time                                                     Benefit         One Time Benefits                                 Recurring Fees
          Cost Categories                                          Recurring Fees
                                          Fees                                                                                                               Yr1      Yr2         Yr3       Yr4
Software Costs                                           Yr1       Yr2      Yr3         Yr4     Increased Efficiency
                                                                                                                Manual Process
          Application Software          $ 100,000    $ 17,000 $ 17,000 $ 20,000 $        25,000                 Elimination                 $    -        $ 20,000 $ 100,000 $ 300,000 $ 500,000
                                                                                                                Cycle-time reduction        $    -
          Database Software             $ 25,000     $ 4,250 $ 4,250 $ 5,000 $            6,250
                                                                                                                Other (decribe below)       $    -
          Additional 3rd Party
                                        $    5,000   $     850 $     850 $ 1,000 $        1,250                   Subtotal                  $        -    $ 20,000 $ 100,000 $ 300,000 $ 500,000
          Software
             Subtotal                   $ 130,000    $ 22,100 $ 22,100 $ 26,000 $        32,500
                                                                                                Headcount Reduction
Hardware Costs                                                                                               Austin                         $    -        $ 100,000
         Application Server             $   50,000   $ 2,500 $ 5,000 $ 7,500 $           12,500              Design Centers                 $    -                  $ 250,000 $ 500,000
         Other                                                                                                 Subtotal                     $        -    $ 100,000 $ 250,000 $ 500,000 $         -
            Subtotal                    $   50,000   $ 2,500 $ 5,000 $ 7,500 $           12,500
                                                                                                  Infrastructure Benefits
Infrastructure Costs
           Network                      $       -    $ 5,000 $ 5,000 $ 8,000 $            8,000                  Eliminate CSS Support      $   10,000
           Other                        $       -                                                                Consolidate Number of
              Subtotal                  $       -    $ 5,000 $ 5,000 $ 8,000 $            8,000                  Tools                      $   500,000
                                                                                                                 Other                      $     -
Implementation Costs                                                                                                Subtotal                $   510,000   $      - $       - $       - $        -
        Internal IT Staff               $ 150,000    $ 50,000 $ 52,500 $ 55,125 $        57,881 Grand Total                                 $   510,000   $ 120,000 $ 350,000 $ 800,000 $ 500,000
        Internal Business Staff         $ 250,000
        Software Services               $ 25,000                                                  4 Yr Total     $              2,280,000
        3rd Party Systems
                                        $ 500,000              $ 50,000             $    50,000
        Integrator
            Subtotal                    $ 925,000    $ 50,000 $102,500 $ 55,125 $       107,881
                                                                                                                                                          Projected
Grand Total                             $1,105,000   $ 79,600 $134,600 $ 96,625 $       160,881                                                           Return : 1.45

4 Yr Total $                1,576,706
How the PID Improves Project
                     Outcomes
           PMBOK Area                                 PID Alignment
1.   Scope              1.   Confirms Scope
2.   HR                 2.   Defines the Organization Structure
3.   Procurement        3.   Identifies if outside resources/tools are expected to be needed
4.   Quality            4.   Baseline for measuring scope and final project outcome vs plan
5.   Communications     5.   Platform for communications with project team and
6.   Risk                    stakeholders
7.   Budget/Costs       6.   Utilizes methods to improve critical thinking and early ID of
8.   Time                    risks
9.   Integration        7.   Contains initial cost/benefit projection as well as non-
                             quantifiable factors
                        8.   Provides high-level estimate which can help sequence with
                             other projects
                        9.   Specifically helps identify key areas and integration points
                             between processes and departments – root cause and COPIS
Thank you!


dangelow@businessfoundations.net

Project Initiation Document

  • 1.
    Problem-Solving 101 Initiating Projects
  • 2.
    Background and Expectations •Active engagement increases learning and outcomes – Ask questions! • The material presented should be considered an outline, a framework – It will need adaptation to match your specific organization’s needs • Continuous improvement applies to all areas of a business – The concepts presented have been refined over 15 years – Feedback on what works/doesn’t work for you is requested!
  • 3.
    Why are wehere? http://blog.standishgroup.com/ Successful projects are rare Improving project outcomes is critical to careers and organizational sustainability!
  • 4.
    What’s the Problem? •Organizations continue to increase integration of processes, technologies and staff roles in the name of “do more with less” • As organizations increase integration, understanding the relationships between roles, technologies and processes become complicated – Defining root-cause problems and project dependencies becomes highly complex • Result – Projects are initiated and scope, budgets and timelines modified in-flight
  • 5.
    What’s the Solution? •Focus efforts on the front-end stages of a project and ensure the project team, leadership and stakeholders understand the problem – In the front-end of a project fewer resources are engaged, it’s easier to change direction and the cost impact is minimized • Having a standard framework with templates, methods, and tools helps organizational learning and outcomes – Adopting a standard template to communicate project goals, scope, organization, etc. is a basis for continuous improvement – Individuals and teams can be trained on use of tools to improve skills – Teams can benefit by using checklists to help ensure comprehensive understanding of organizational needs before initiating and planning a project Note: Templates need to be adapted for each company; organizations vary in use of terminology, critical focus areas (risk, budget, …), etc.
  • 6.
    Before you climbthe ladder….. make sure it’s leaning against the right wall! Today’s presentation is focused on the project initiation
  • 7.
    Use of aProject Initiation Document (PID) can help reduce risk • The contents provide a checklist to ensure critical project areas are considered during planning • Quality Management methods and “lean” tools can help by increasing rigor in identifying root- cause problem and defining scope – The “Five-Why’s” method is often helpful getting input from a range of team members – Fish-bone and SIPOC/COPIS tools are proven to be effective to decompose processes and understand dependencies
  • 8.
    Templates need tobe adapted for your organization PMBOK – 4th Edition Leading practice is to consider all project management areas
  • 9.
    Sample Template –PID (Project Initiation Document) • Initial sections define the business problem, its impact and the project objective – QM tools are leveraged through-out the template to ensure teams focus on eliminating non-value added activities. • After the problem is defined, the scope of the solution is confirmed and “ideal-state outcomes” are defined – Focusing on the future, “ideal-state” establishes a vision which is helpful in managing organizational change • With the business problem and ideal state solution defined, the basis is set for risk identification and business case development – Identify the costs associated with the problem – Identify the benefits of the ideal state process helps – Include quantifiable and non-quantifiable costs and benefit
  • 10.
    Contents • Problem Statement and Impact • Project Objective • Ideal State Process • COPIS • Scope • Risks and Dependencies • Project Organization Structure • High-level Timeline • Business Case
  • 11.
    Problem Statement • The problem statement identifies the current pain and challenges it creates for the organization Problem • Development of product (services) roadmaps is inconsistently performed across different functions Impact • Lack of a road-mapping process is inhibiting revenue growth and eroding value – We are too slow to vet and commercialize our very best ideas – We are failing to make big, bold bets and instead fragment resources on sub-scale improvements – We fail to update roadmaps when plans change – We lack tight coordination across initiatives resulting in confusion and waste; half-hearted initiatives that go nowhere, duplicative work, reinventing the wheel and lack scale advantages – We lack consistent roadmap formats – roadmaps have various timelines – We’re unable to prioritize across roadmaps because lack of standard format creates communications problems across the groups • Outlining the impact of the problem helps ensure department and process complexities are understood
  • 12.
    Root Cause Diagram • Facilitate meetings to decompose problem and understand scope • Use Root-Cause tools (Ishaikawa) to visualize relationships Note: Use the template available in Visio, simple to prepare
  • 13.
    Project Objective Statement •Design and implement a corporate-wide standard business process for managing and presenting roadmaps across Regions, and business areas (services, products, etc.) to deliver 30-35% faster output – In parallel with business process design, select IT Tools needed to automate the common business process for roadmap development • Objective statements communicate the criticality of the project and impact to the organization
  • 14.
    Ideal State Process •The product roadmap is the front-end of the Phase Management Planning process and is the essential element in translating the business strategy into major programs to be pursued. The output is reviewed in a meeting that is conducted every 3-4 months. Marketing “owns” the Planning process and leads the meeting. • In each meeting the overall product portfolio is reviewed as well as the man-power and development capacity needed to meet the target dates. • Develop an ideal state definition to set the end-state vision, success criteria and helps with organizational change management
  • 15.
    Use COPIS/SIPOC* toidentify customer and supplier processes In this example, the focus is processes involved in road map development (AKA, the problem) * Customer-Output-Process-Input-Supplier, Or Supplier-Input-Process-Output-Customer
  • 16.
    Sample Cascading COPIS Supplier (s) Inputs Process Outputs Customer (s) Voice of Customer Phase Management Resource Balanced Outbound Marketing Customer Requirements Process Portfolio and Sales Updated Portfolio Inbound Marketing Product Roadmap Inbound Marketing Roadmap Approved and funded Phase Management R&D Engineering Strategic Technologies development projects Plan Supplier (s) Inputs Process Outputs Customer (s) Service and Product Portfolio of Product/Service Resource Balanced Phase Management strategy Proposed Projects Roadmaps Portfolio – LOB specific Plan Competitor Actions VOC and Customer Integrated Roadmap – Capacity Planning and and Offerings Experience data cross LOB portfolio selection Cost/ Revenue C/V/P models projections for each projecting cost and Customer Input project revenues from new products
  • 17.
    Scope • Scope has multiple dimensions; defining the areas helps ensure completeness and can be used • Geographic Scope as a check-list – Which regions and/or design centers are included • Functional Scope – Which business functions and processes are included • Technical Scope – Which IT Systems are included
  • 18.
    Scope Is/Is Not • Including a definition of what is and is not in scope Is Is Not drives out ambiguity • Detailed list of specific • Detailed list of specific items to be addressed items NOT to be addressed
  • 19.
    Solution Approach • Define business process and requirements • Evaluate current processes and tools • Review and confirm VS fit with requirements • Finalize Cost/Benefit/ROI model • Pilot Solution in one area • Refine implementation plan to align with IT Implementation of VS and roll-out • Development of a solution approach early in a project requires the team to consider all areas needed – reducing risk of future surprises. Note: Detailed project plans are required, these are created in later steps
  • 20.
    Risk and Dependencies Risks Dependencies (Process and Tool) (Process and Tool) • Identify risks that would limit the • Identify up-stream or down- success of the ideal state stream dependencies in either business processes or tools • Identify risks that would impact the expected benefit • Identify external dependencies (software providers, suppliers, etc) • Definition of risks and dependencies ensures the team considers challenges that may develop; risks that are identified can be planned for in schedule and budget
  • 21.
    Project Organization Chart Business Sponsor TBD • Preliminary definition of the project team structure and resource needs and can help reduce contention for resources. • Additionally, outside resource needs Project Manager are identified which help with TBD business case development Process Design Team VS Configuration Implementation Consumer SBU Team Team Service SBU Consumer SBU Consumer SBU Service SBU Service SBU p. 21
  • 22.
    Project Timeline –TBD (Depends on scope and resources) Q1 Q2 Q3 Q4 Bus. Case Approval Project Planning Product Configuration Testing and Training Pilot Deployment Company-wide rollout • Understanding scope and resources a preliminary schedule can be developed. • The schedule can help set/manage expectations and drive discussions on trade-offs involving budget/resources (if needed)
  • 23.
    Business Case One Time Benefit One Time Benefits Recurring Fees Cost Categories Recurring Fees Fees Yr1 Yr2 Yr3 Yr4 Software Costs Yr1 Yr2 Yr3 Yr4 Increased Efficiency Manual Process Application Software $ 100,000 $ 17,000 $ 17,000 $ 20,000 $ 25,000 Elimination $ - $ 20,000 $ 100,000 $ 300,000 $ 500,000 Cycle-time reduction $ - Database Software $ 25,000 $ 4,250 $ 4,250 $ 5,000 $ 6,250 Other (decribe below) $ - Additional 3rd Party $ 5,000 $ 850 $ 850 $ 1,000 $ 1,250 Subtotal $ - $ 20,000 $ 100,000 $ 300,000 $ 500,000 Software Subtotal $ 130,000 $ 22,100 $ 22,100 $ 26,000 $ 32,500 Headcount Reduction Hardware Costs Austin $ - $ 100,000 Application Server $ 50,000 $ 2,500 $ 5,000 $ 7,500 $ 12,500 Design Centers $ - $ 250,000 $ 500,000 Other Subtotal $ - $ 100,000 $ 250,000 $ 500,000 $ - Subtotal $ 50,000 $ 2,500 $ 5,000 $ 7,500 $ 12,500 Infrastructure Benefits Infrastructure Costs Network $ - $ 5,000 $ 5,000 $ 8,000 $ 8,000 Eliminate CSS Support $ 10,000 Other $ - Consolidate Number of Subtotal $ - $ 5,000 $ 5,000 $ 8,000 $ 8,000 Tools $ 500,000 Other $ - Implementation Costs Subtotal $ 510,000 $ - $ - $ - $ - Internal IT Staff $ 150,000 $ 50,000 $ 52,500 $ 55,125 $ 57,881 Grand Total $ 510,000 $ 120,000 $ 350,000 $ 800,000 $ 500,000 Internal Business Staff $ 250,000 Software Services $ 25,000 4 Yr Total $ 2,280,000 3rd Party Systems $ 500,000 $ 50,000 $ 50,000 Integrator Subtotal $ 925,000 $ 50,000 $102,500 $ 55,125 $ 107,881 Projected Grand Total $1,105,000 $ 79,600 $134,600 $ 96,625 $ 160,881 Return : 1.45 4 Yr Total $ 1,576,706
  • 24.
    How the PIDImproves Project Outcomes PMBOK Area PID Alignment 1. Scope 1. Confirms Scope 2. HR 2. Defines the Organization Structure 3. Procurement 3. Identifies if outside resources/tools are expected to be needed 4. Quality 4. Baseline for measuring scope and final project outcome vs plan 5. Communications 5. Platform for communications with project team and 6. Risk stakeholders 7. Budget/Costs 6. Utilizes methods to improve critical thinking and early ID of 8. Time risks 9. Integration 7. Contains initial cost/benefit projection as well as non- quantifiable factors 8. Provides high-level estimate which can help sequence with other projects 9. Specifically helps identify key areas and integration points between processes and departments – root cause and COPIS
  • 25.