Downloaded 324 times

![Literature Survey
[1] An Architecture for Component-Based Design of Representative-
Based Clustering Algorithms
Boris Delibas, Milan Vuki, Milos Jovanovi, Kathrin Kirchner,
Johannes Ruhland, Milija Suknovic (2012)
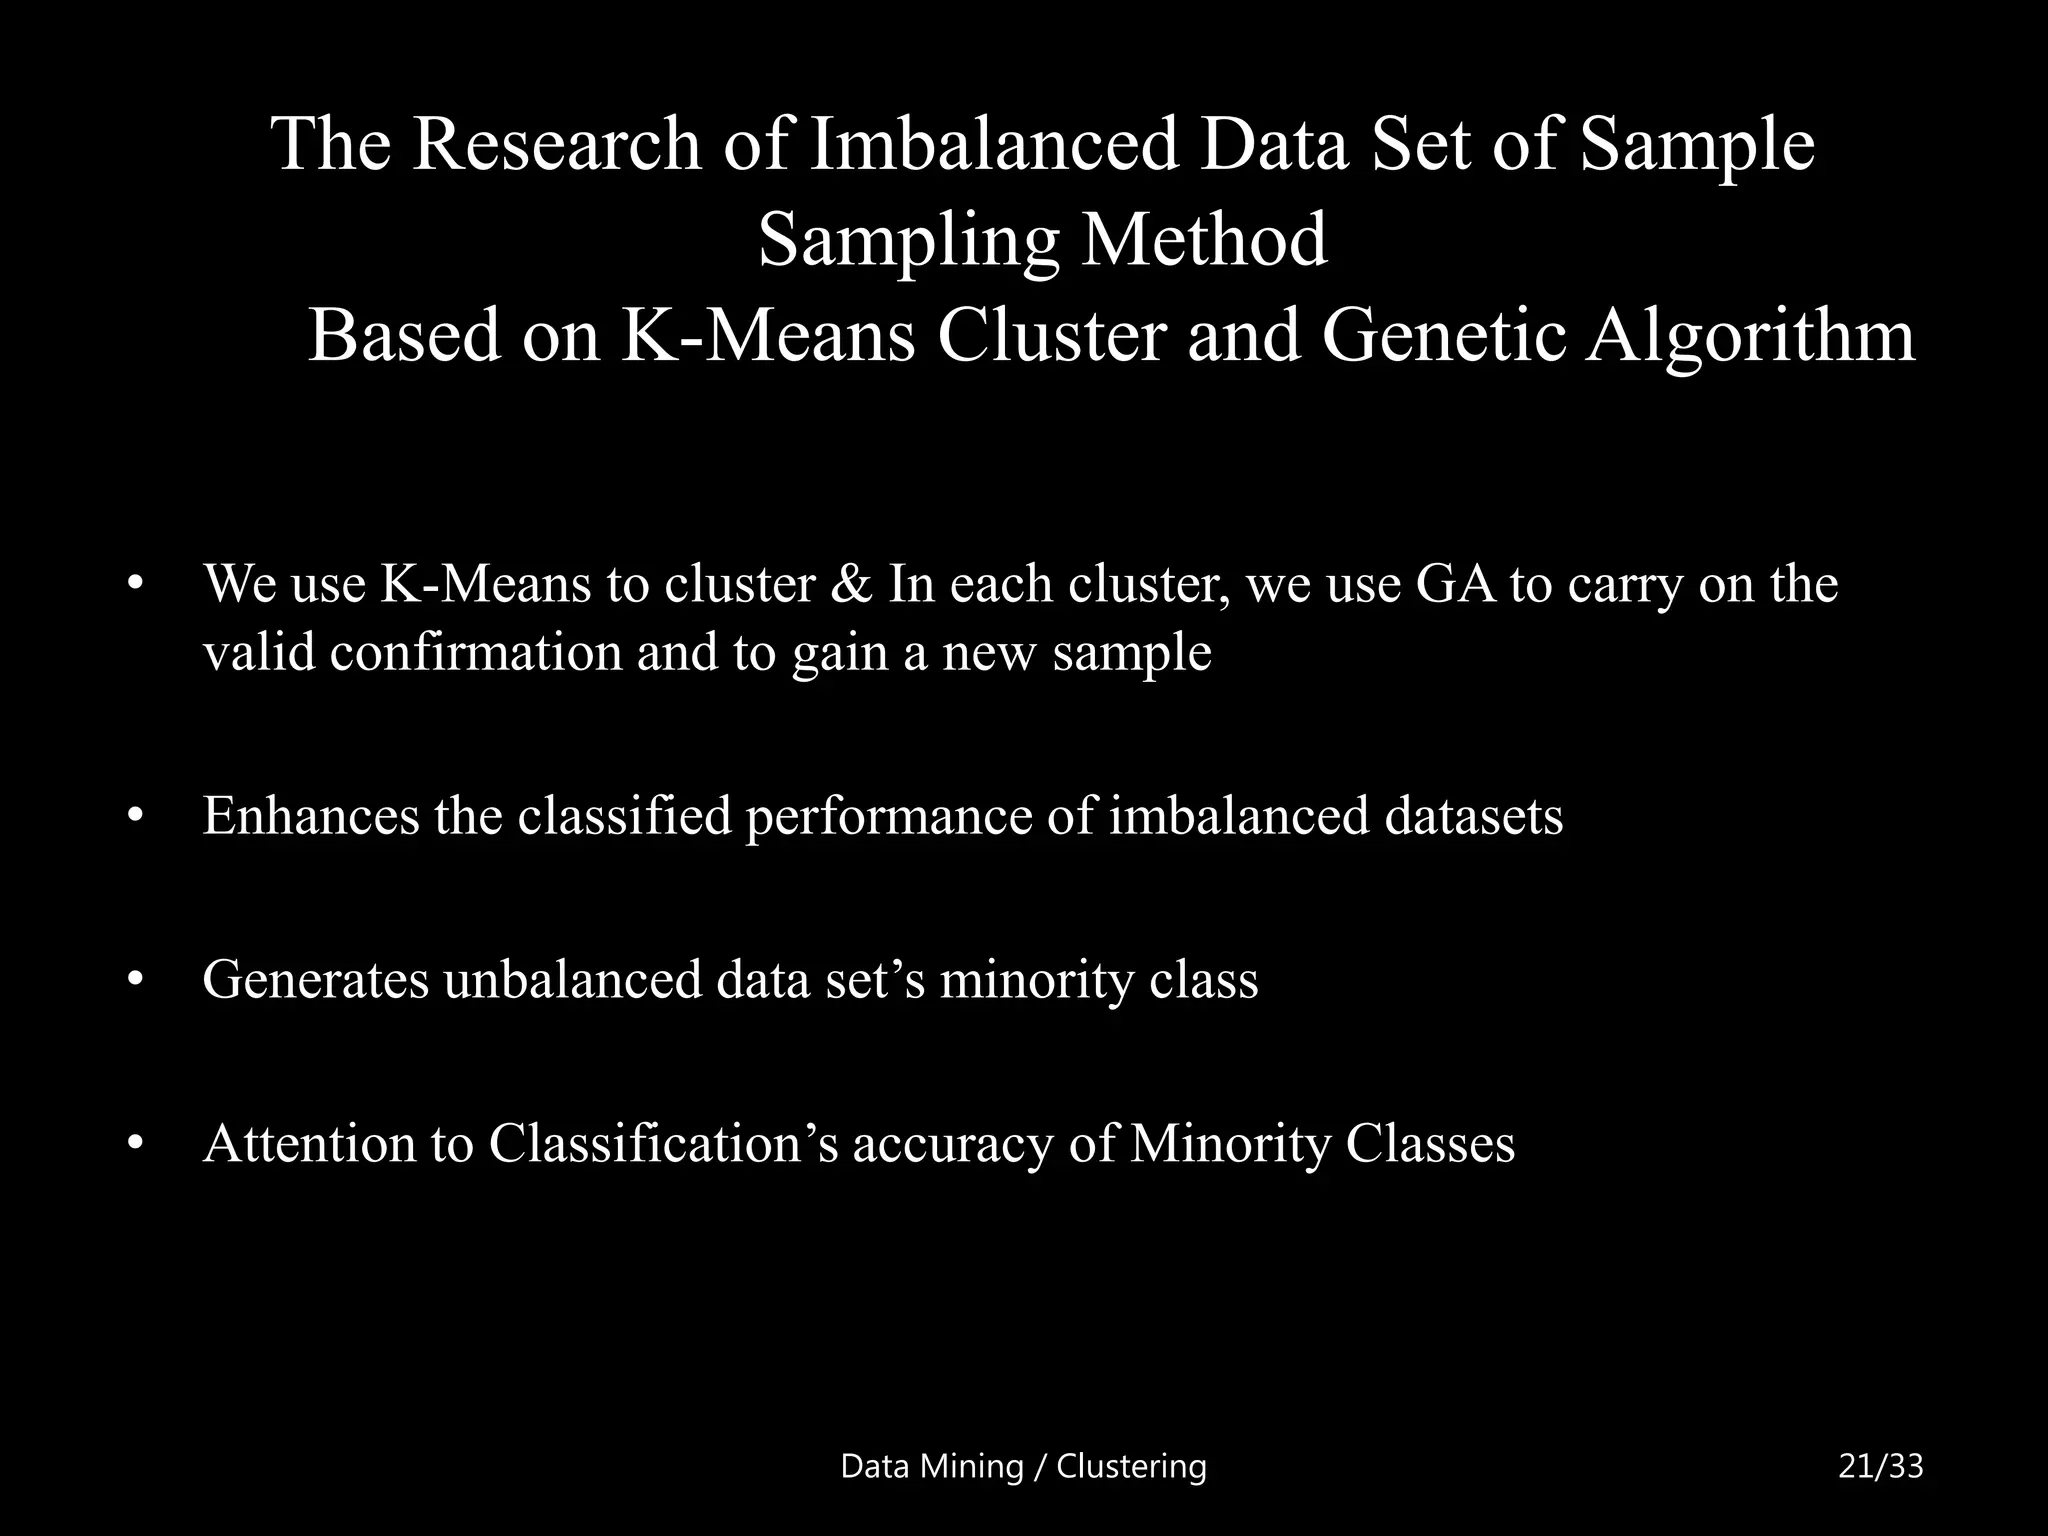
[2] The Research of Imbalanced Data Set of Sample Sampling Method
Based on K-Means Cluster and Genetic Algorithm
Yang Yong, (2012)
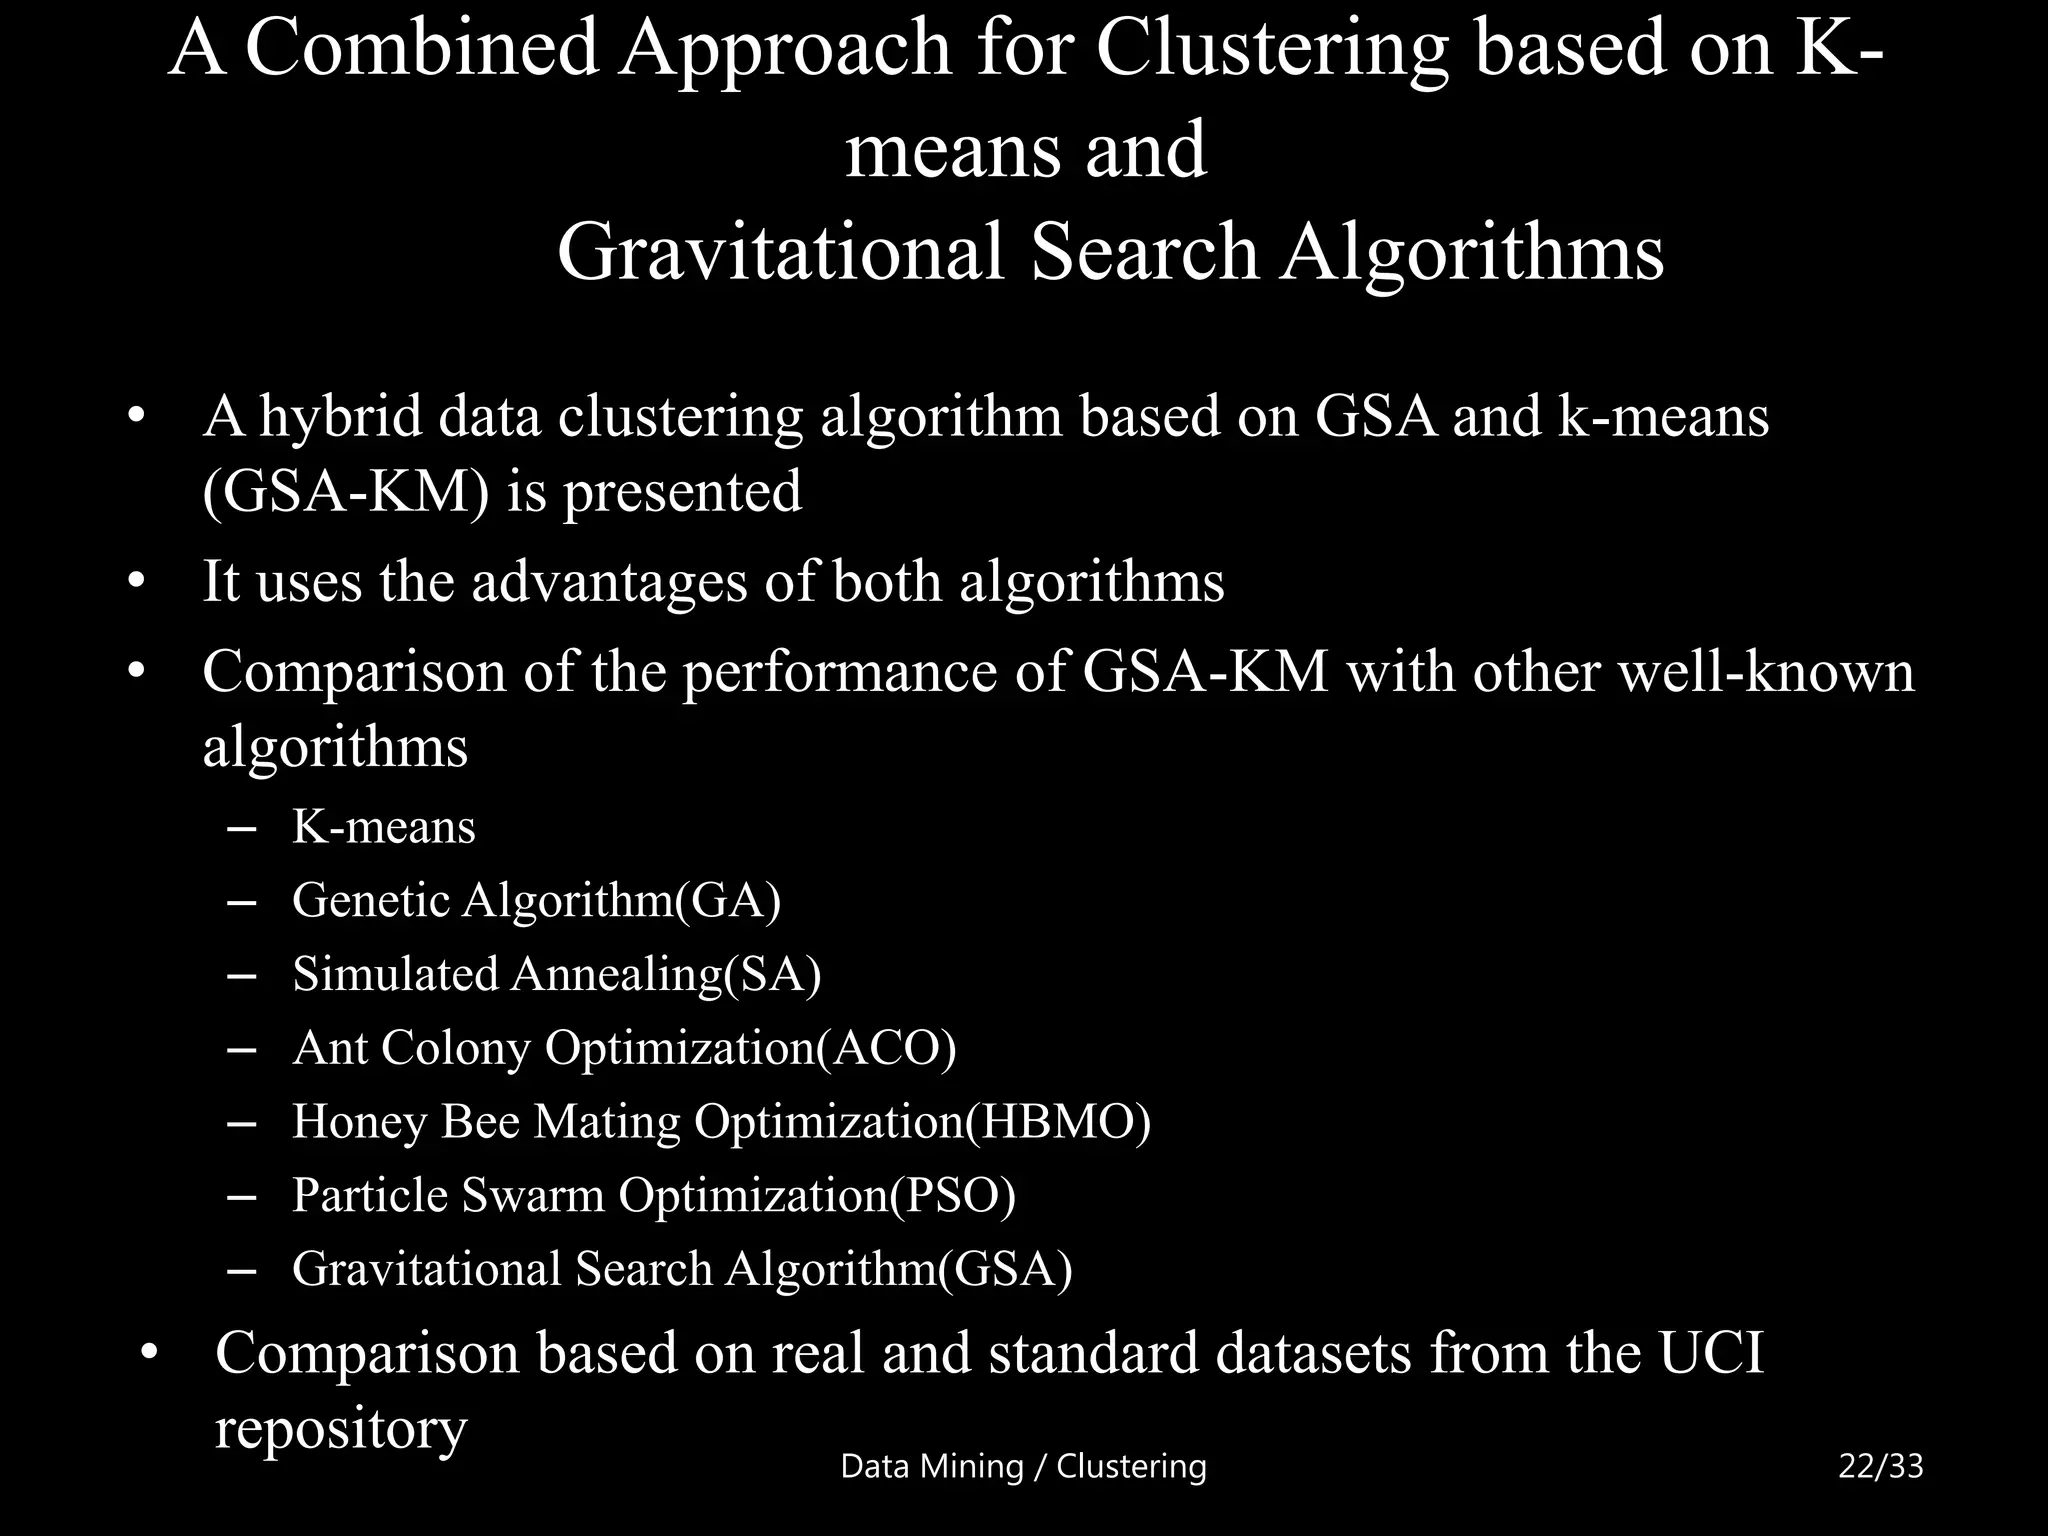
[3] A Combined Approach for Clustering based on K-means and
Gravitational Search Algorithms
Abdolreza Hatamlou, Salwani Abdullah, Hossein Nezamabadi-
pour, (2012)
Data Mining / Clustering 19/33](https://image.slidesharecdn.com/presentation-121023055715-phpapp02/75/Project-0th-Review-19-2048.jpg)
![References
[1] C.L. Blake, C.J. Merz
UCI repository of machine learning databases
http://www.ics.uci.edu/-learn/MLRepository.html
[2] S. Das, A. Abraham, A. Konar
Meta heuristic pattern clustering —an overview
Studies in Computational Intelligence (2009)
[3] L. Kaufman, P.J. Rousseeuw
Finding Groups in Data: An Introduction to Cluster Analysis
John Wiley & Sons, New York, (1990)
[4] M.B. Adil
Modified global-means algorithm for minimum sum-of- squares clustering problems
Pattern Recognition 41 (10) (2008)
[5] E. Rashedi, H. Nezamabadi-pour, S. Saryazdi
GSA: a gravitational search algorithm
Information Sciences 179 (13) (2009)
Data Mining / Clustering 31/33](https://image.slidesharecdn.com/presentation-121023055715-phpapp02/75/Project-0th-Review-31-2048.jpg)
![References
[6] A. Likas, N. Vlassis, J.J. Verbeek
The global k -means clustering algorithm
Pattern Recognition 36 (2) (2003)
[7] M. Mahdavi
Novel meta-heuristic algorithms for clustering web documents
Applied Mathematics and Computation (2008)
[8] M. Moshtaghi
Clustering ellipses for anomaly detection
Pattern Recognition 44 (2008)
[9] B. Saglam, et al.,
A mixed-integer programming approach to the clustering problem with an application in customer
segmentation
European Journal of Operational Research 173 (3) (2006)
[10] A.K. Jain
Data clustering: 50 years beyond K –means
Pattern Recognition Letters 31 (8) (2010)
Data Mining / Clustering 32/33](https://image.slidesharecdn.com/presentation-121023055715-phpapp02/75/Project-0th-Review-32-2048.jpg)


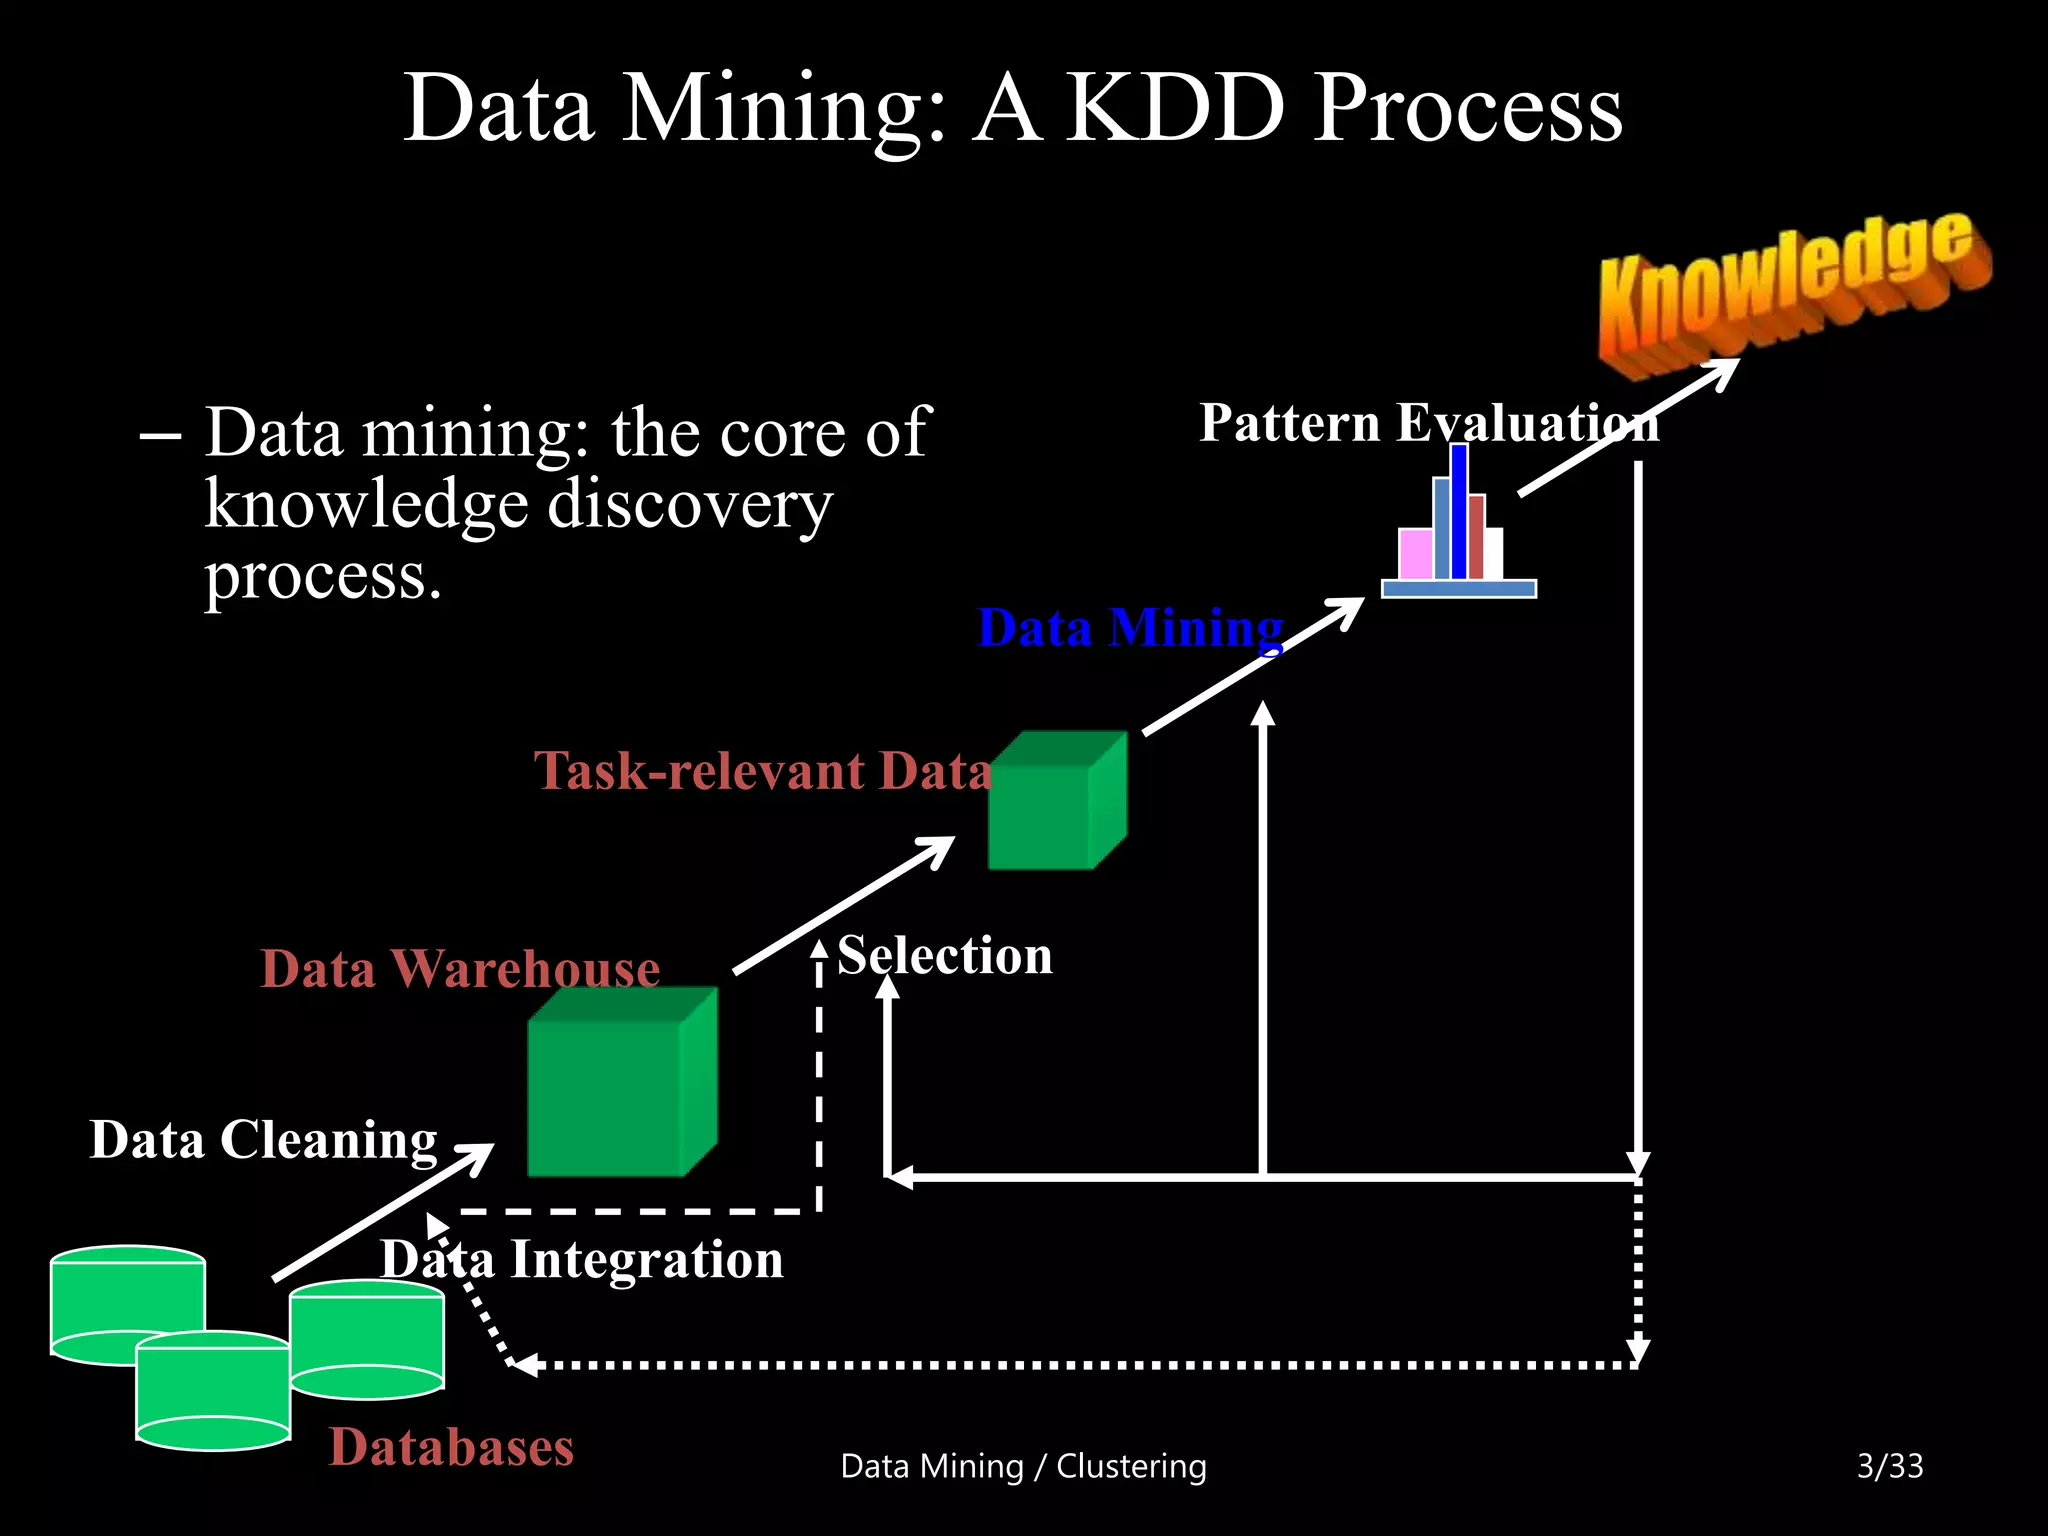
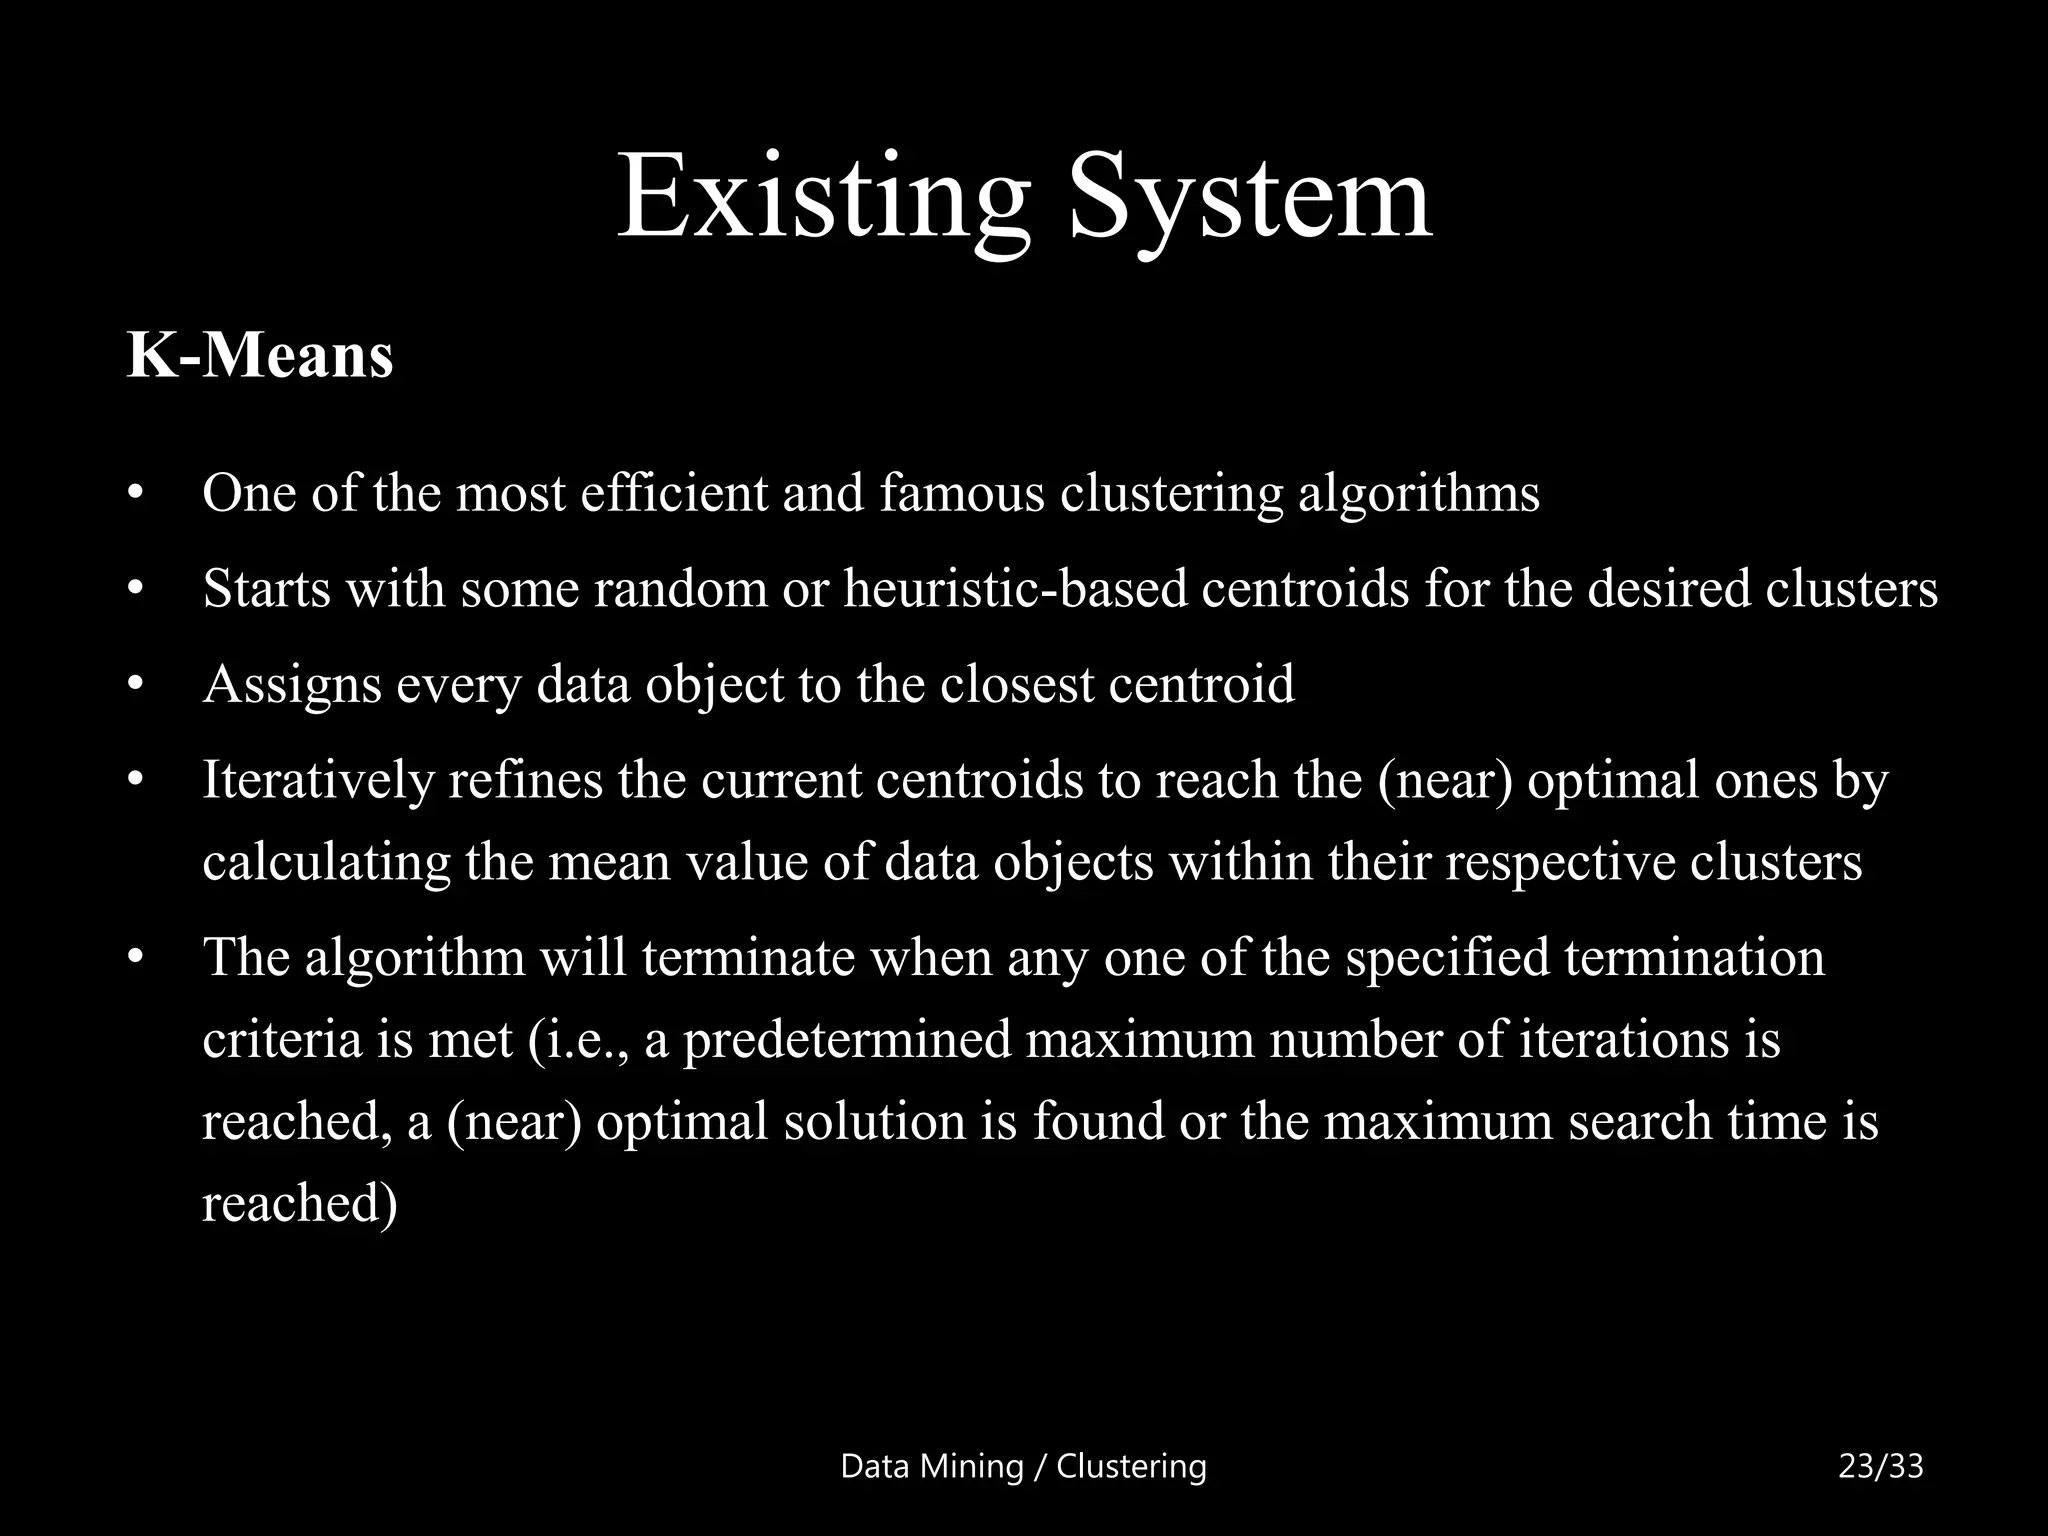
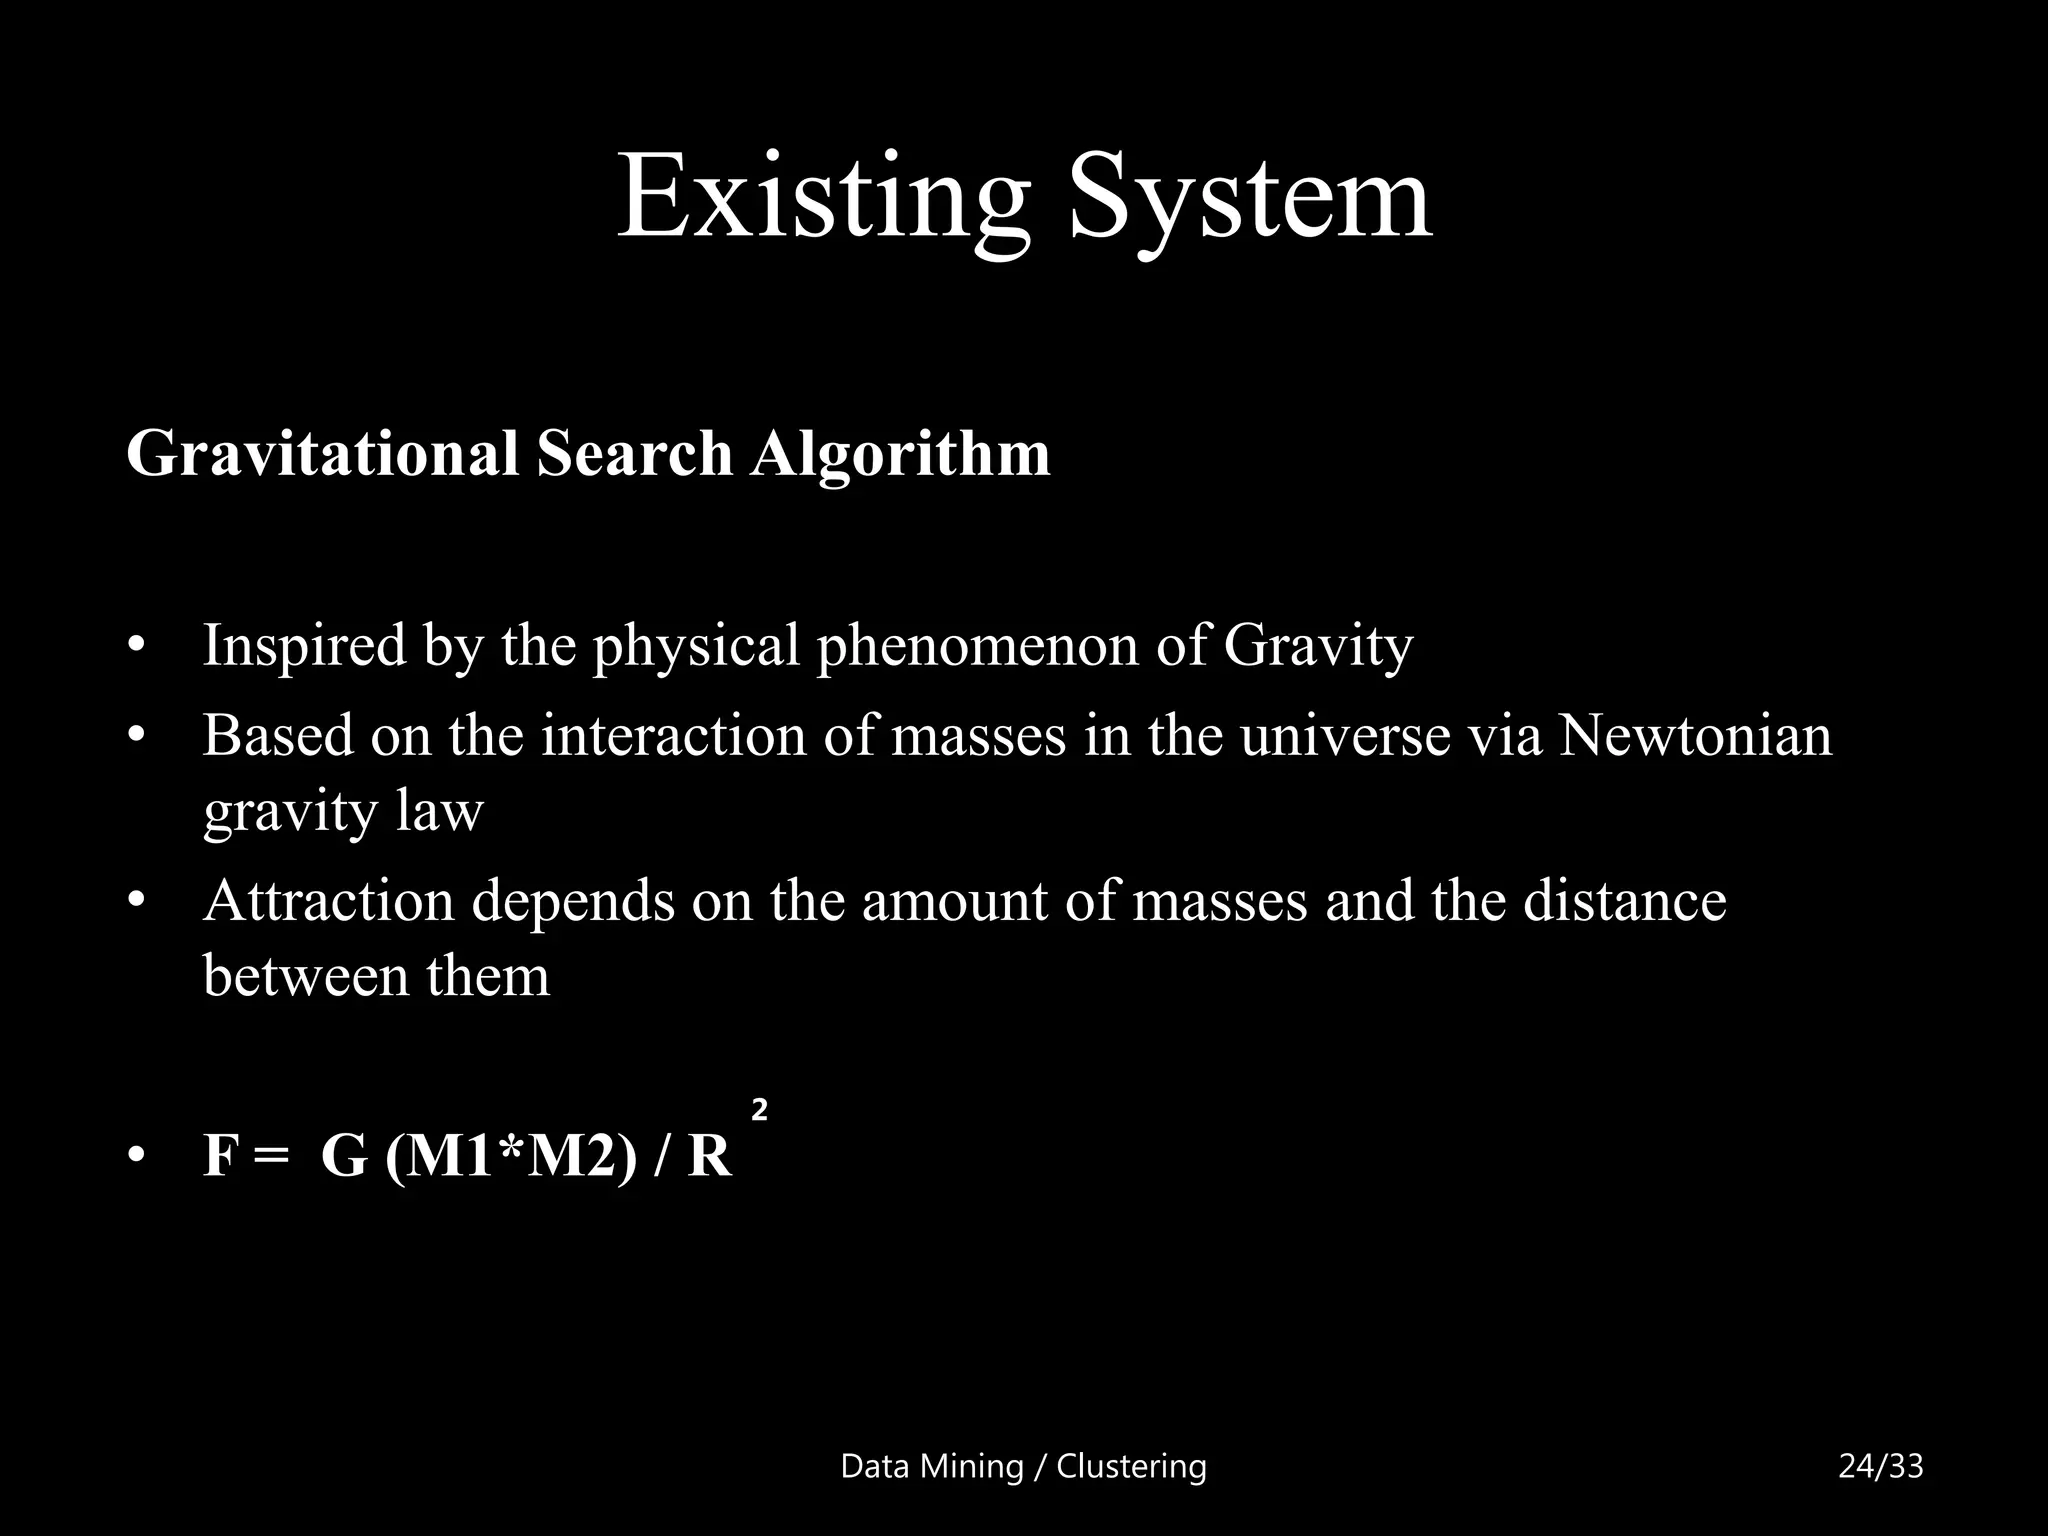
This document proposes a combined clustering approach using the Gravitational Search Algorithm (GSA) and K-means (GSA-KM) along with genetic algorithms. It begins with an introduction to data mining and clustering. Then, it discusses the existing K-means and GSA algorithms and their limitations. The proposed GSA-KM approach applies K-means initially to generate centroids, then uses GSA to refine the clusters. Genetic algorithms are added to further improve efficiency and speed. The approach is implemented in C# using an MS Access database to cluster datasets and compare performance against other algorithms.