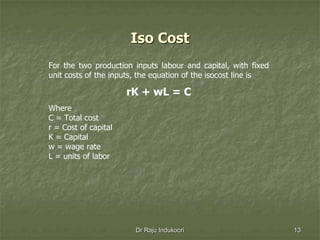
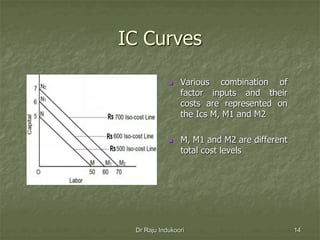
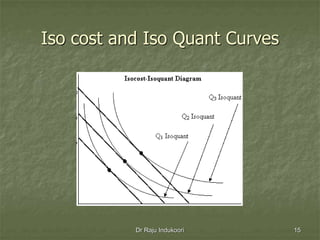
Production Decisions
Dr Raju Indukoori
Content
 Indifference Curve
 Iso quant
 Marginal rate of technical substitution (MRTS)
 Iso Curve
 Least cost combination
 Maximum output combination
Dr Raju Indukoori 2
Indifference Curve
 It is the combination of two different substitutes
with different quantity but giving the same result
or output.
 One of the variable should be minimum but not
zero.
 The units of the two variables vary in each
combination to minimize the input cost or related
keeping the result same.
Dr Raju Indukoori 3
Production Indifference Curve
Indifference curves in production are used to interpret different
combination of input costs and quantities keeping the output
constant. It is similar to indifference curves in theory of consumer
behavior. Following are the popular tools used in business economics.
1) Isoquants
2) Isocosts
Dr Raju Indukoori 4
Iso Quant (IQ)
 Iso means equal and Quant means quantity.
 The are also known as equal product curves useful in analysing the
theory of production function. This helps to understand the
optimum combination of factors and minimize the cost.
 Iso Quant represents all possible combinations of two inputs
which arecapable of producing the same level of output.
Dr Raju Indukoori 5
Marginal Rate of Technical Substitution
(MRTS)
 To what extent one factor input can substitute other factor is
known as MRTS
 For example one tractor can substitute ten men to plough an
agricultural field in a day.
 In the above example the ratio between 10 men and 1 tractor can
be represented as a ratio 1:10 which means 10 men are
substituted by 1 tractor
 MRTS in this case is 1:10
Dr Raju Indukoori 6
Factor Substitution
Dr Raju Indukoori 7
Factor
Combination
Units of
Capital (K)
Units of
Labor (L)
Quantity of
Out Put (Q)
MRTS
A 1 26 100
B 2 20 100 6:1
C 3 15 100 5:1
D 4 11 100 4:1
E 5 8 100 3:1
F 6 6 100 2:1
G 7 5 100 1:1
IQ Curve
 It is the curve drawn by using different combination of factor input
units keeping the oupt at the same level.
 Any point on the isoquant curve represent equal quantities of
output.
 As the curve represents same output at any point on the curve, it
is known as isoquatnt or equal product curve.
Dr Raju Indukoori 8
IQ Curve
Dr Raju Indukoori 9
 A,B,C and D are different
combinations of factor
inputs i.e. capital (K) and
labor (C).
 In all the combinations,
the output remains the
same i.e. Q1.
IQ Curves
Dr Raju Indukoori 10
Properties of IQ Curves
 Negative or Downward sloping from left to right
 Convex to the origin
 Two isoquant curves cannot intersect each other.
Dr Raju Indukoori 11
Iso Cost (IC)
 Iso means equal and cost is cost of cost of factor
inputs in production.
 Iso costs is the combinations of inputs which results
in the same total amount or cost.
 The use of the iso cost pertains to cost-minimization
in production.
Dr Raju Indukoori 12
Iso Cost
For the two production inputs labour and capital, with fixed
unit costs of the inputs, the equation of the isocost line is
rK + wL = C
Where
C = Total cost
r = Cost of capital
K = Capital
w = wage rate
L = units of labor
Dr Raju Indukoori 13
IC Curves
 Various combination of
factor inputs and their
costs are represented on
the Ics M, M1 and M2
 M, M1 and M2 are different
total cost levels
Dr Raju Indukoori 14
Iso cost and Iso Quant Curves
Dr Raju Indukoori 15
Least cost combination
 It is the combination of factor inputs leading to least cost.
 It can be on any of the Iso cost lines (IC1, IC2, and IC3)
and Iso quant lines (IQ1, IQ2 and IQ3) which has to be
determined by the producer.
 It is on the line of intersection of Iso cost and Iso quant
like IQ1 and IC1, IQ2 –IC2 and IQ3 and IC3
 It gives the least cost combination lowering the factor
cost.
Dr Raju Indukoori 16
Maximum output combination
 Maximum output combination of factor inputs is the
possible combination of the factor input quantites and
costs.
 It happens at the higher level of Iso cost and iso quant
intersection.
Dr Raju Indukoori 17
Dr Raju Indukoori
Thank you
Share your comments
18
Dr Raju Indukoori
Questions?
Give your questions in the comments
19

Production Decisions

  • 1.
  • 2.
    Content  Indifference Curve Iso quant  Marginal rate of technical substitution (MRTS)  Iso Curve  Least cost combination  Maximum output combination Dr Raju Indukoori 2
  • 3.
    Indifference Curve  Itis the combination of two different substitutes with different quantity but giving the same result or output.  One of the variable should be minimum but not zero.  The units of the two variables vary in each combination to minimize the input cost or related keeping the result same. Dr Raju Indukoori 3
  • 4.
    Production Indifference Curve Indifferencecurves in production are used to interpret different combination of input costs and quantities keeping the output constant. It is similar to indifference curves in theory of consumer behavior. Following are the popular tools used in business economics. 1) Isoquants 2) Isocosts Dr Raju Indukoori 4
  • 5.
    Iso Quant (IQ) Iso means equal and Quant means quantity.  The are also known as equal product curves useful in analysing the theory of production function. This helps to understand the optimum combination of factors and minimize the cost.  Iso Quant represents all possible combinations of two inputs which arecapable of producing the same level of output. Dr Raju Indukoori 5
  • 6.
    Marginal Rate ofTechnical Substitution (MRTS)  To what extent one factor input can substitute other factor is known as MRTS  For example one tractor can substitute ten men to plough an agricultural field in a day.  In the above example the ratio between 10 men and 1 tractor can be represented as a ratio 1:10 which means 10 men are substituted by 1 tractor  MRTS in this case is 1:10 Dr Raju Indukoori 6
  • 7.
    Factor Substitution Dr RajuIndukoori 7 Factor Combination Units of Capital (K) Units of Labor (L) Quantity of Out Put (Q) MRTS A 1 26 100 B 2 20 100 6:1 C 3 15 100 5:1 D 4 11 100 4:1 E 5 8 100 3:1 F 6 6 100 2:1 G 7 5 100 1:1
  • 8.
    IQ Curve  Itis the curve drawn by using different combination of factor input units keeping the oupt at the same level.  Any point on the isoquant curve represent equal quantities of output.  As the curve represents same output at any point on the curve, it is known as isoquatnt or equal product curve. Dr Raju Indukoori 8
  • 9.
    IQ Curve Dr RajuIndukoori 9  A,B,C and D are different combinations of factor inputs i.e. capital (K) and labor (C).  In all the combinations, the output remains the same i.e. Q1.
  • 10.
    IQ Curves Dr RajuIndukoori 10
  • 11.
    Properties of IQCurves  Negative or Downward sloping from left to right  Convex to the origin  Two isoquant curves cannot intersect each other. Dr Raju Indukoori 11
  • 12.
    Iso Cost (IC) Iso means equal and cost is cost of cost of factor inputs in production.  Iso costs is the combinations of inputs which results in the same total amount or cost.  The use of the iso cost pertains to cost-minimization in production. Dr Raju Indukoori 12
  • 13.
    Iso Cost For thetwo production inputs labour and capital, with fixed unit costs of the inputs, the equation of the isocost line is rK + wL = C Where C = Total cost r = Cost of capital K = Capital w = wage rate L = units of labor Dr Raju Indukoori 13
  • 14.
    IC Curves  Variouscombination of factor inputs and their costs are represented on the Ics M, M1 and M2  M, M1 and M2 are different total cost levels Dr Raju Indukoori 14
  • 15.
    Iso cost andIso Quant Curves Dr Raju Indukoori 15
  • 16.
    Least cost combination It is the combination of factor inputs leading to least cost.  It can be on any of the Iso cost lines (IC1, IC2, and IC3) and Iso quant lines (IQ1, IQ2 and IQ3) which has to be determined by the producer.  It is on the line of intersection of Iso cost and Iso quant like IQ1 and IC1, IQ2 –IC2 and IQ3 and IC3  It gives the least cost combination lowering the factor cost. Dr Raju Indukoori 16
  • 17.
    Maximum output combination Maximum output combination of factor inputs is the possible combination of the factor input quantites and costs.  It happens at the higher level of Iso cost and iso quant intersection. Dr Raju Indukoori 17
  • 18.
    Dr Raju Indukoori Thankyou Share your comments 18
  • 19.
    Dr Raju Indukoori Questions? Giveyour questions in the comments 19