This document discusses process modeling and data flow diagrams (DFDs). It defines key DFD concepts like the context diagram, level-1 diagram, decomposition, and balancing. It explains how to draw DFD symbols like processes, data stores, sources/sinks, and data flows. The document also outlines 20 rules for constructing valid and informative DFDs, such as ensuring processes have both inputs and outputs, data cannot move directly between certain symbols, and composite data flows must be accounted for at lower levels of decomposition. The overall goal is to understand how to logically model processes and structure system requirements using DFD techniques.
Learning Objectives
Understandthe logical modeling of processes
through studying data flow diagrams
How to draw data flow diagrams using rules
and guidelines
How to decompose data flow diagrams into
lower-level diagrams
Balancing of data flow diagrams
•UCS503- Software Engineering
4.
Process Modeling
• Modelinga system’s process
– Utilize information gathered during requirements
determination
– Structure of the data is also modeled in addition to the
processes
• Graphically represent the processes that capture,
manipulate, store and distribute data between a system
and its environment and among system components
• Data flow diagrams (DFD)
– Graphically illustrate movement of data between external
entities and the processes and data stores within a system
•UCS503- Software Engineering
5.
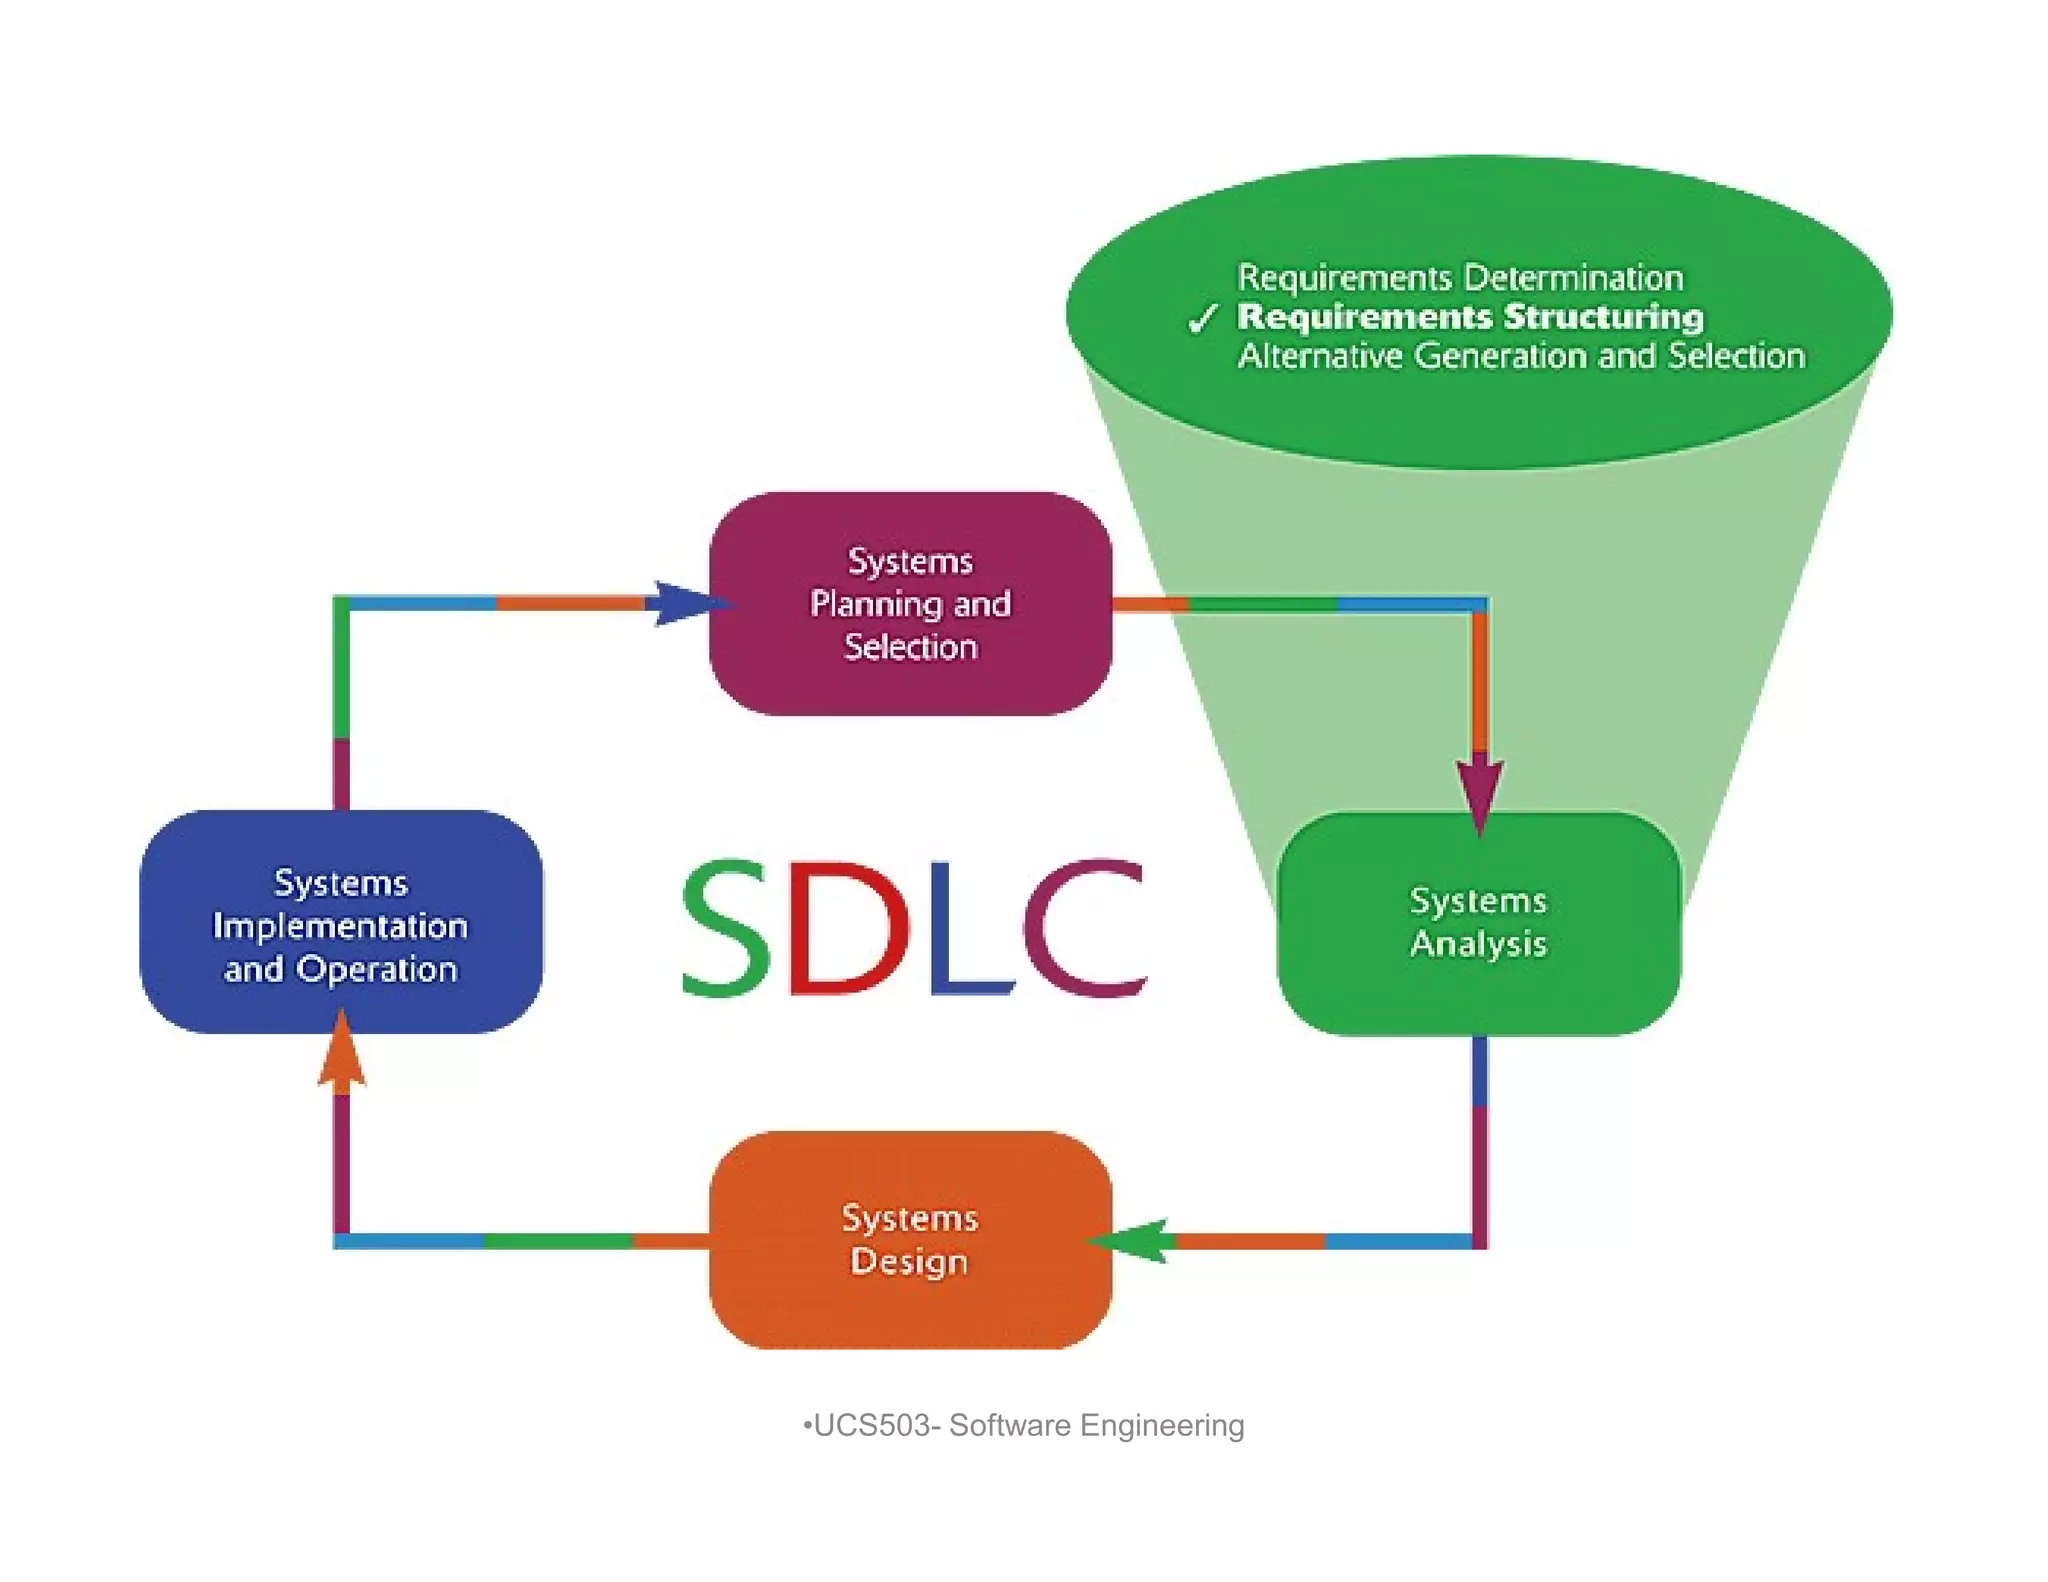
Process Modeling: Deliverablesand
Outcomes
• Set of coherent, interrelated data flow diagrams
• Context data flow diagram (DFD)
– Scope of system
• DFDs of current system
– Enables analysts to understand current system
• DFDs of new logical system
– Technology independent
– Show data flows, structure and functional requirements of new
system
• Project dictionary and CASE repository
•UCS503- Software Engineering
6.
Data Flow DiagrammingMechanics
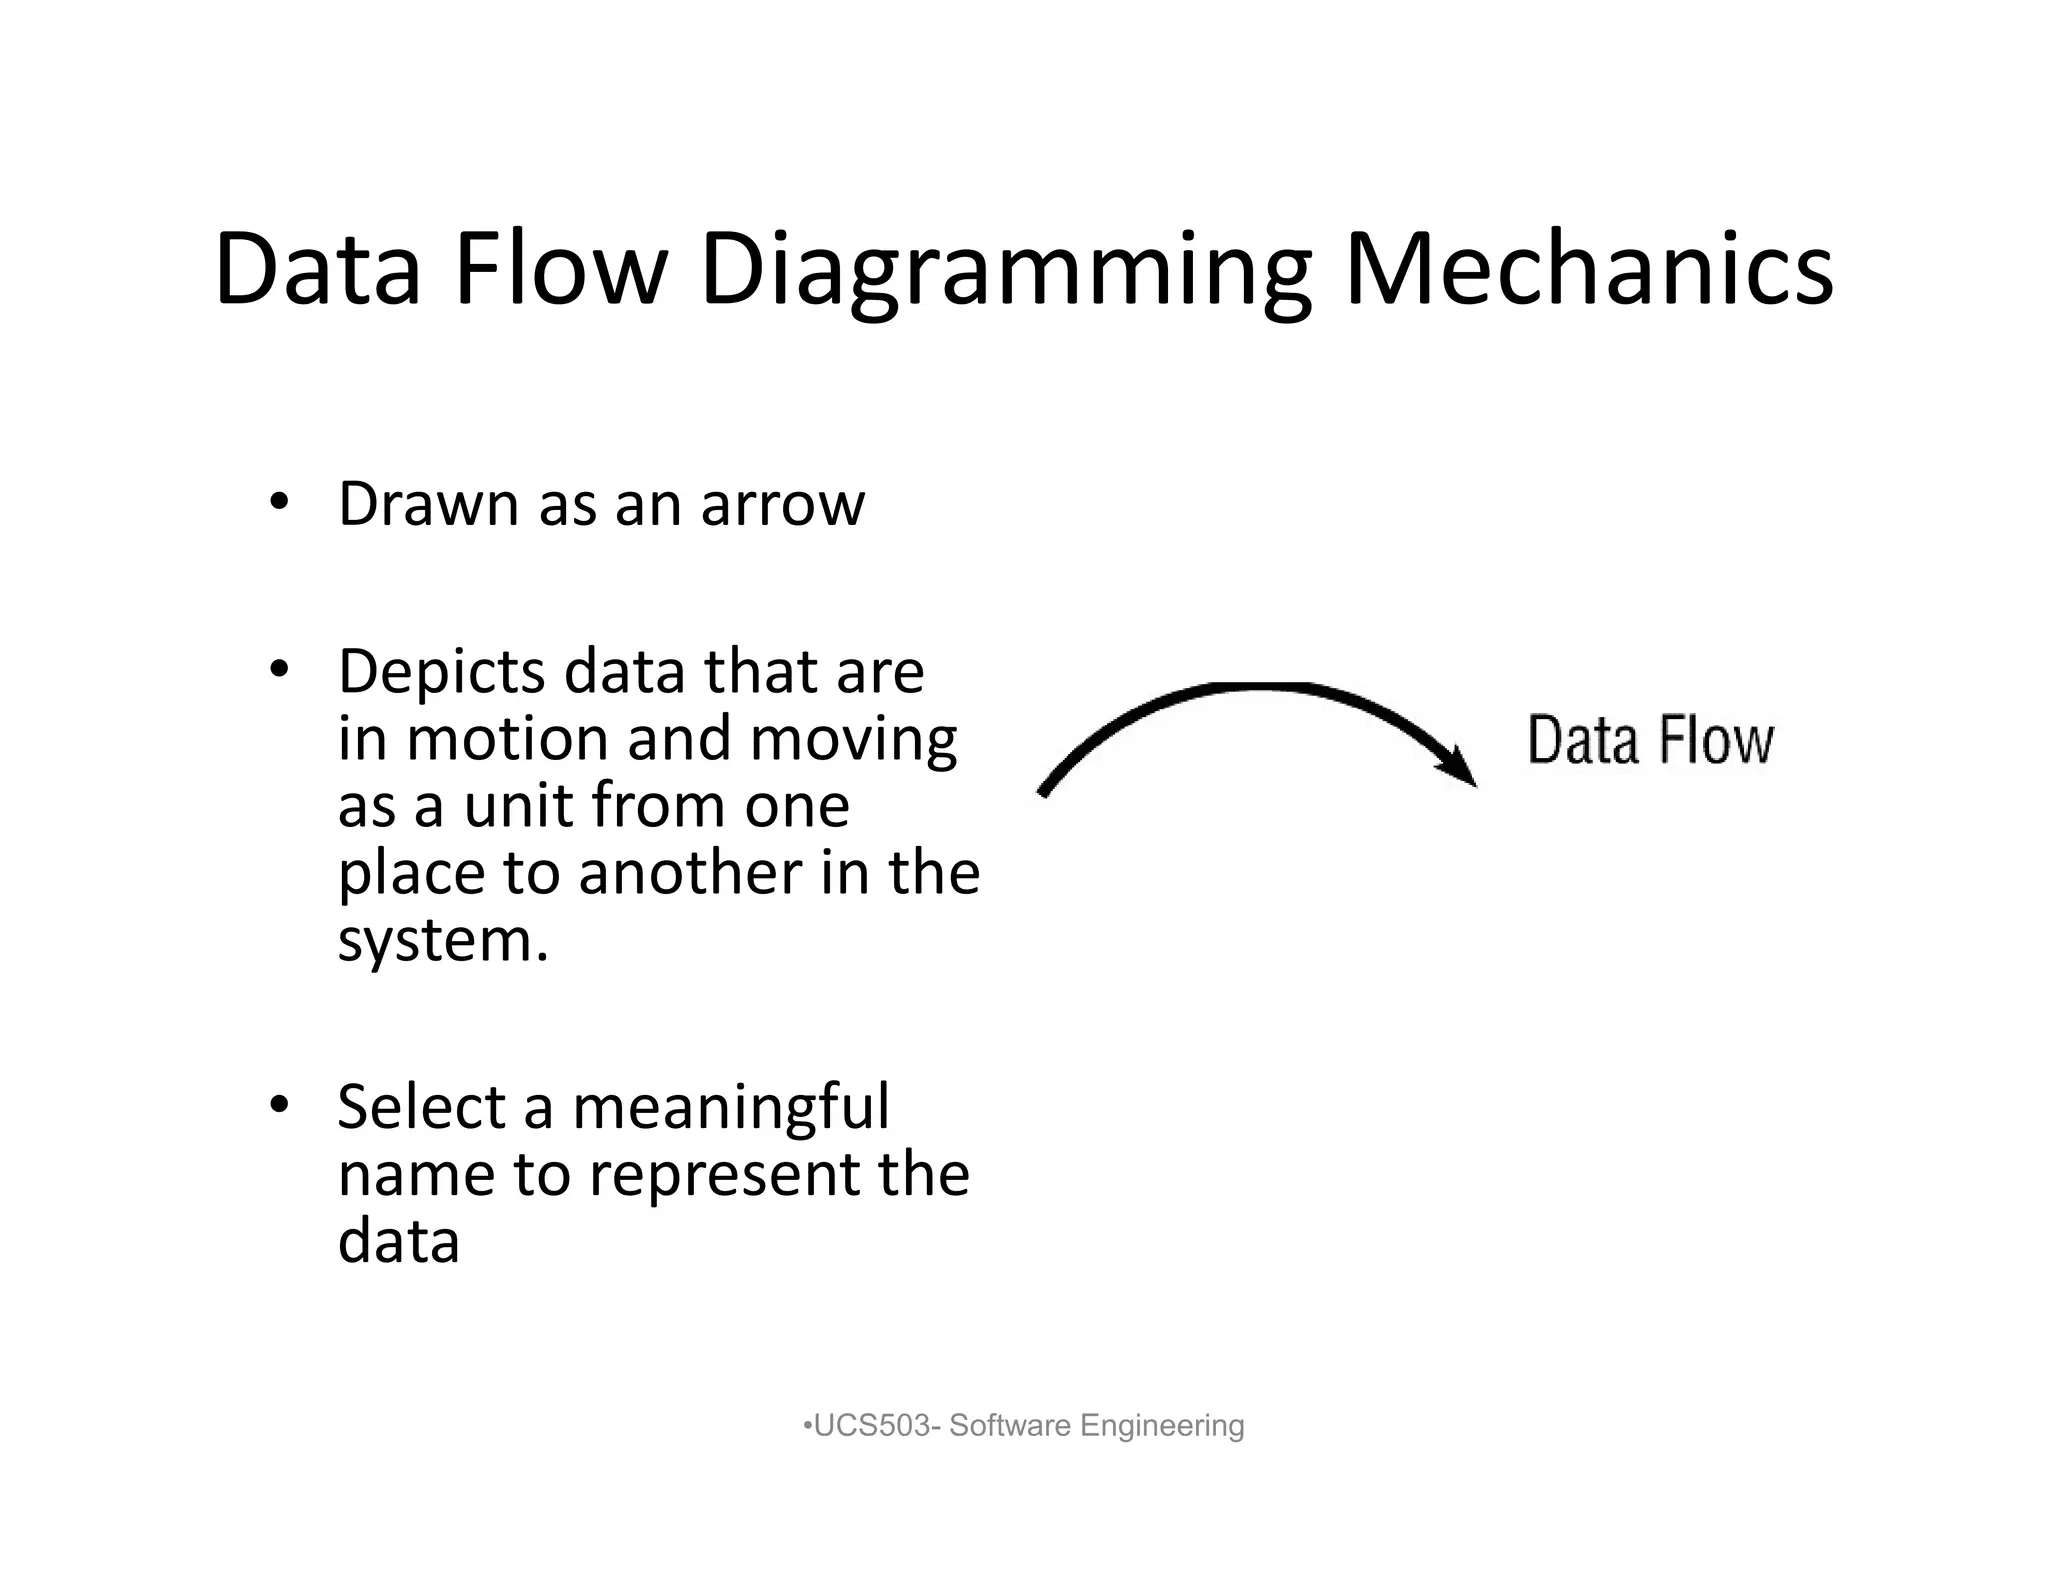
• Drawn as an arrow
• Depicts data that are
in motion and moving
as a unit from one
place to another in the
system.
• Select a meaningful
name to represent the
data
•UCS503- Software Engineering
7.
Data Flow DiagrammingMechanics:
Data Store
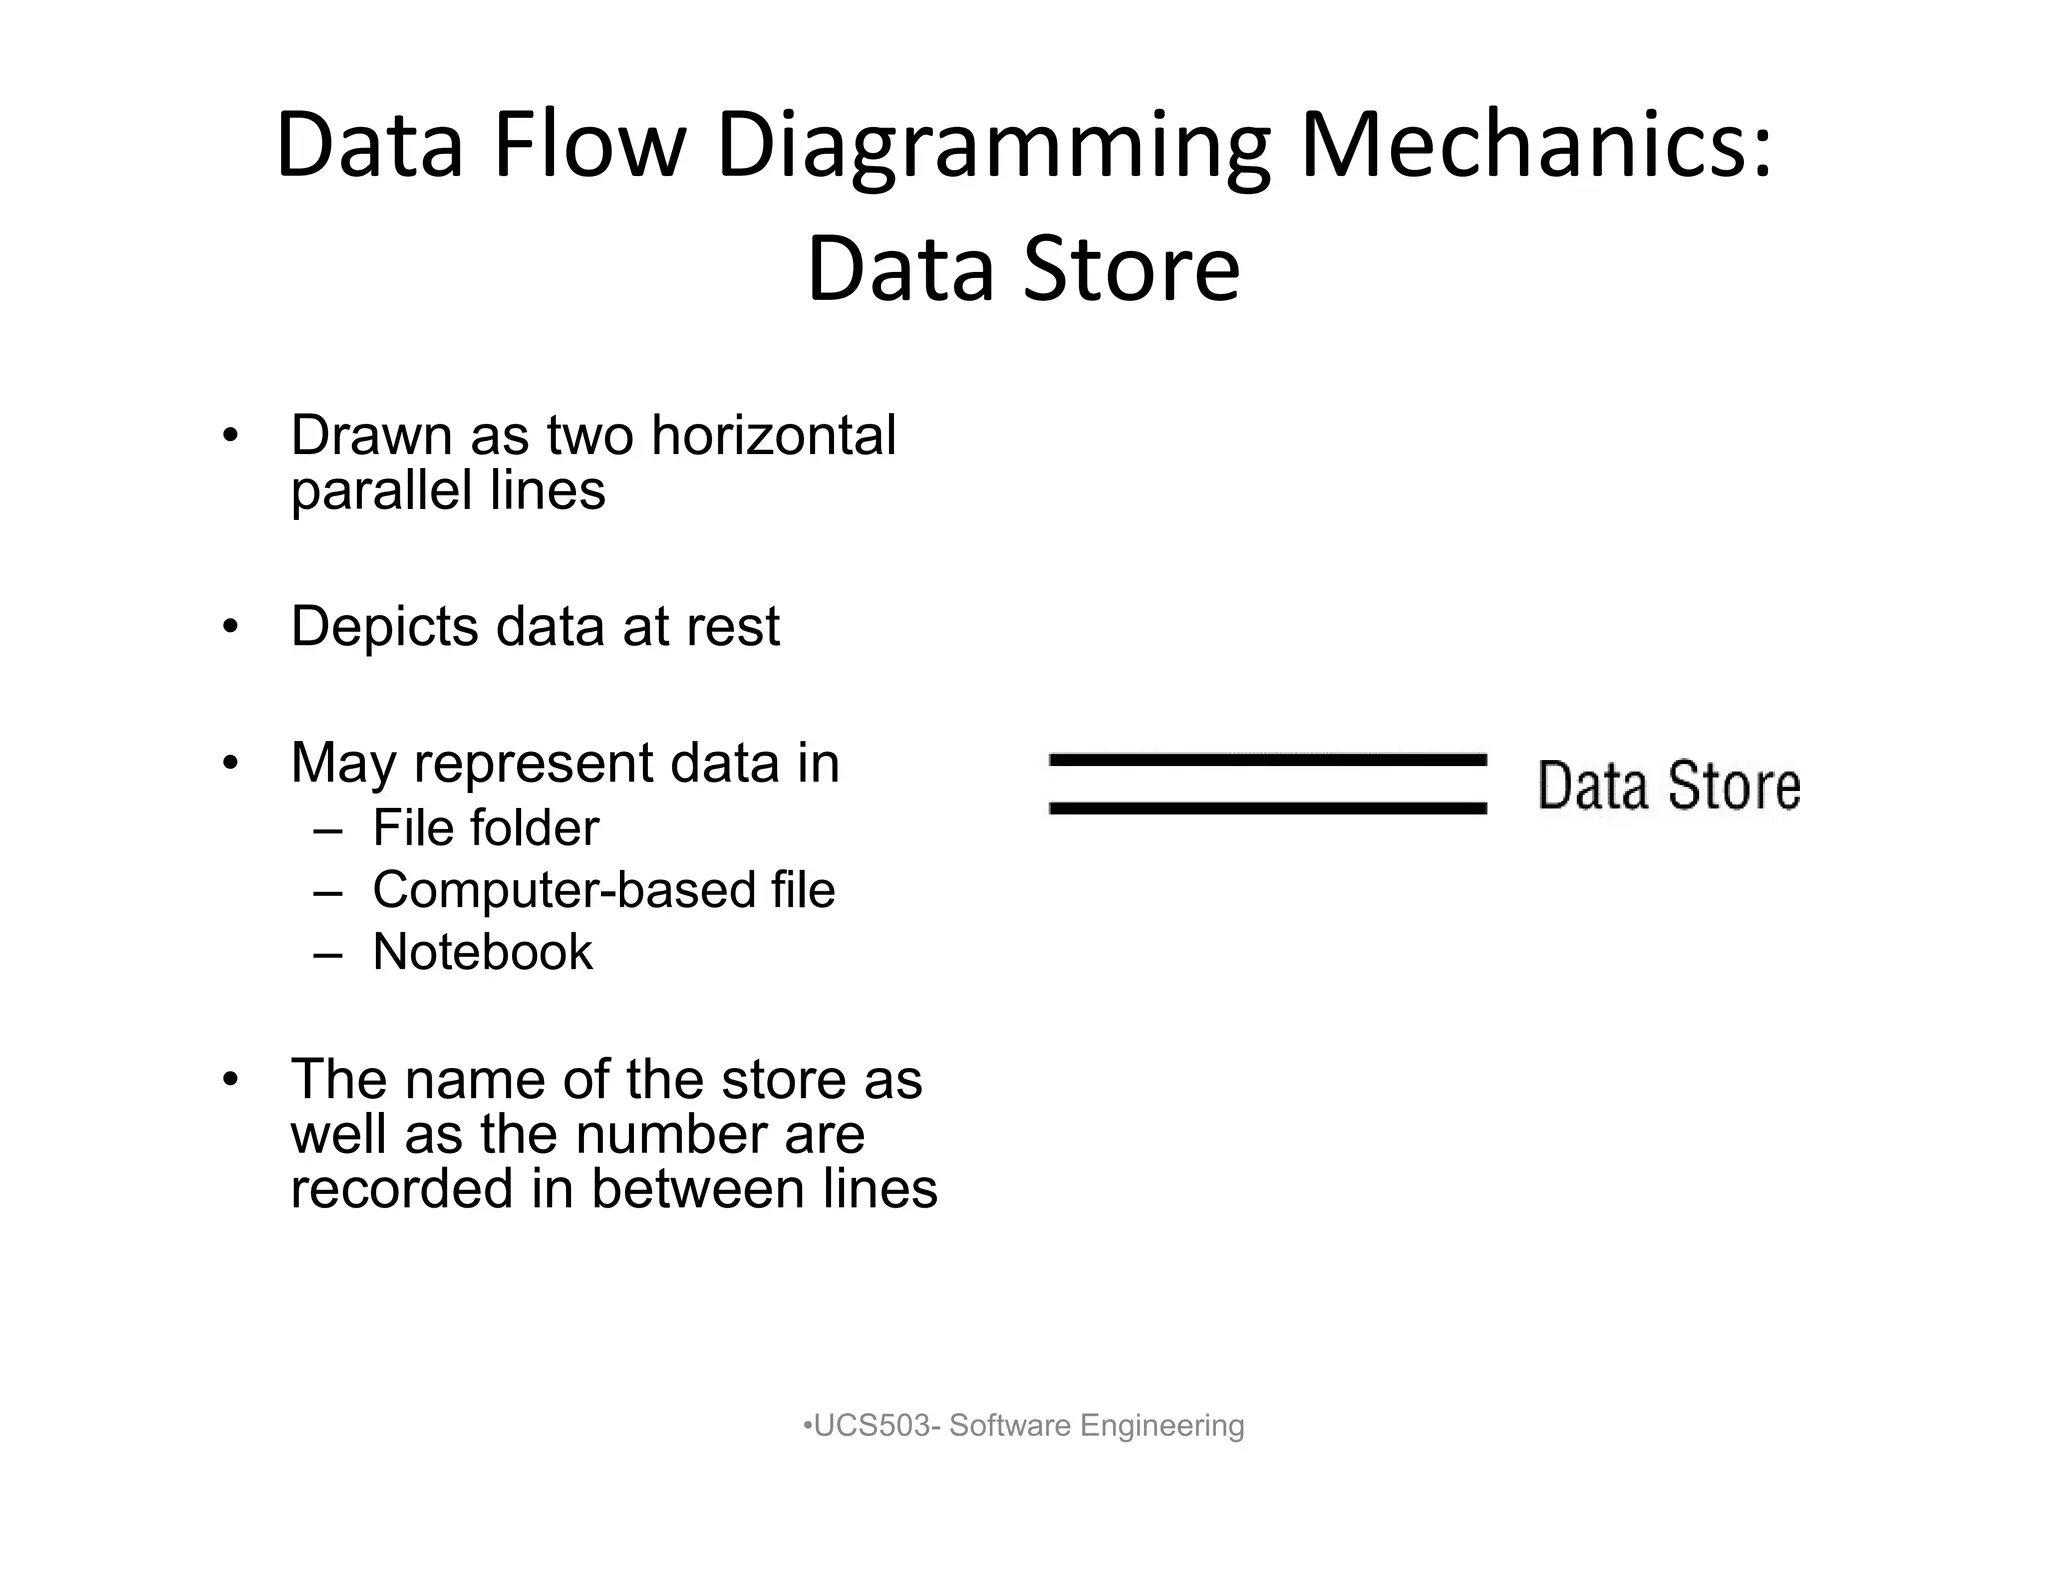
• Drawn as two horizontal
parallel lines
• Depicts data at rest
• May represent data in
– File folder
– Computer-based file
– Notebook
• The name of the store as
well as the number are
recorded in between lines
•UCS503- Software Engineering
8.
Data Flow DiagrammingMechanics:
Process
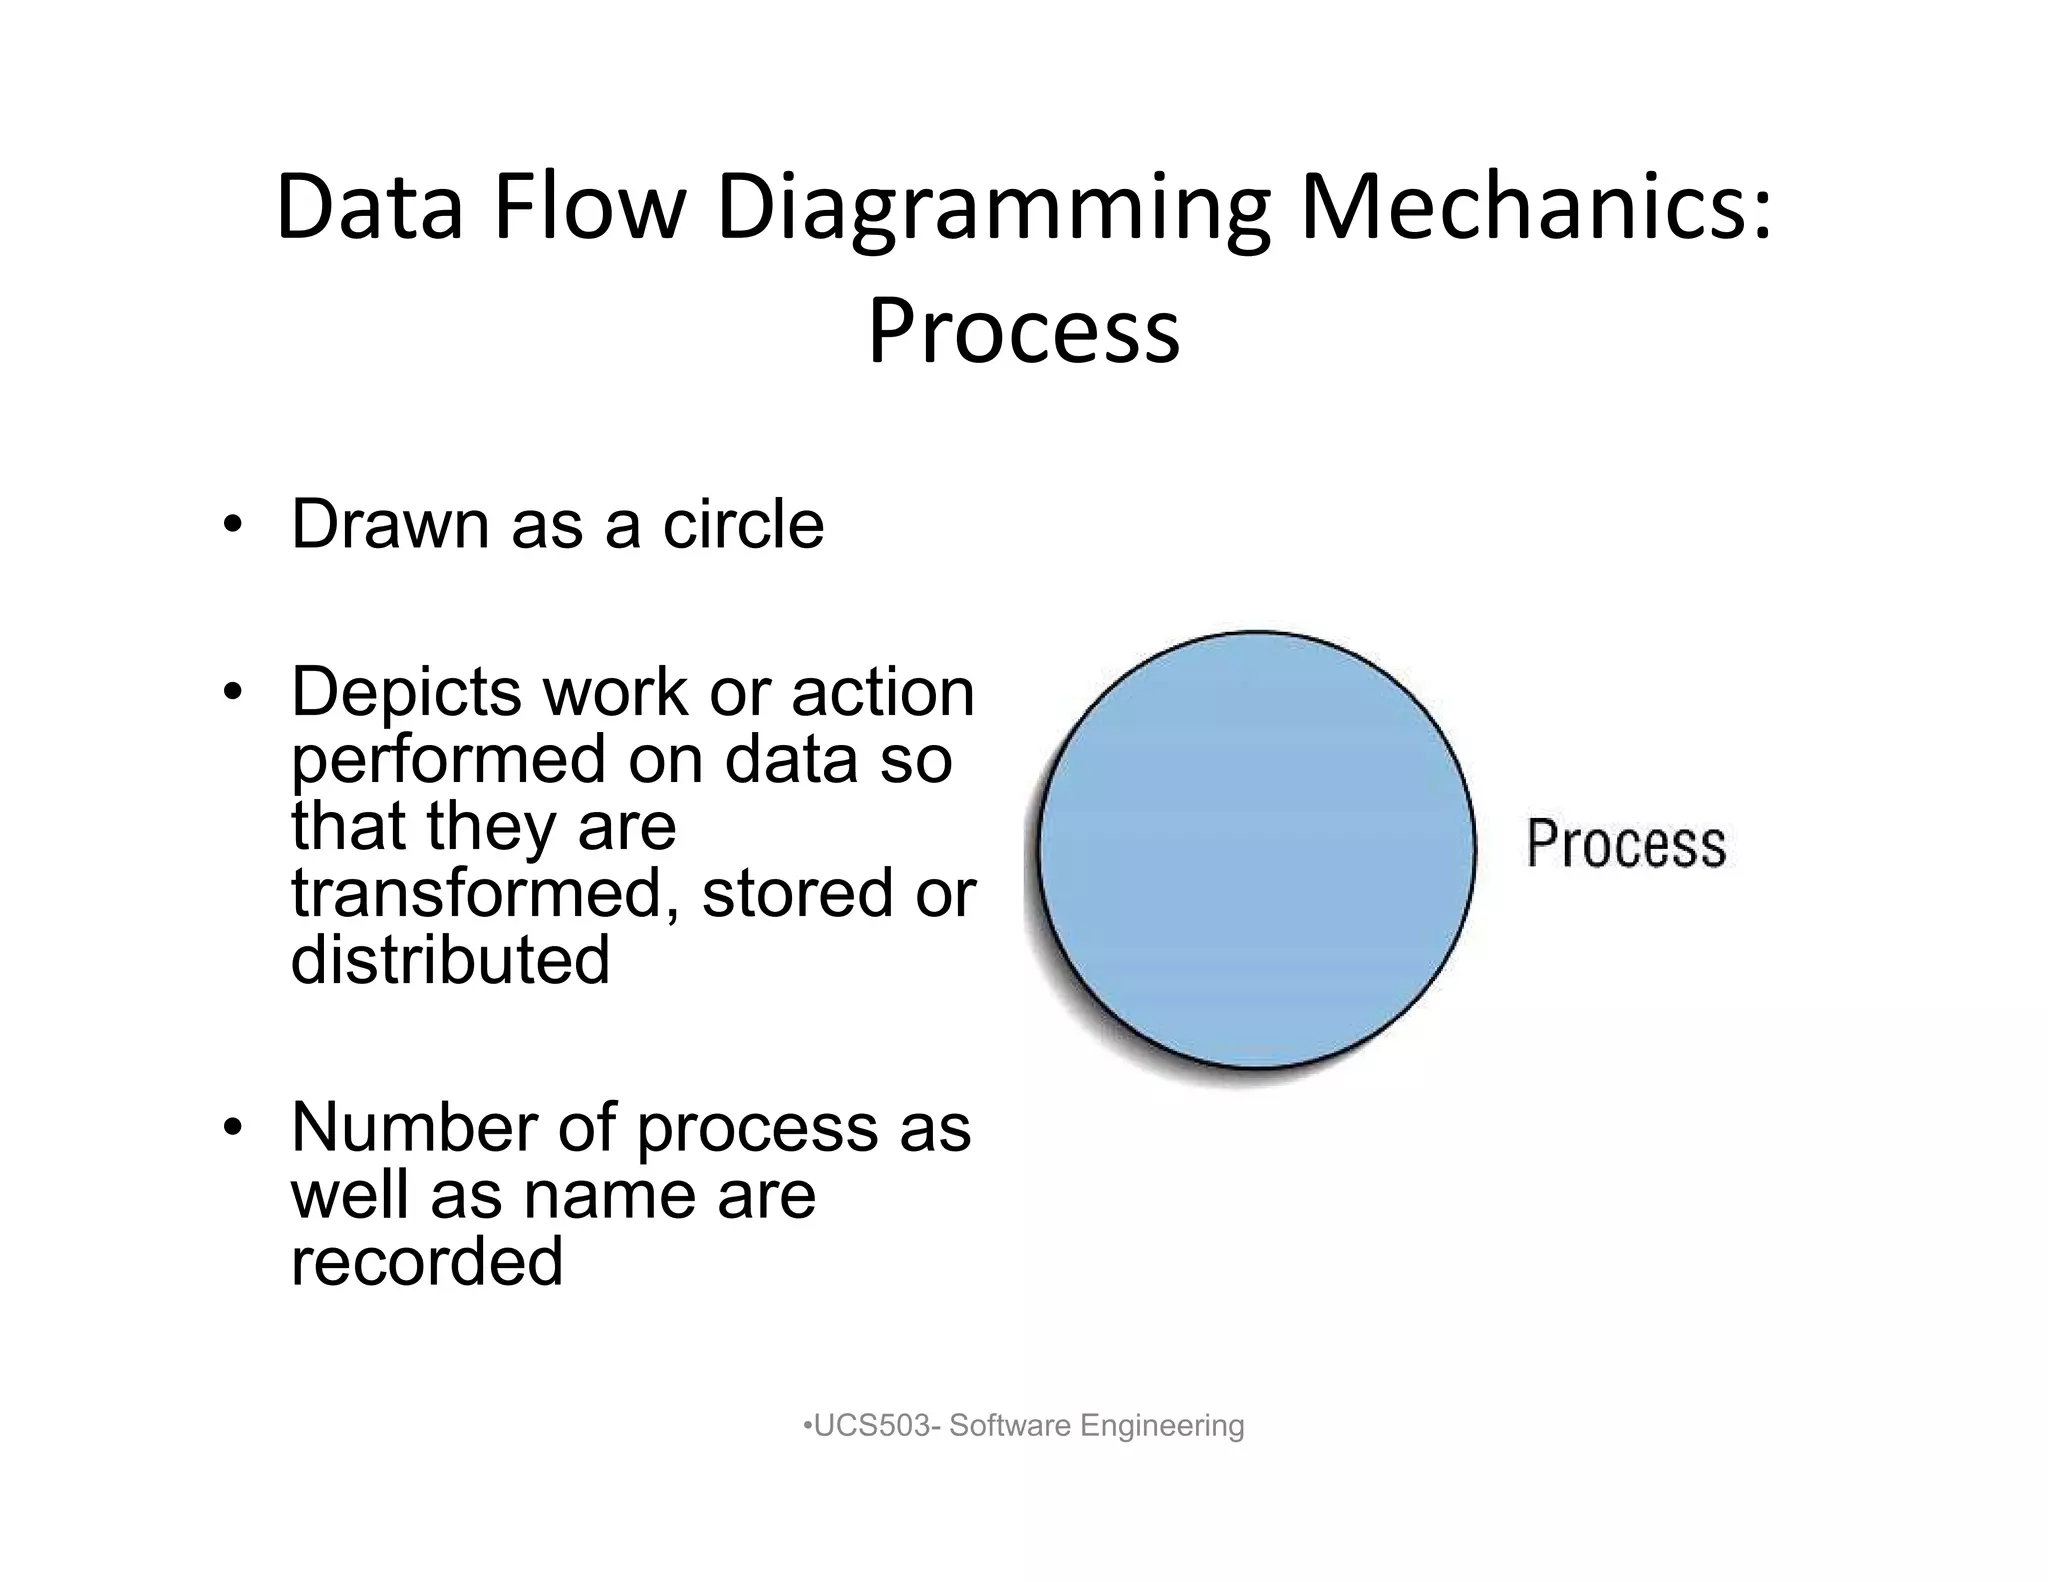
• Drawn as a circle
• Depicts work or action
performed on data so
that they are
transformed, stored or
distributed
• Number of process as
well as name are
recorded
•UCS503- Software Engineering
9.
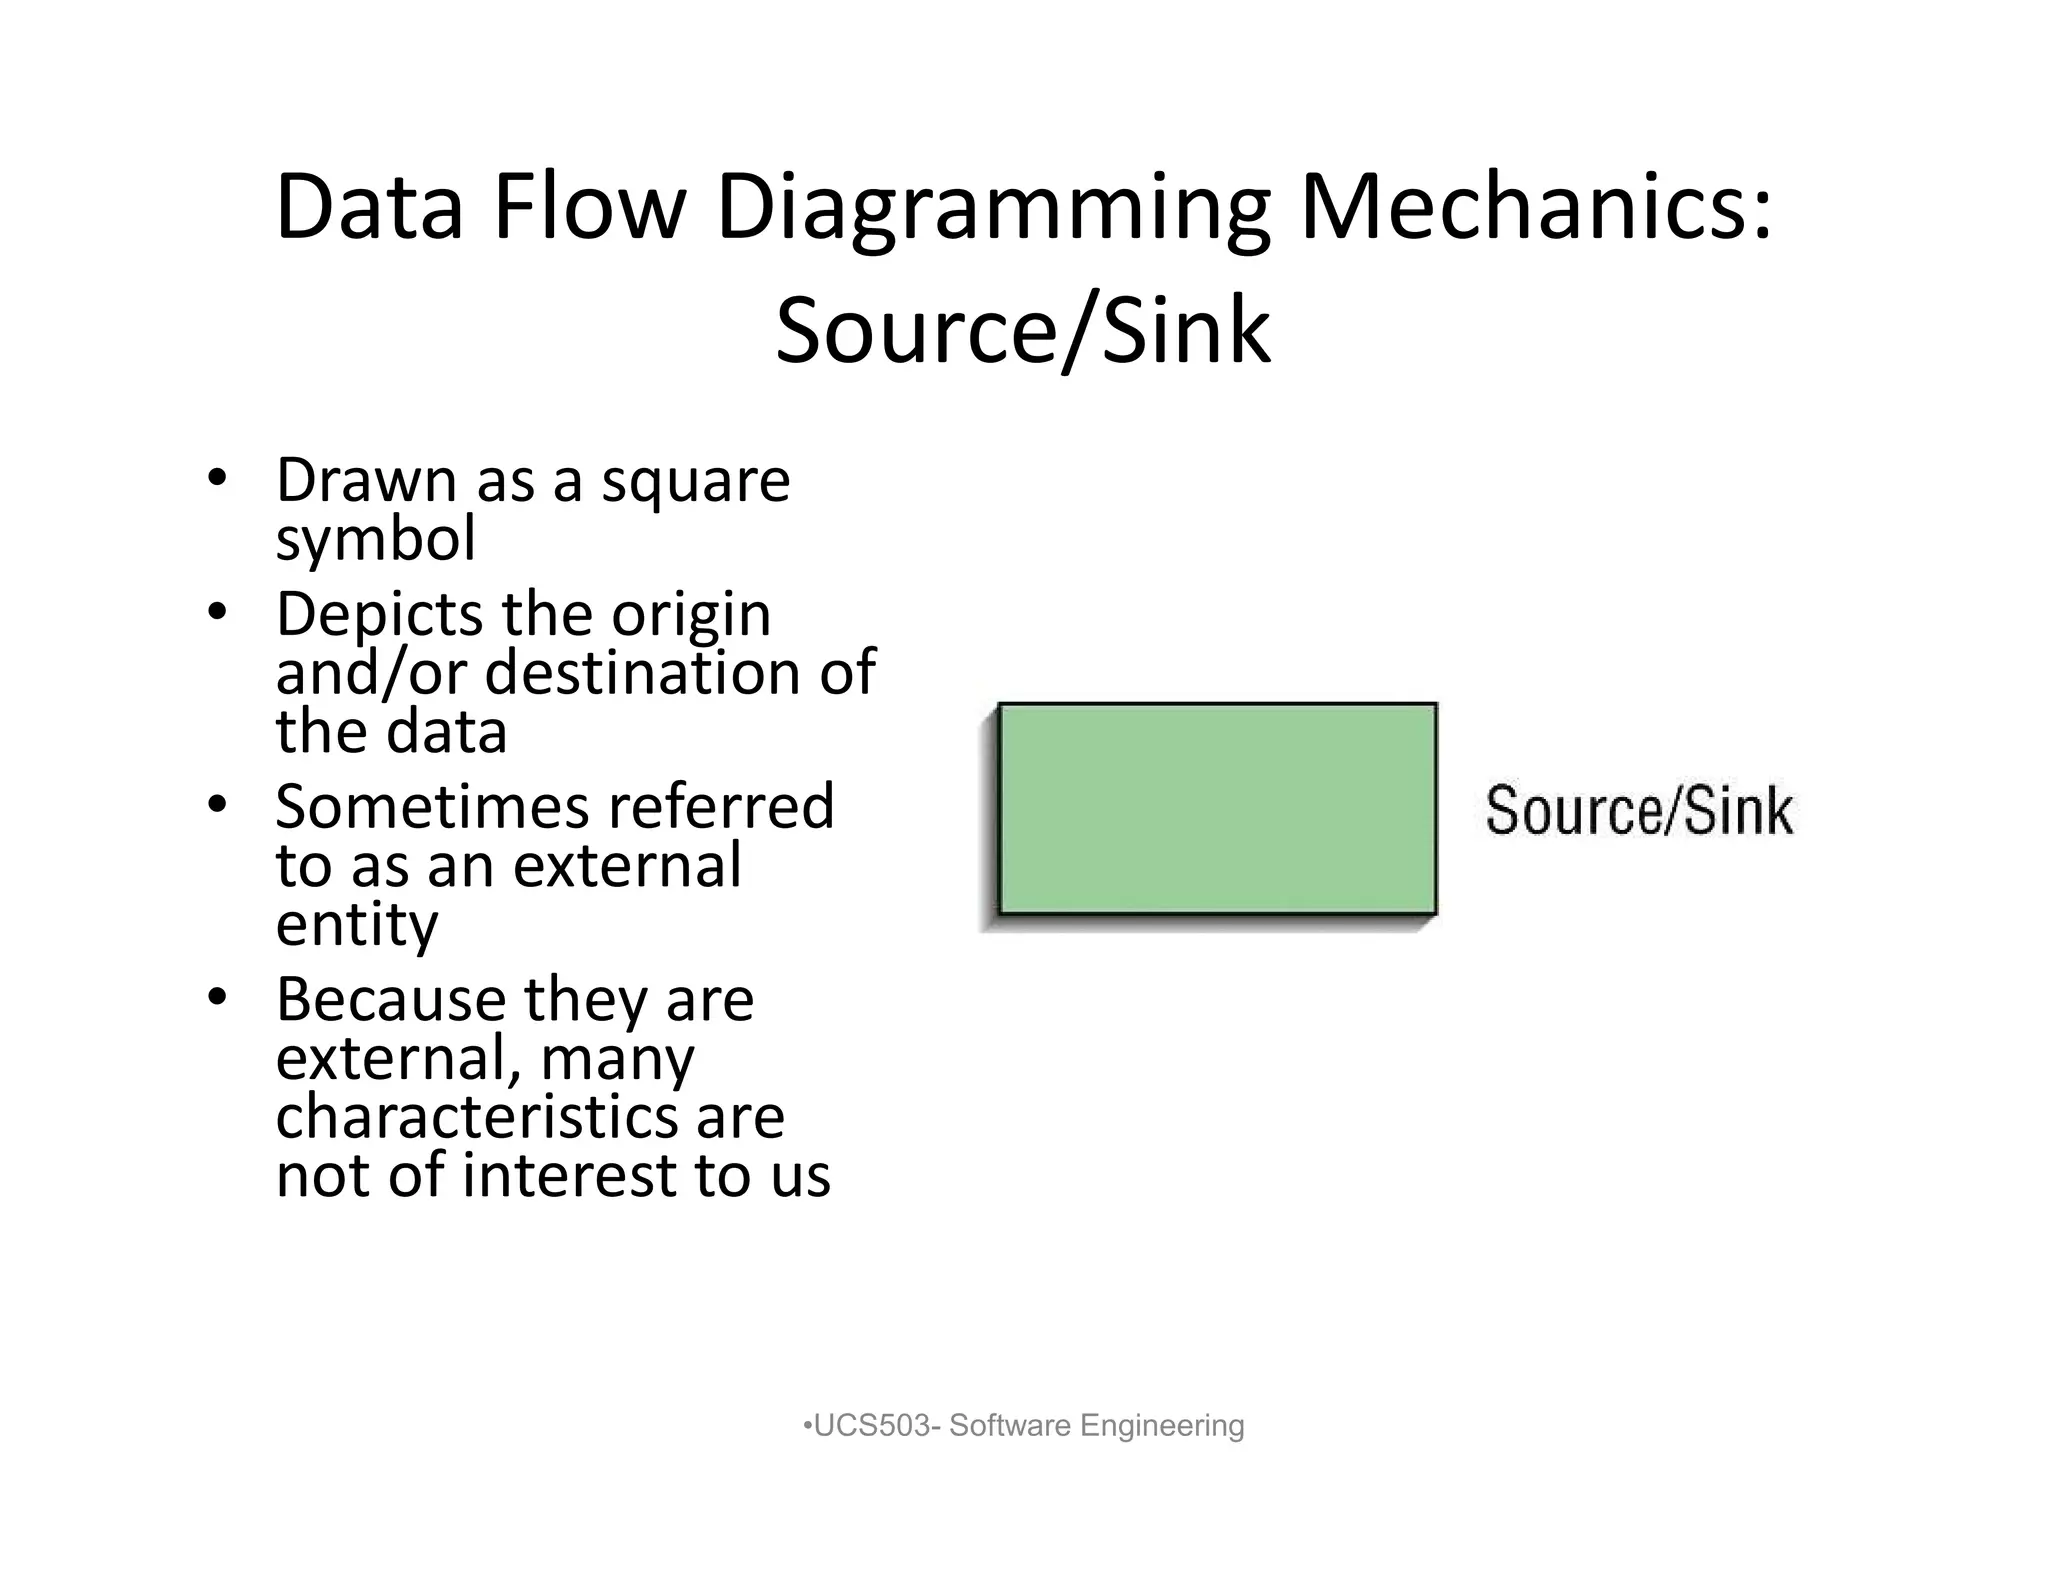
Data Flow DiagrammingMechanics:
Source/Sink
• Drawn as a square
symbol
• Depicts the origin
and/or destination of
the data
• Sometimes referred
to as an external
entity
• Because they are
external, many
characteristics are
not of interest to us
•UCS503- Software Engineering
10.
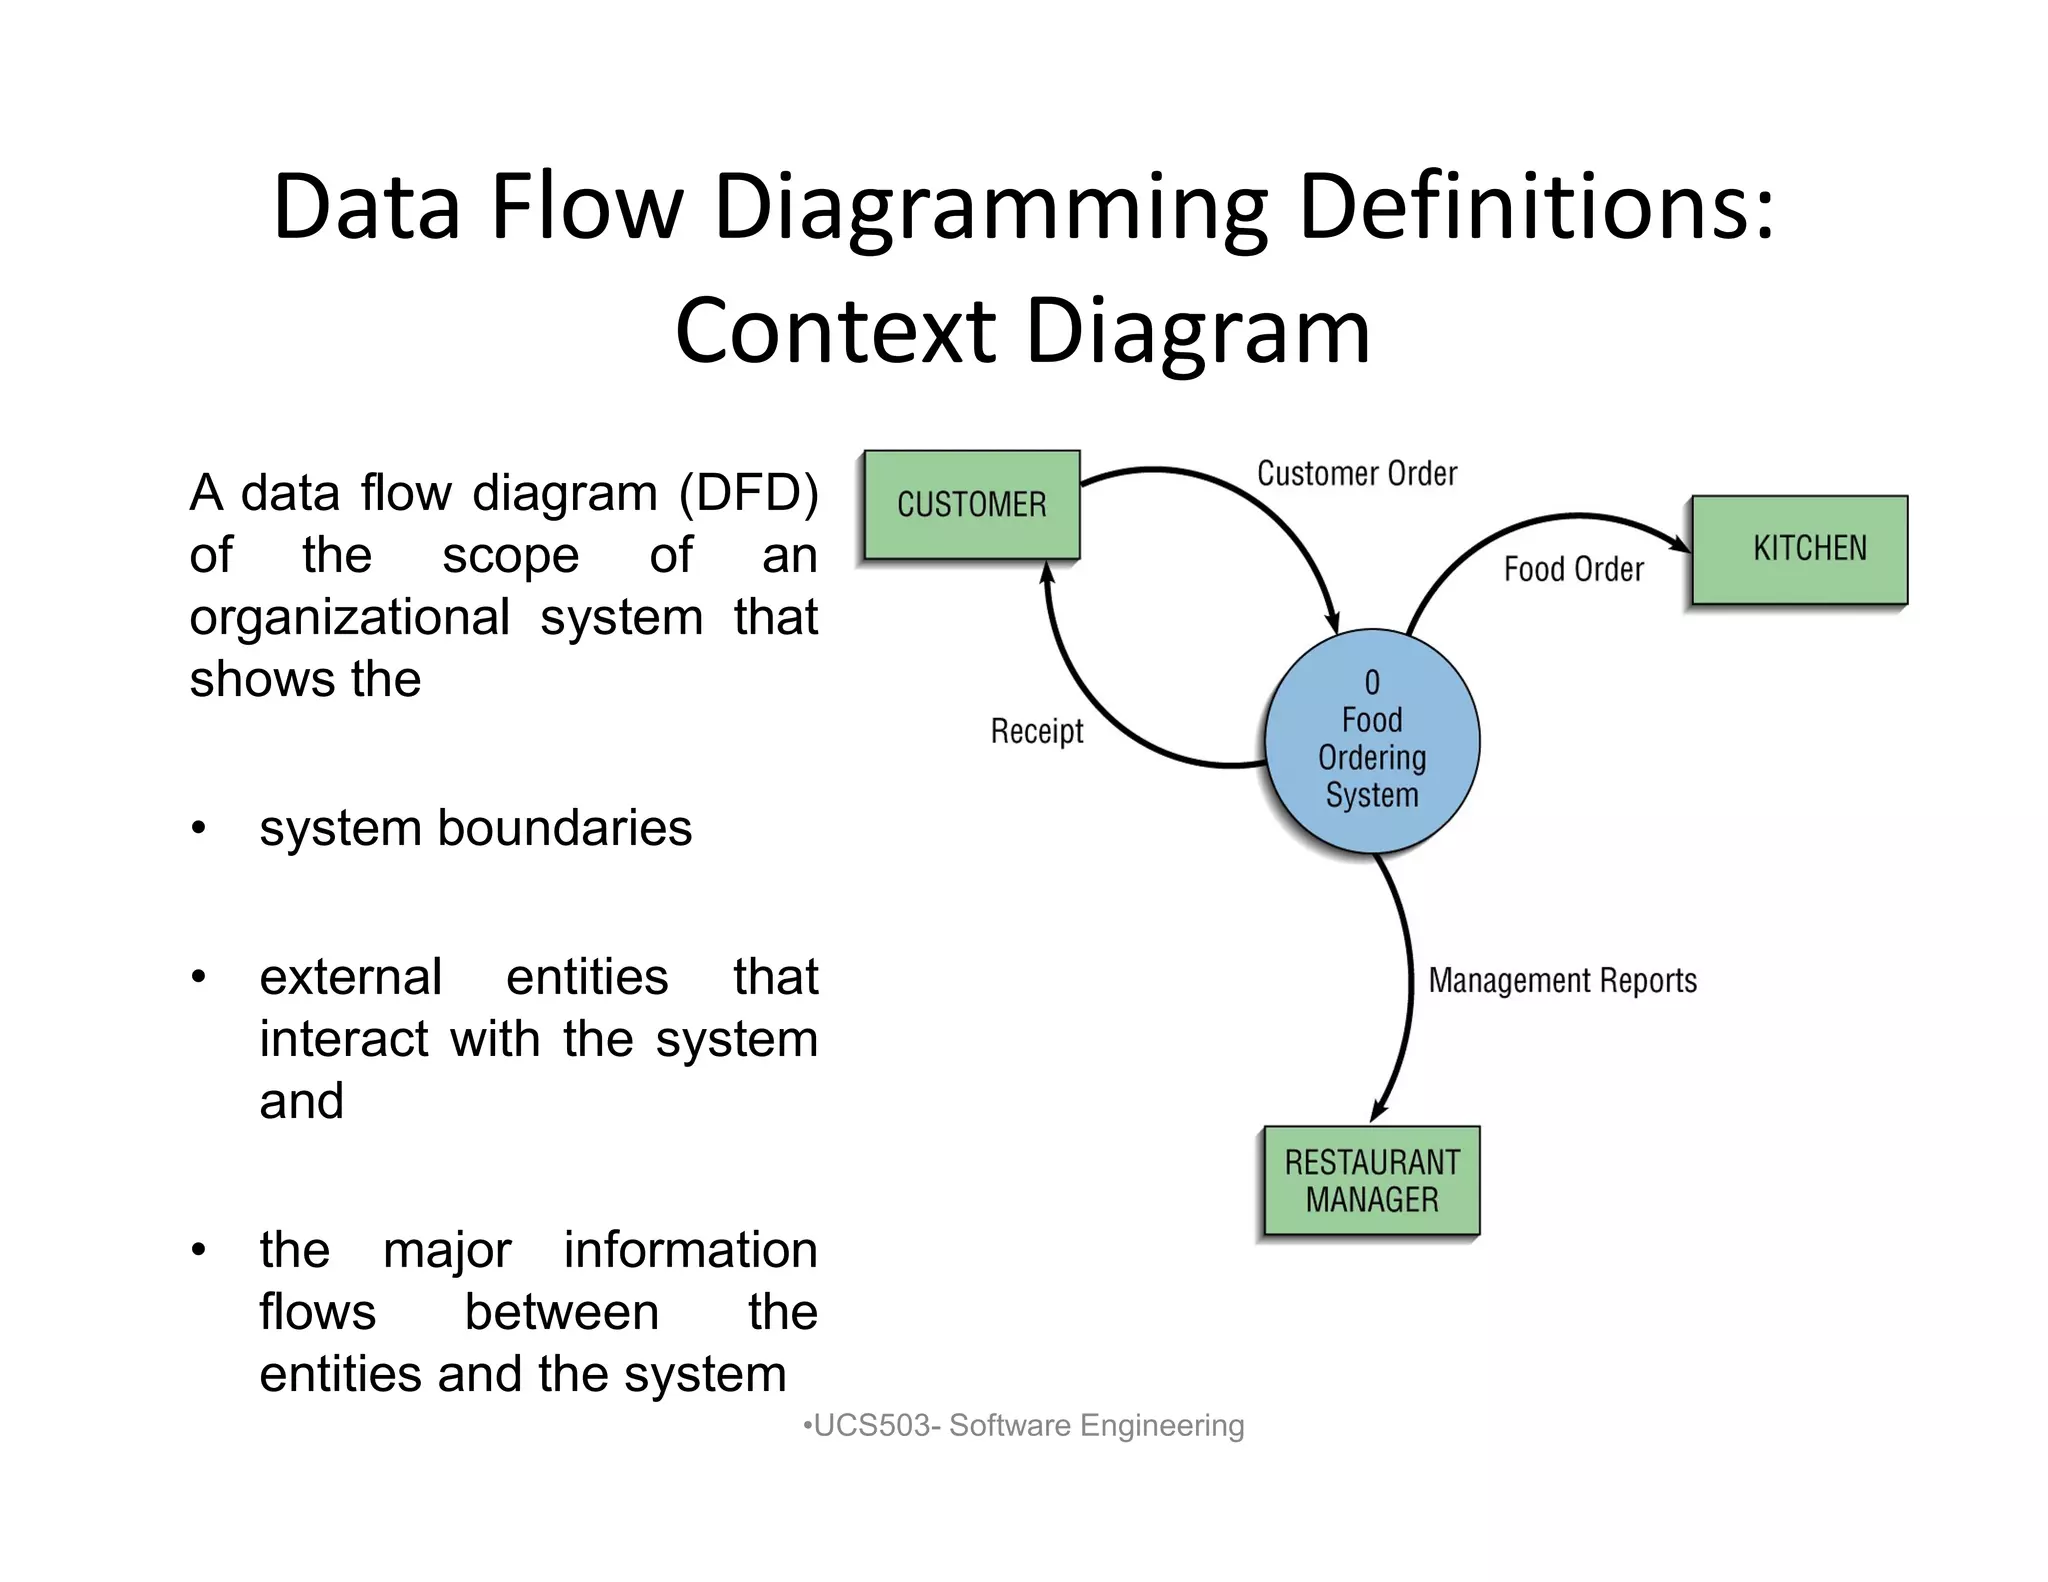
Data Flow DiagrammingDefinitions:
Context Diagram
A data flow diagram (DFD)
of the scope of an
organizational system that
shows the
• system boundaries
• external entities that
interact with the system
and
• the major information
flows between the
entities and the system
•UCS503- Software Engineering
11.
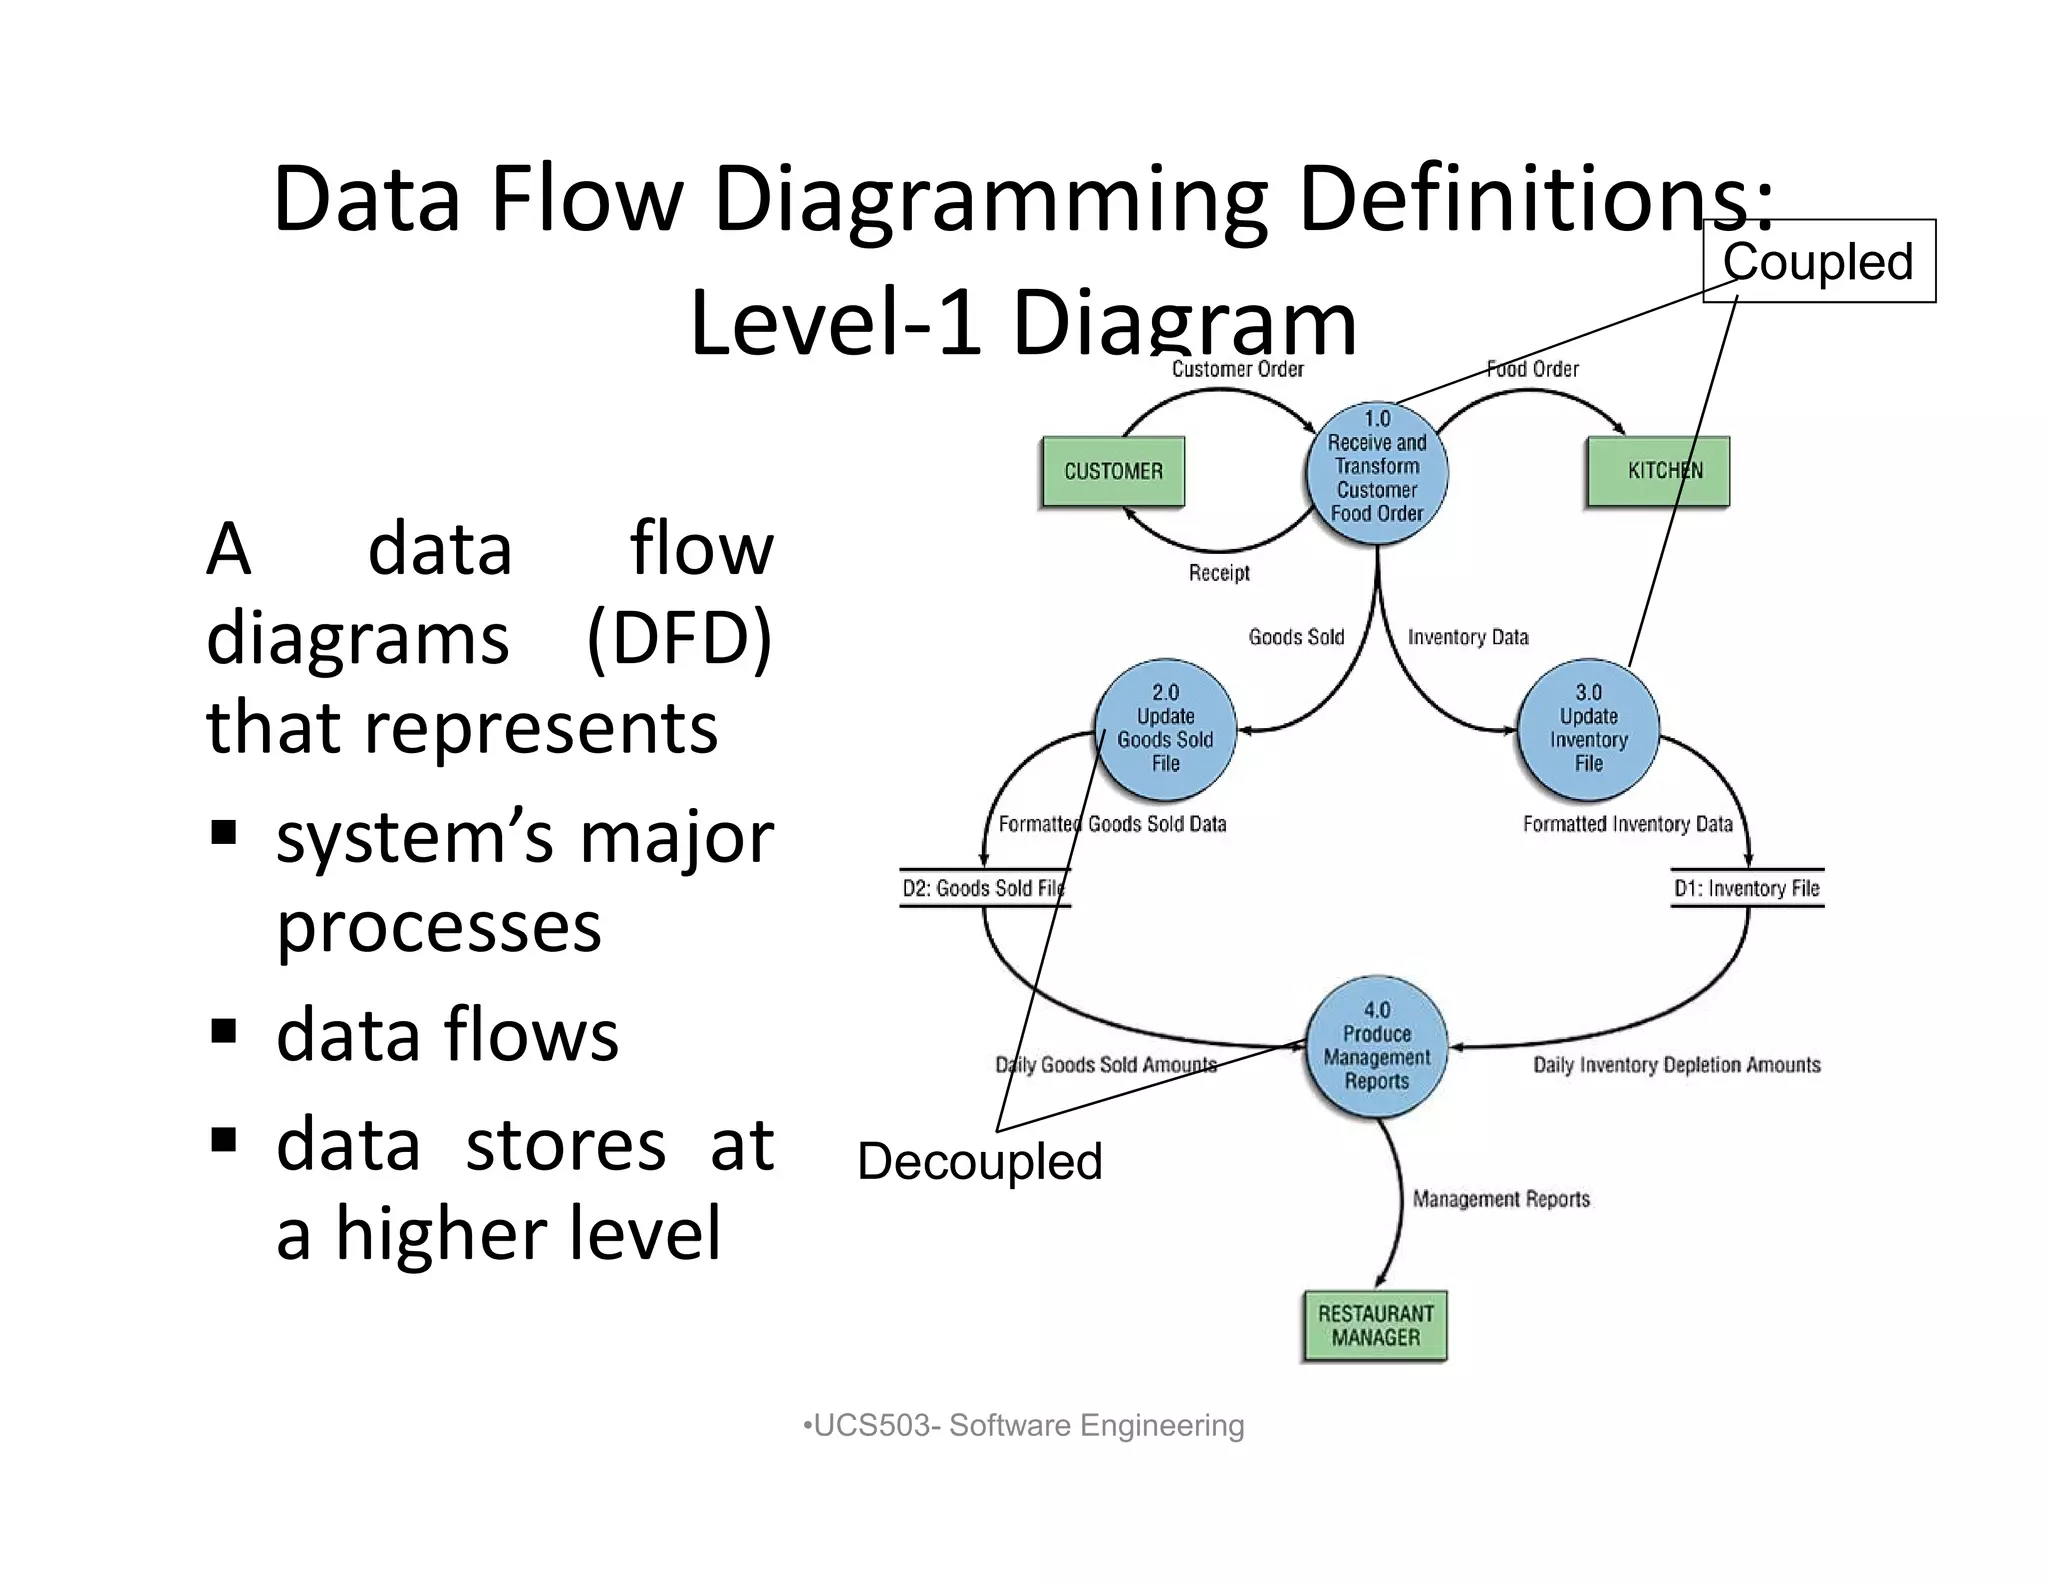
Data Flow DiagrammingDefinitions:
Level-1 Diagram
A data flow
diagrams (DFD)
that represents
system’s major
processes
data flows
data stores at
a higher level
•UCS503- Software Engineering
Coupled
Decoupled
12.
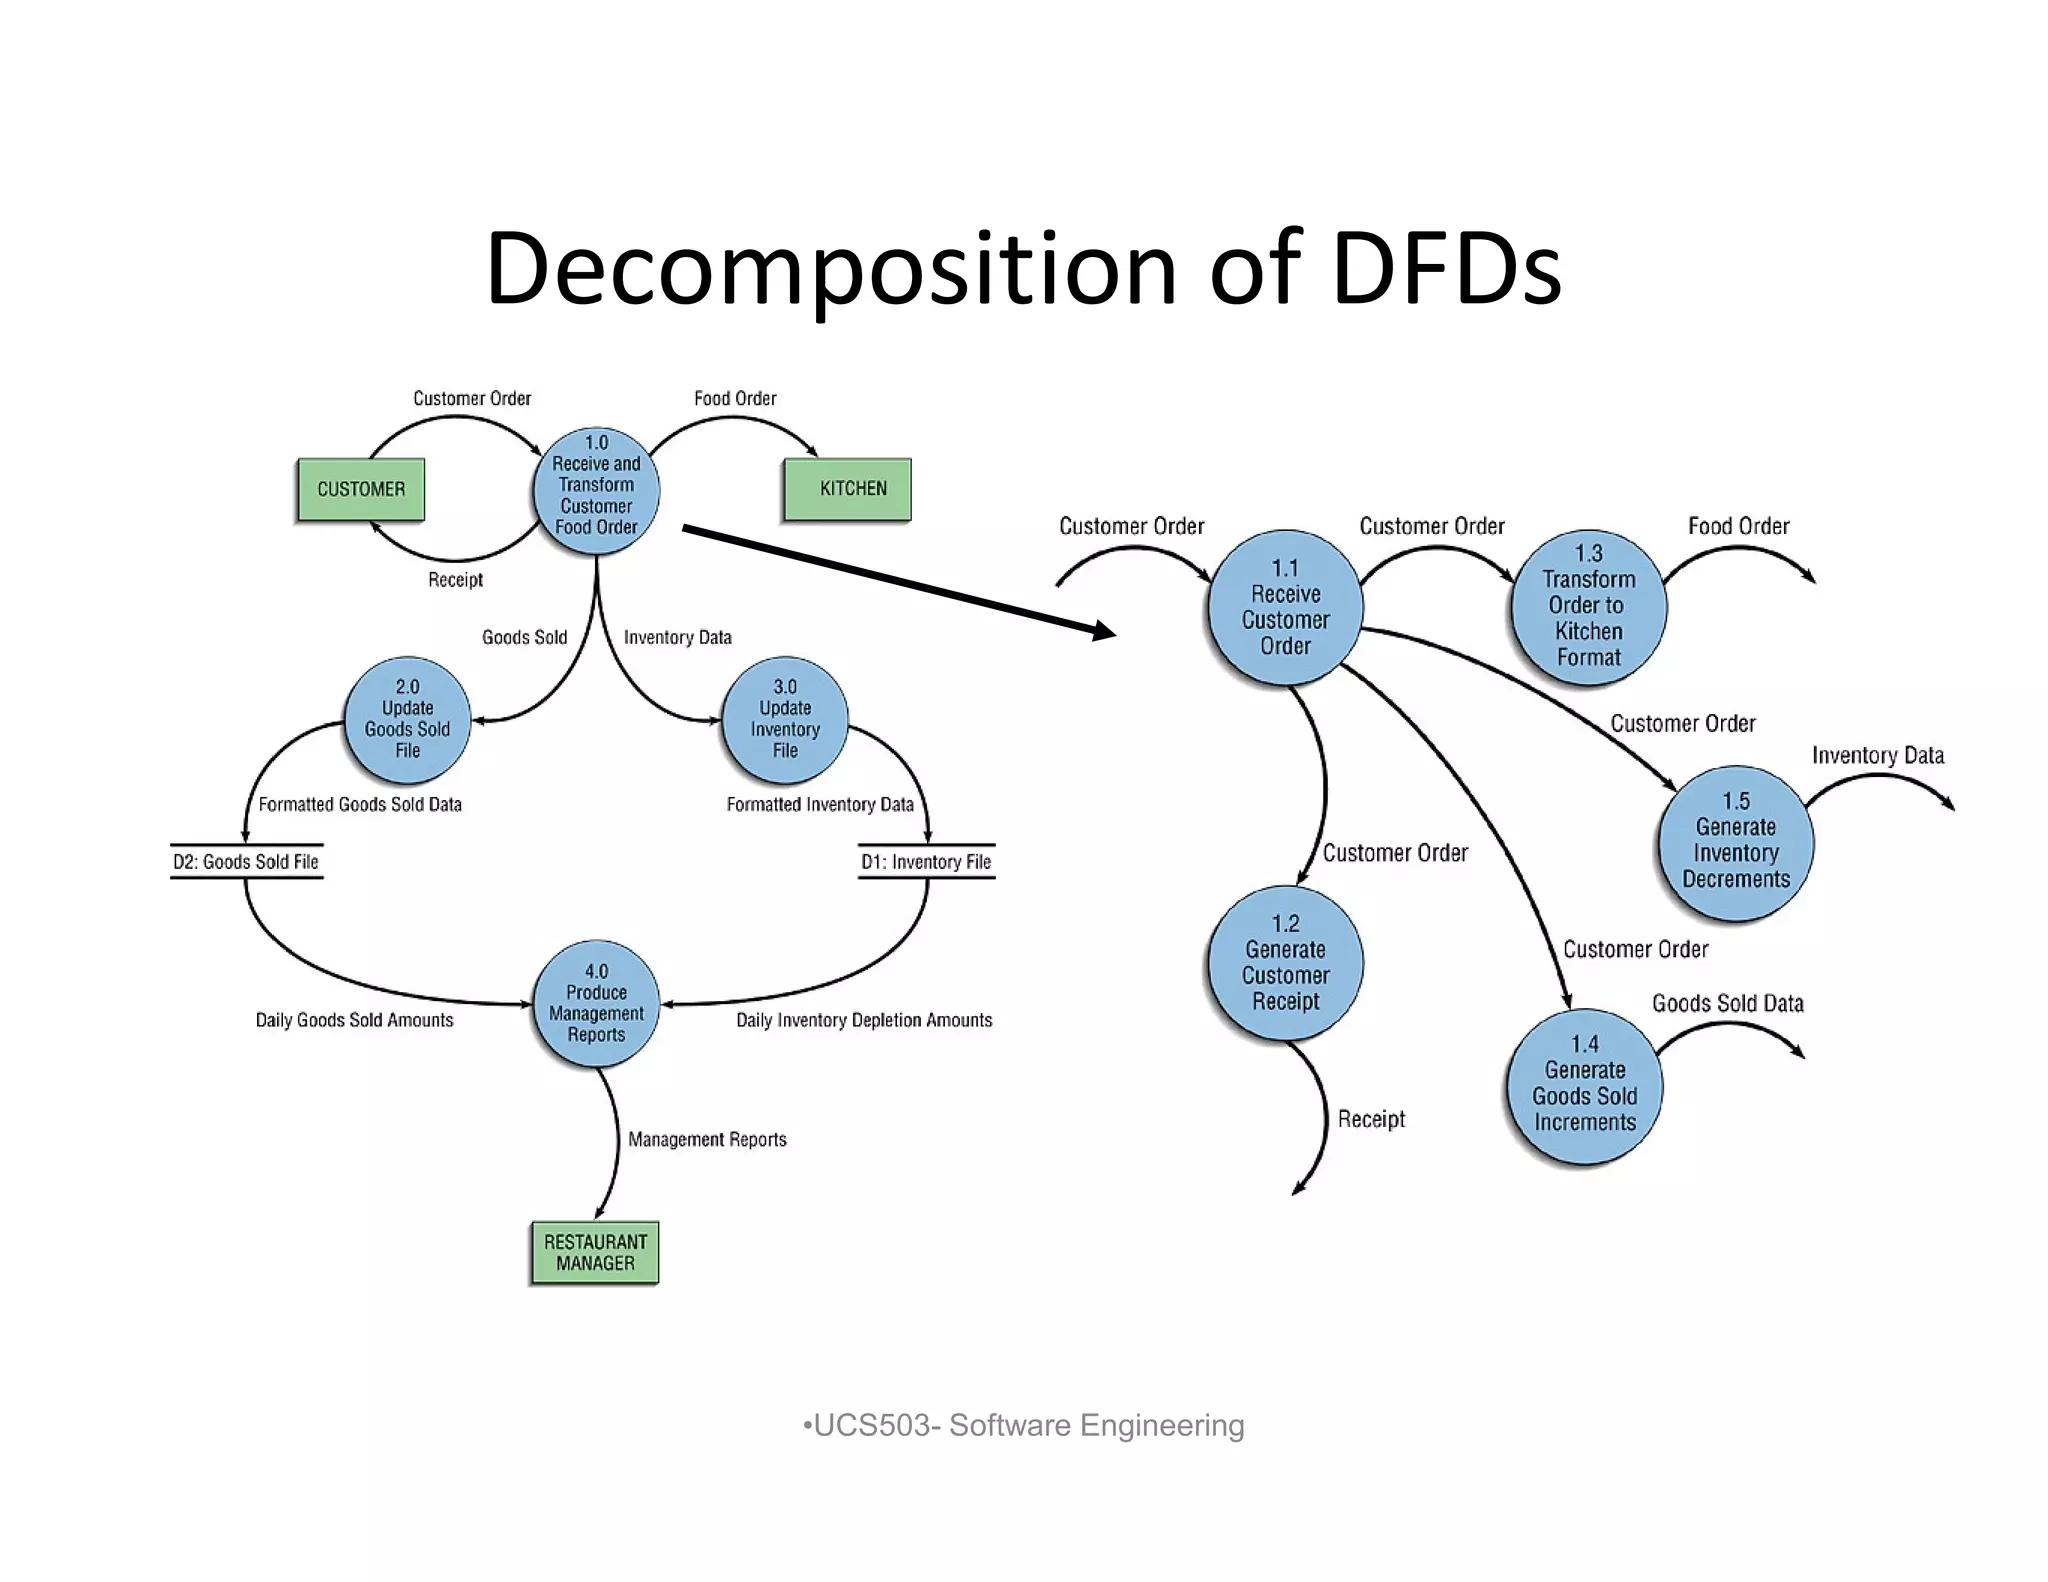
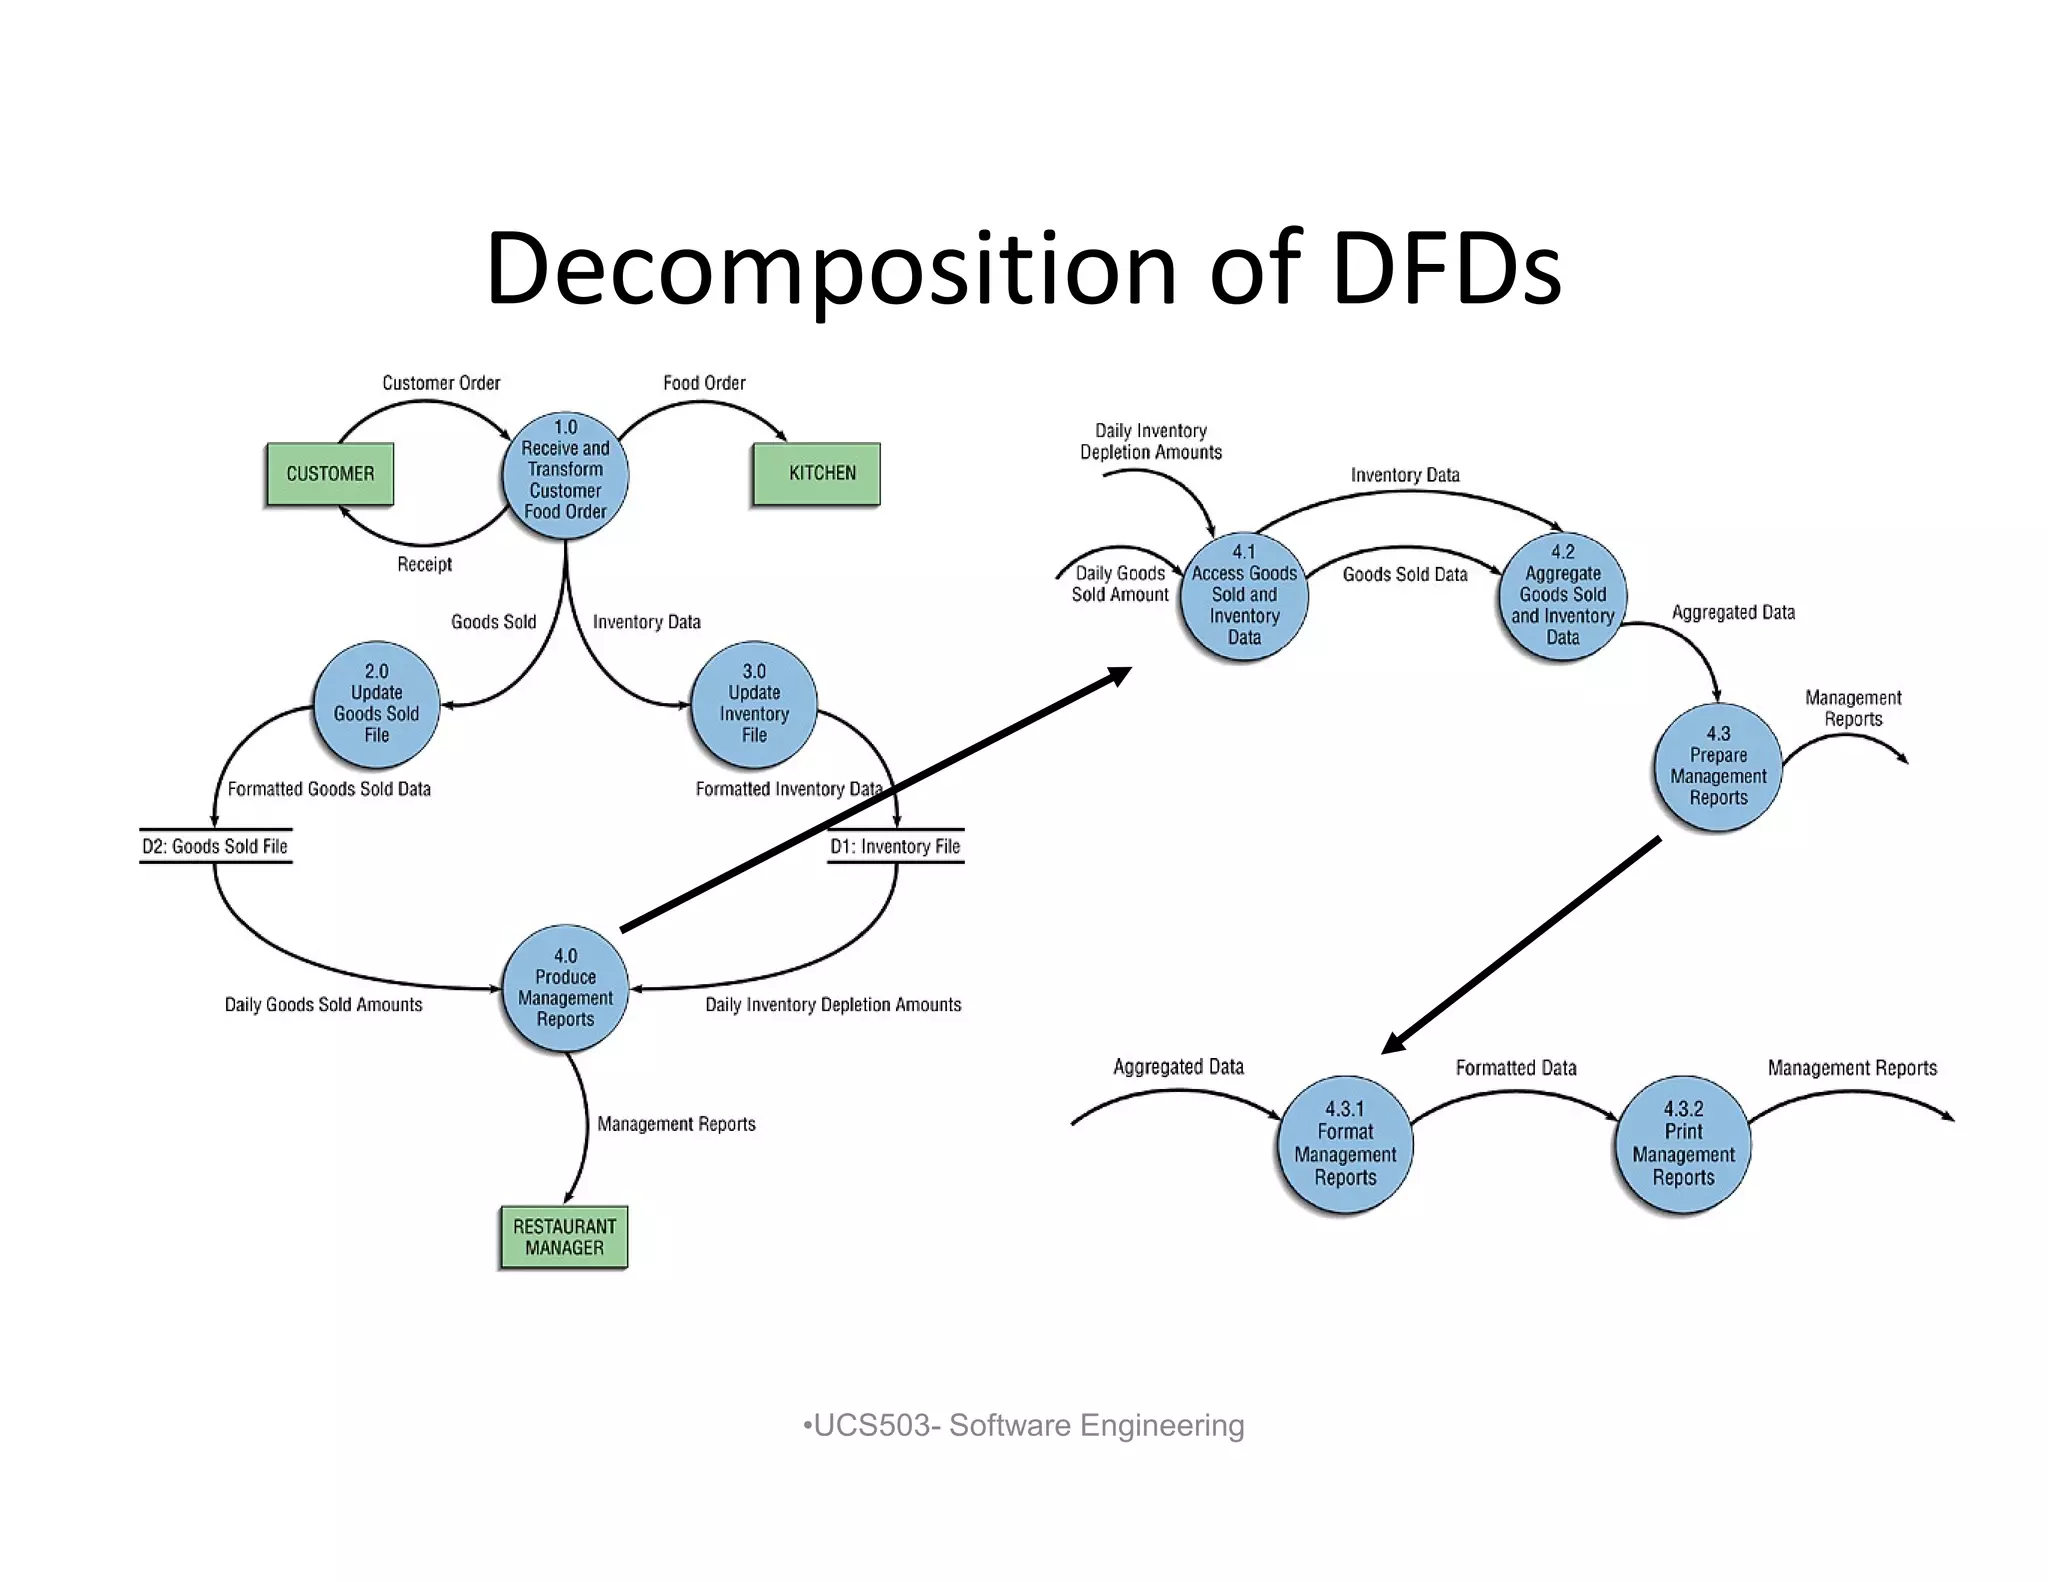
Decomposition of DFDs
•Functional decomposition
– Act of going from one single system to many
component processes
– Repetitive procedure
– Lowest level is called a primitive DFD
• Level-N Diagrams
– A DFD that is the result of n nested
decompositions of a series of subprocesses
from a process on a level-0 diagram
•UCS503- Software Engineering
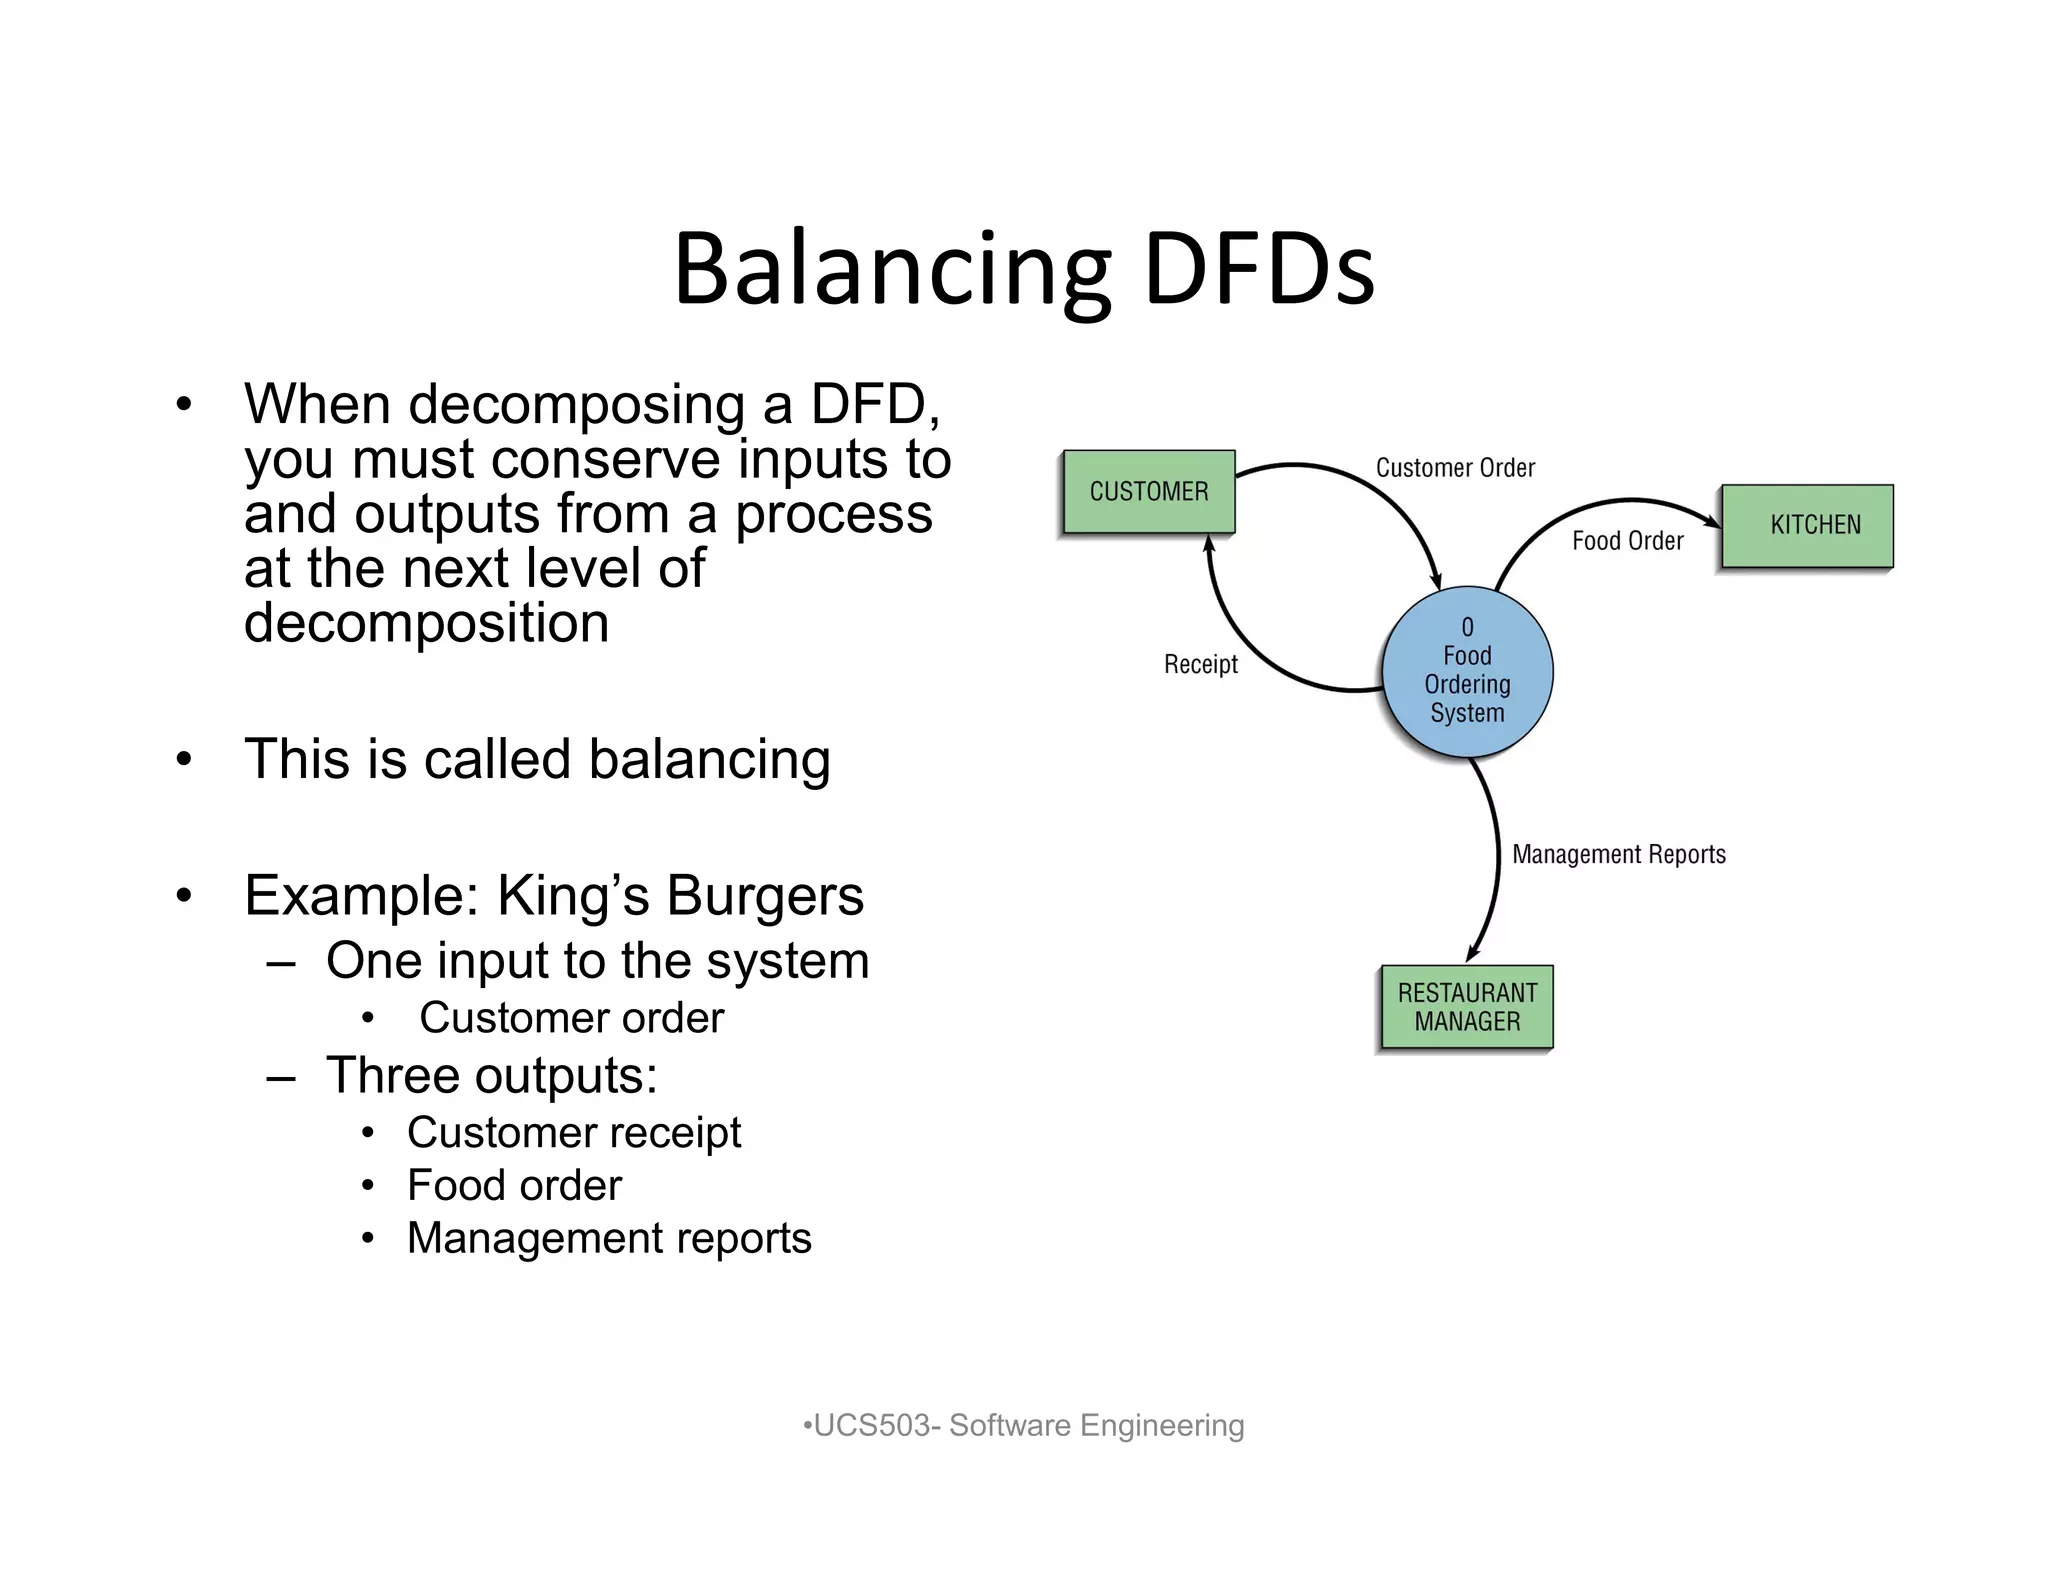
Balancing DFDs
• Whendecomposing a DFD,
you must conserve inputs to
and outputs from a process
at the next level of
decomposition
• This is called balancing
• Example: King’s Burgers
– One input to the system
• Customer order
– Three outputs:
• Customer receipt
• Food order
• Management reports
•UCS503- Software Engineering
16.
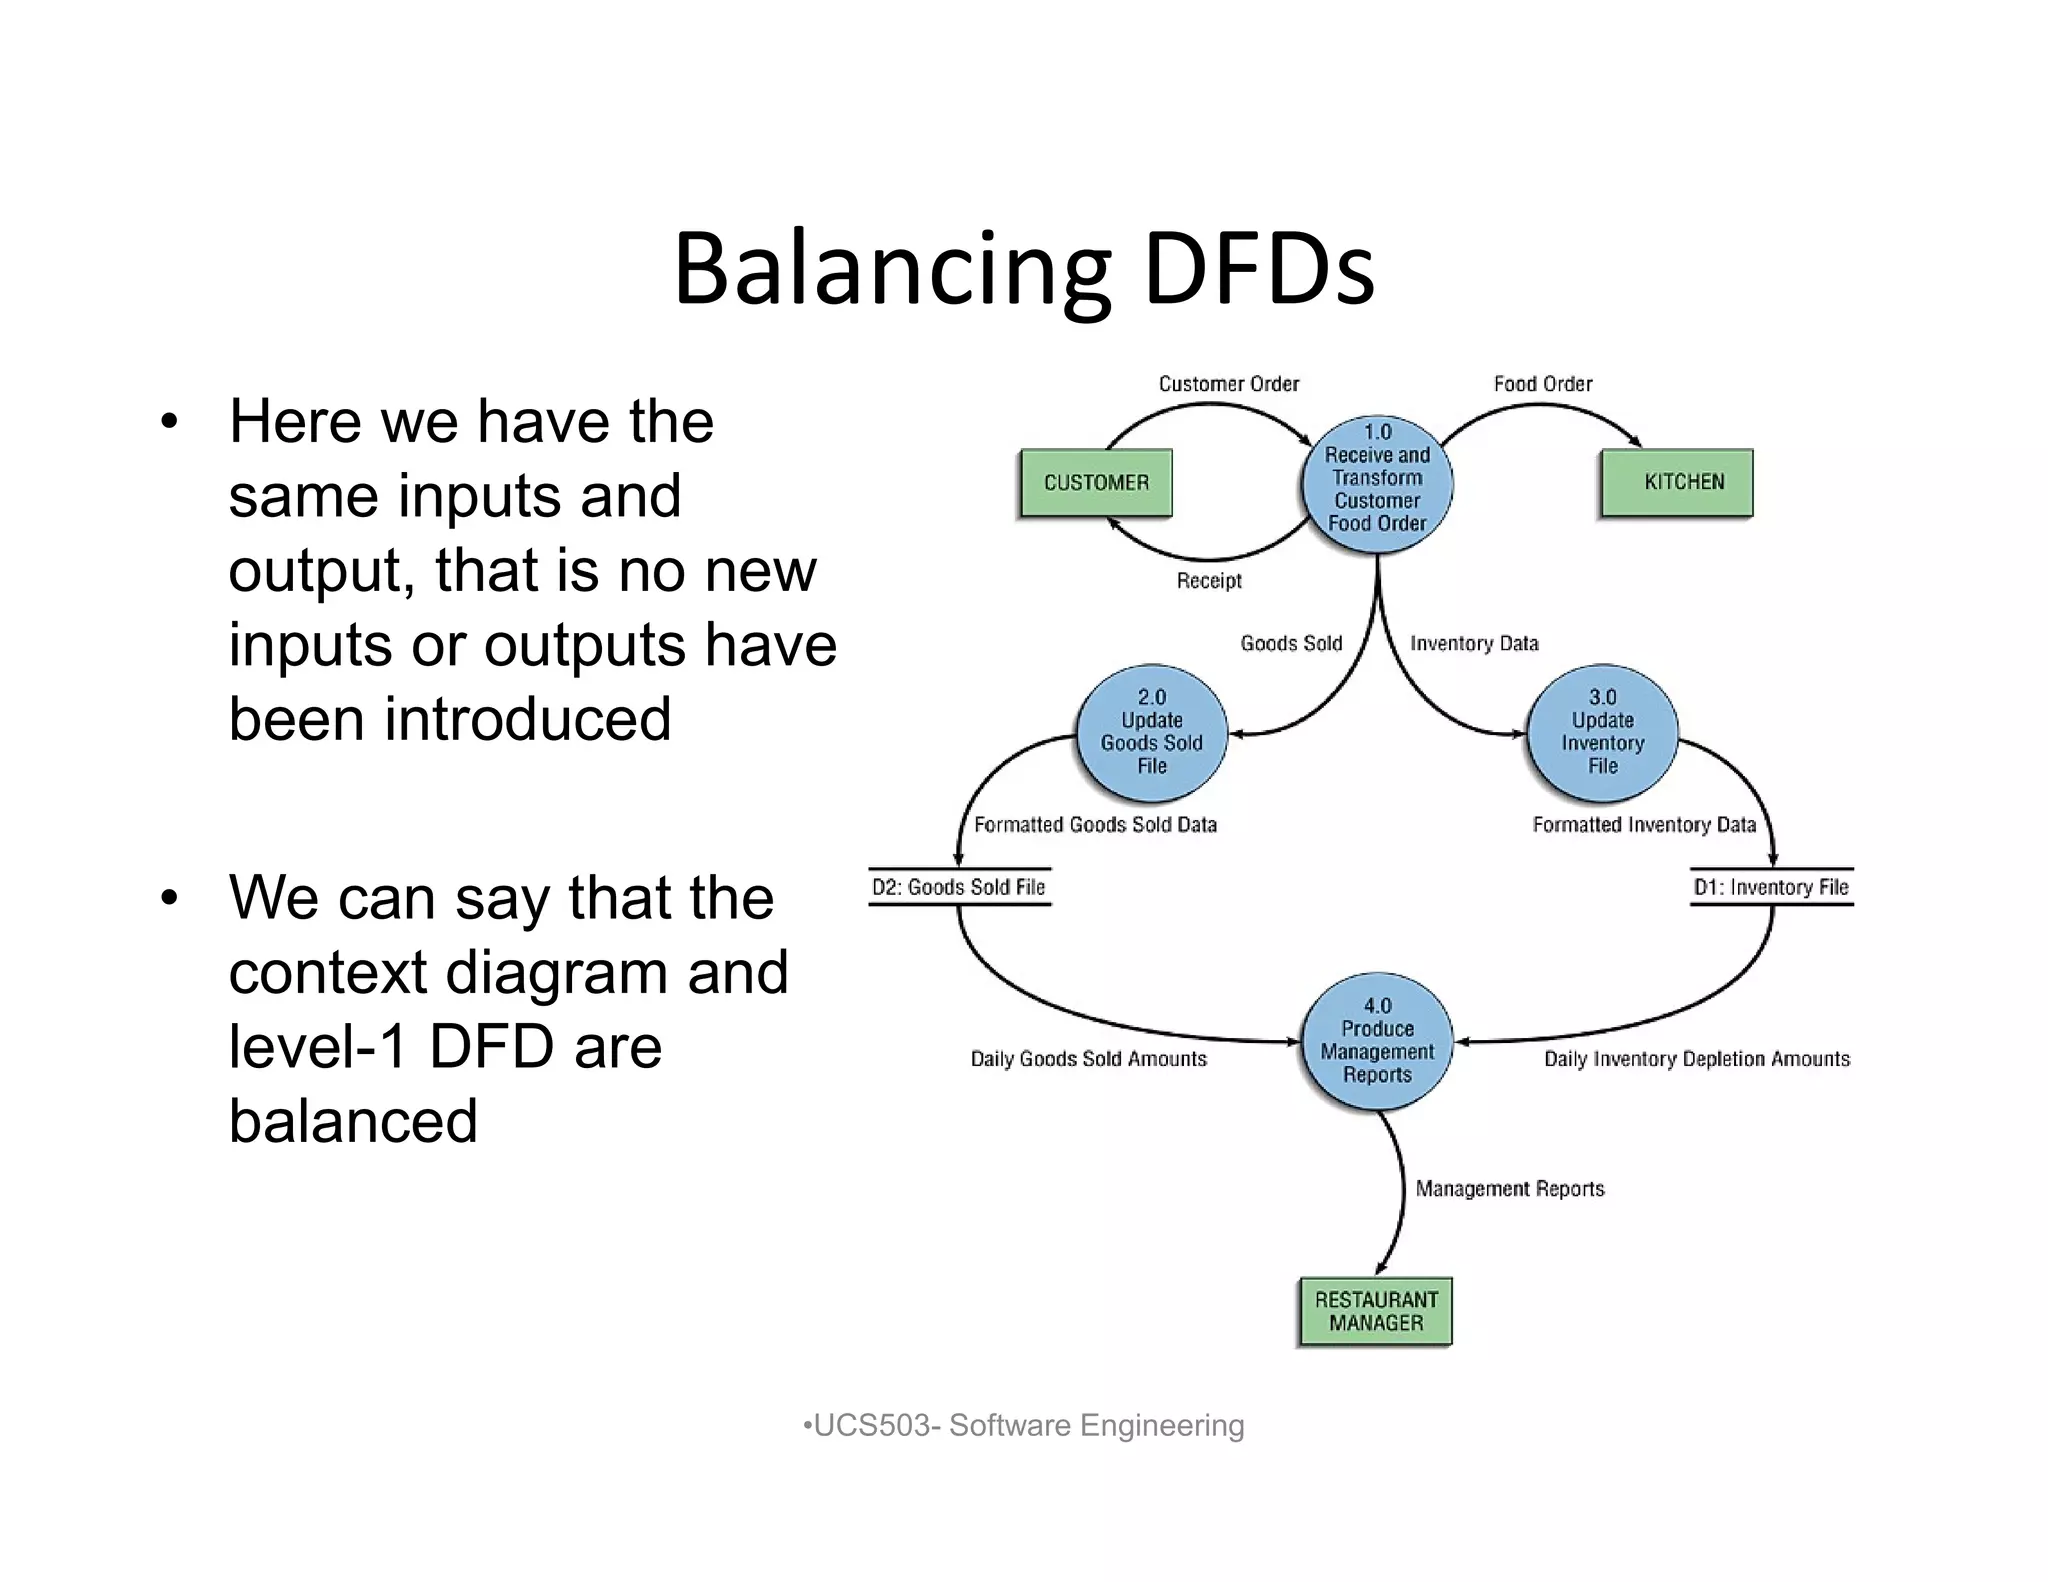
Balancing DFDs
• Herewe have the
same inputs and
output, that is no new
inputs or outputs have
been introduced
• We can say that the
context diagram and
level-1 DFD are
balanced
•UCS503- Software Engineering
17.
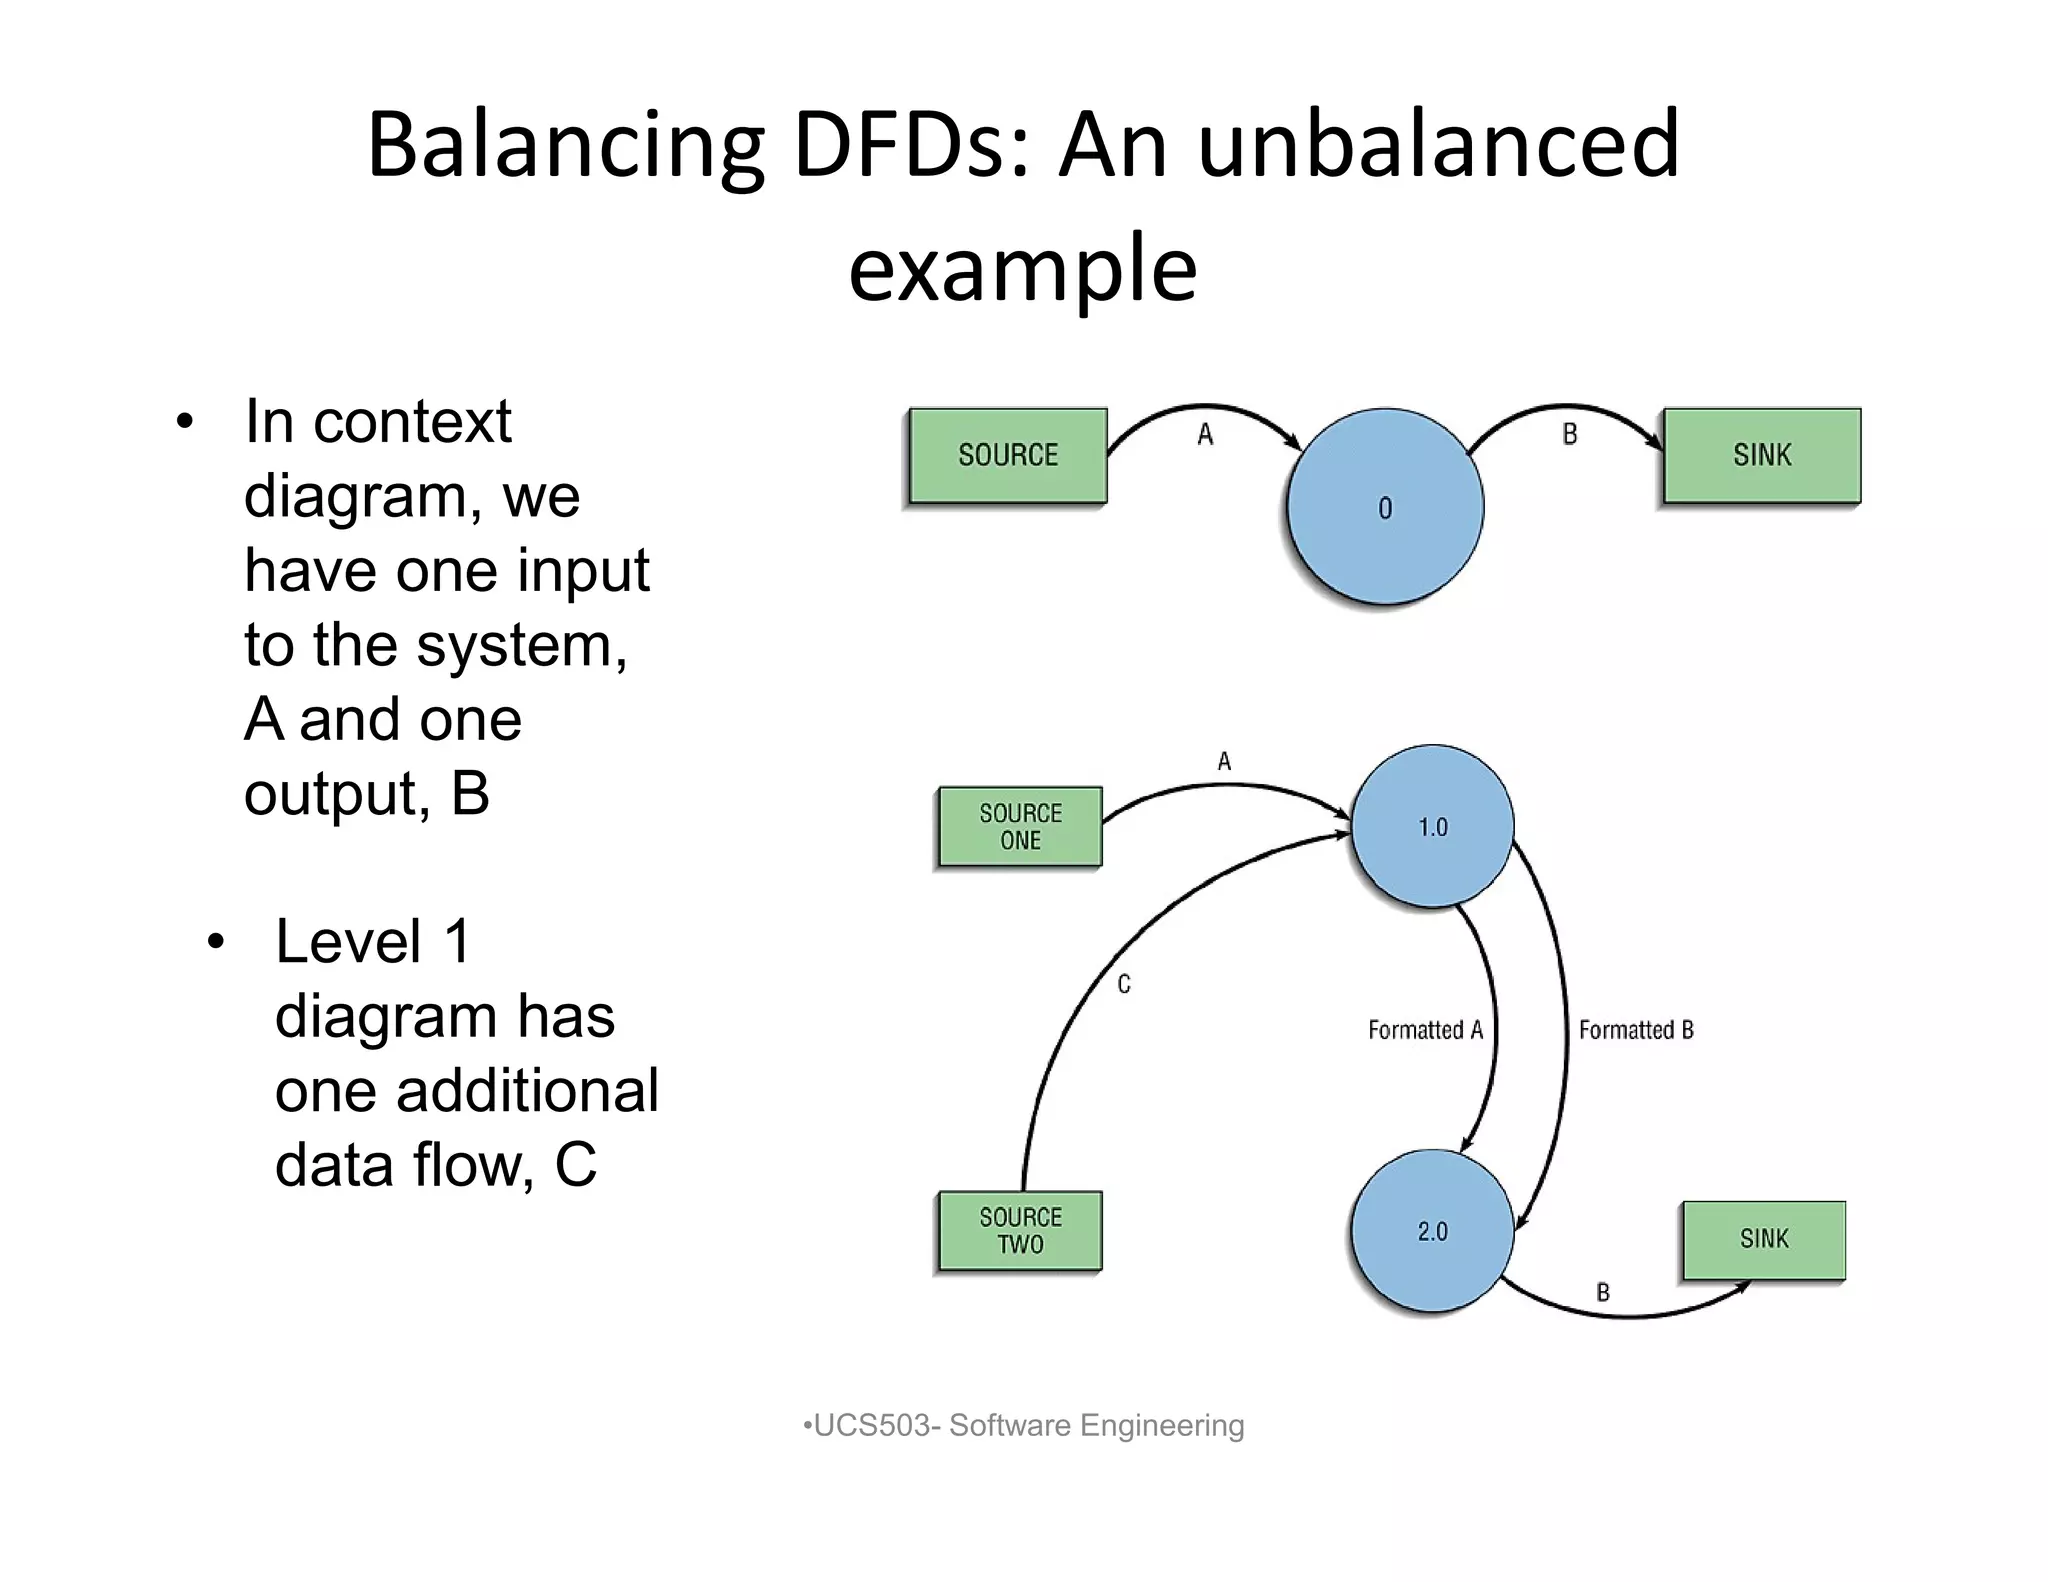
Balancing DFDs: Anunbalanced
example
• In context
diagram, we
have one input
to the system,
A and one
output, B
•UCS503- Software Engineering
• Level 1
diagram has
one additional
data flow, C
18.
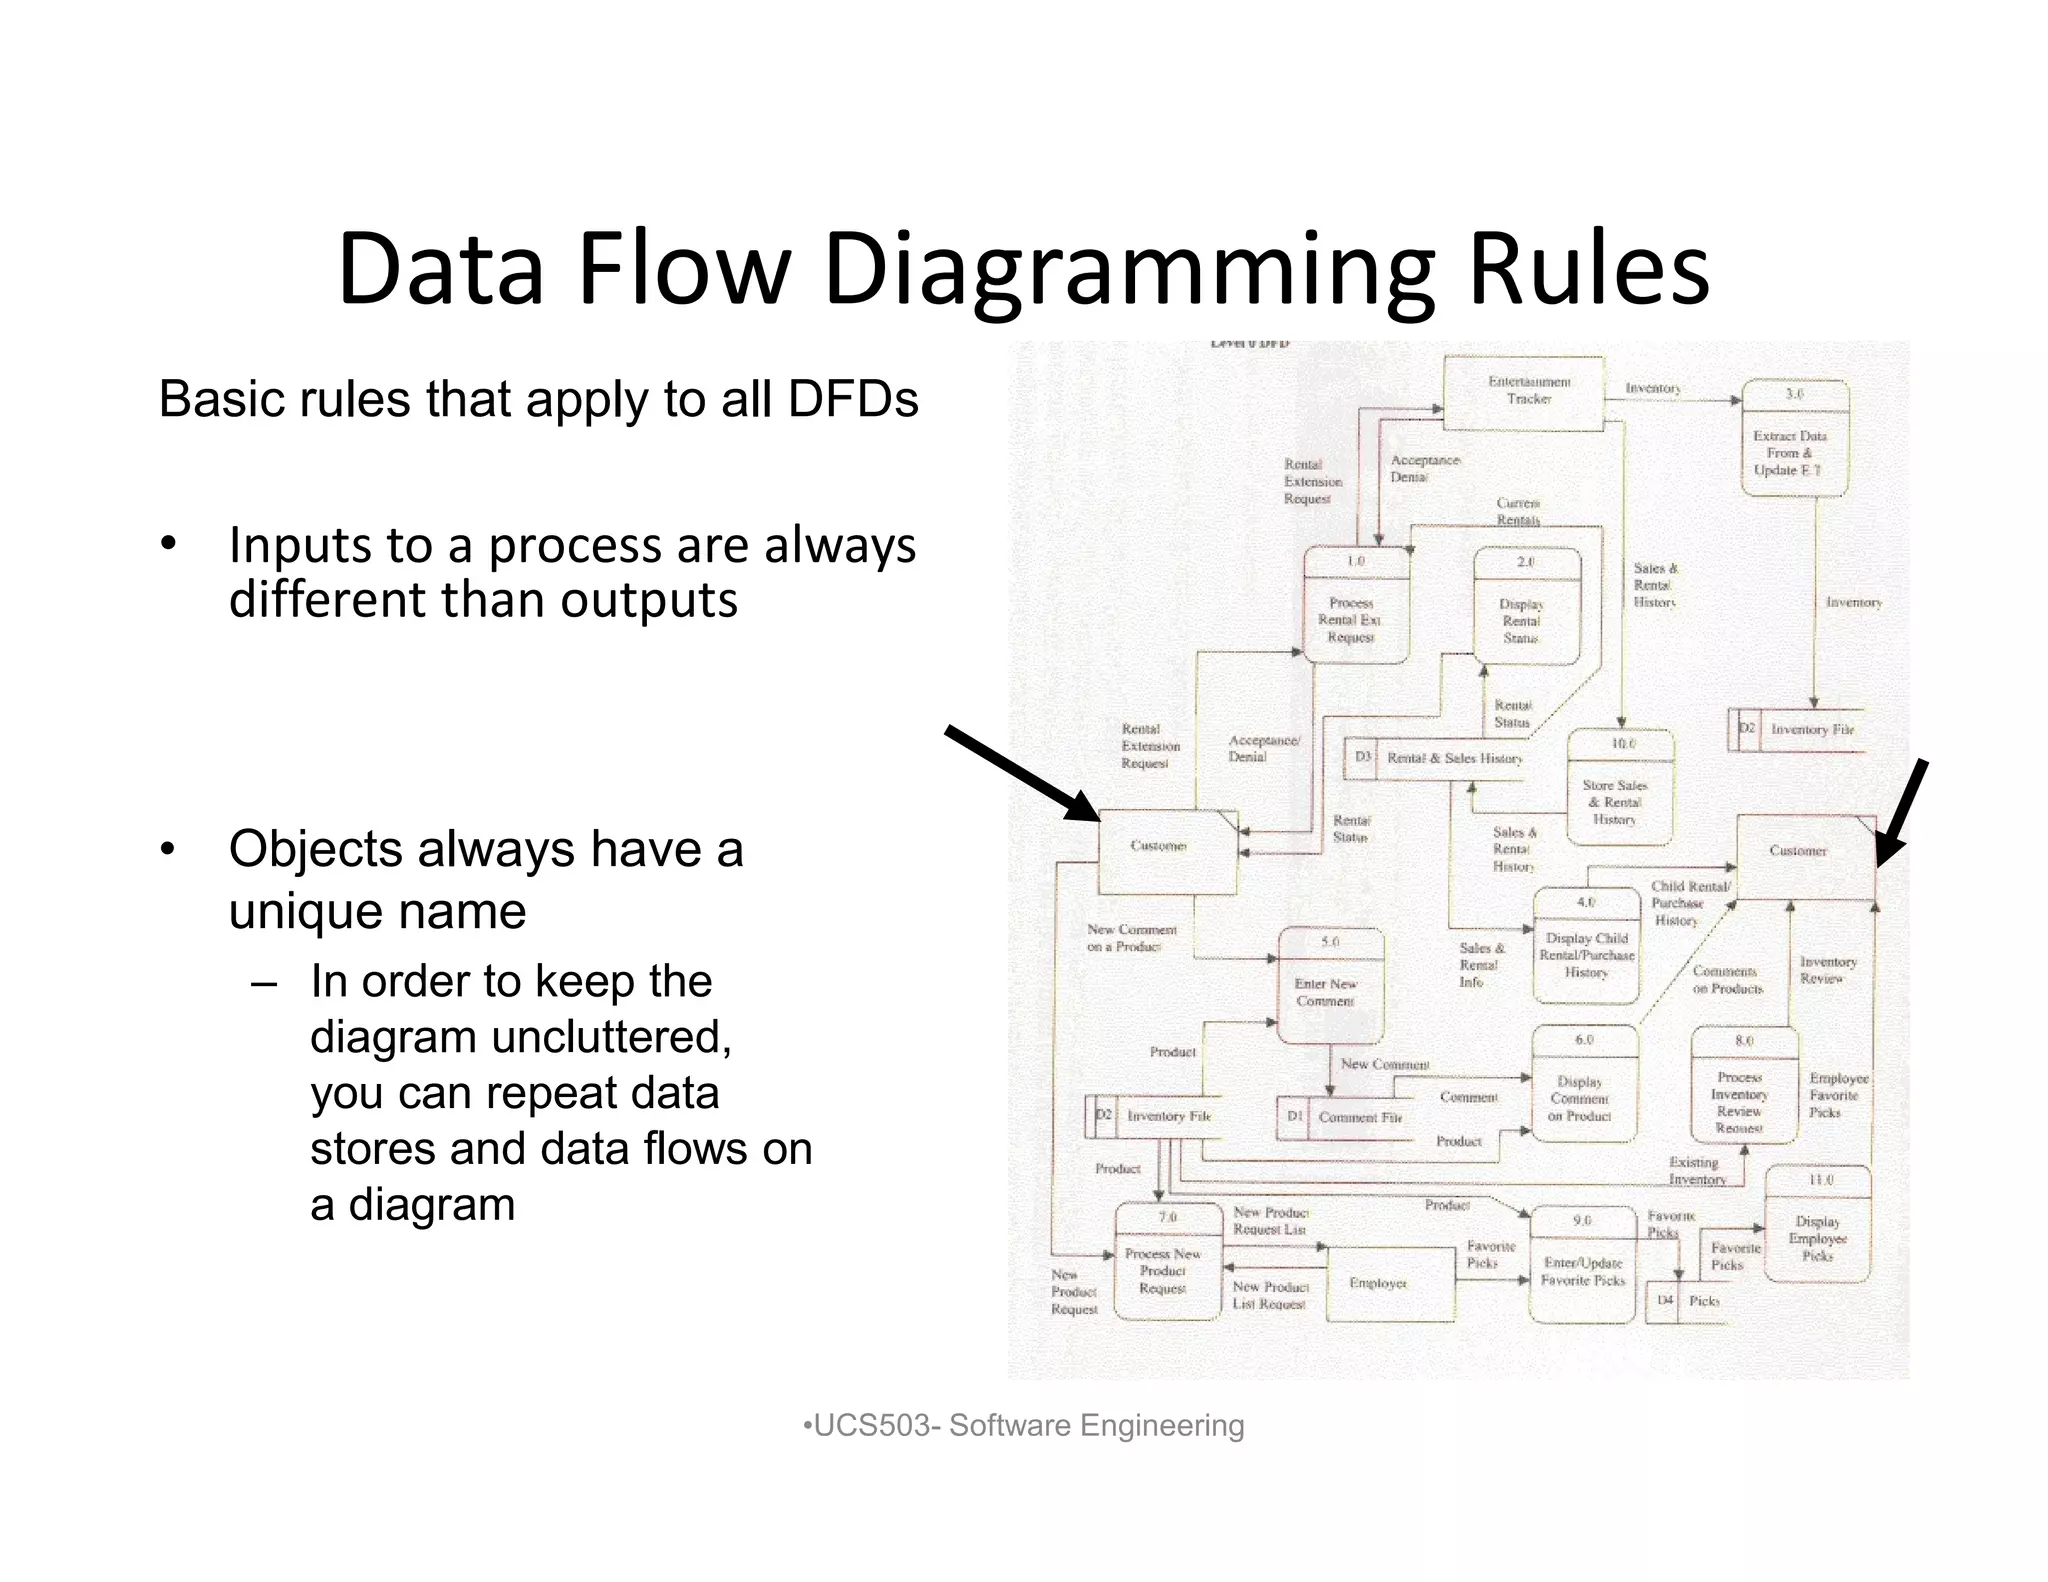
Data Flow DiagrammingRules
• Inputs to a process are always
different than outputs
•UCS503- Software Engineering
Basic rules that apply to all DFDs
• Objects always have a
unique name
– In order to keep the
diagram uncluttered,
you can repeat data
stores and data flows on
a diagram
19.
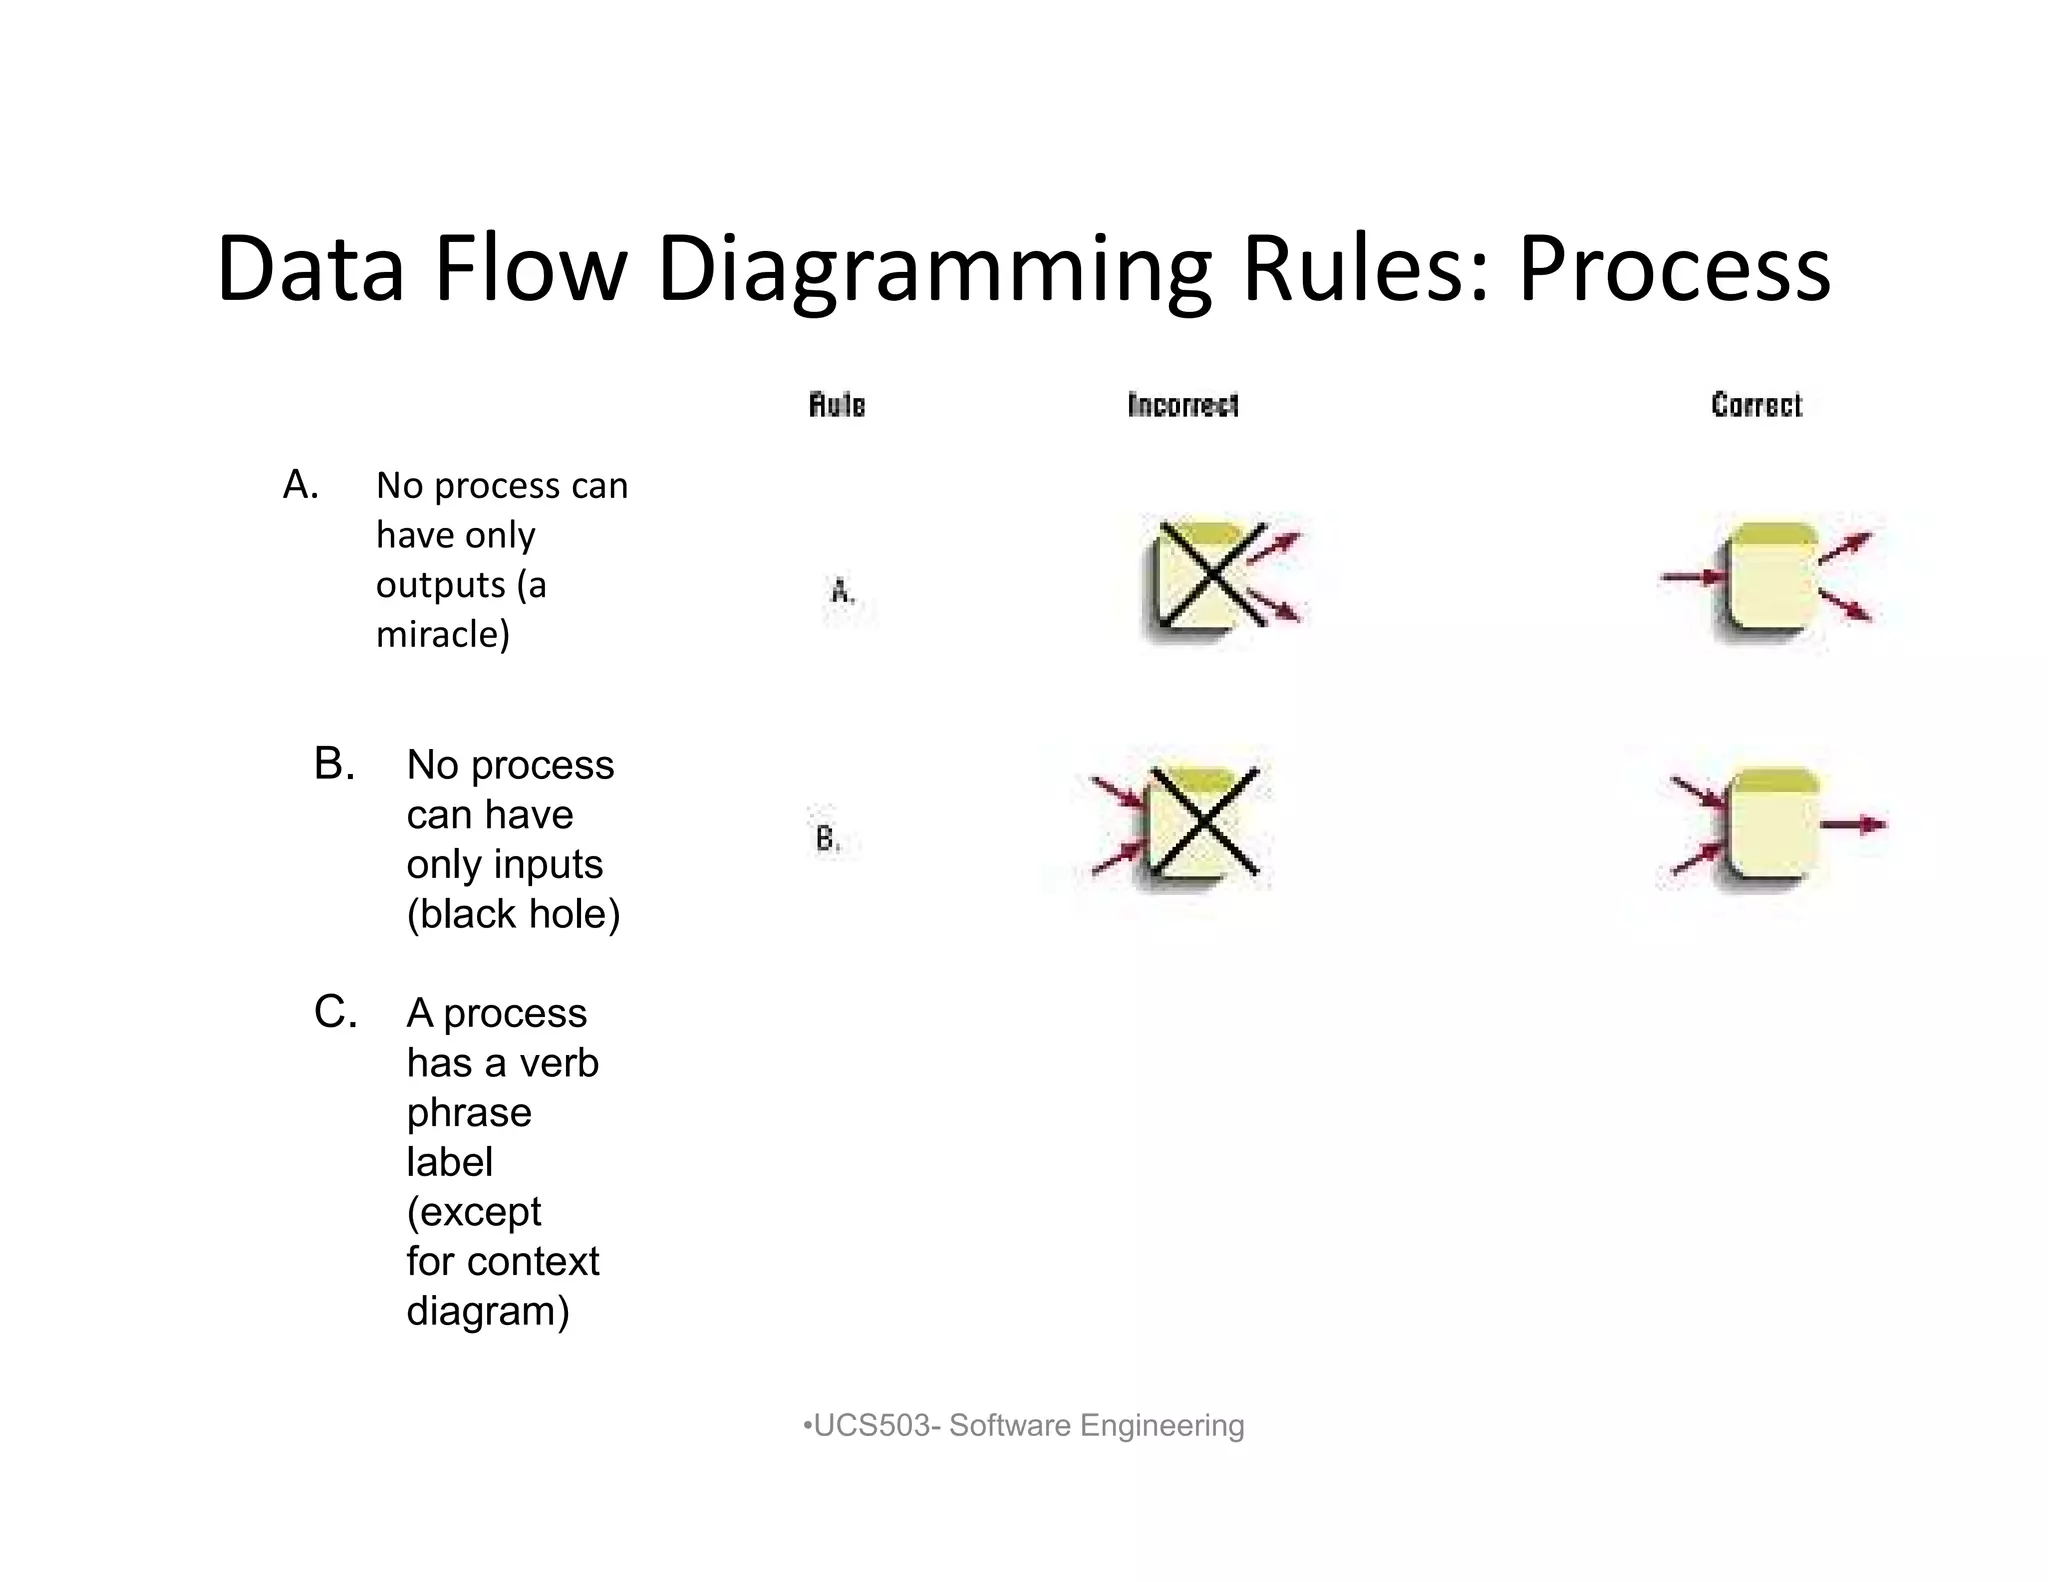
Data Flow DiagrammingRules: Process
A. No process can
have only
outputs (a
miracle)
•UCS503- Software Engineering
B. No process
can have
only inputs
(black hole)
C. A process
has a verb
phrase
label
(except
for context
diagram)
20.
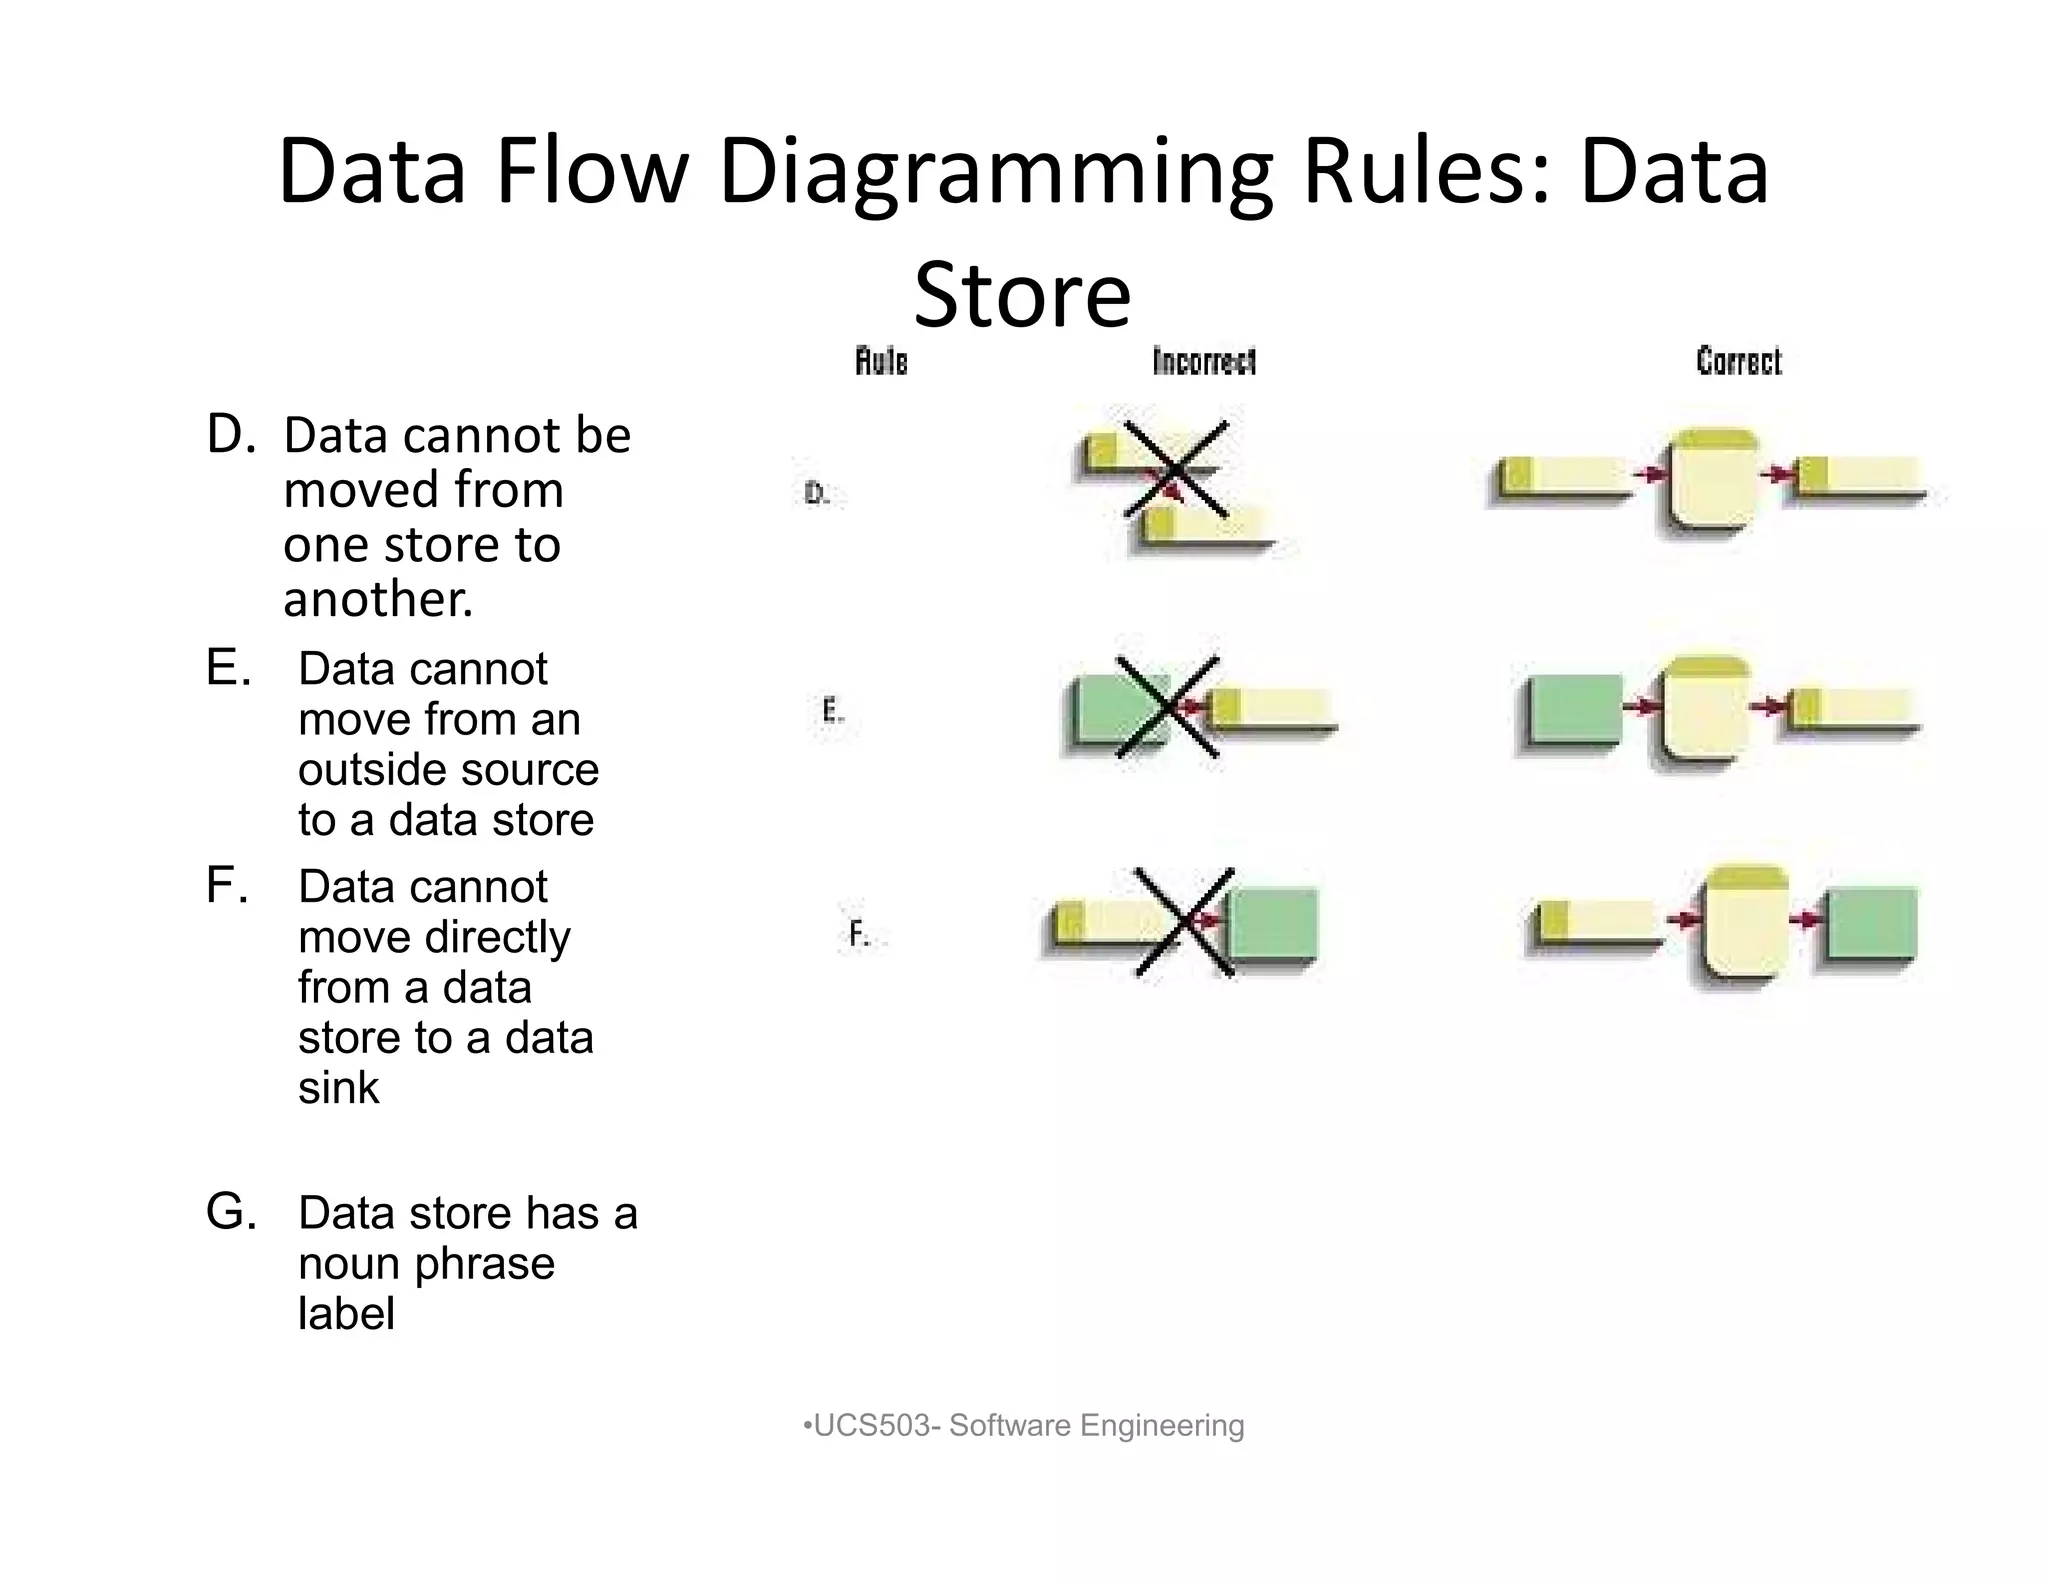
Data Flow DiagrammingRules: Data
Store
D. Data cannot be
moved from
one store to
another.
•UCS503- Software Engineering
G. Data store has a
noun phrase
label
F. Data cannot
move directly
from a data
store to a data
sink
E. Data cannot
move from an
outside source
to a data store
21.
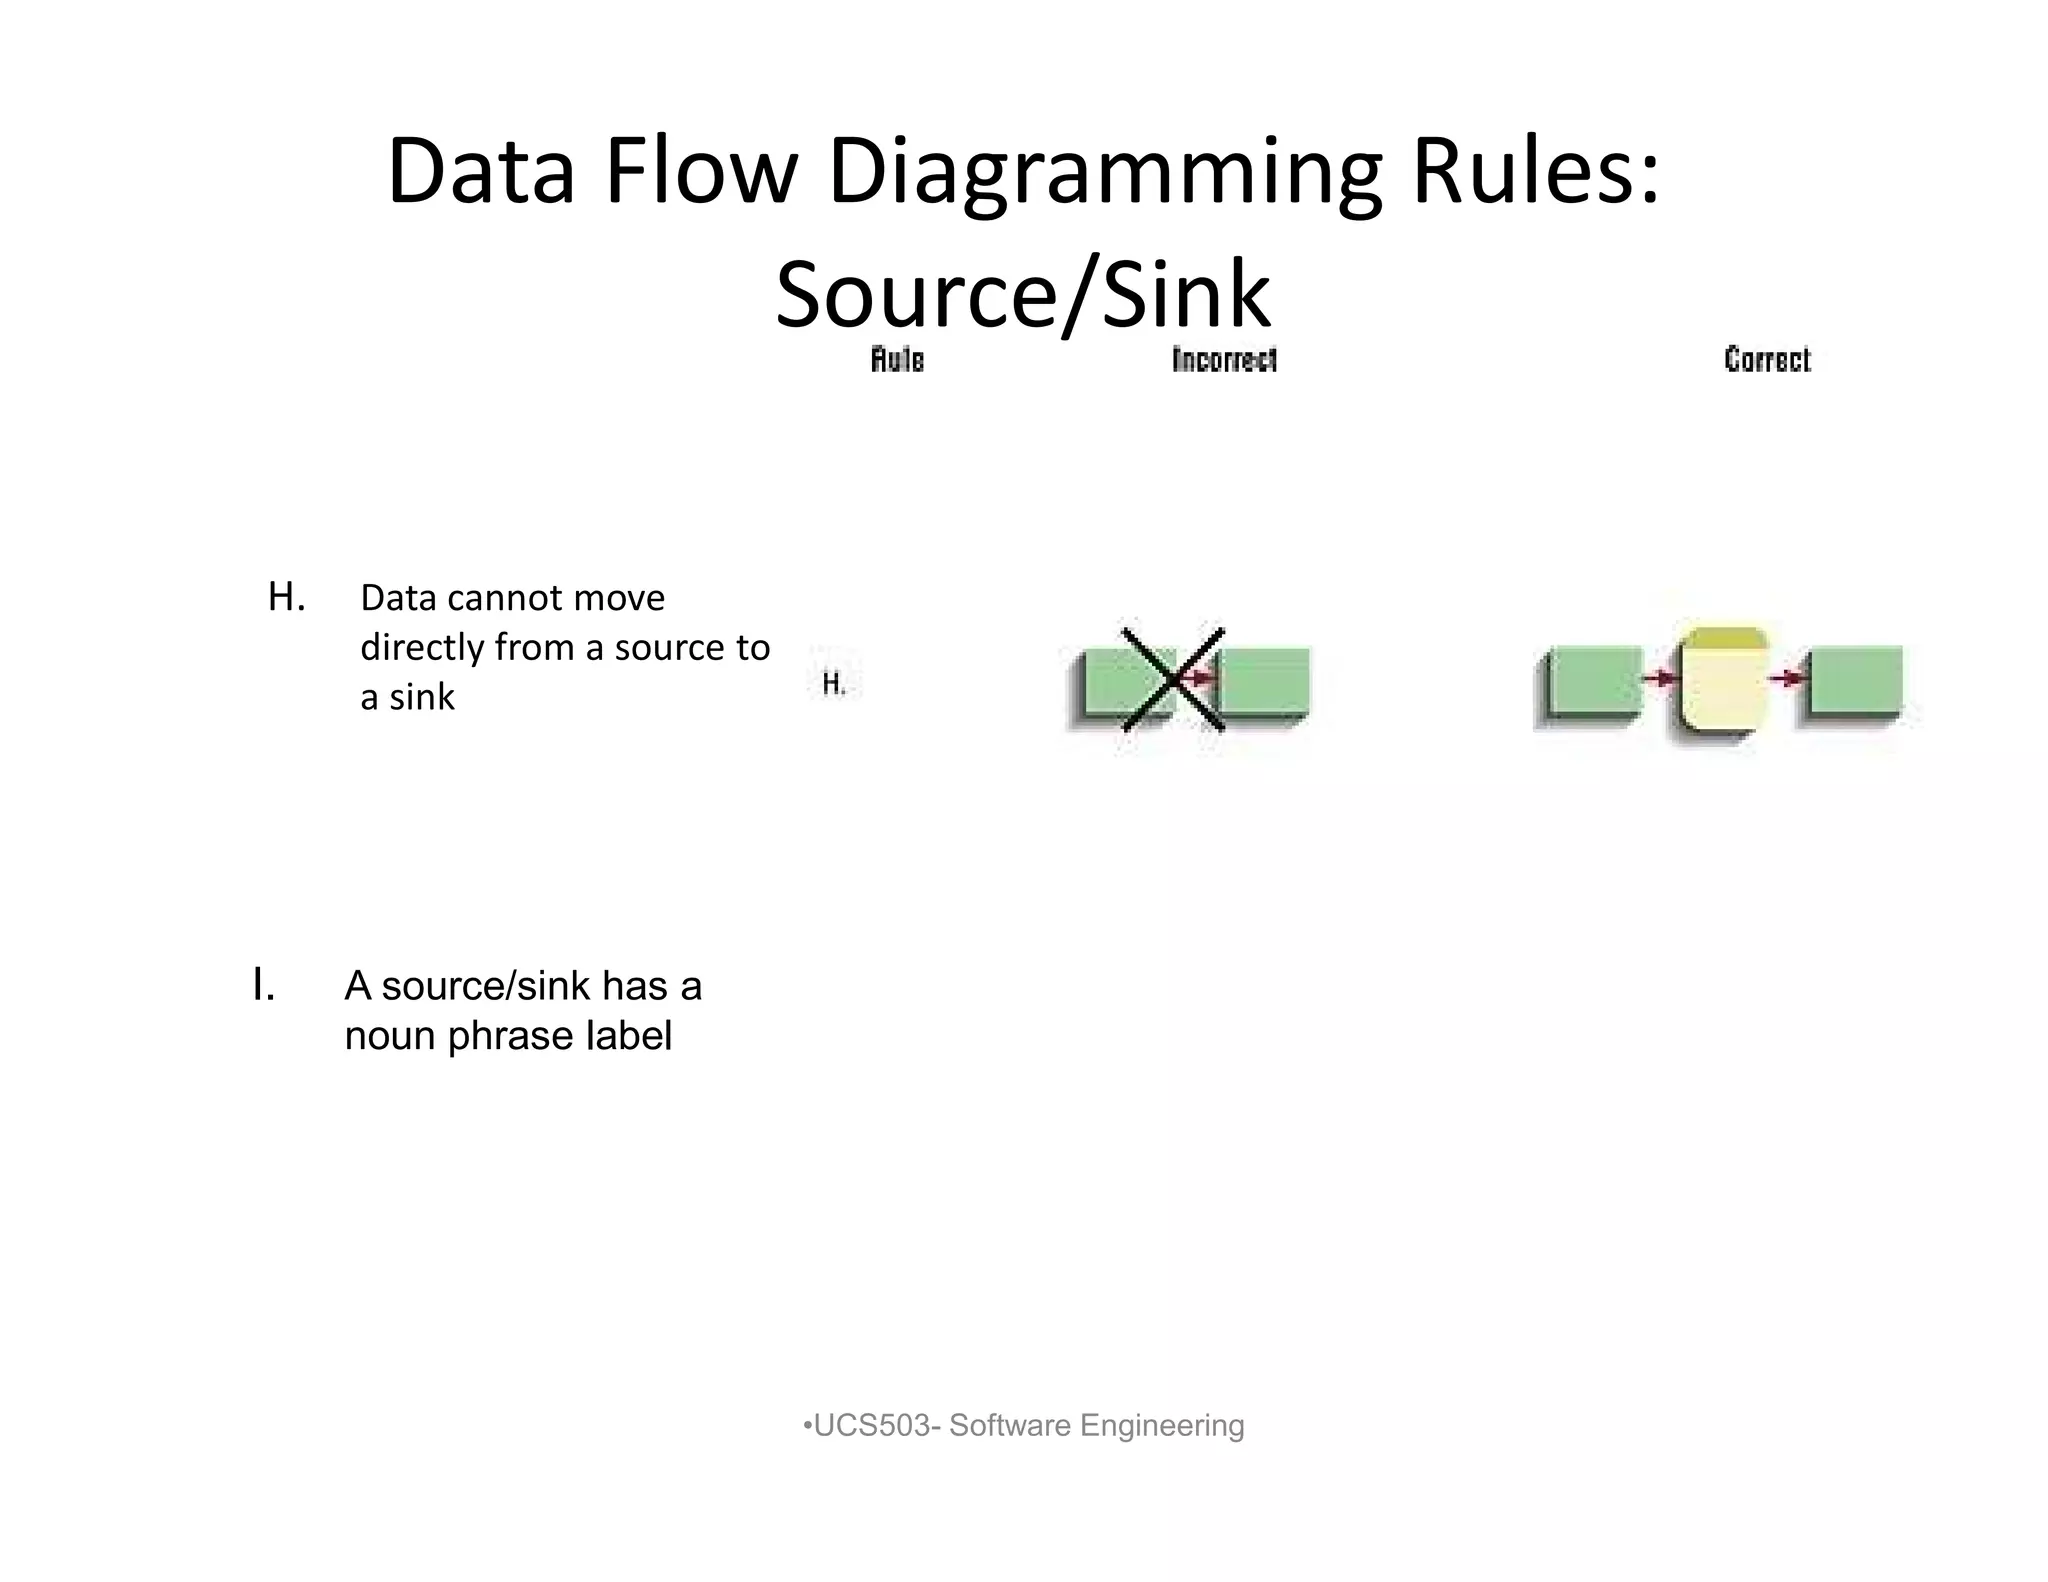
Data Flow DiagrammingRules:
Source/Sink
H. Data cannot move
directly from a source to
a sink
•UCS503- Software Engineering
I. A source/sink has a
noun phrase label
22.
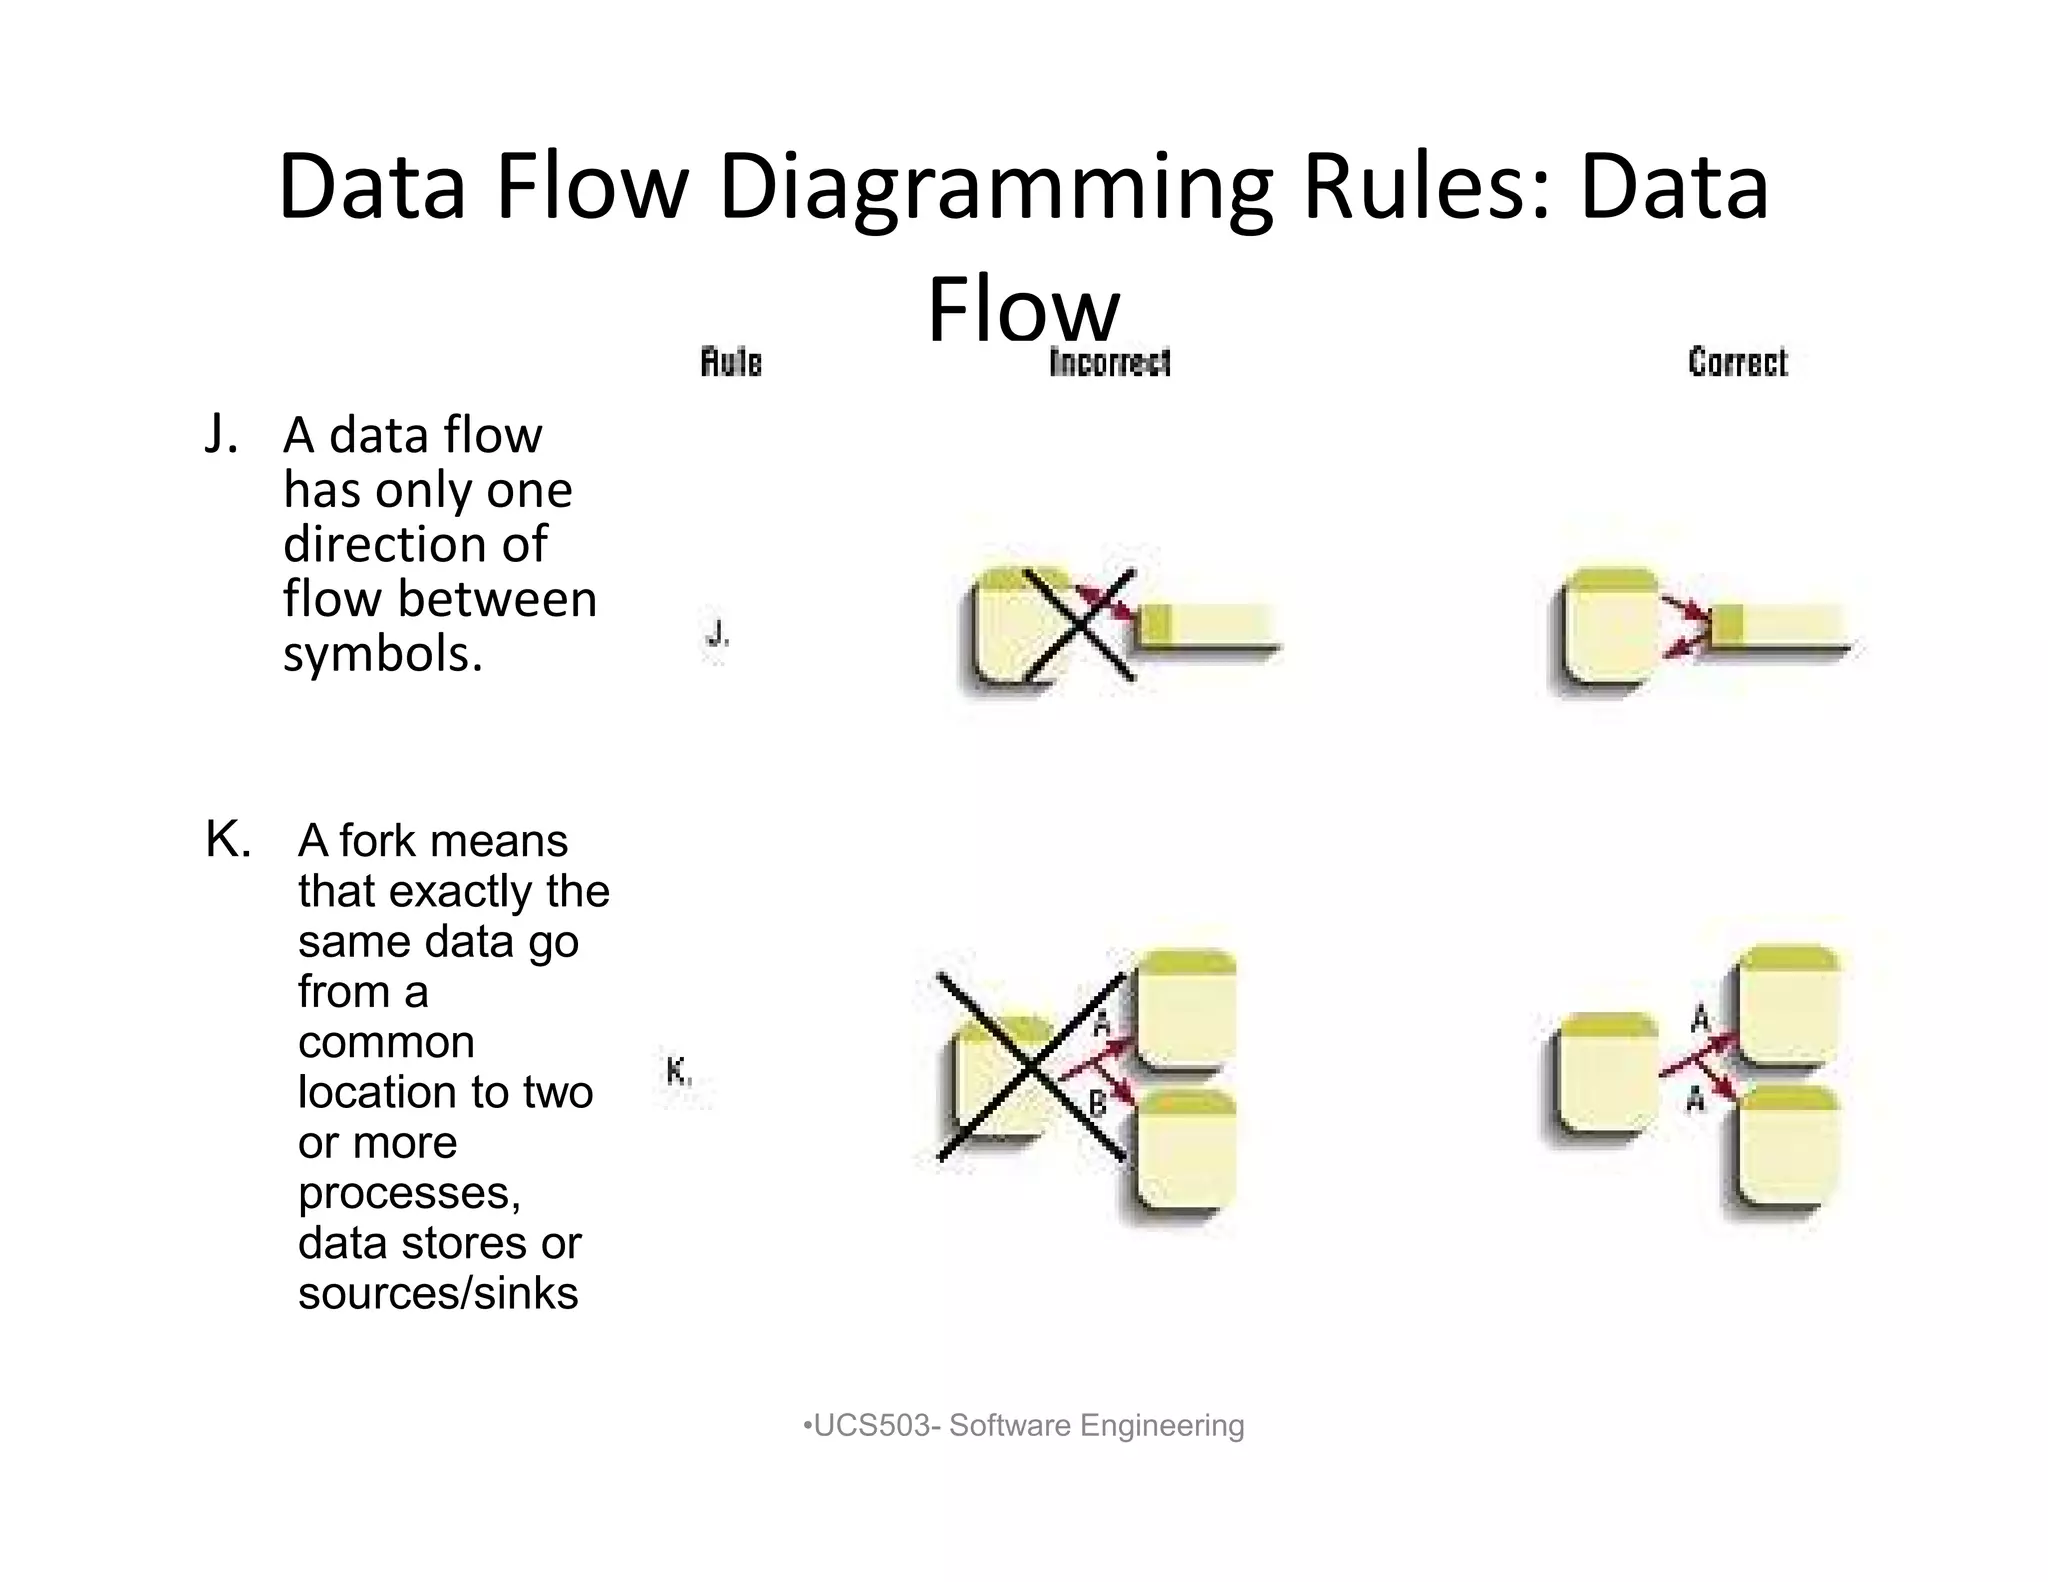
Data Flow DiagrammingRules: Data
Flow
J. A data flow
has only one
direction of
flow between
symbols.
•UCS503- Software Engineering
K. A fork means
that exactly the
same data go
from a
common
location to two
or more
processes,
data stores or
sources/sinks
23.
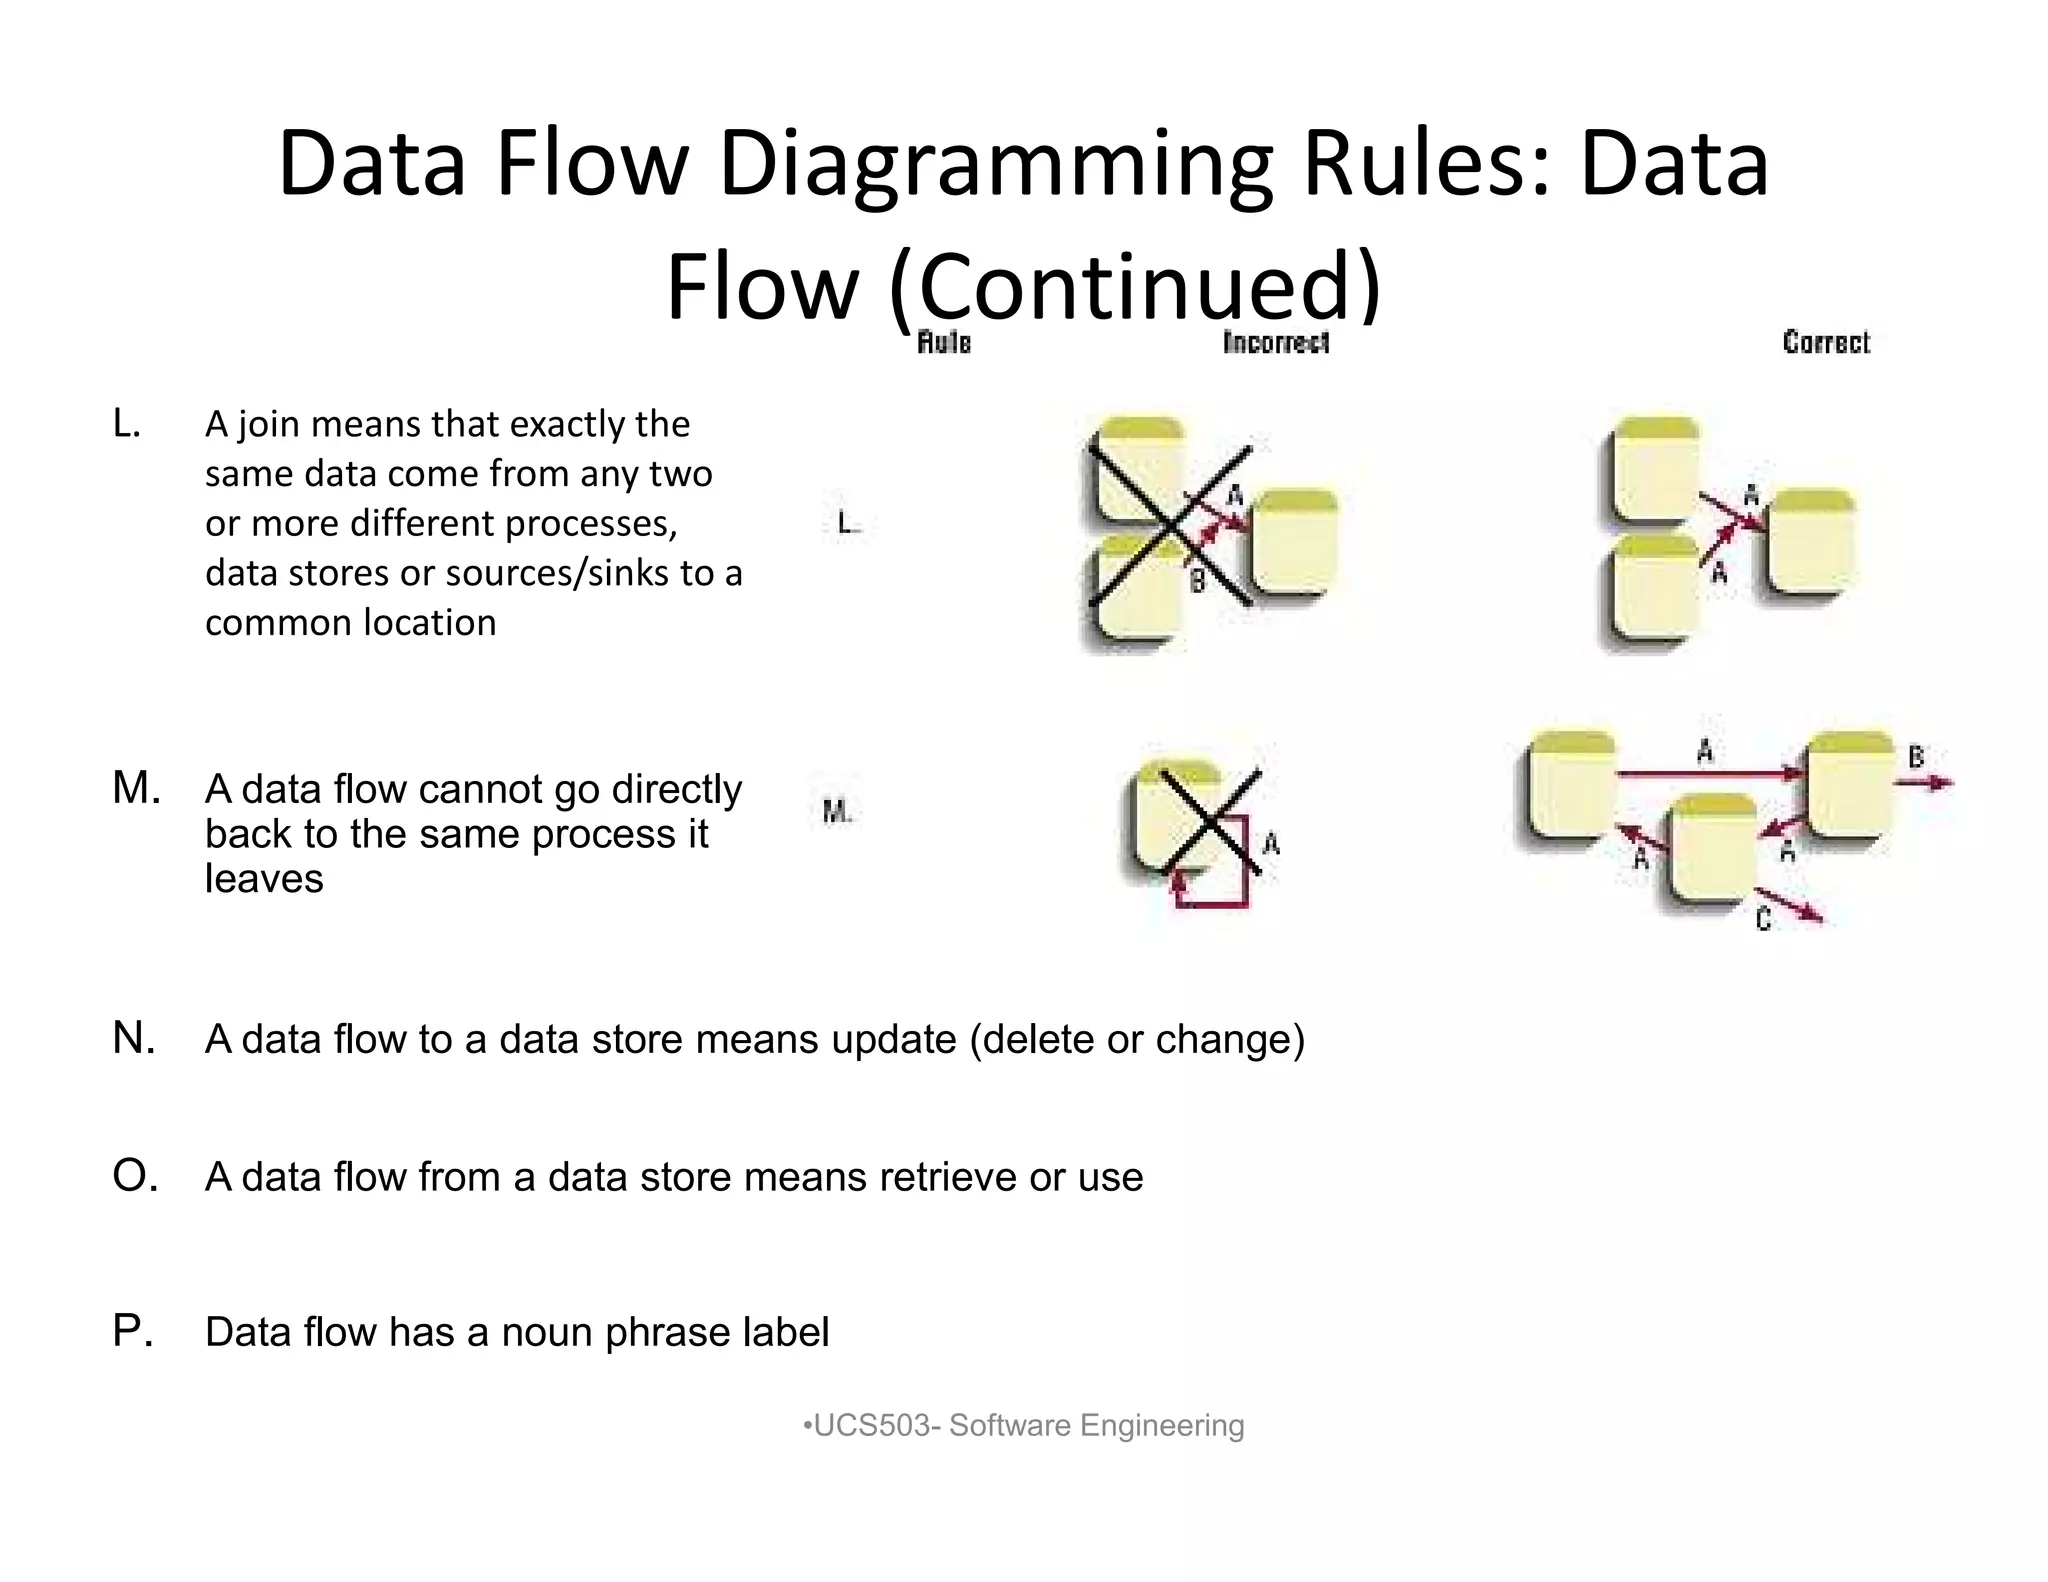
Data Flow DiagrammingRules: Data
Flow (Continued)
L. A join means that exactly the
same data come from any two
or more different processes,
data stores or sources/sinks to a
common location
•UCS503- Software Engineering
M. A data flow cannot go directly
back to the same process it
leaves
N. A data flow to a data store means update (delete or change)
O. A data flow from a data store means retrieve or use
P. Data flow has a noun phrase label
Data Flow DiagrammingRules:
Advanced Rules
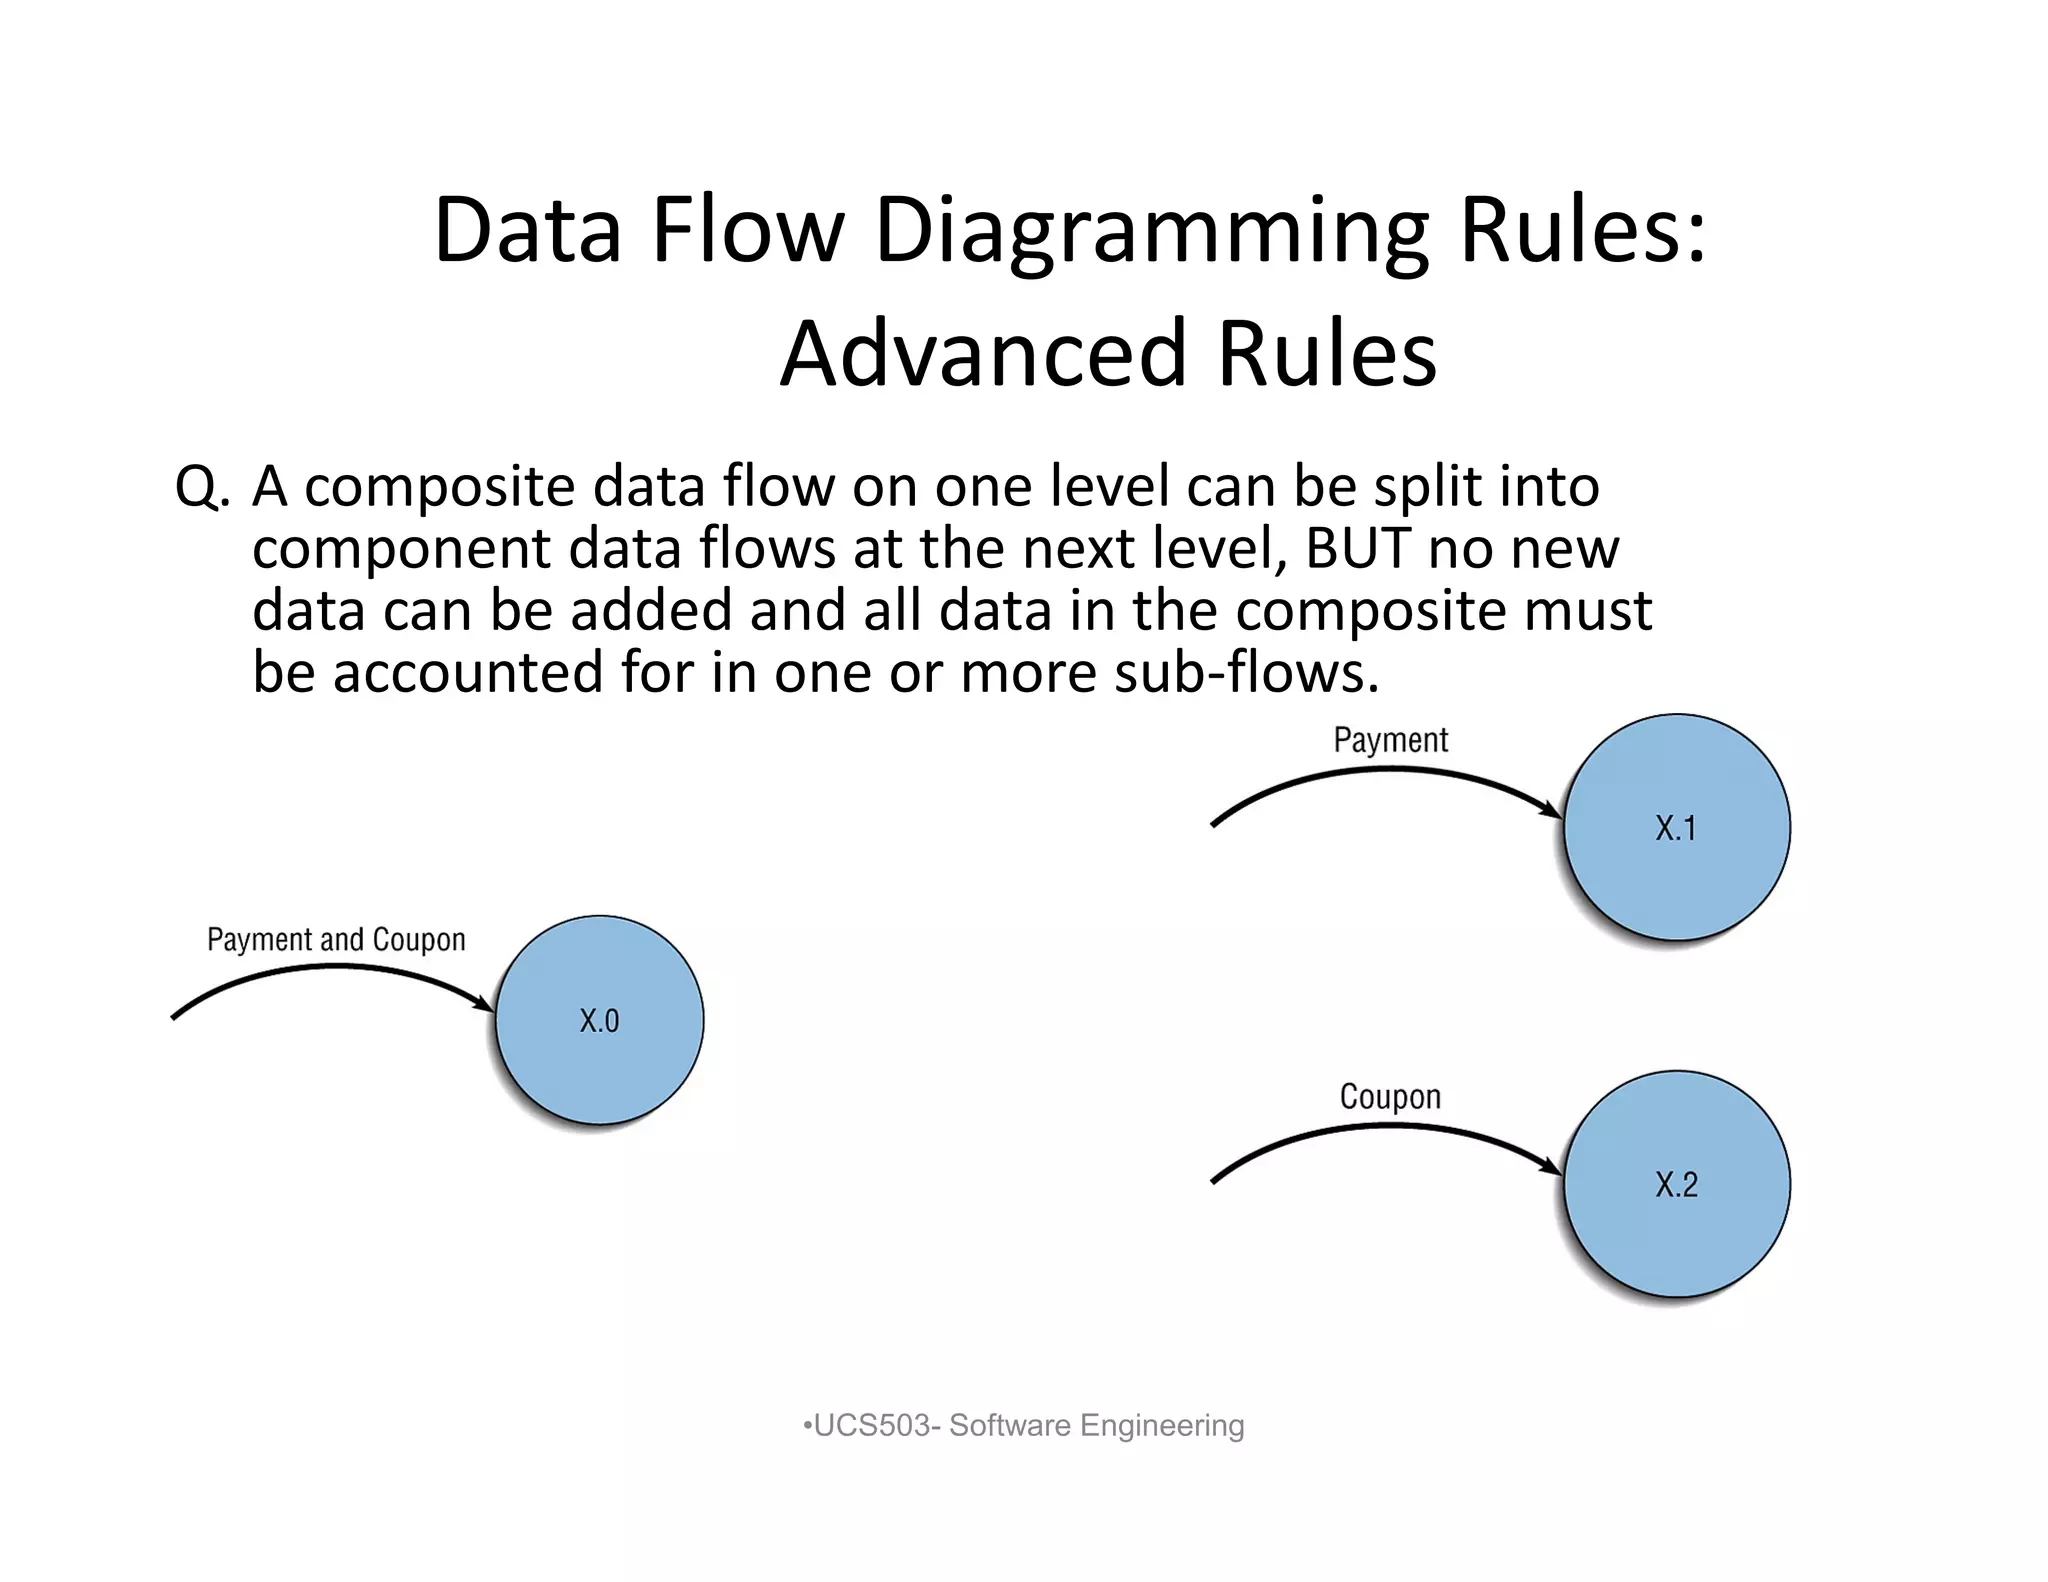
Q. A composite data flow on one level can be split into
component data flows at the next level, BUT no new
data can be added and all data in the composite must
be accounted for in one or more sub-flows.
•UCS503- Software Engineering
26.
Data Flow DiagrammingRules:
Advanced Rules
•UCS503- Software Engineering
R. The inputs to a process must be sufficient to produce the outputs from
the process.
S. At the lowest level of DFDs, new data flows may be added to
represent data that are transmitted under exceptional conditions (e.g.,
error messages).
T. To avoid having data flow lines cross each other, you may repeat data
stores or sources / sinks on a DFD.