Download as PDF, PPTX

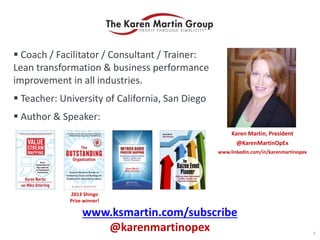


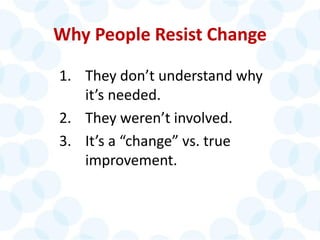
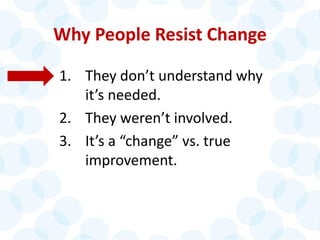
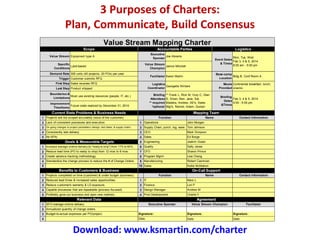
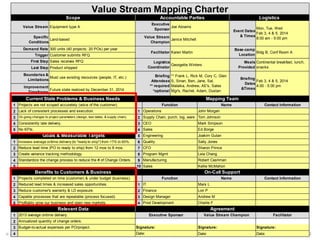
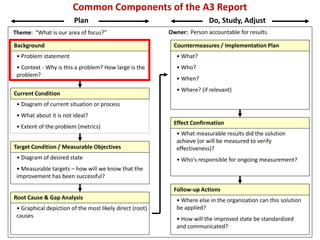
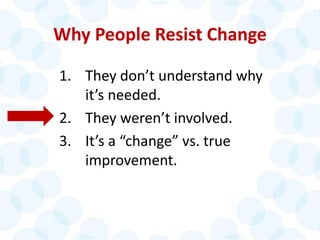

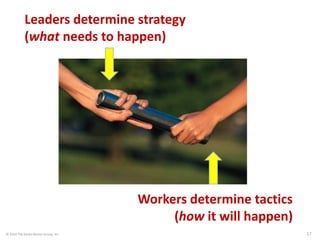
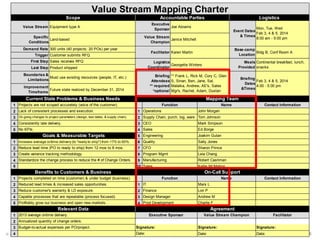

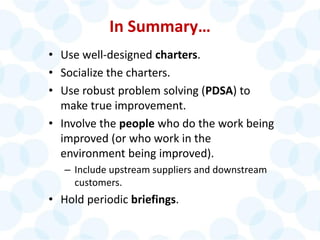


The document outlines a webinar hosted by Karen Martin focused on reducing resistance to change in organizations, detailing the importance of stakeholder involvement and effective communication. It emphasizes strategies for addressing common reasons for resistance and promotes the use of well-designed charters to facilitate change initiatives. Additionally, practical examples and insights are provided on the role of team dynamics and leadership in managing change effectively.