Downloaded 164 times

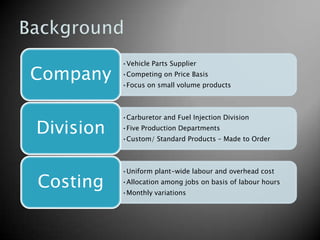
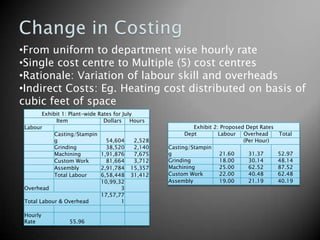
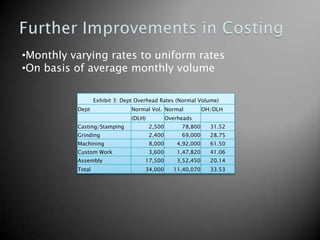
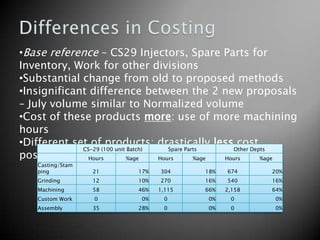
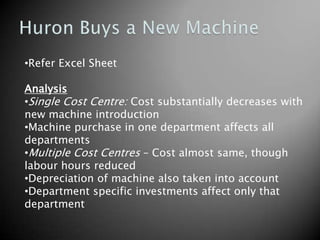
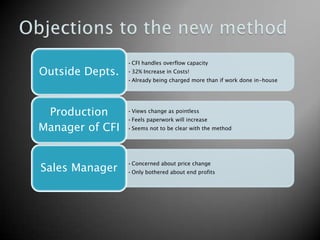


The document discusses a vehicle parts supplier that is proposing to change its costing method from a single cost center to multiple cost centers. It notes the supplier has five production departments and makes both custom and standard products. It provides exhibits showing the proposed departmental labor and overhead rates under the new multiple cost center method compared to the previous uniform plant-wide rates. The document analyzes how the new costing method would affect product pricing, cost control, inventory valuation, and the ability to judge departmental performance.