This document contains examples of calculating mean, mode, median, and standard deviation from sets of data. It provides step-by-step explanations and solutions for finding these values from various data sets containing numbers. Examples include finding the mean, median, and mode of data sets; calculating standard deviation by determining the mean deviation from the mean, variance, and taking the square root of variance; and calculating the coefficient of standard deviation. The document serves as a guide for solving different statistical measurement problems.
Mean, Mode, Median& Standard
Deviation: Problems
Ms. Nigar K.Mujawar
Assistant Professor,
Shri.Balasaheb Mane Shikshan Prasarak Mandal Ambap
Womens College of Pharmacy, Peth-Vadgaon,
Kolhapur, MH, INDIA.
2.
1.Find the modeof following
data:4.3,4.8,5.0,4.0,4.9,4.1,4.5,4.6,4.2,4.1
Answer:
-To find the mode of a dataset, we need to identify the
value that appears most frequently.
-In your dataset, the number 4.1 appears twice, which is
more than any other value.
-Therefore, the mode of the given data set is 4.1.
3.
2.Find the meanof the following set
numbers:1,1,1,2,4,5,5,7,8,12.
Answer:
To find the mean (average) of a set of numbers, you sum up all
the numbers and then divide by the total count of numbers.
Sum of the numbers:
1+1+1+2+4+5+5+7+8+12=461+1+1+2+4+5+5+7+8+12=46
Total count of numbers: 10
Mean (average): = 46/10=4.6
Mean=4.6
So, the mean of the given set of numbers is 4.6
4.
3. Find themedian of the following numbers 4,1,6,2,1,11,4,1,8,12
Answer: To find the median of a set of numbers, you first need to arrange the
numbers in ascending order and then find the middle value.
-If there are an odd number of values, the median is the middle number.
-If there is an even number of values, the median is the average of the two middle
numbers.
-Arranging the numbers in ascending order:
1,1,1,2,4,4,6,8,11,12
Since there are 10 numbers, which is an even count, we take the average of the
two middle numbers.
The two middle numbers are 4 and 4. So, the median is:
Median =4+4/2
=8/2
=4
So, the median of the given set of numbers is 4.
5.
4.What is themean and median of the given set
4,1,6,2,1,11,4,1,8,12
-To find the mean of the given set of numbers, we add up all
the numbers and then divide by the total count of numbers.
-Sum of the numbers:
4+1+6+2+1+11+4+1+8+12=504+1+6+2+1+11+4+1+8+12=50
-Total count of numbers: 10
Mean (average): =50/10=5
Mean=50/10=5
So, the mean of the given set of numbers is 5.
6.
-To find themedian of the given set of numbers, we first arrange
them in ascending order
1,1,1,2,4,4,6,8,11,12
-Since there are 10 numbers, which is an even count, we take the
average of the two middle numbers.
-The two middle numbers are 4 and 4. So, the median is:
Median=4+4/2
=8/2=4
So, the median of the given set of numbers is 4.
7.
5.Find the mean,median and mode of following data
2,4,7,1,6,9,5,4,4,3,4
Data: 2, 4, 7, 1, 6, 9, 5, 4, 4, 3, 4
1.Mean: Mean is the average of all the numbers in the
data set.
Mean = (Sum of all numbers) / (Total number of
numbers)
Mean = (2 + 4 + 7 + 1 + 6 + 9 + 5 + 4 + 4 + 3 + 4) / 11
= 49 / 11 ≈ 4.45
8.
2.Median:
Median is themiddle number when the numbers are arranged
in ascending order.
First, let's arrange the data in ascending order:
1, 2, 3, 4, 4, 4, 4, 5, 6, 7, 9
As there are 11 numbers, the median will be the value at the
6th position.
Median = 4
9.
3. Mode:
Mode isthe number that appears most frequently in the data set.
In the given data, the number 4 appears most frequently (four times).
Mode = 4
So, the mean is approximately 4.45, the median is 4, and the mode is
4.
10.
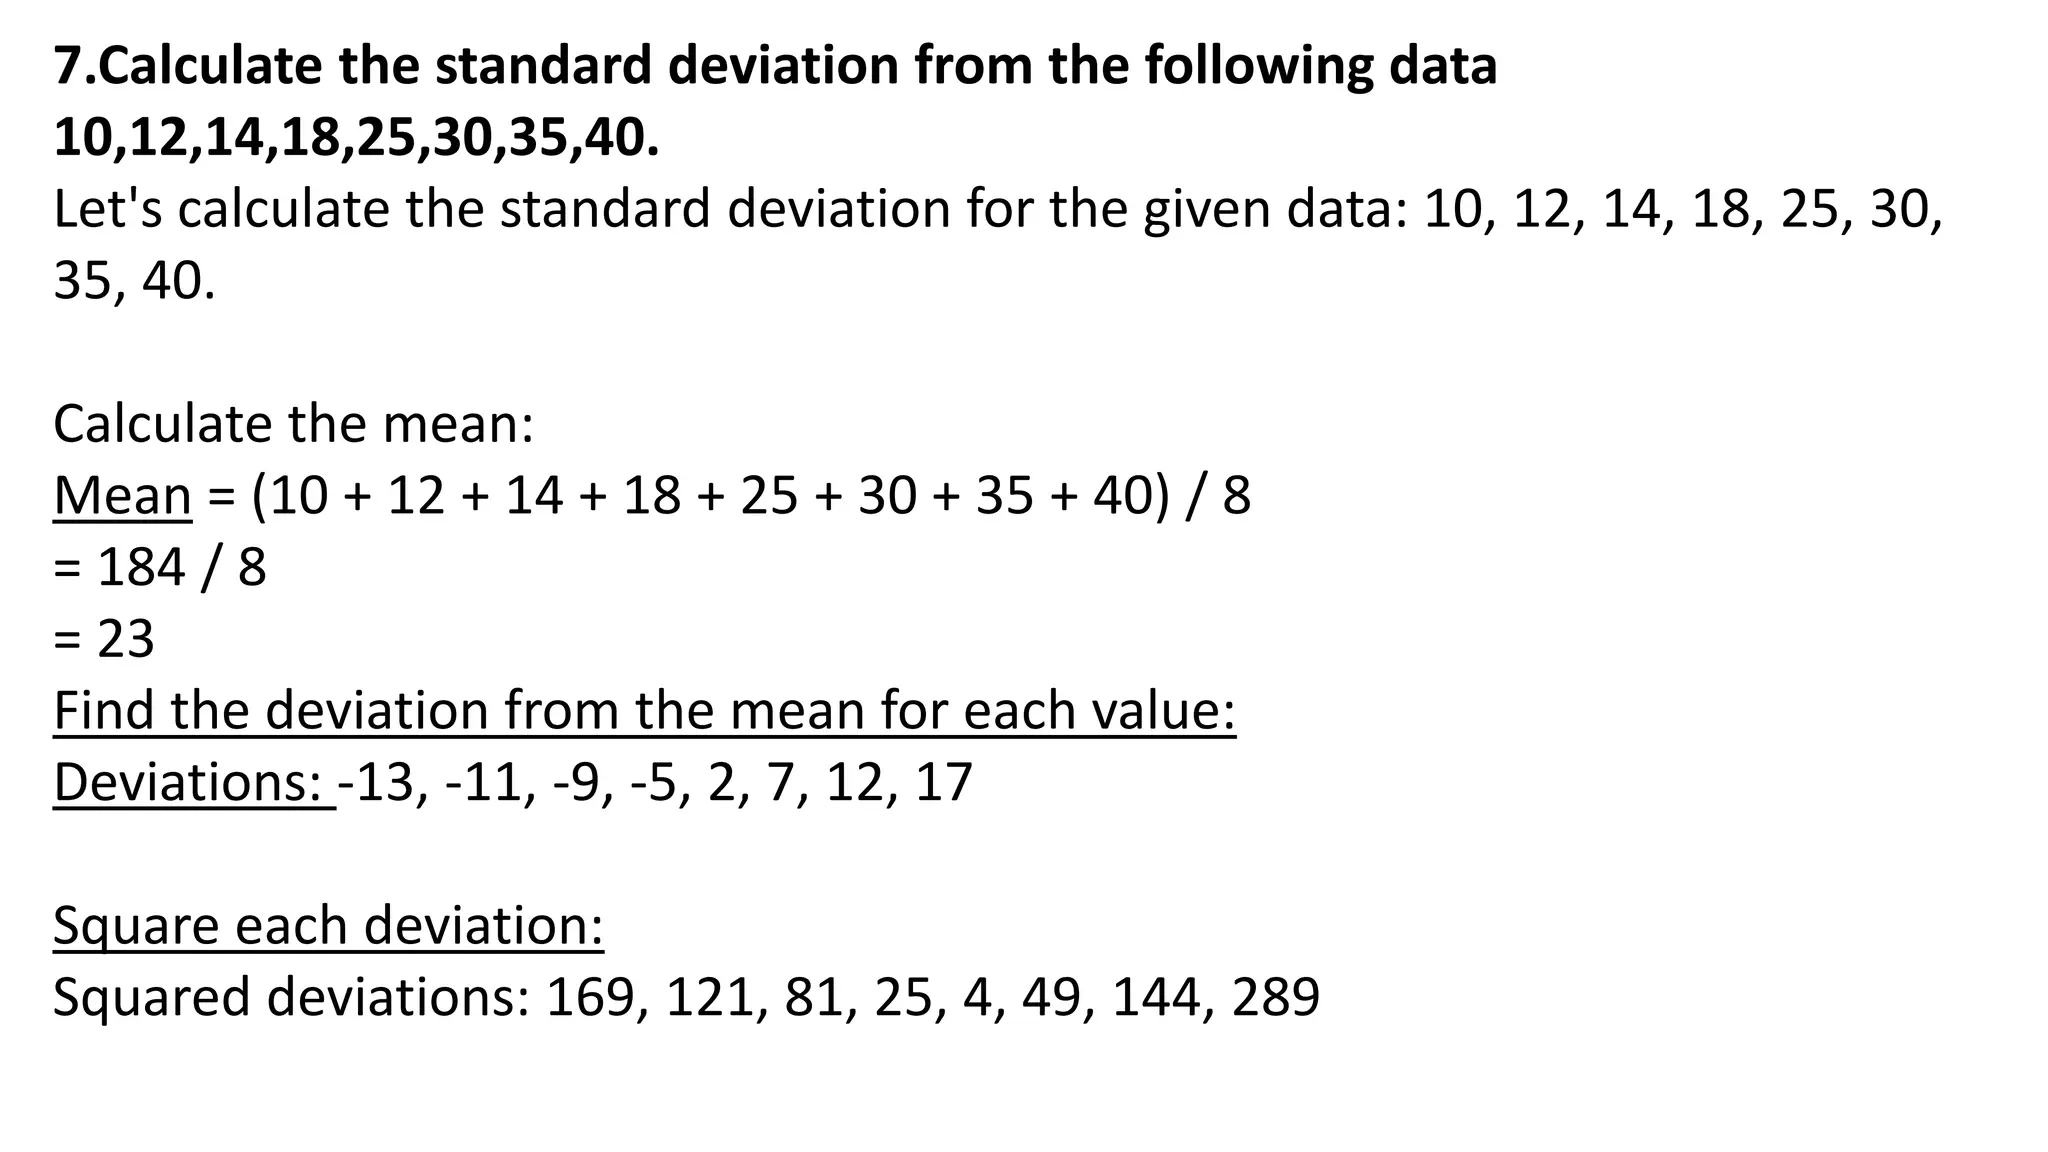
7.Calculate the standarddeviation from the following data
10,12,14,18,25,30,35,40.
Let's calculate the standard deviation for the given data: 10, 12, 14, 18, 25, 30,
35, 40.
Calculate the mean:
Mean = (10 + 12 + 14 + 18 + 25 + 30 + 35 + 40) / 8
= 184 / 8
= 23
Find the deviation from the mean for each value:
Deviations: -13, -11, -9, -5, 2, 7, 12, 17
Square each deviation:
Squared deviations: 169, 121, 81, 25, 4, 49, 144, 289
11.
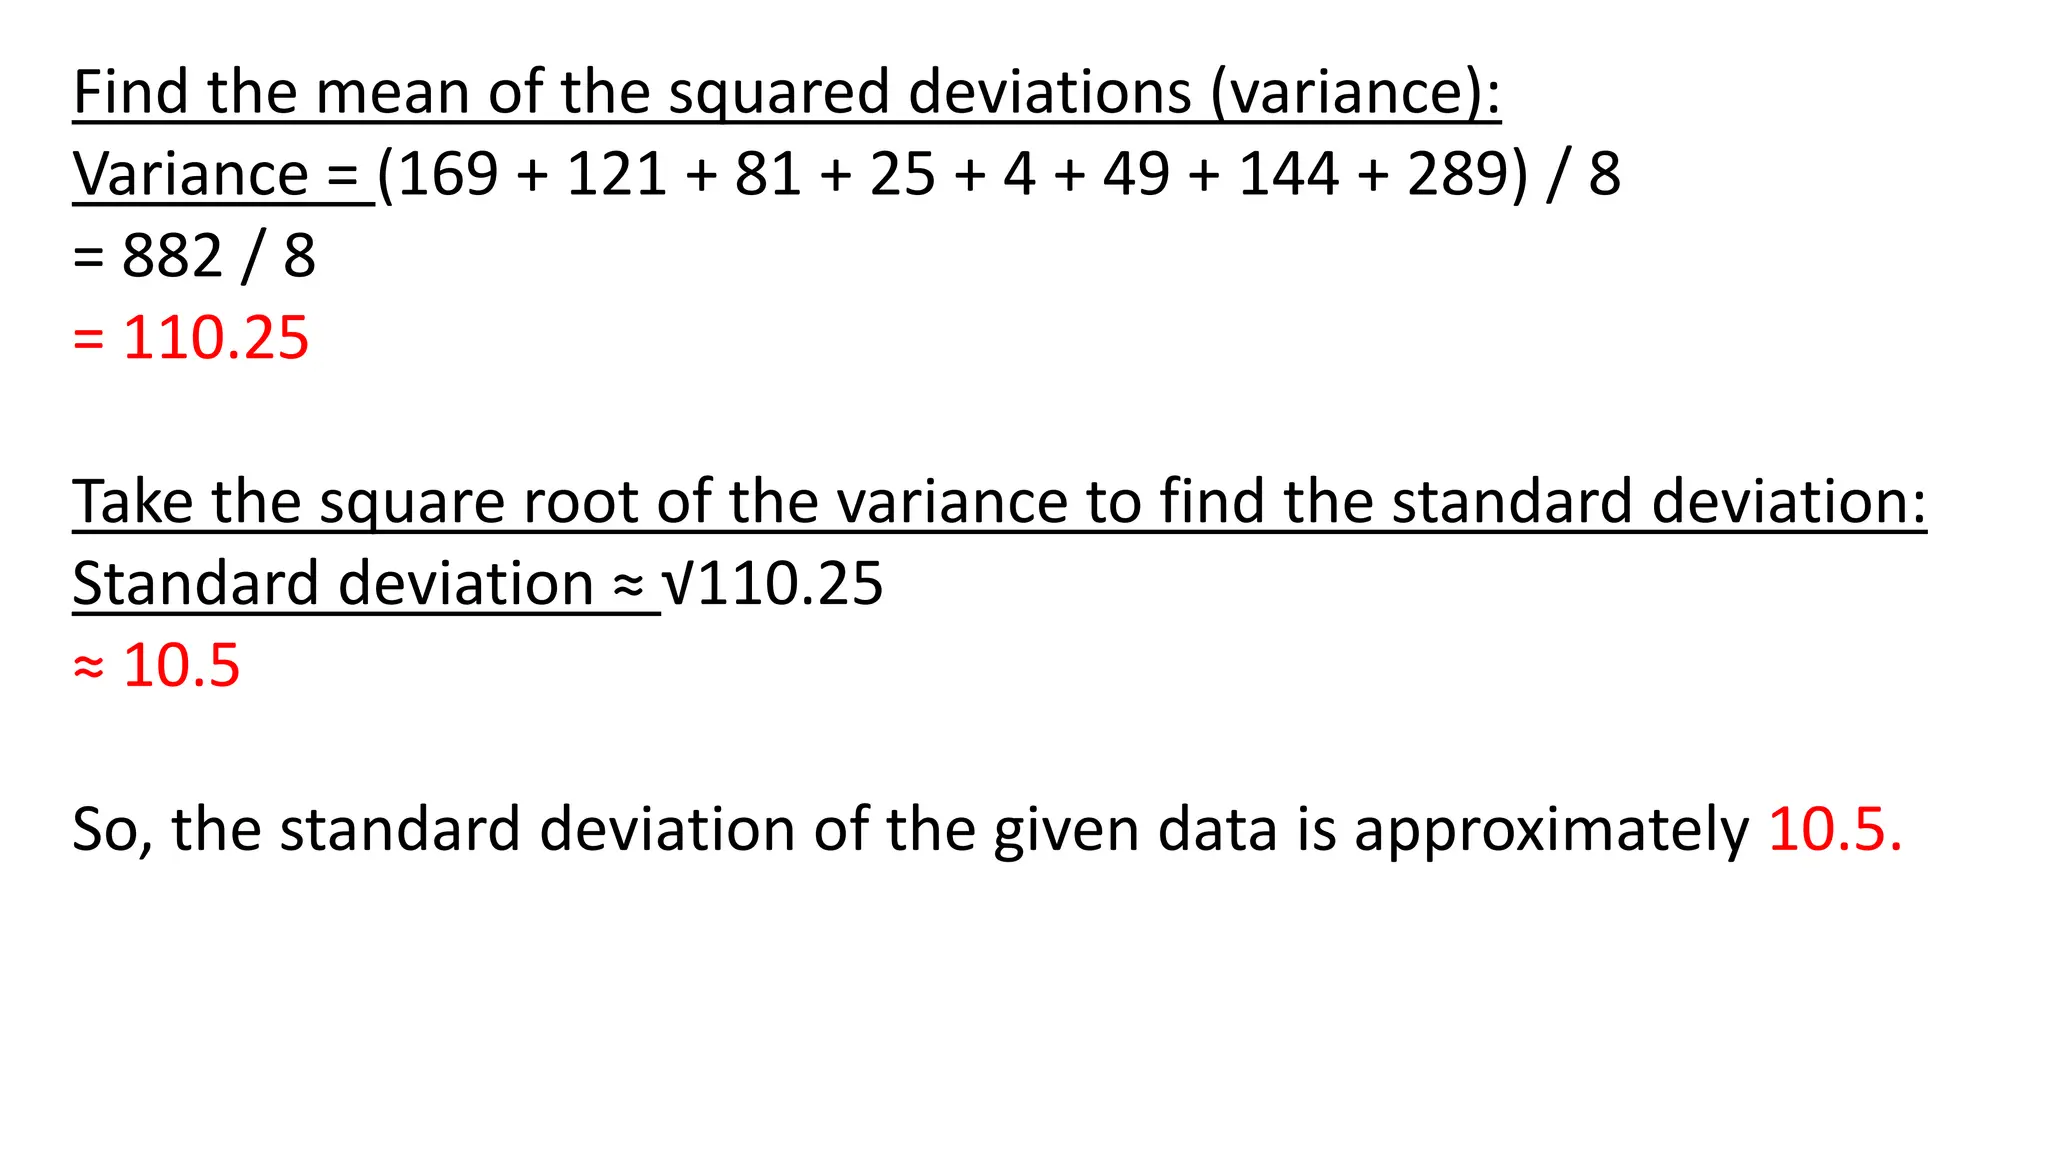
Find the meanof the squared deviations (variance):
Variance = (169 + 121 + 81 + 25 + 4 + 49 + 144 + 289) / 8
= 882 / 8
= 110.25
Take the square root of the variance to find the standard deviation:
Standard deviation ≈ √110.25
≈ 10.5
So, the standard deviation of the given data is approximately 10.5.
12.
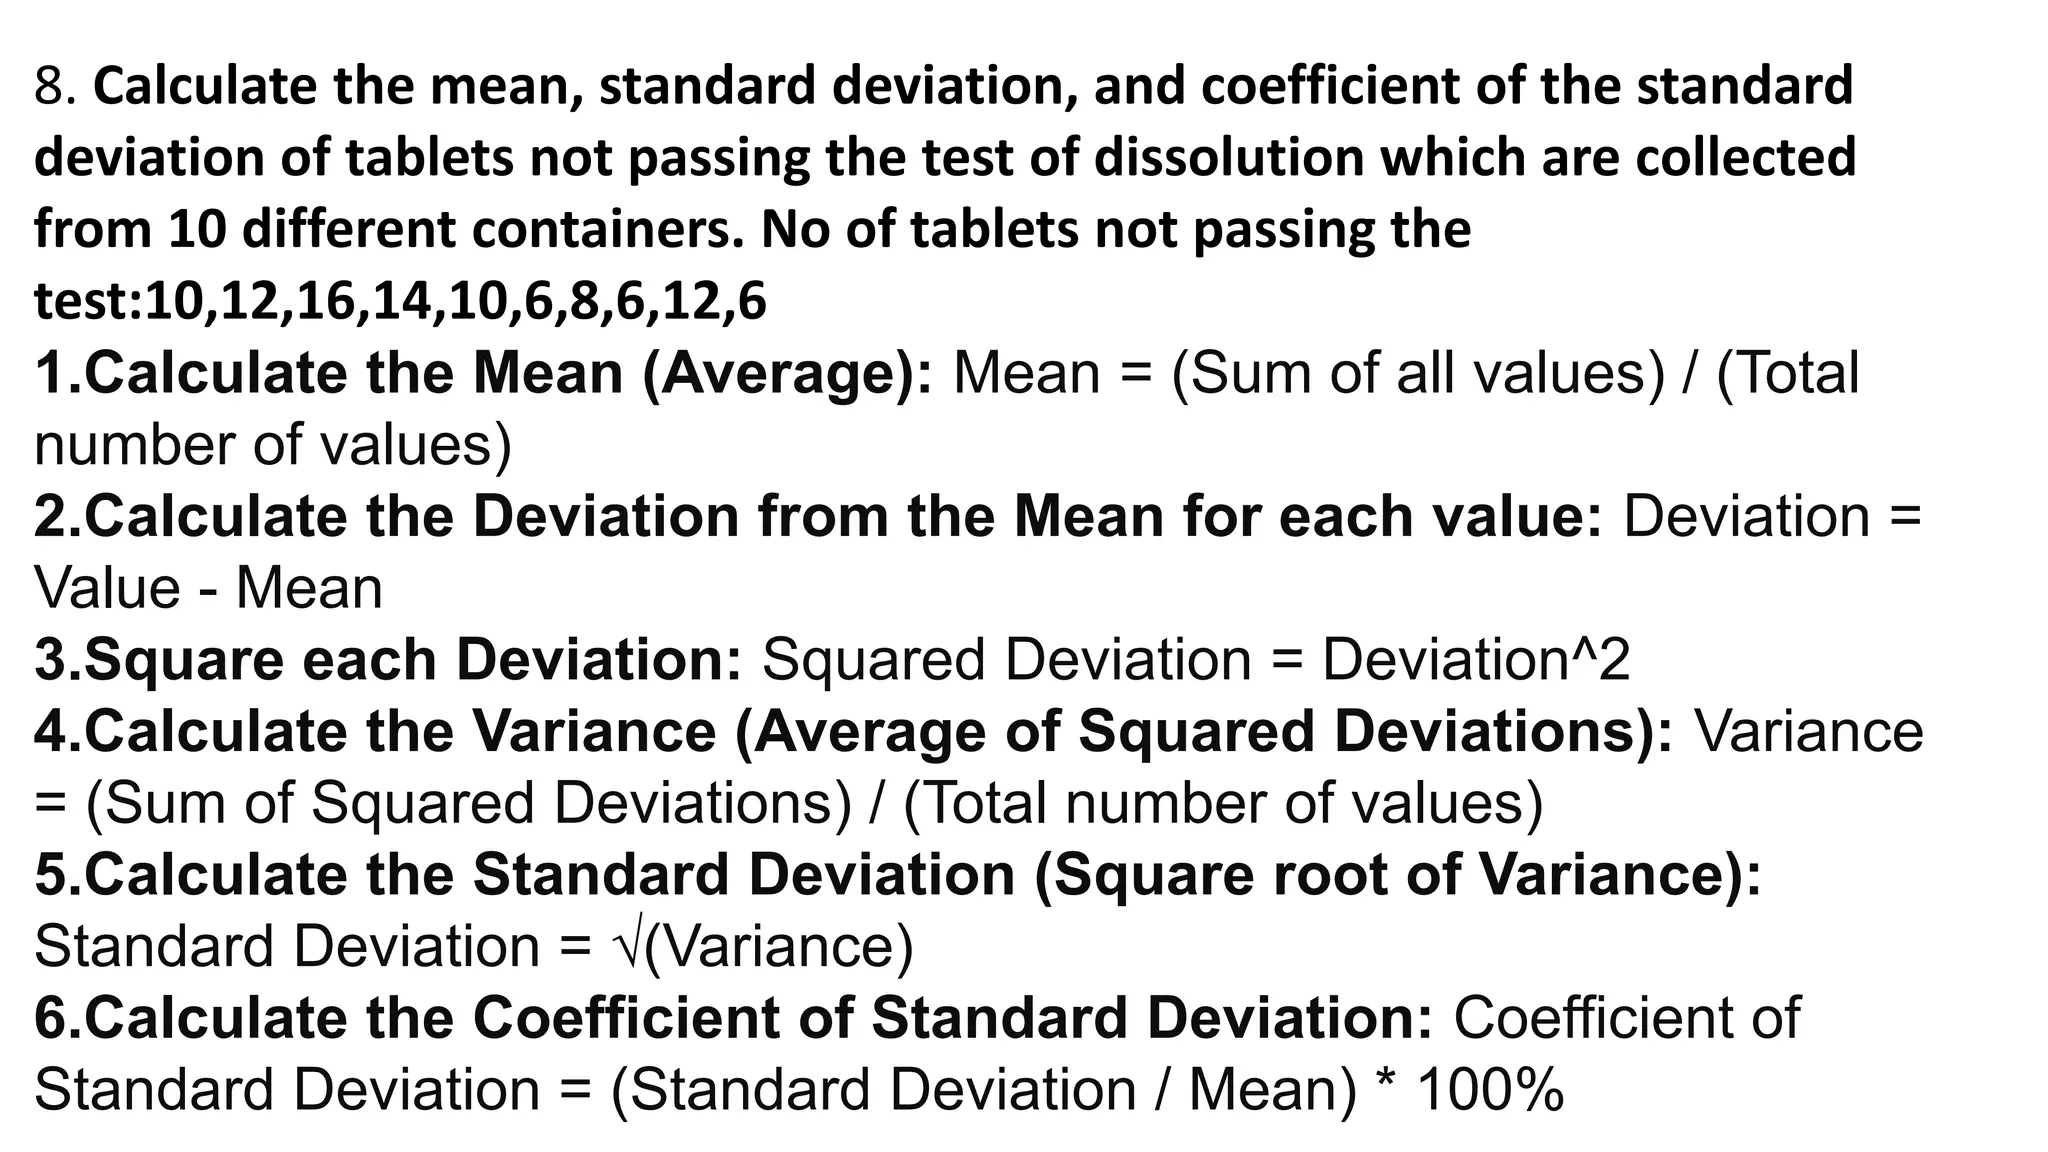
8. Calculate themean, standard deviation, and coefficient of the standard
deviation of tablets not passing the test of dissolution which are collected
from 10 different containers. No of tablets not passing the
test:10,12,16,14,10,6,8,6,12,6
1.Calculate the Mean (Average): Mean = (Sum of all values) / (Total
number of values)
2.Calculate the Deviation from the Mean for each value: Deviation =
Value - Mean
3.Square each Deviation: Squared Deviation = Deviation^2
4.Calculate the Variance (Average of Squared Deviations): Variance
= (Sum of Squared Deviations) / (Total number of values)
5.Calculate the Standard Deviation (Square root of Variance):
Standard Deviation = √(Variance)
6.Calculate the Coefficient of Standard Deviation: Coefficient of
Standard Deviation = (Standard Deviation / Mean) * 100%
13.
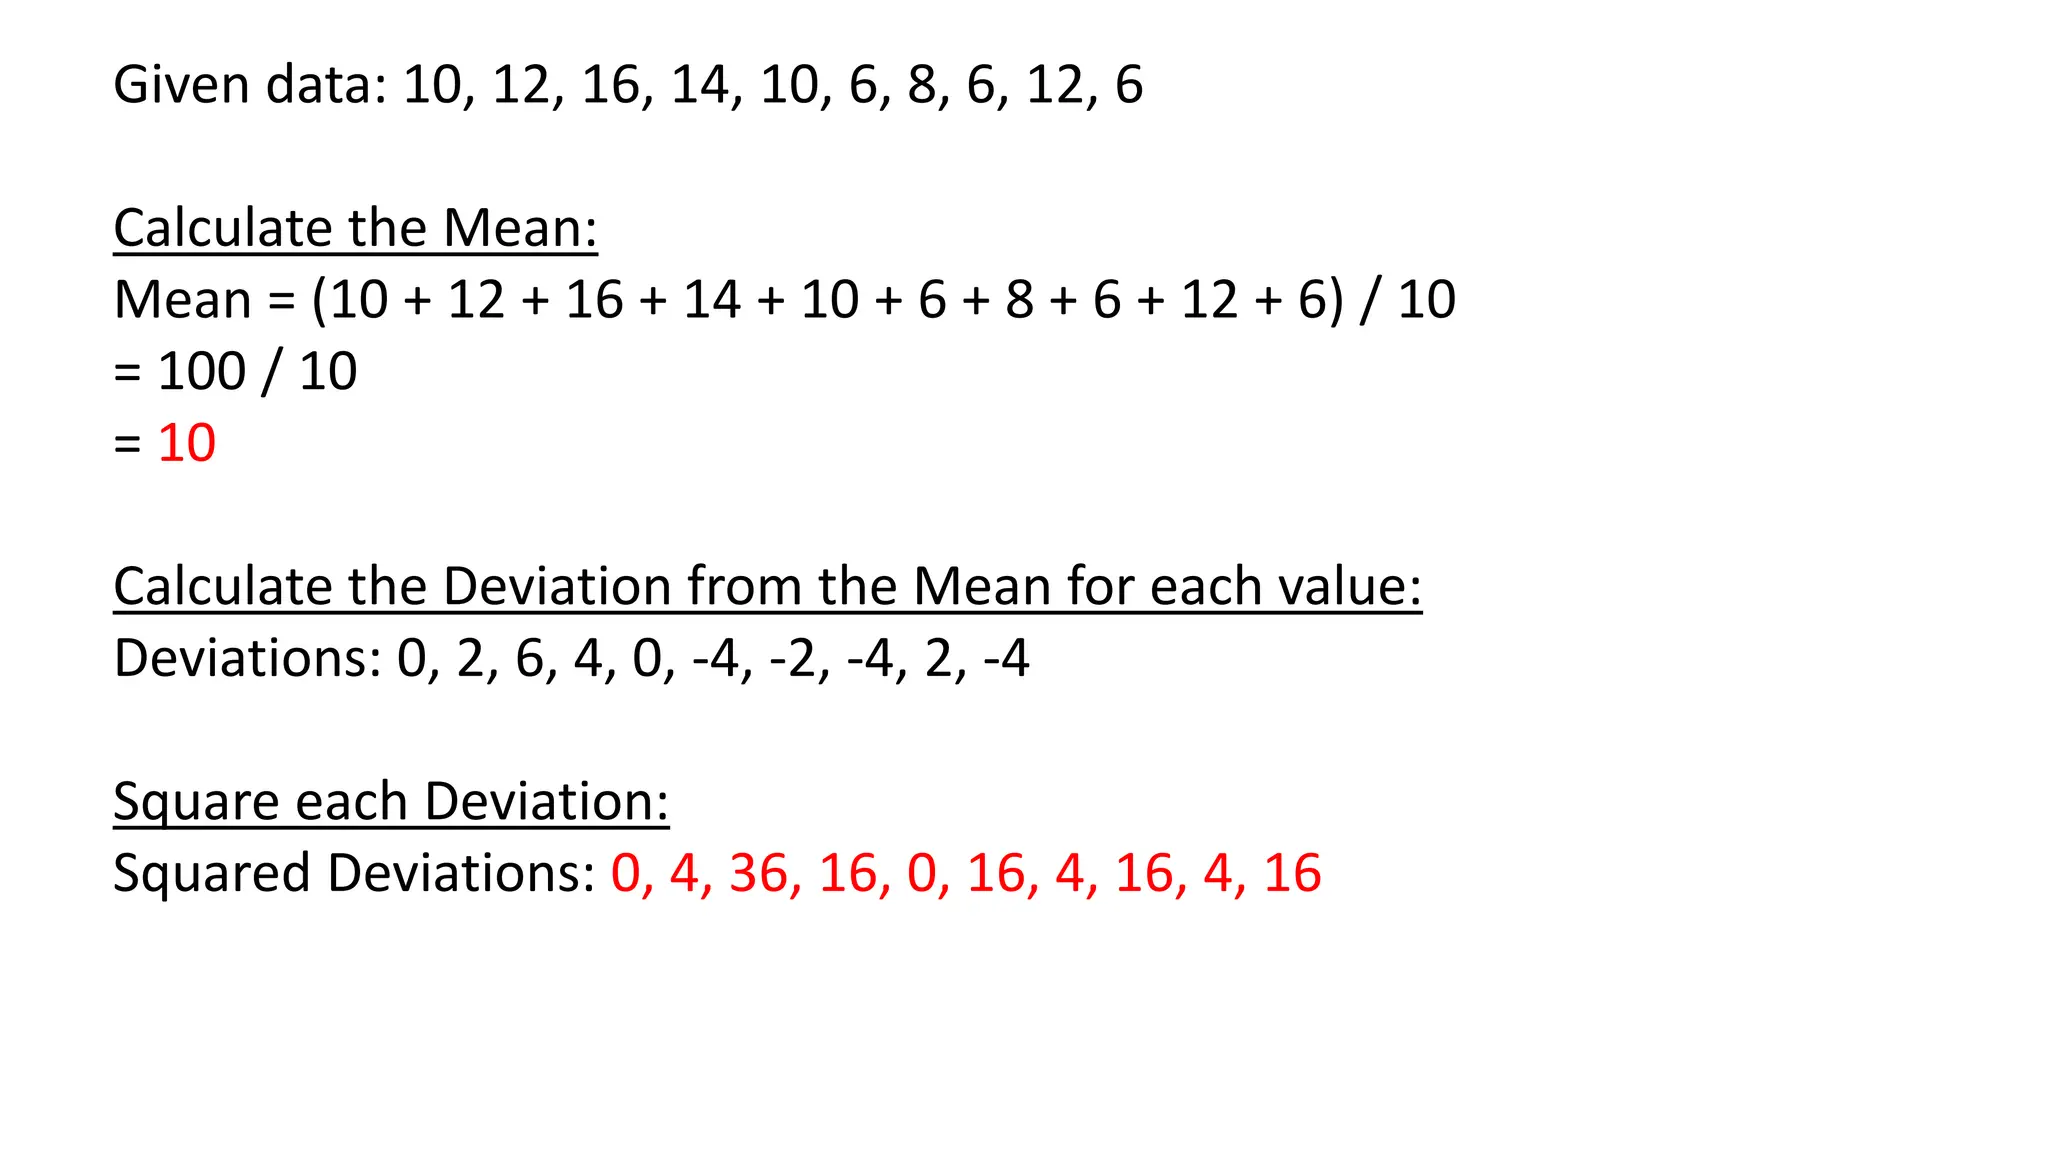
Given data: 10,12, 16, 14, 10, 6, 8, 6, 12, 6
Calculate the Mean:
Mean = (10 + 12 + 16 + 14 + 10 + 6 + 8 + 6 + 12 + 6) / 10
= 100 / 10
= 10
Calculate the Deviation from the Mean for each value:
Deviations: 0, 2, 6, 4, 0, -4, -2, -4, 2, -4
Square each Deviation:
Squared Deviations: 0, 4, 36, 16, 0, 16, 4, 16, 4, 16
14.
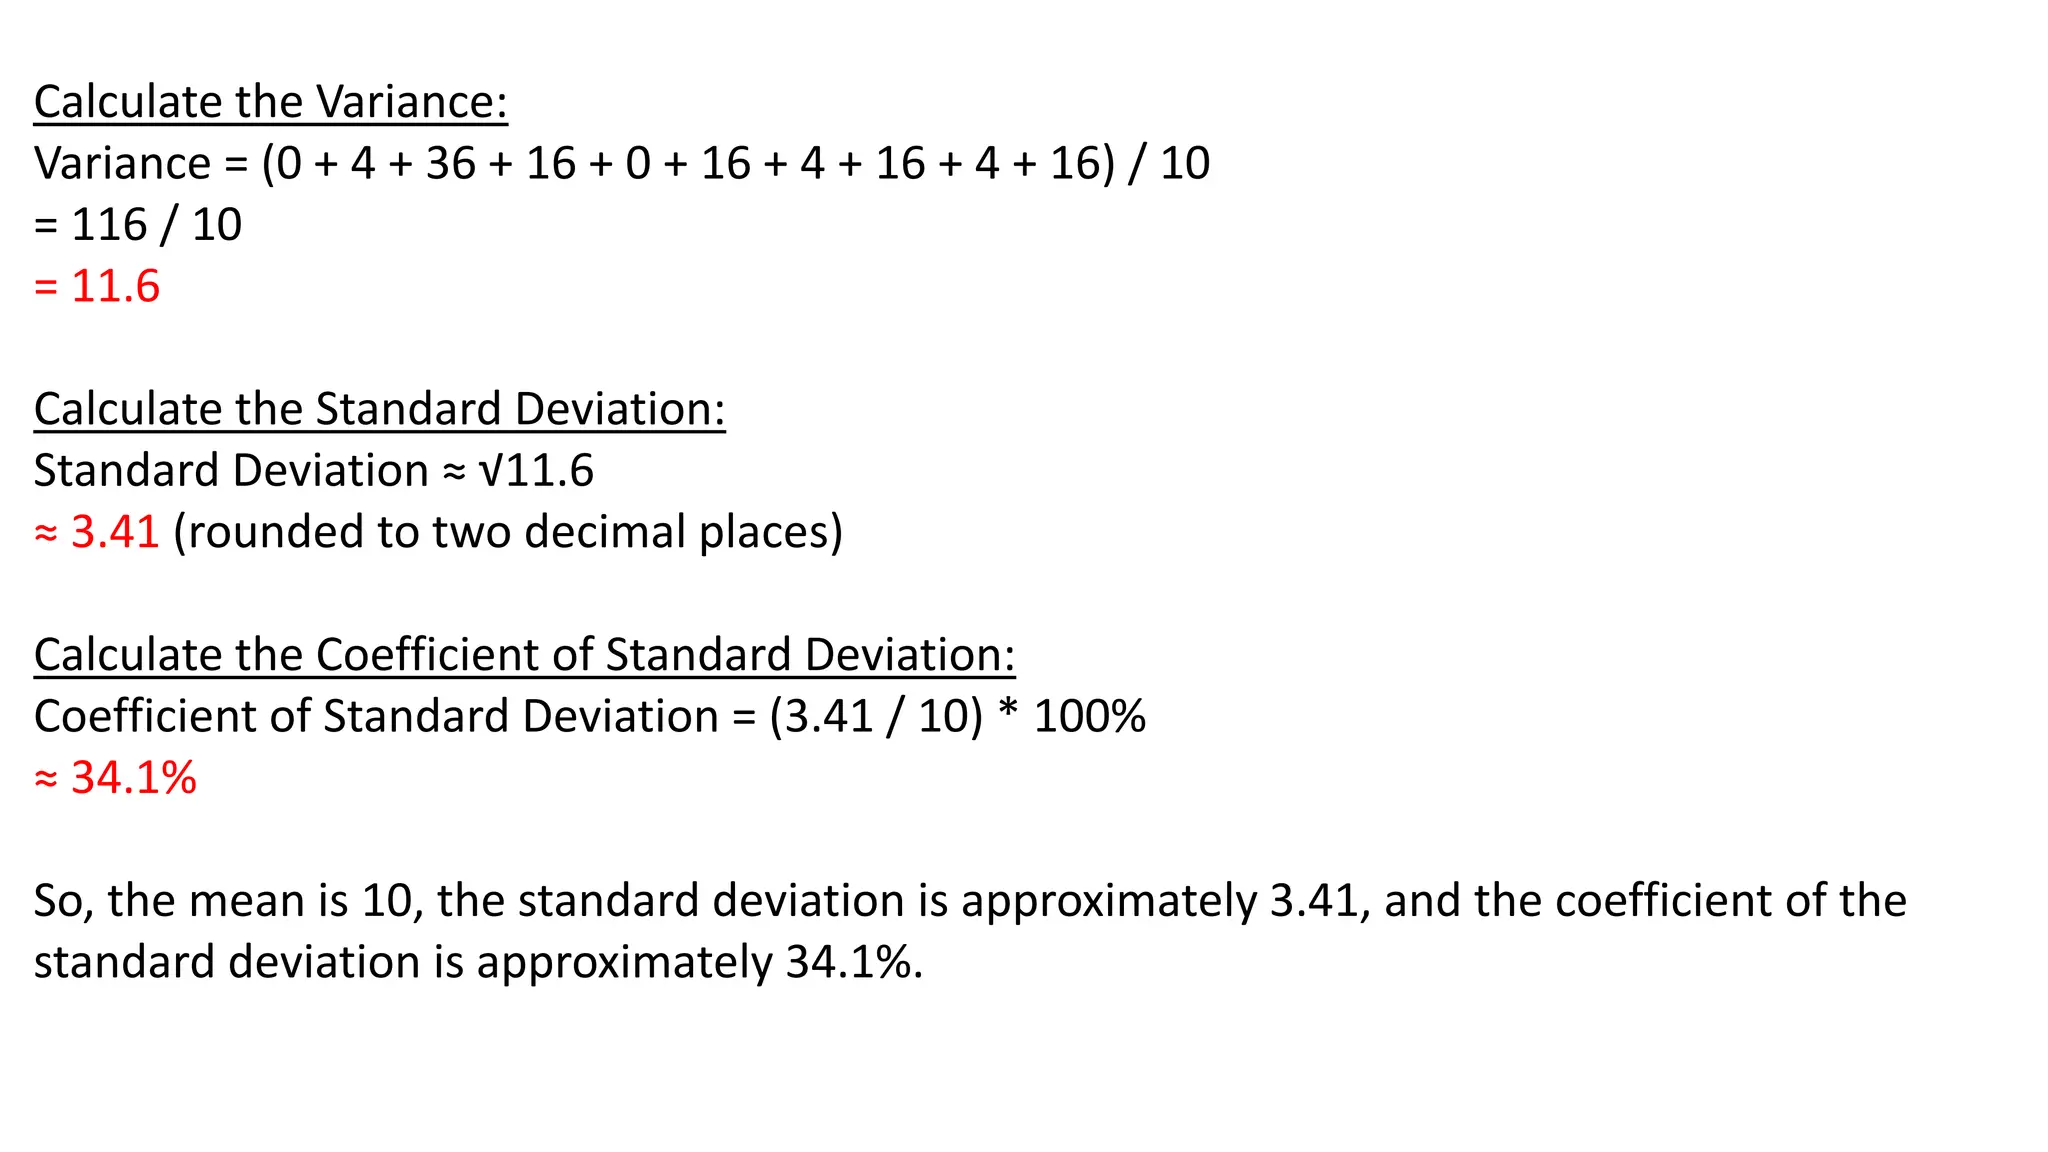
Calculate the Variance:
Variance= (0 + 4 + 36 + 16 + 0 + 16 + 4 + 16 + 4 + 16) / 10
= 116 / 10
= 11.6
Calculate the Standard Deviation:
Standard Deviation ≈ √11.6
≈ 3.41 (rounded to two decimal places)
Calculate the Coefficient of Standard Deviation:
Coefficient of Standard Deviation = (3.41 / 10) * 100%
≈ 34.1%
So, the mean is 10, the standard deviation is approximately 3.41, and the coefficient of the
standard deviation is approximately 34.1%.