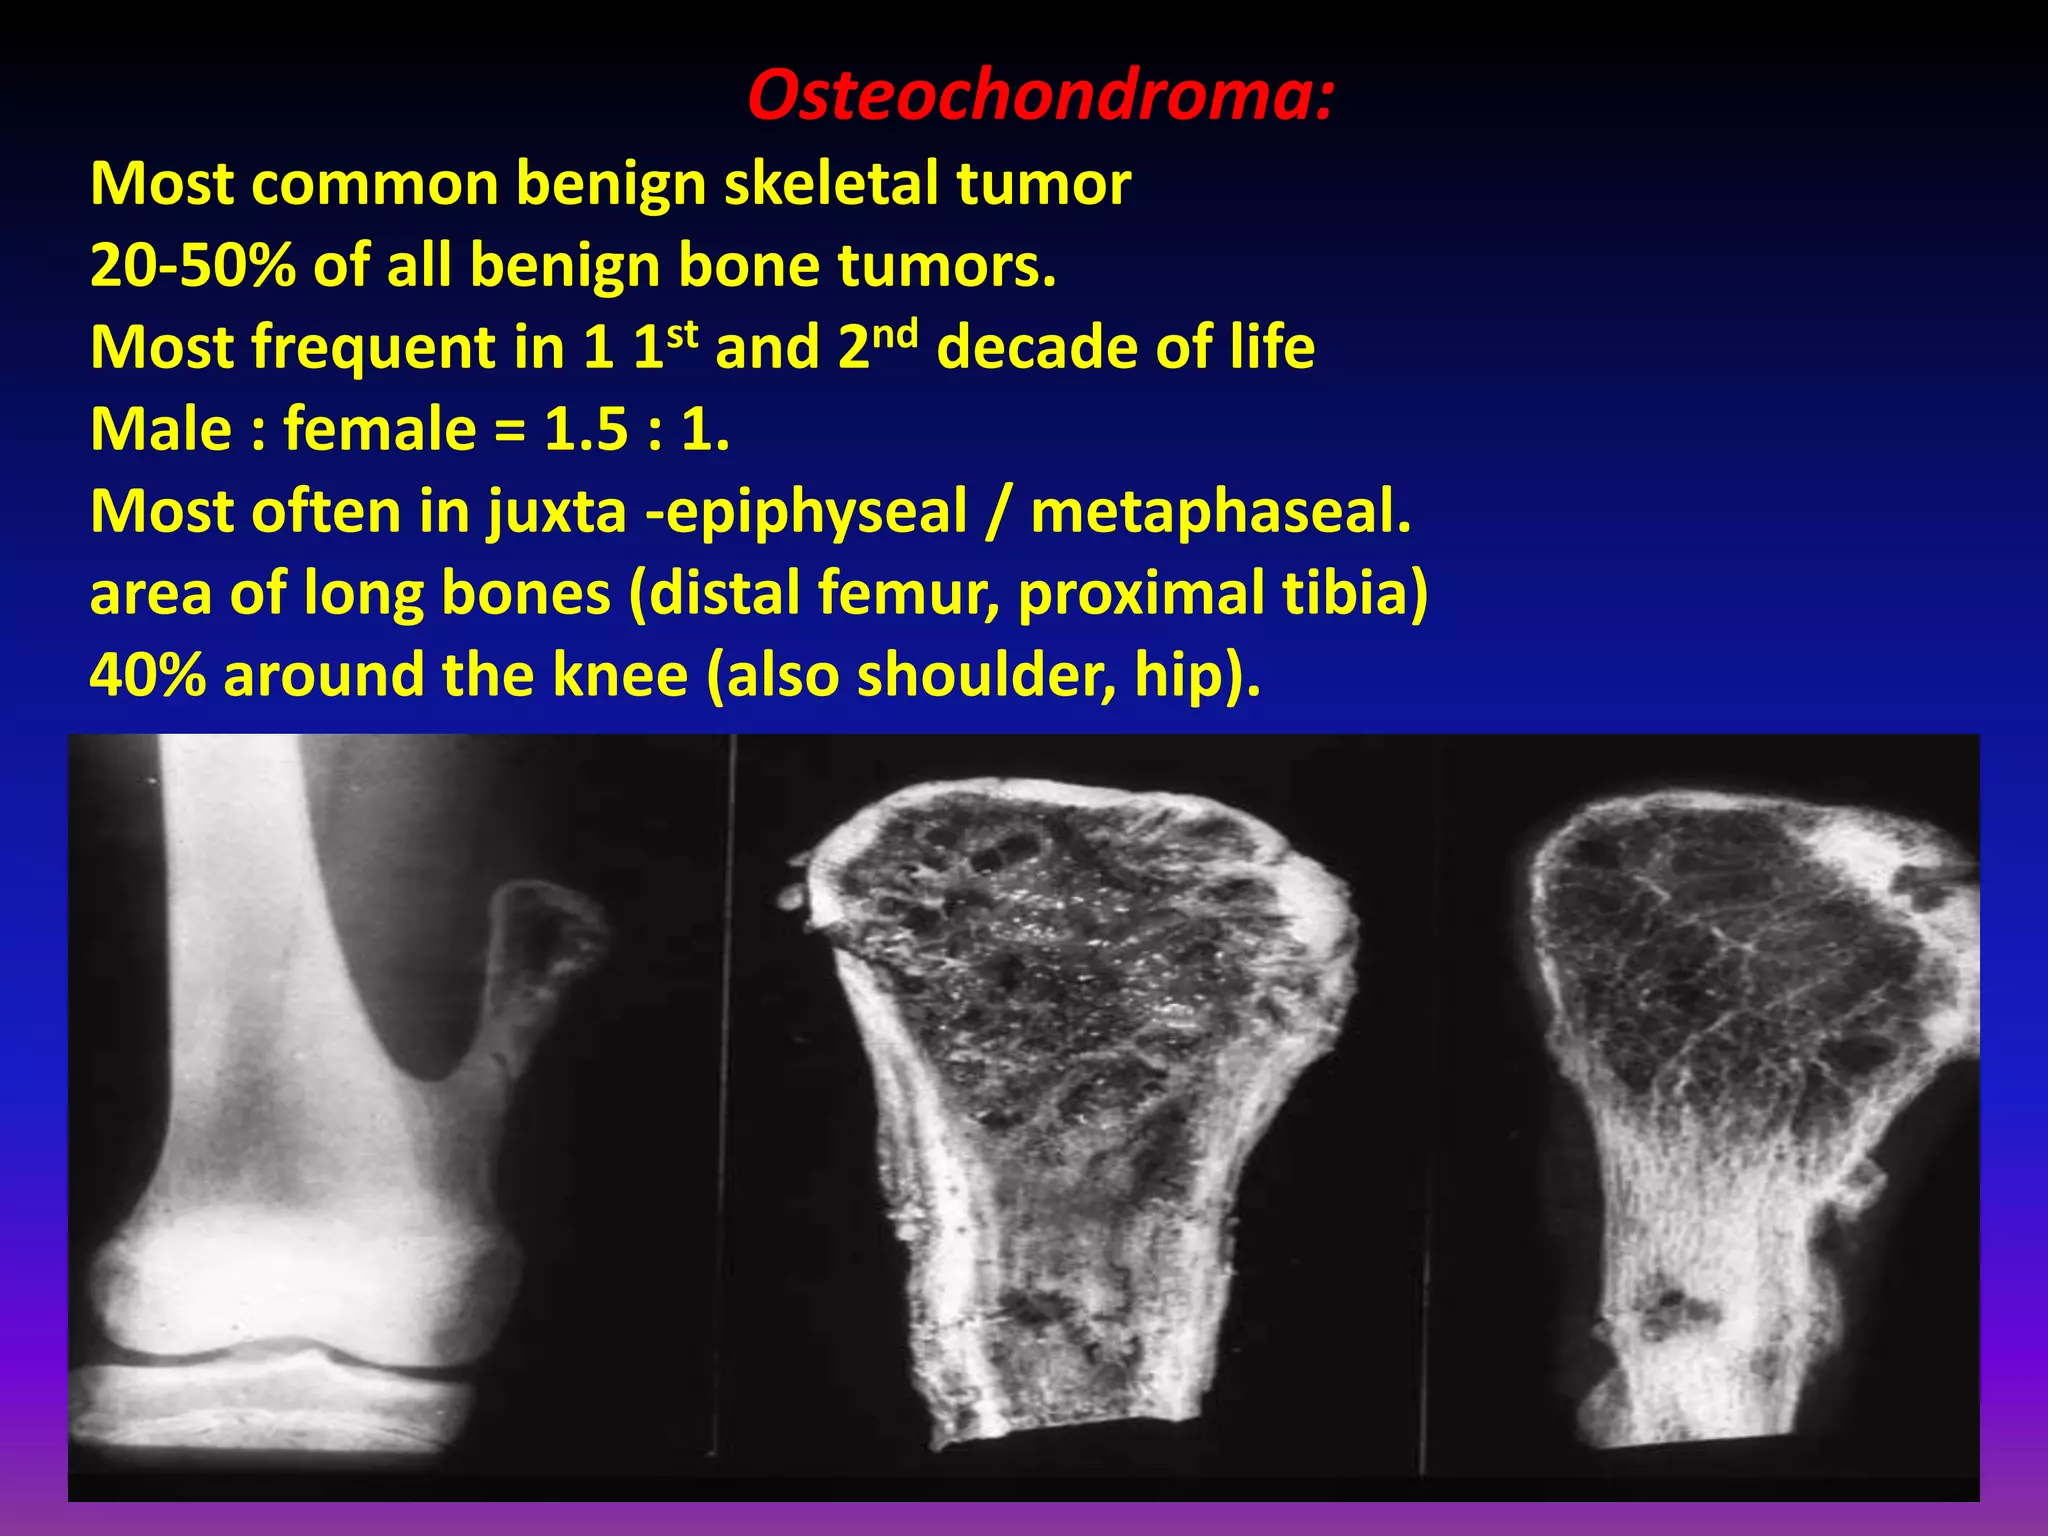
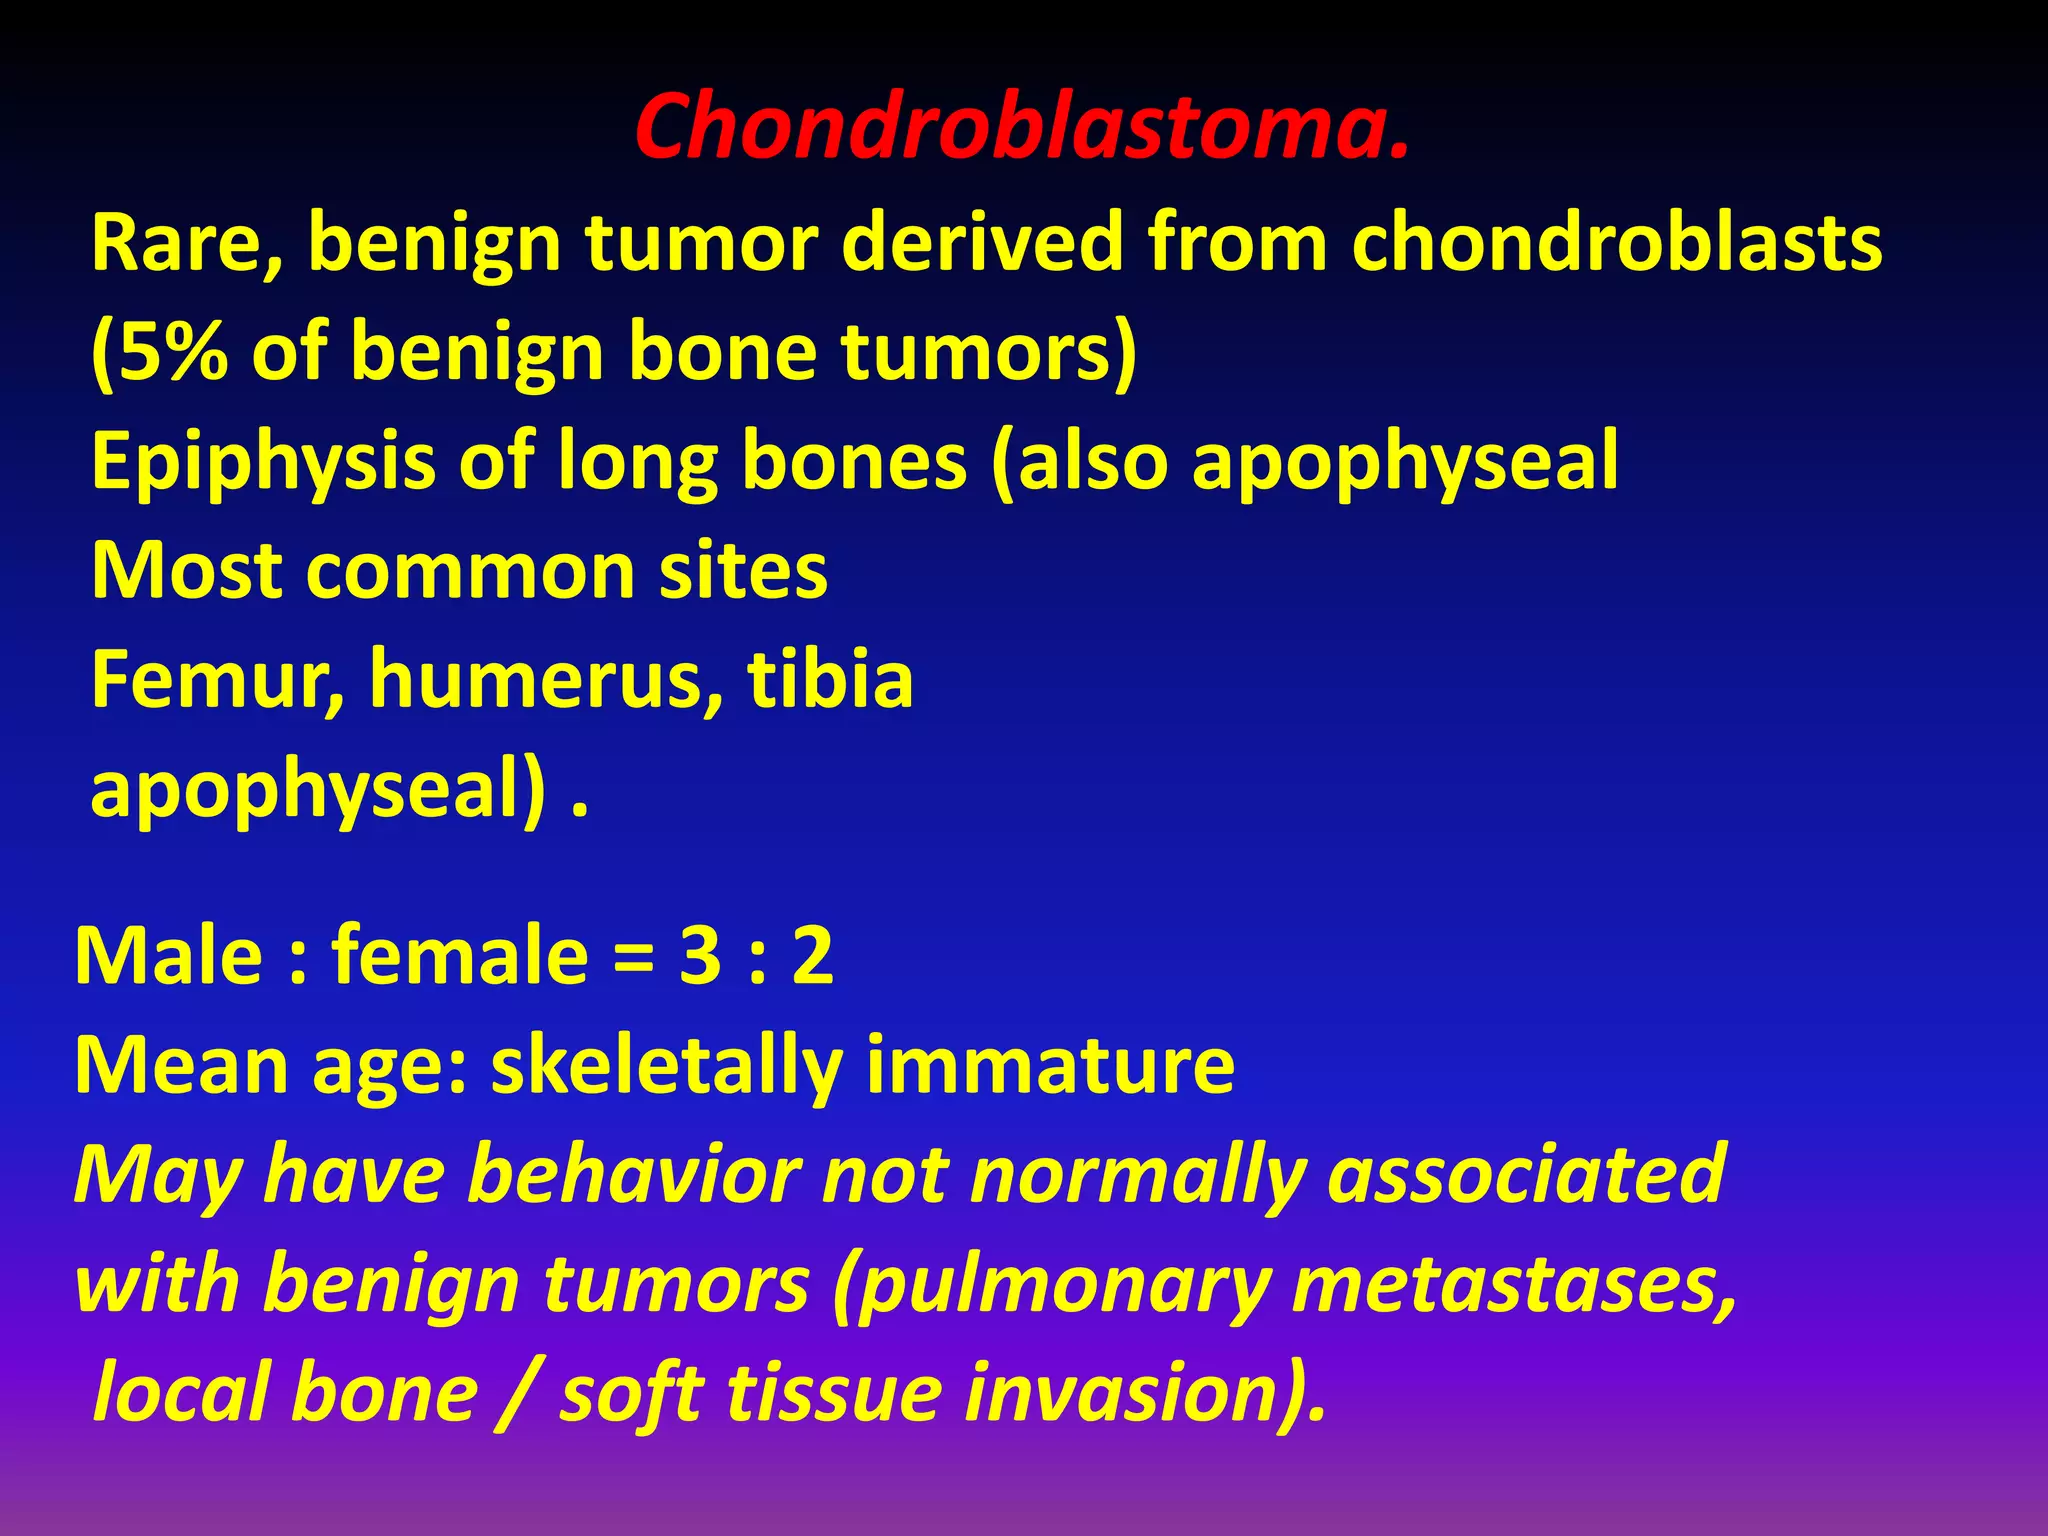
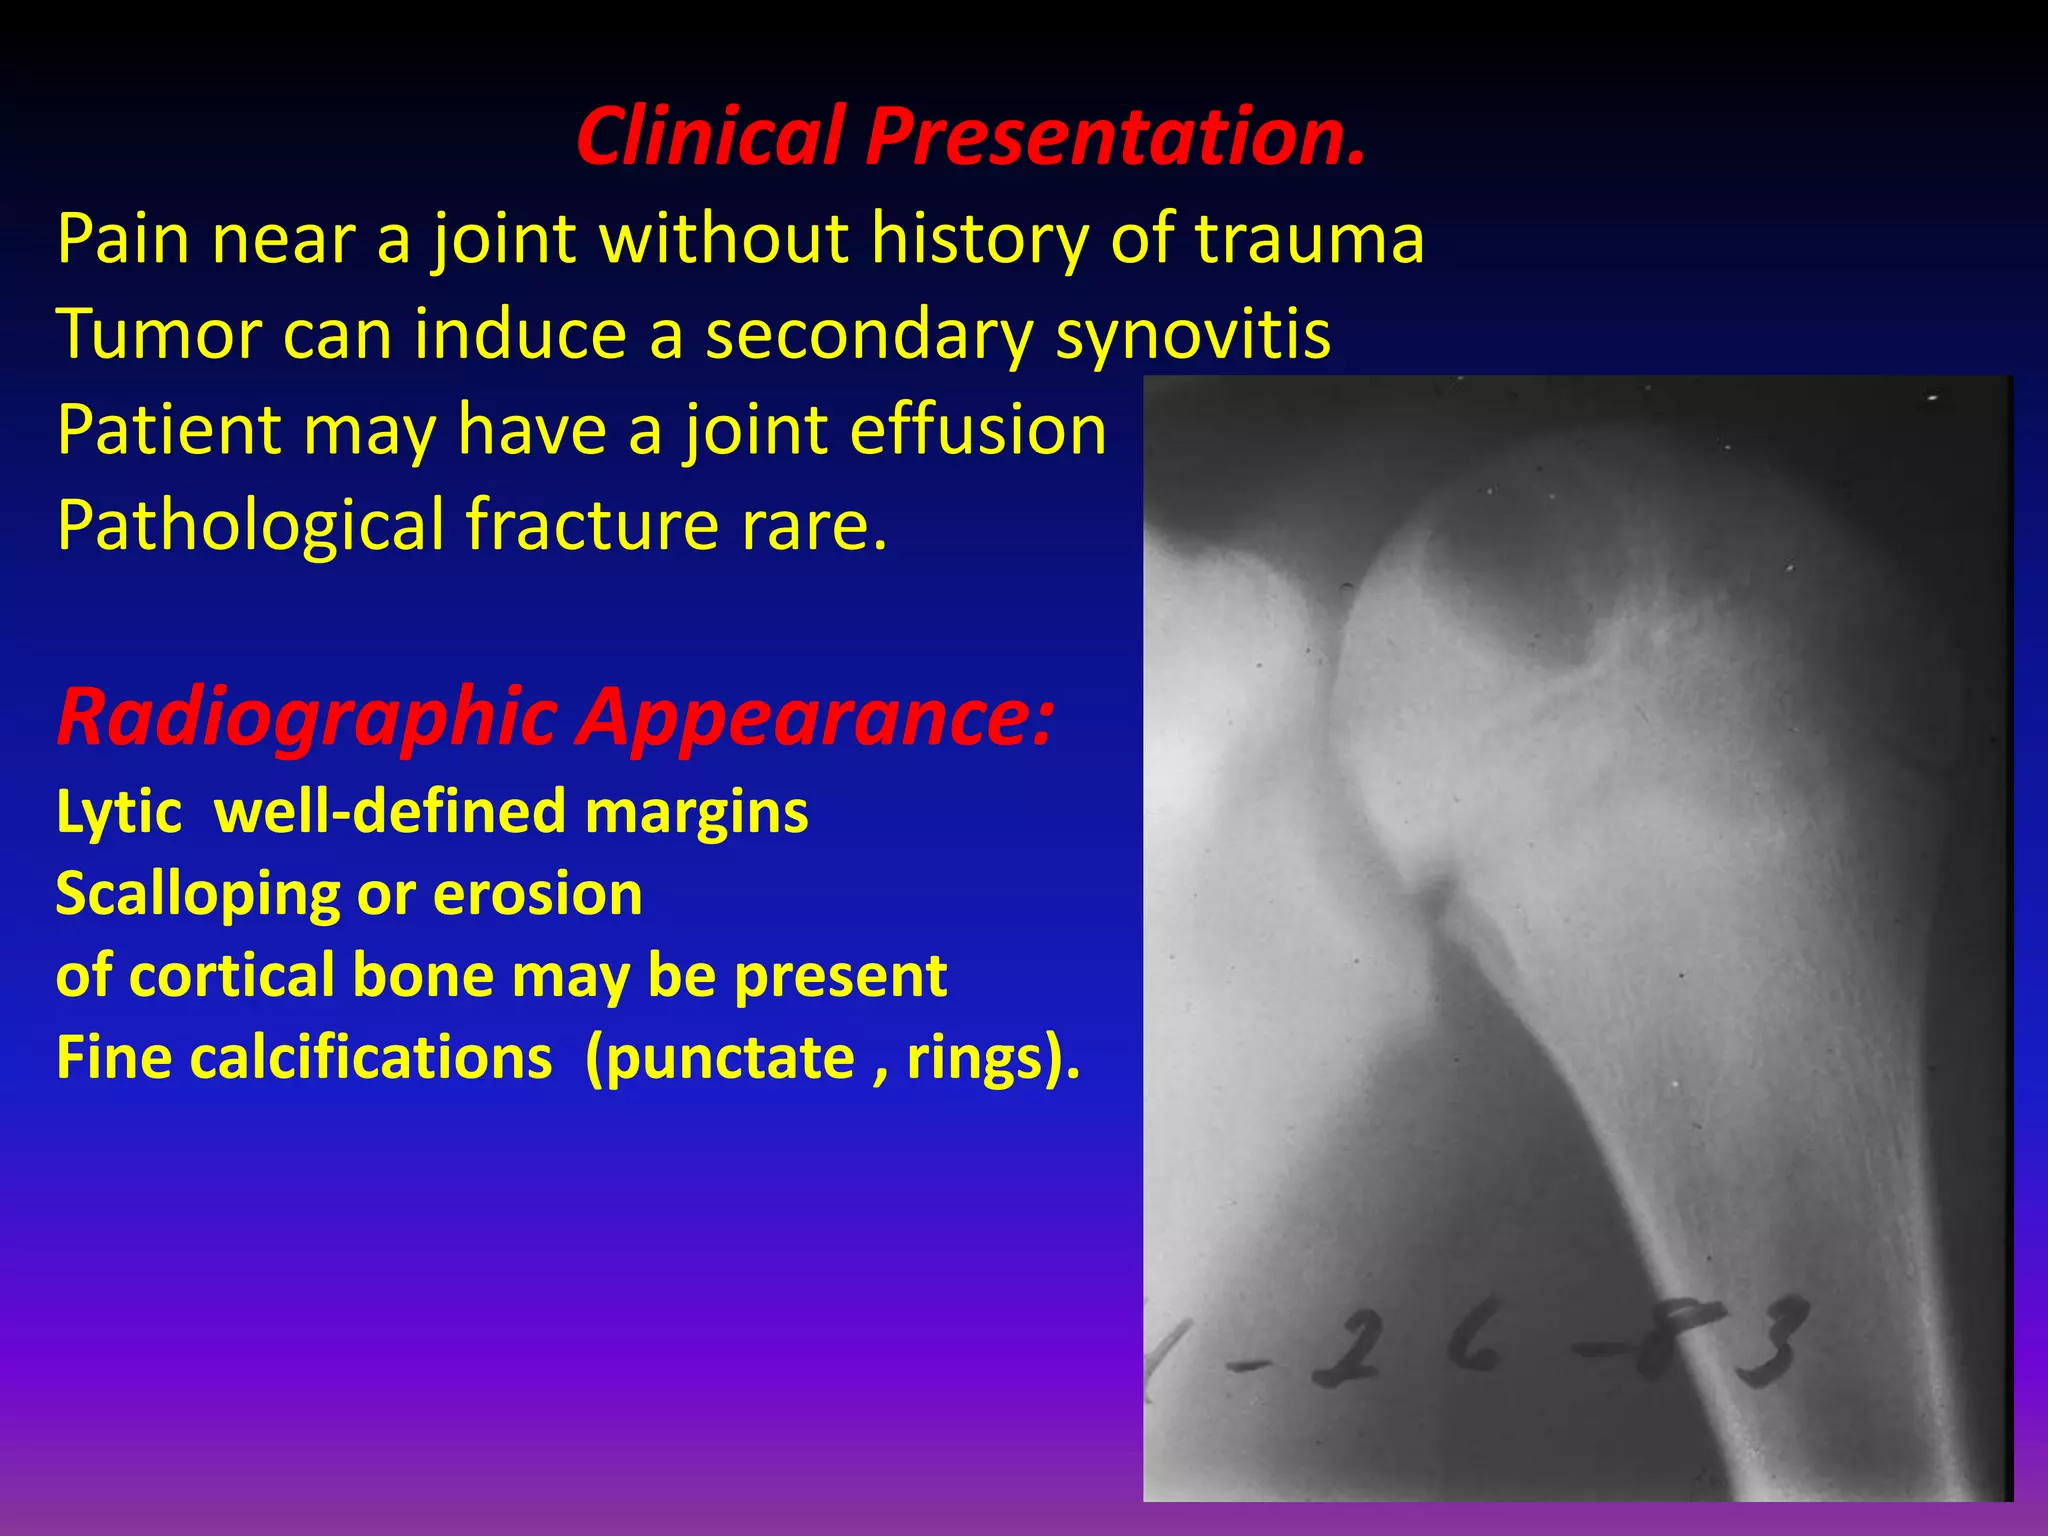
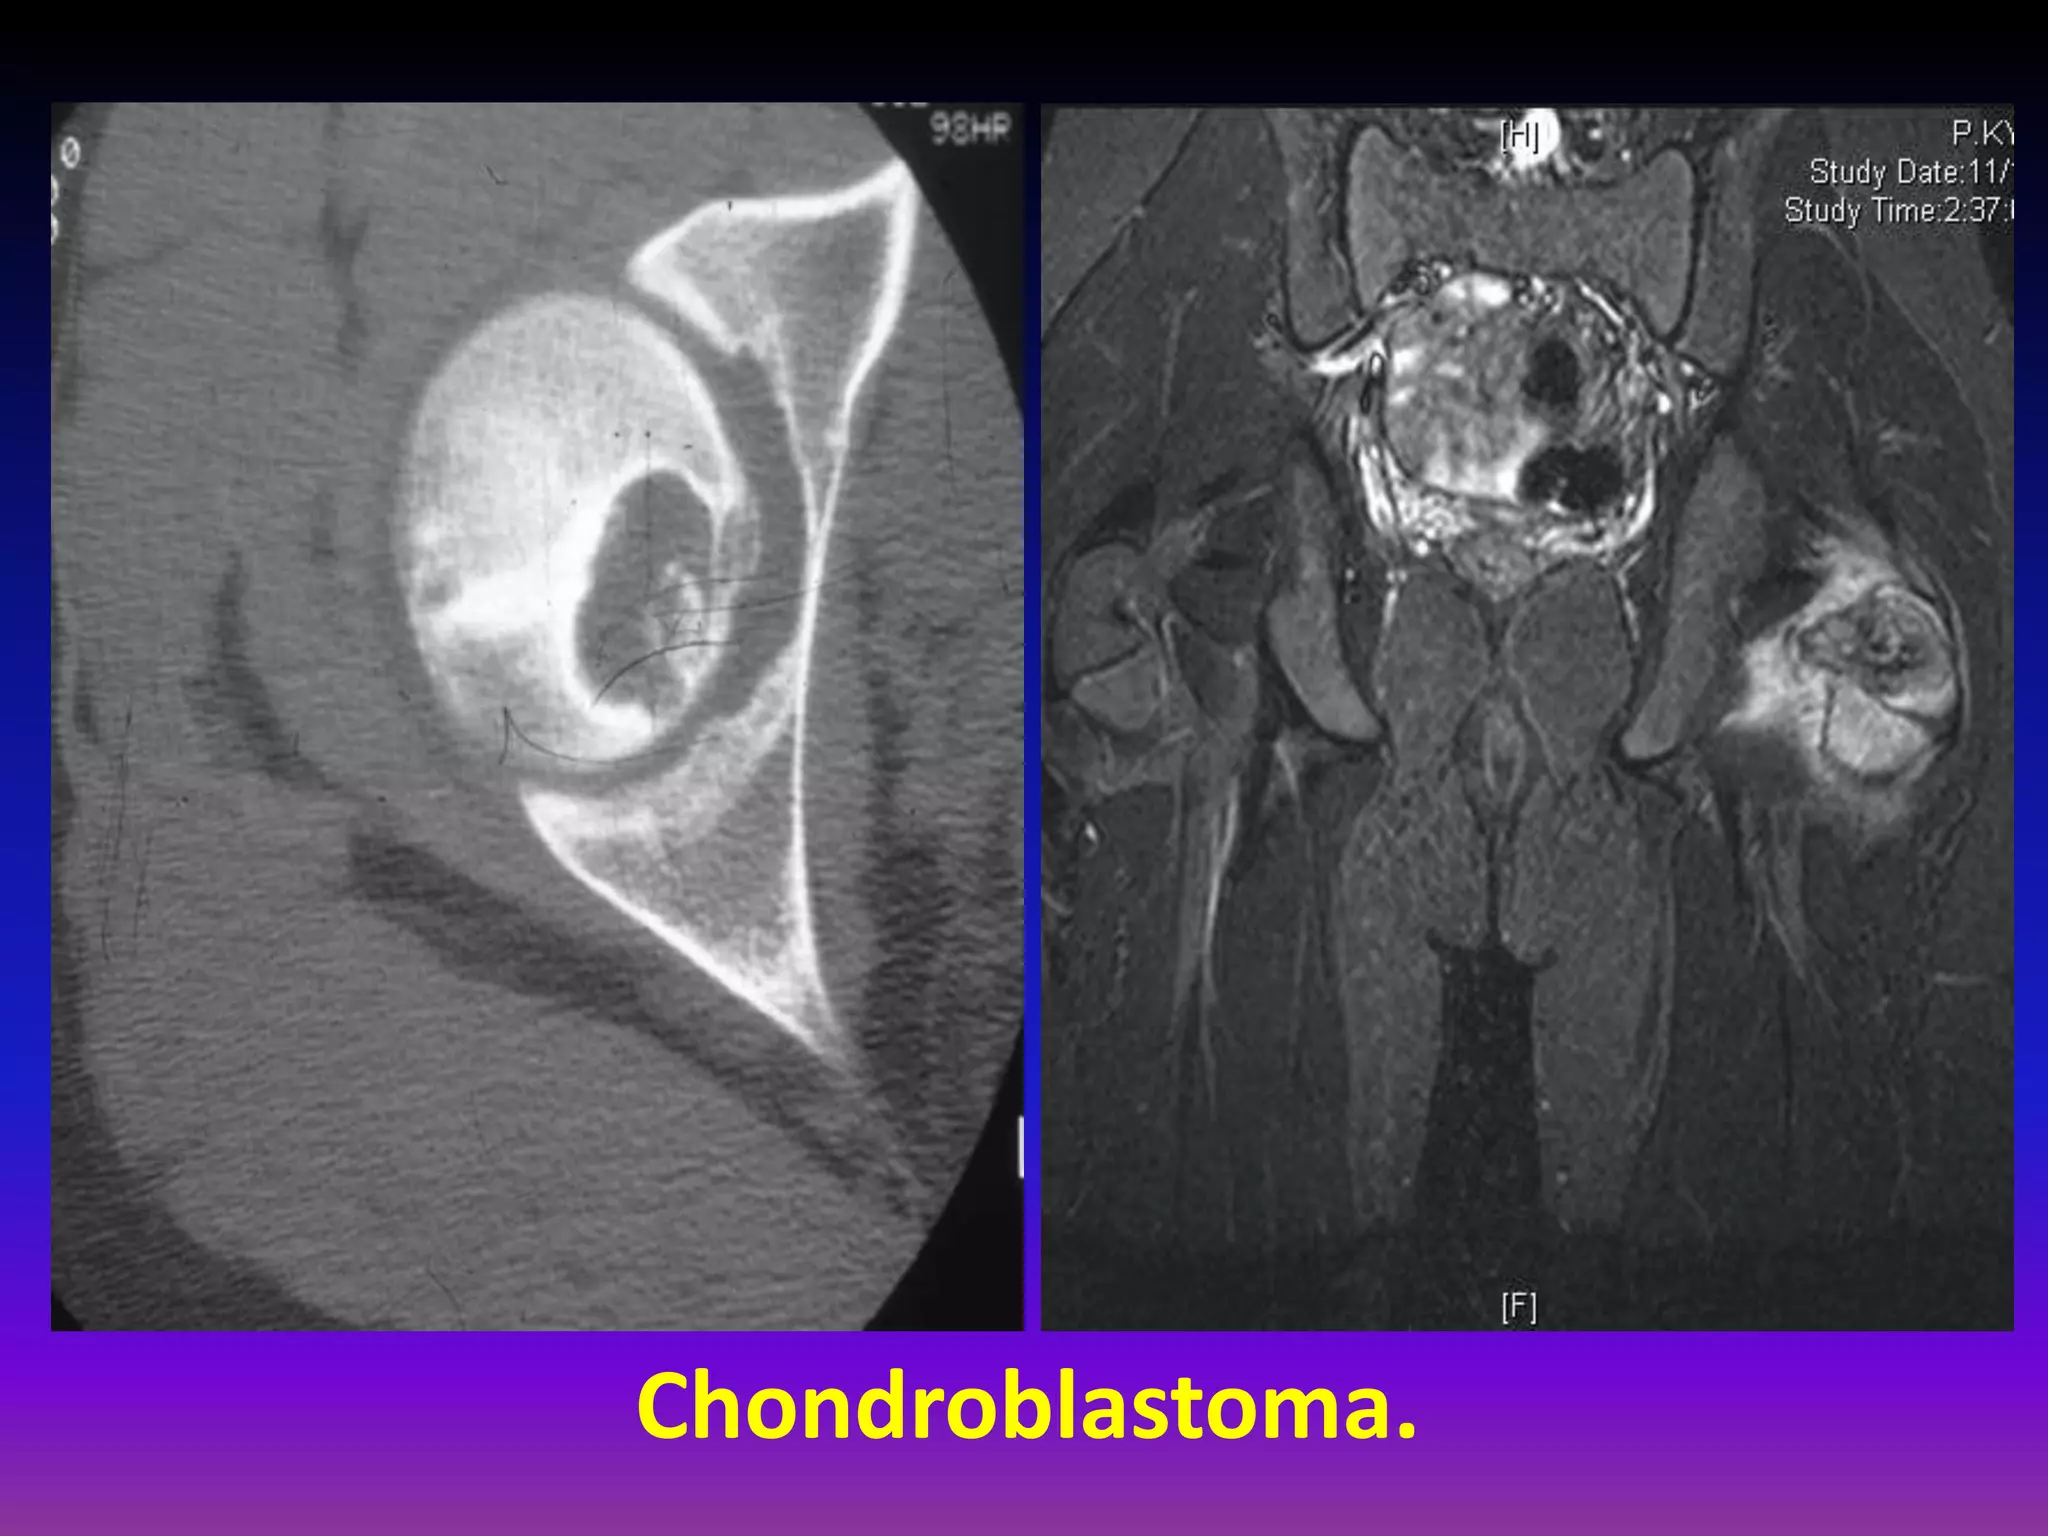
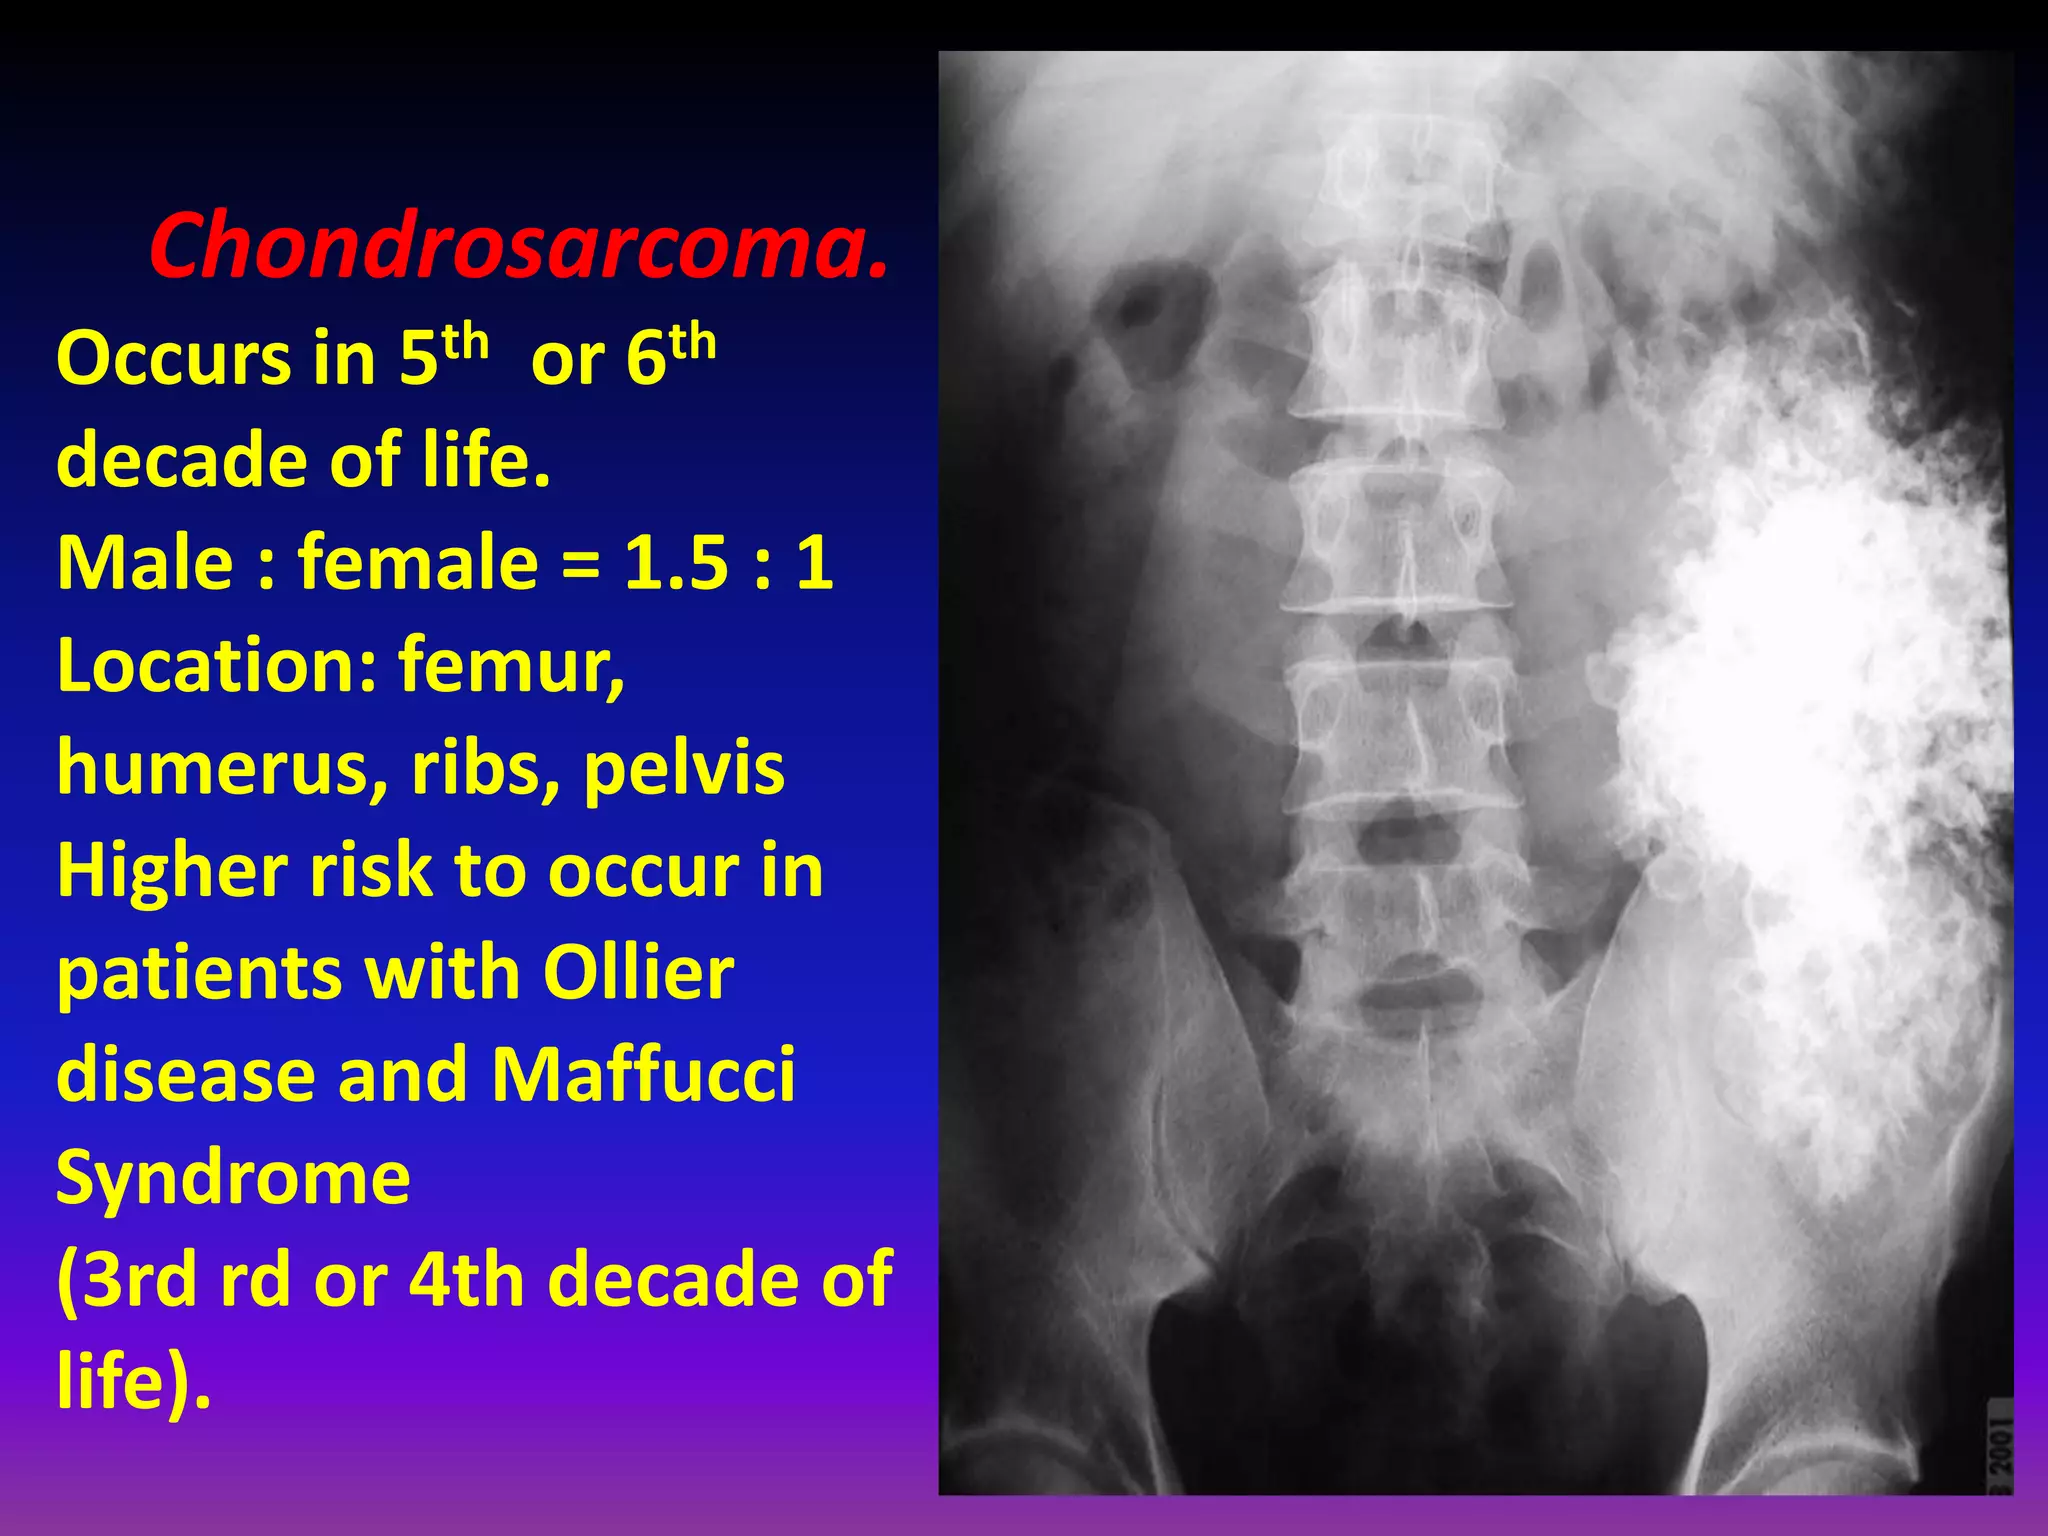
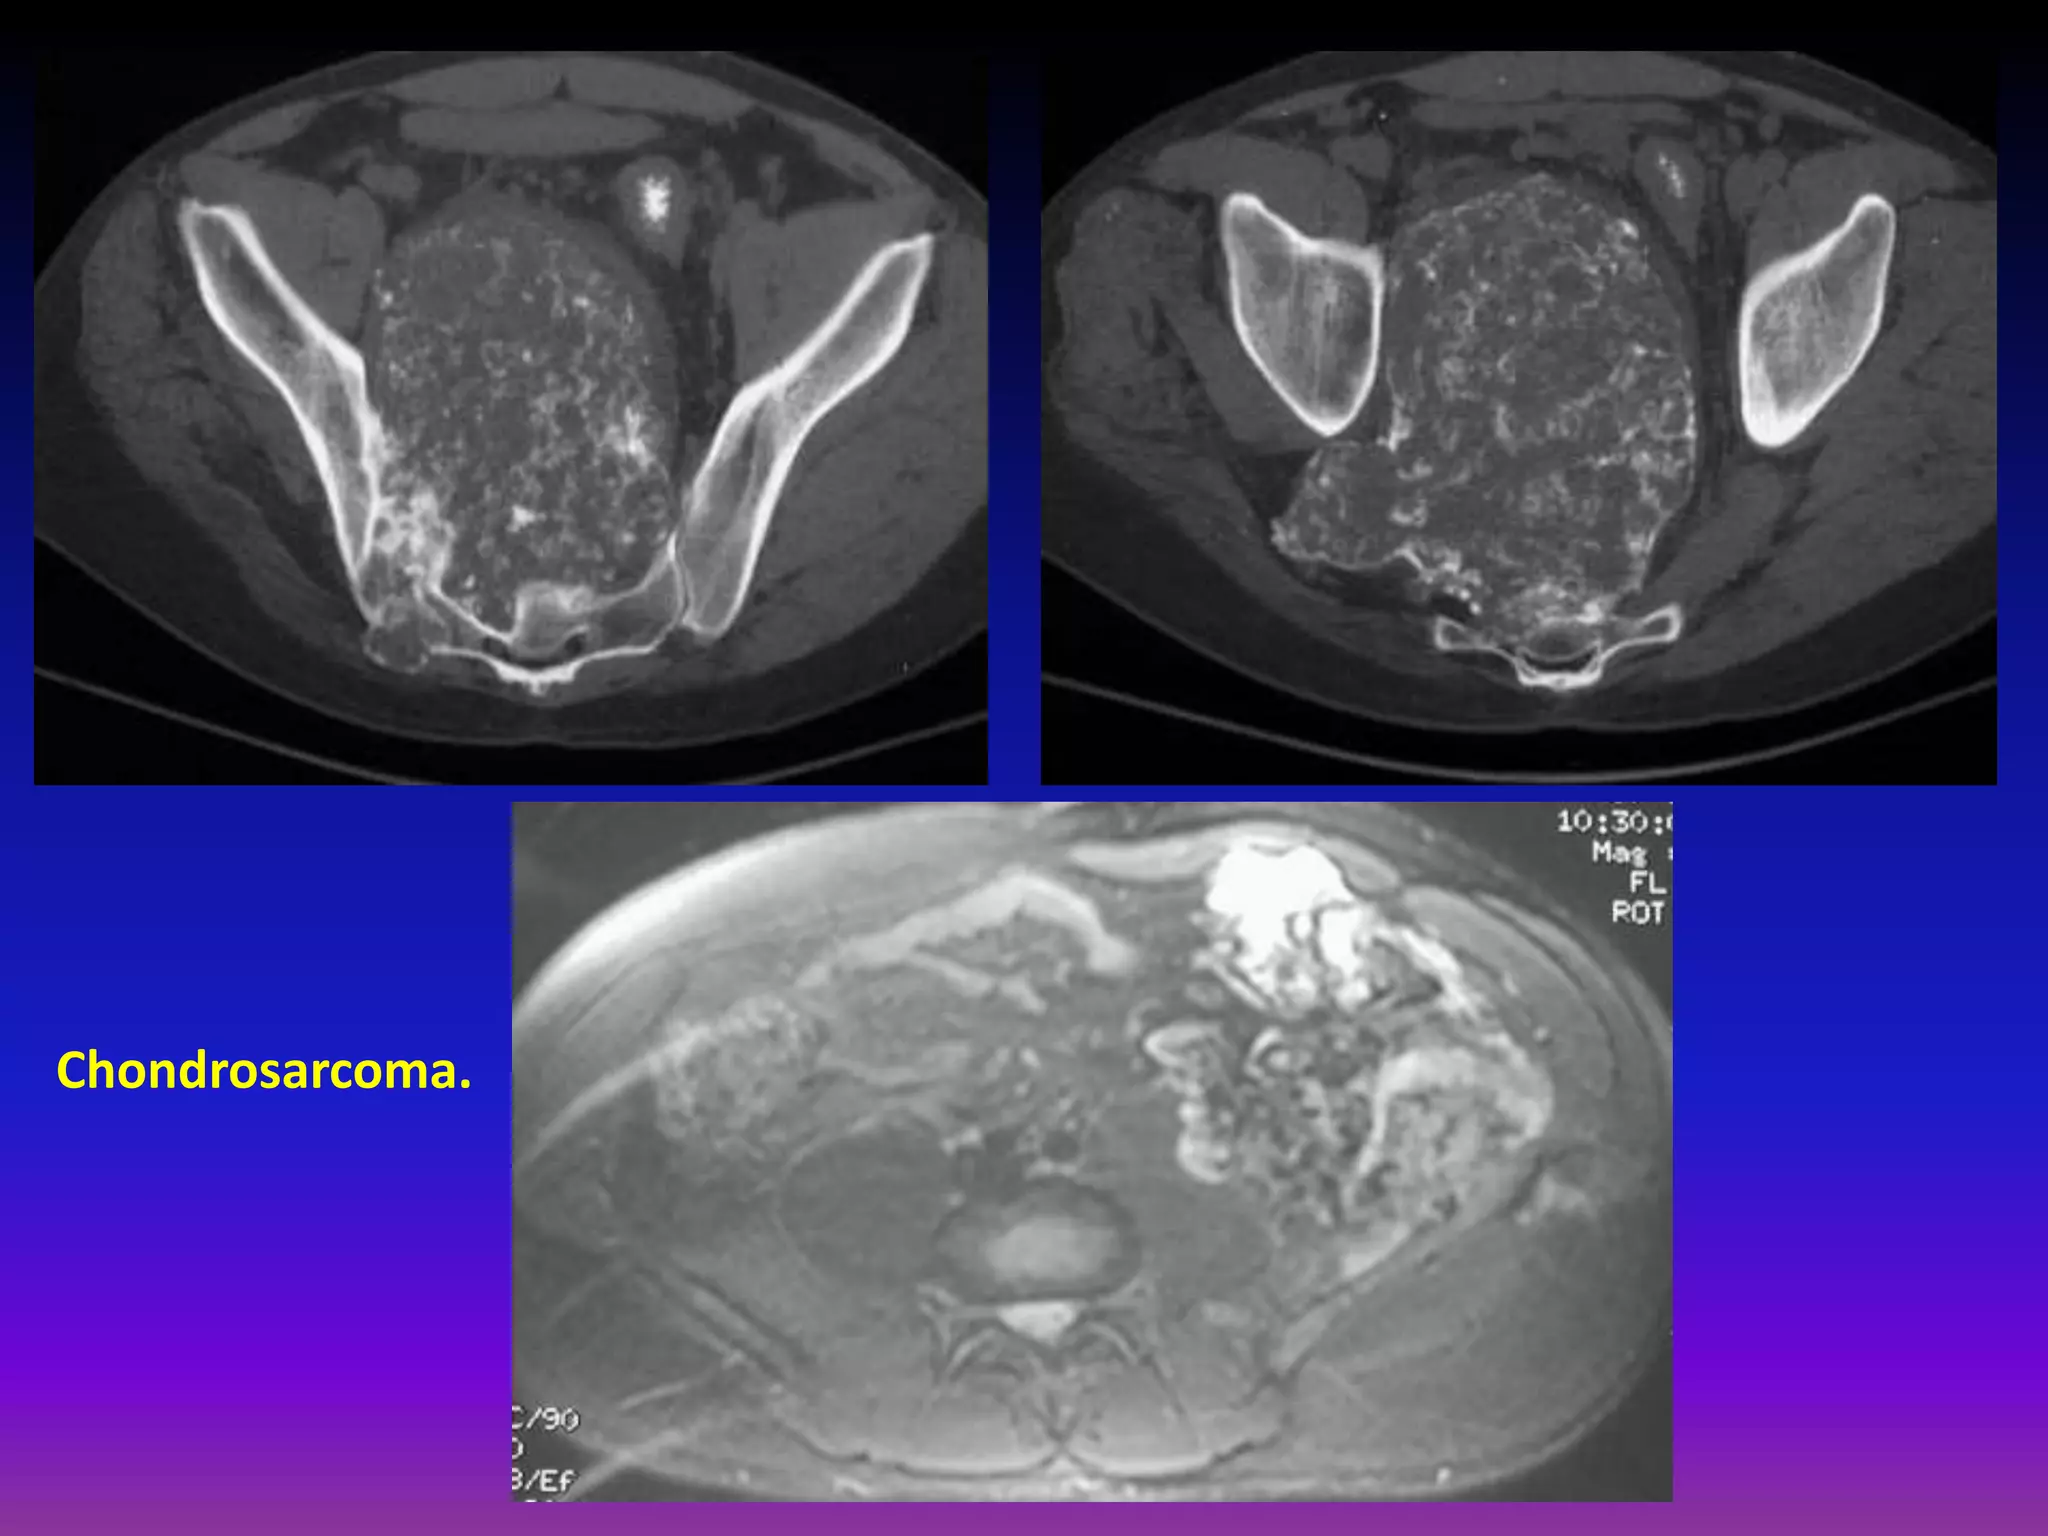
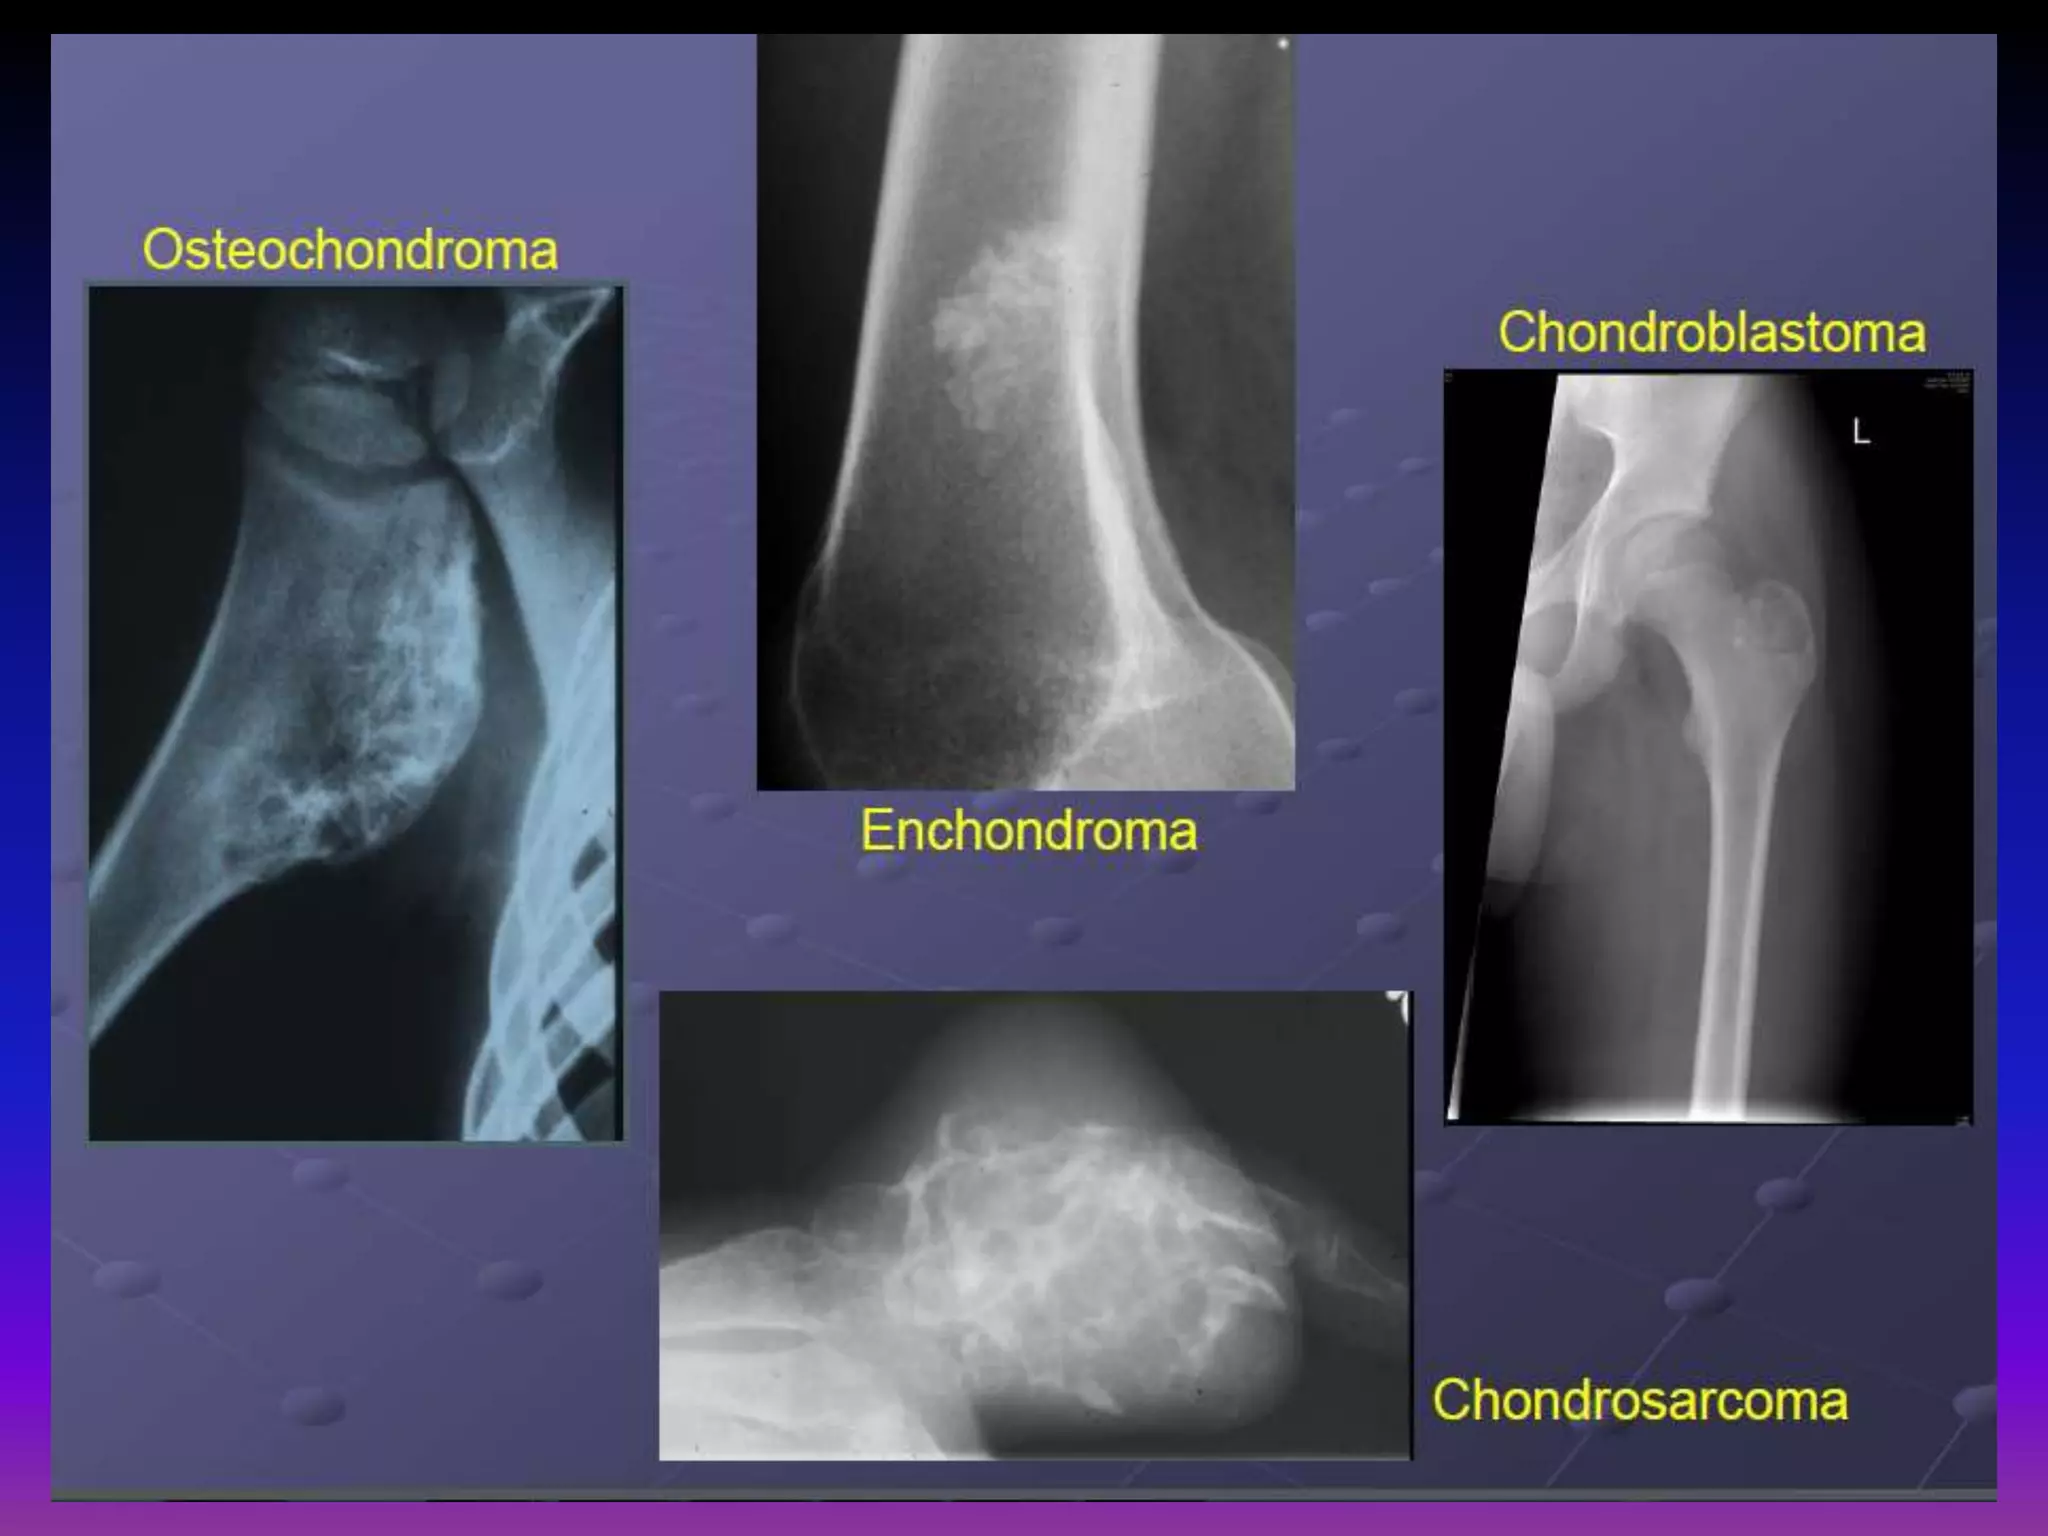
Downloaded 297 times
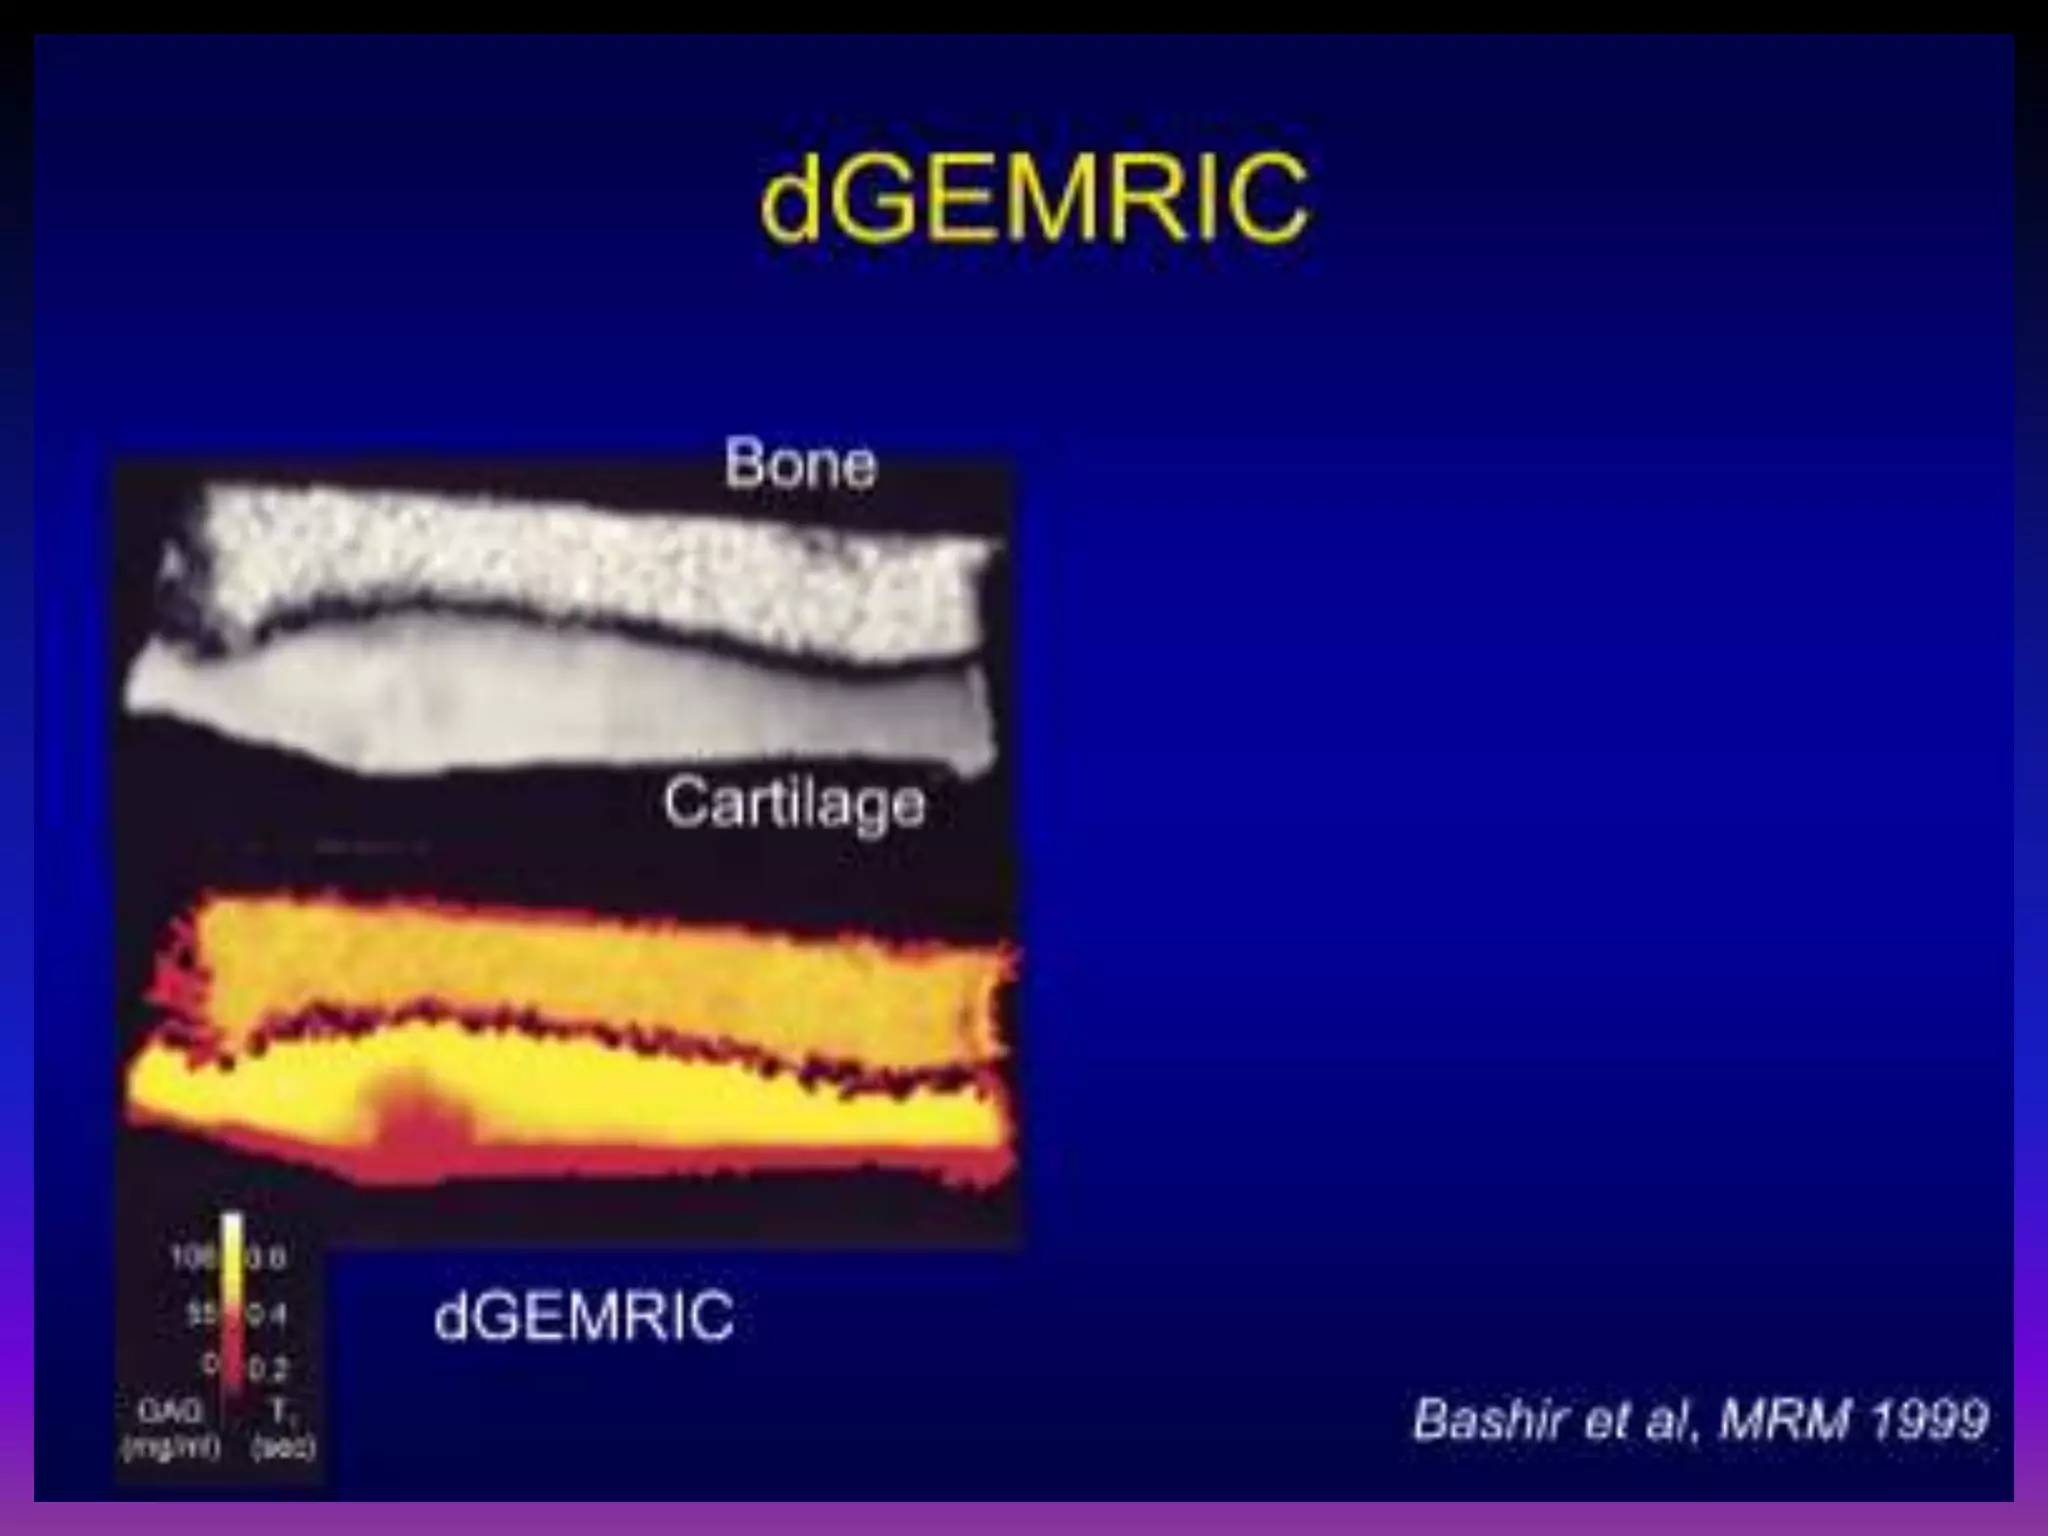
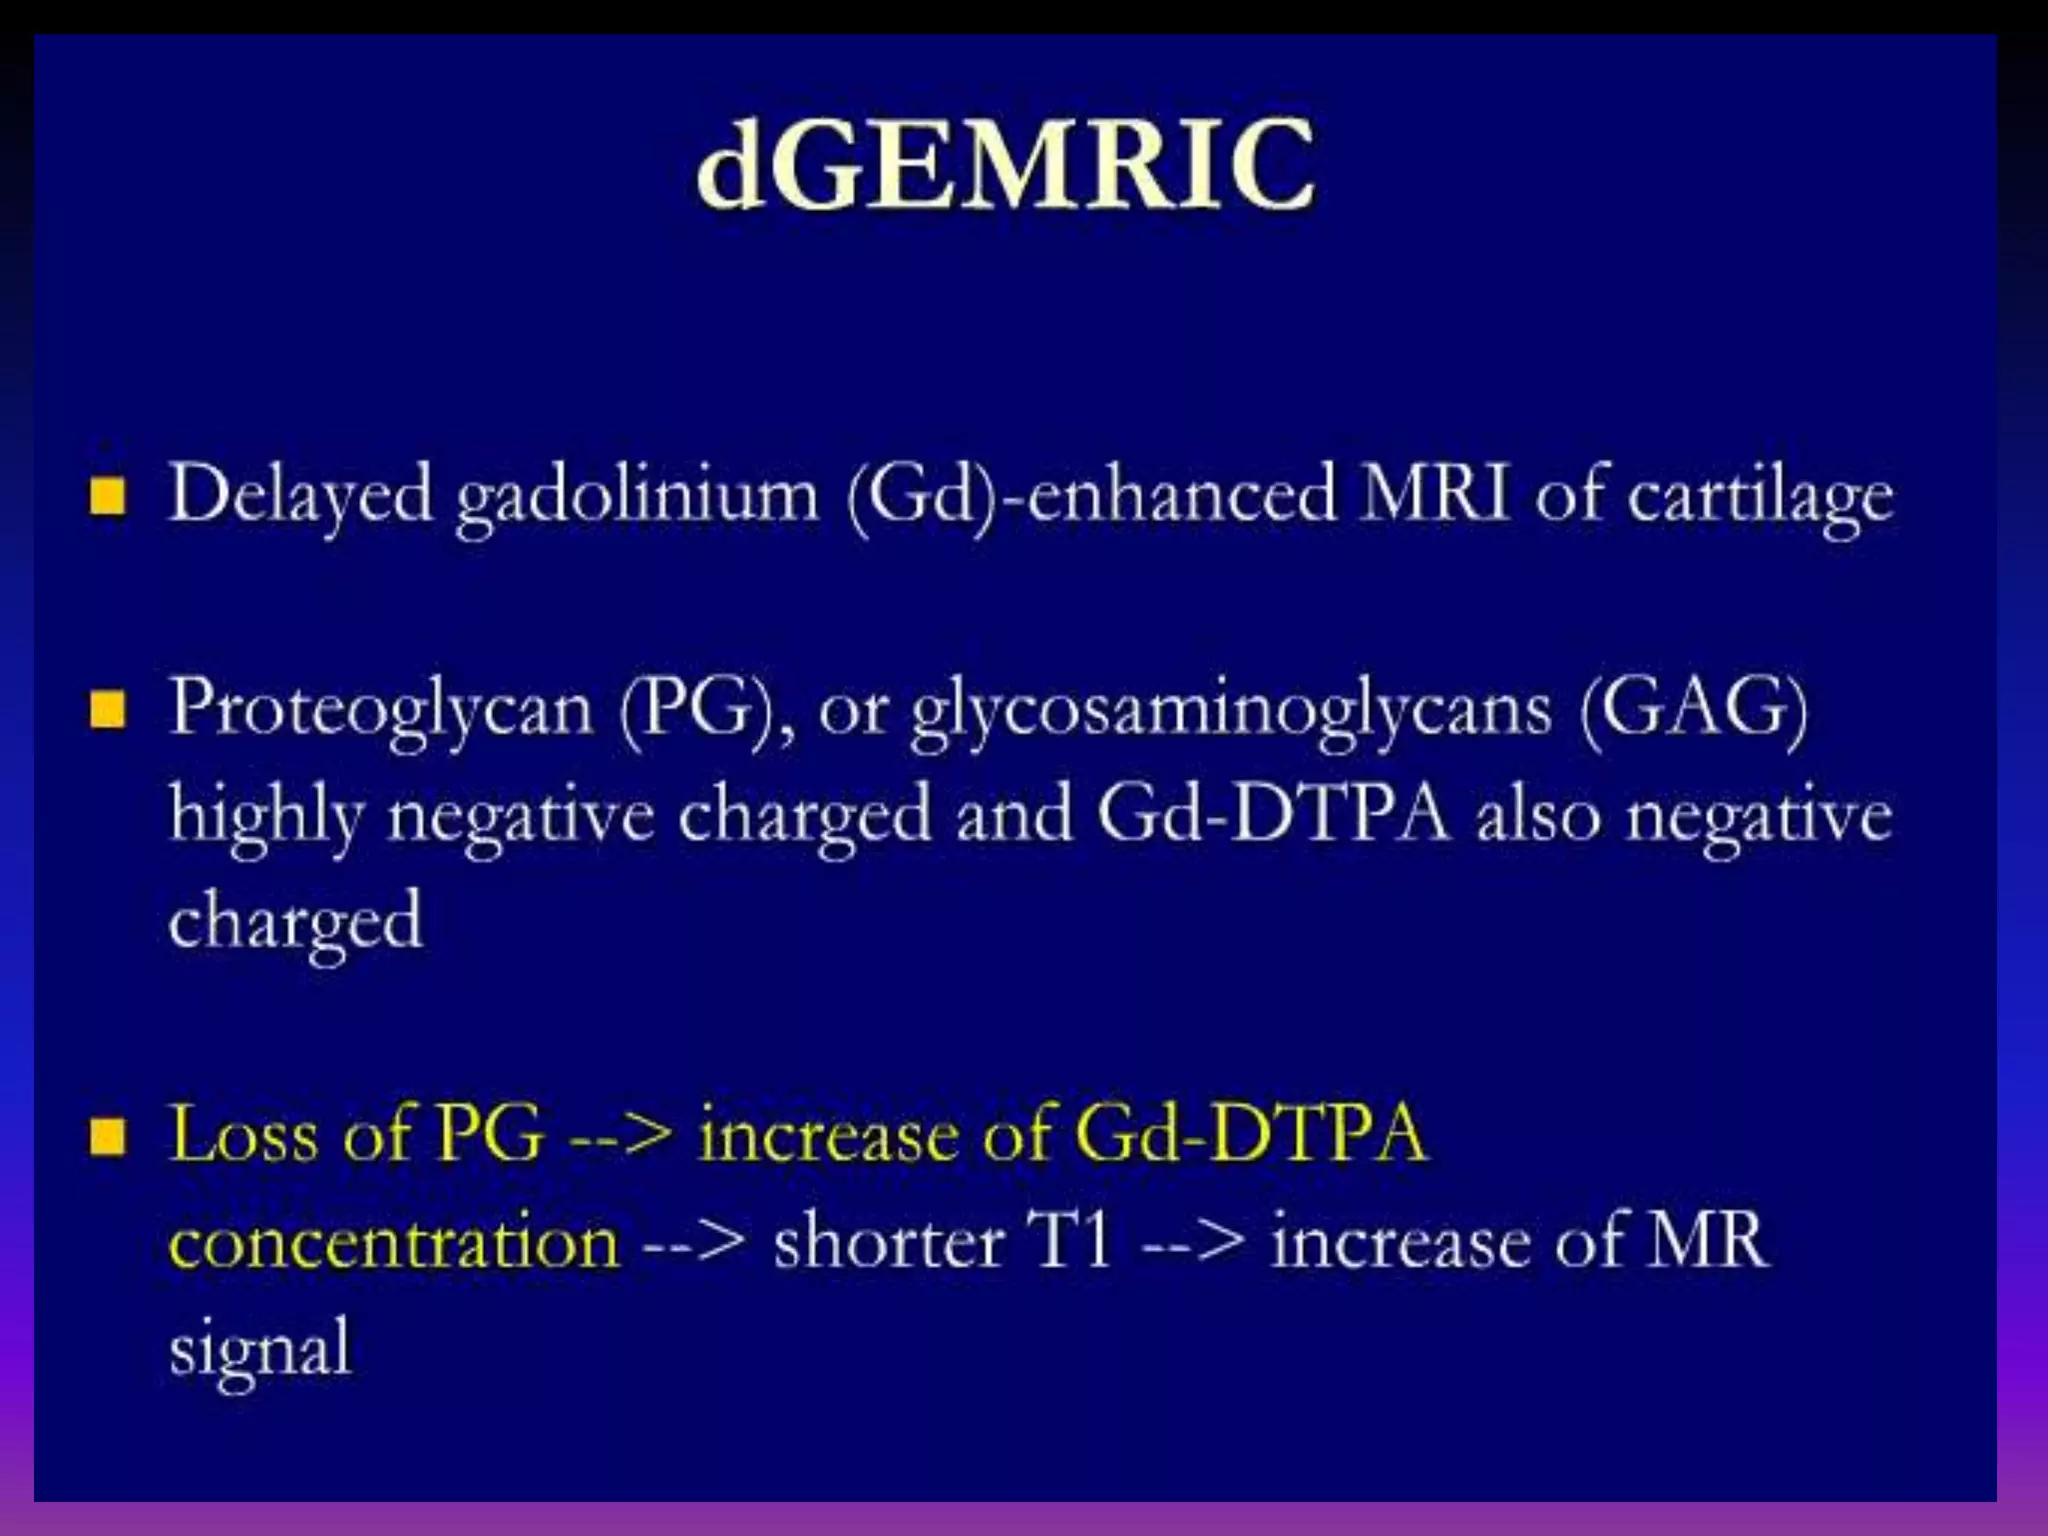
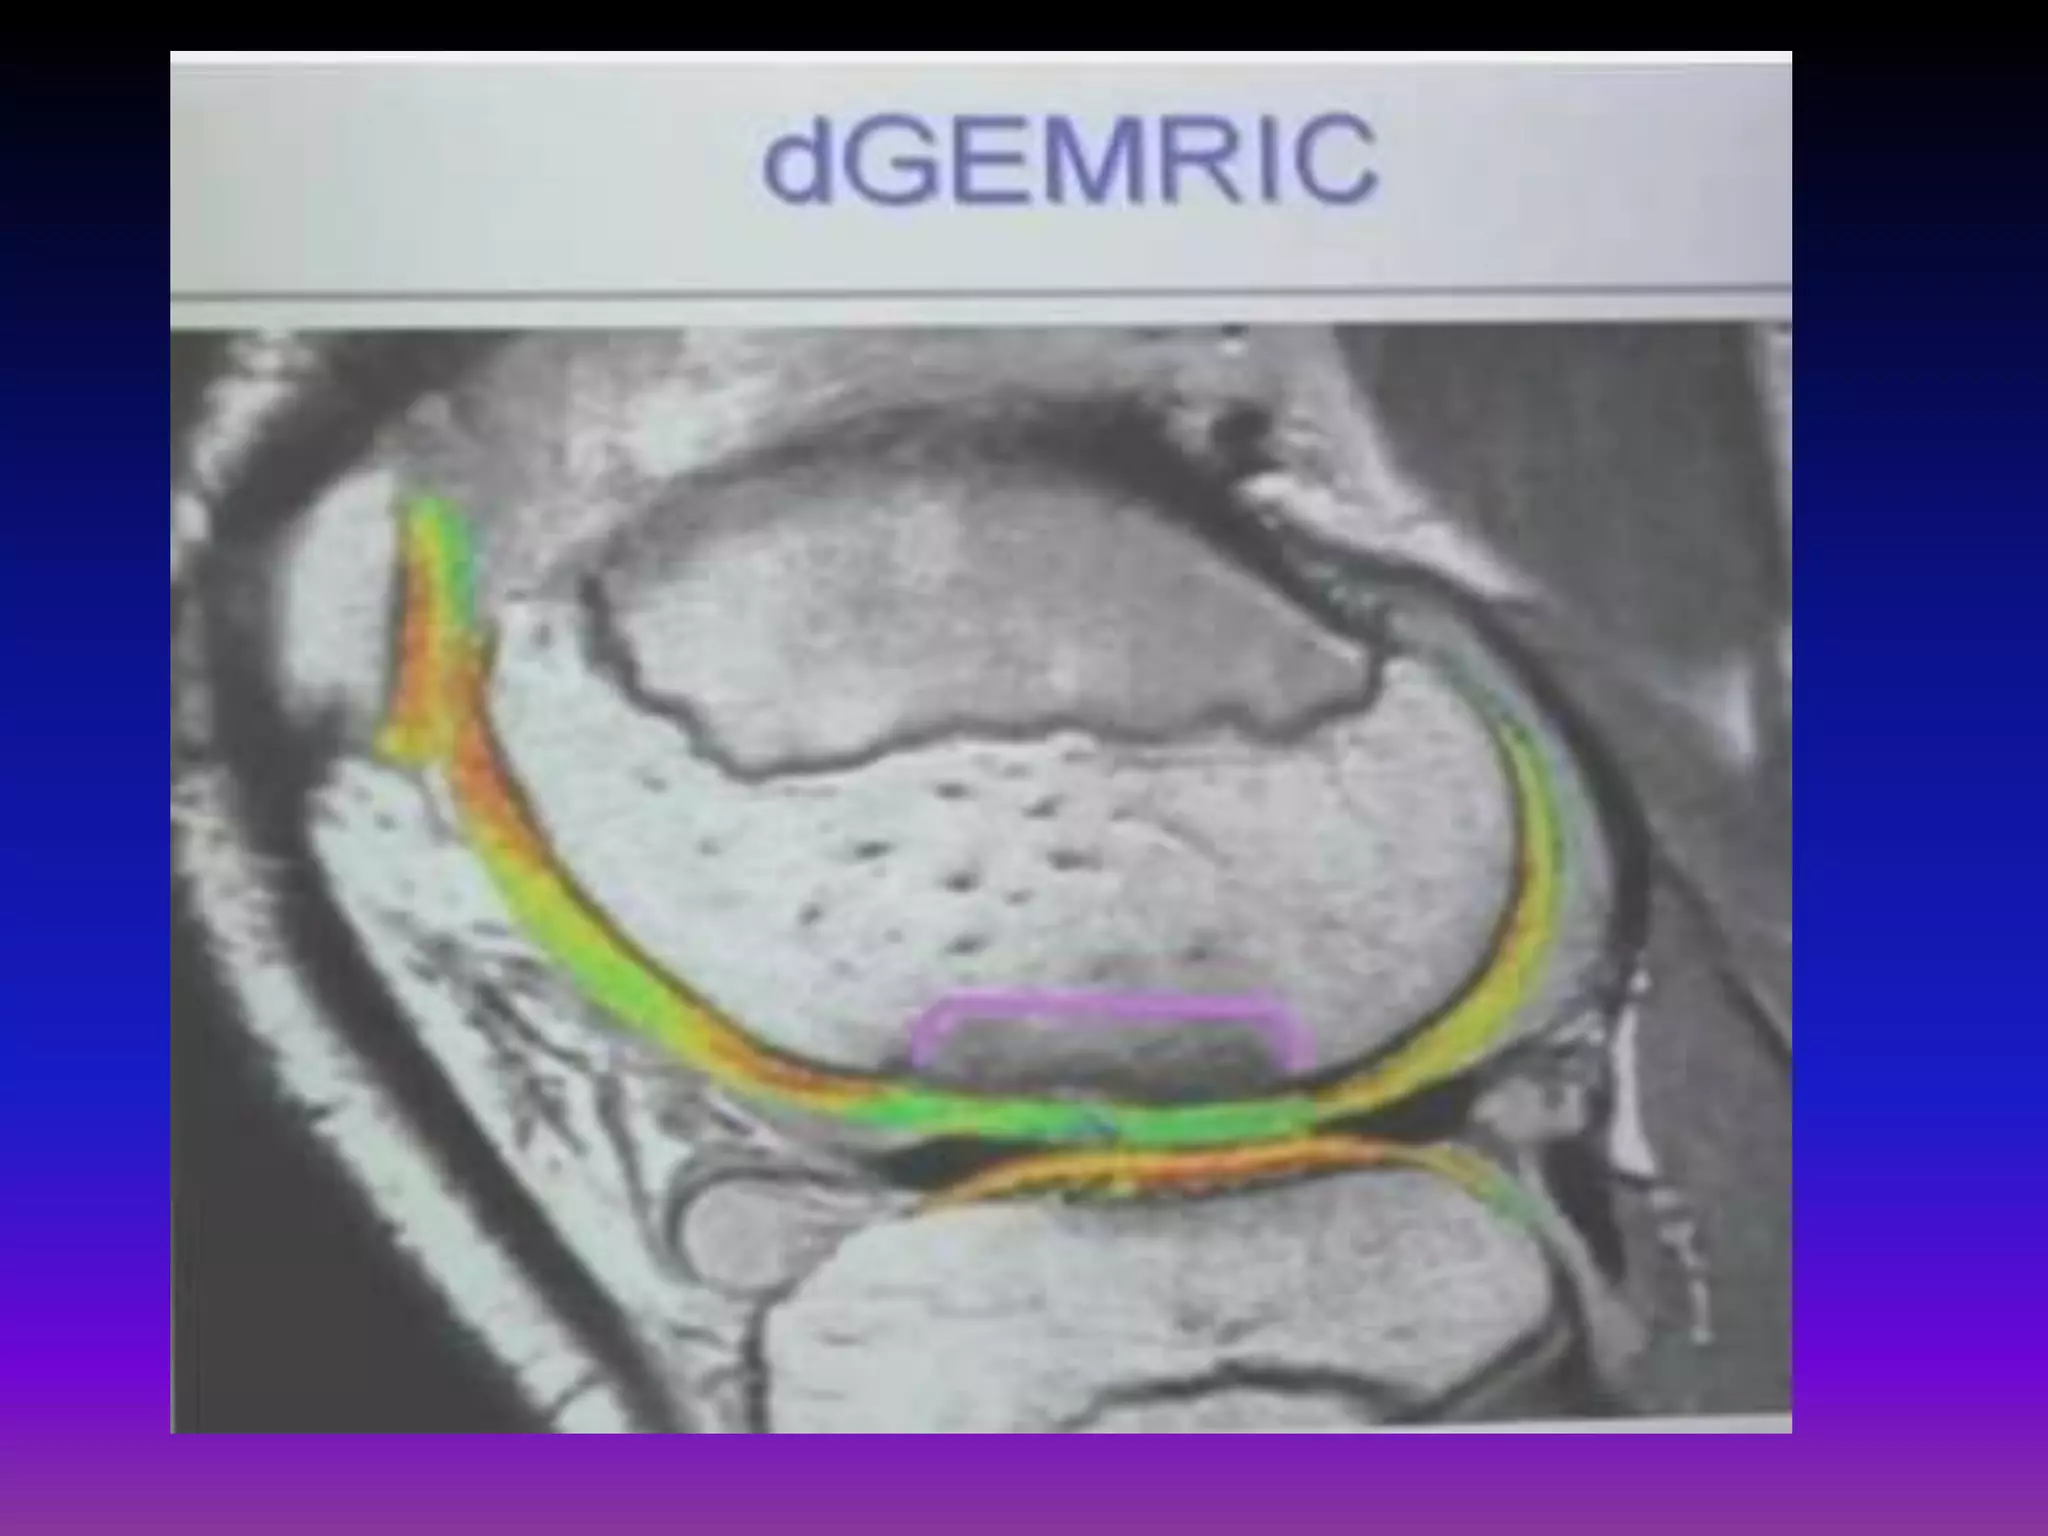
![dGEMRIC
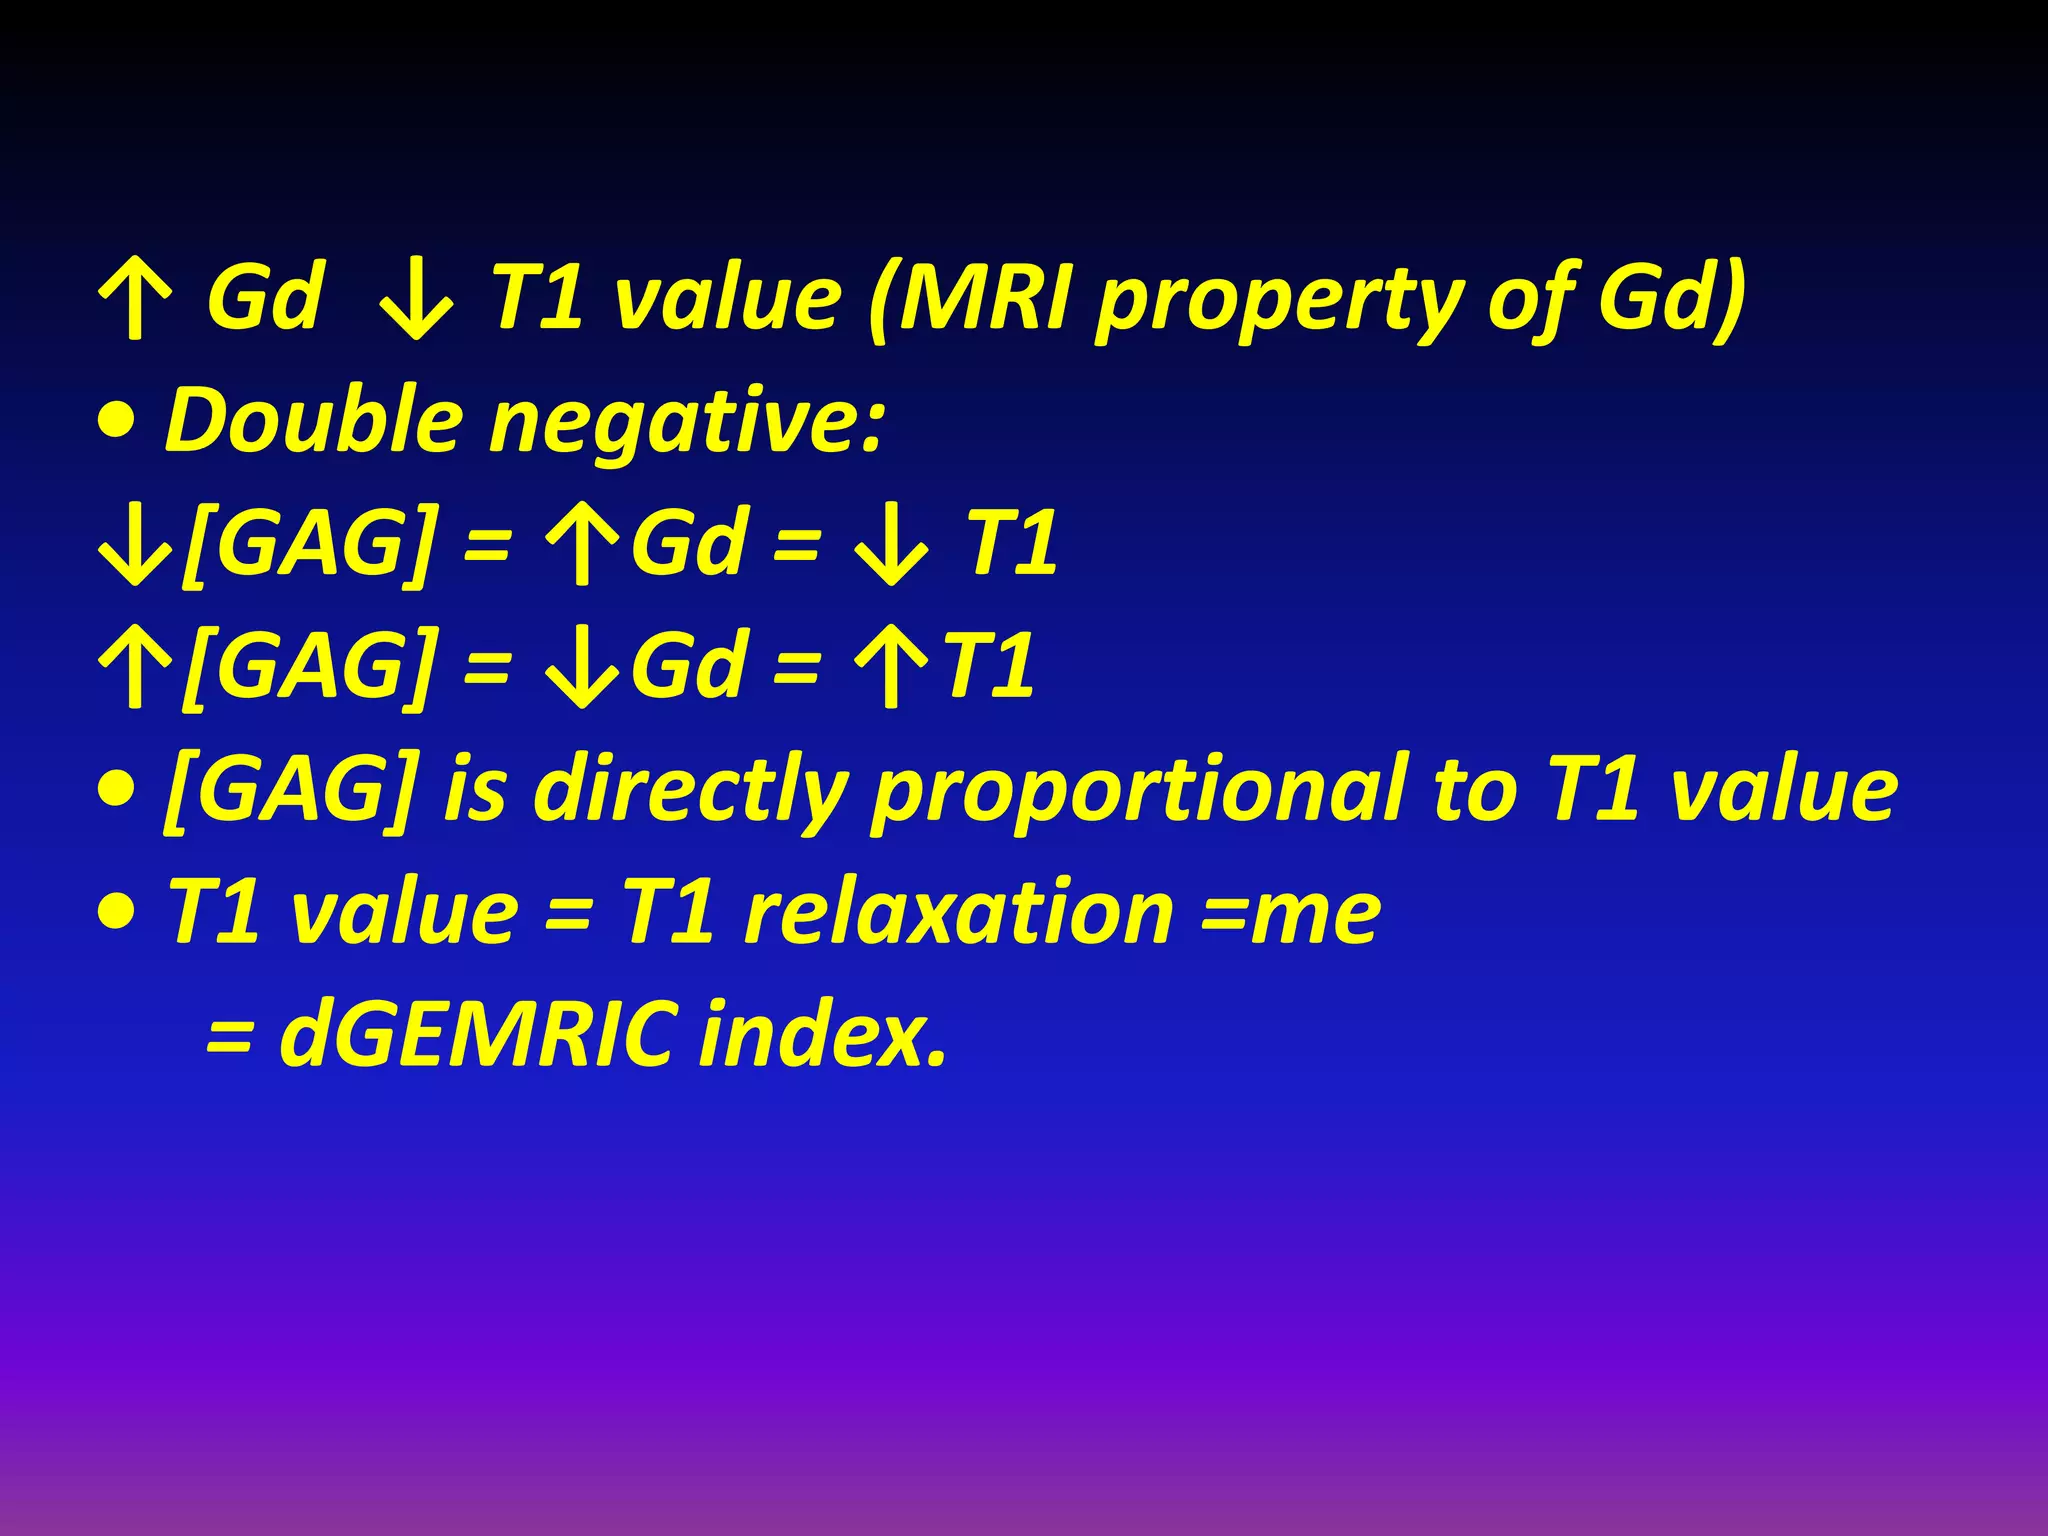
• Assesses early cartilage damage as GAG loss
prior to development of macroscopic cartilage
Defects.
• Negatively charged MRI contrast (Gadolinium;
Gd), (IV or intra‐articular) is repelled by
negatively charged GAG.
Less GAG in cartilage less negative charge
relative to normal cartilage. The more the
negatively charged contrast will penetrate
GAG deplete cartilage.
• Gd penetrates normal cartilage, high [GAG], in
a reciprocal manner.](https://image.slidesharecdn.com/presentation1-140411170030-phpapp01/75/Presentation1-pptx-imaging-of-the-cartilage-29-2048.jpg)
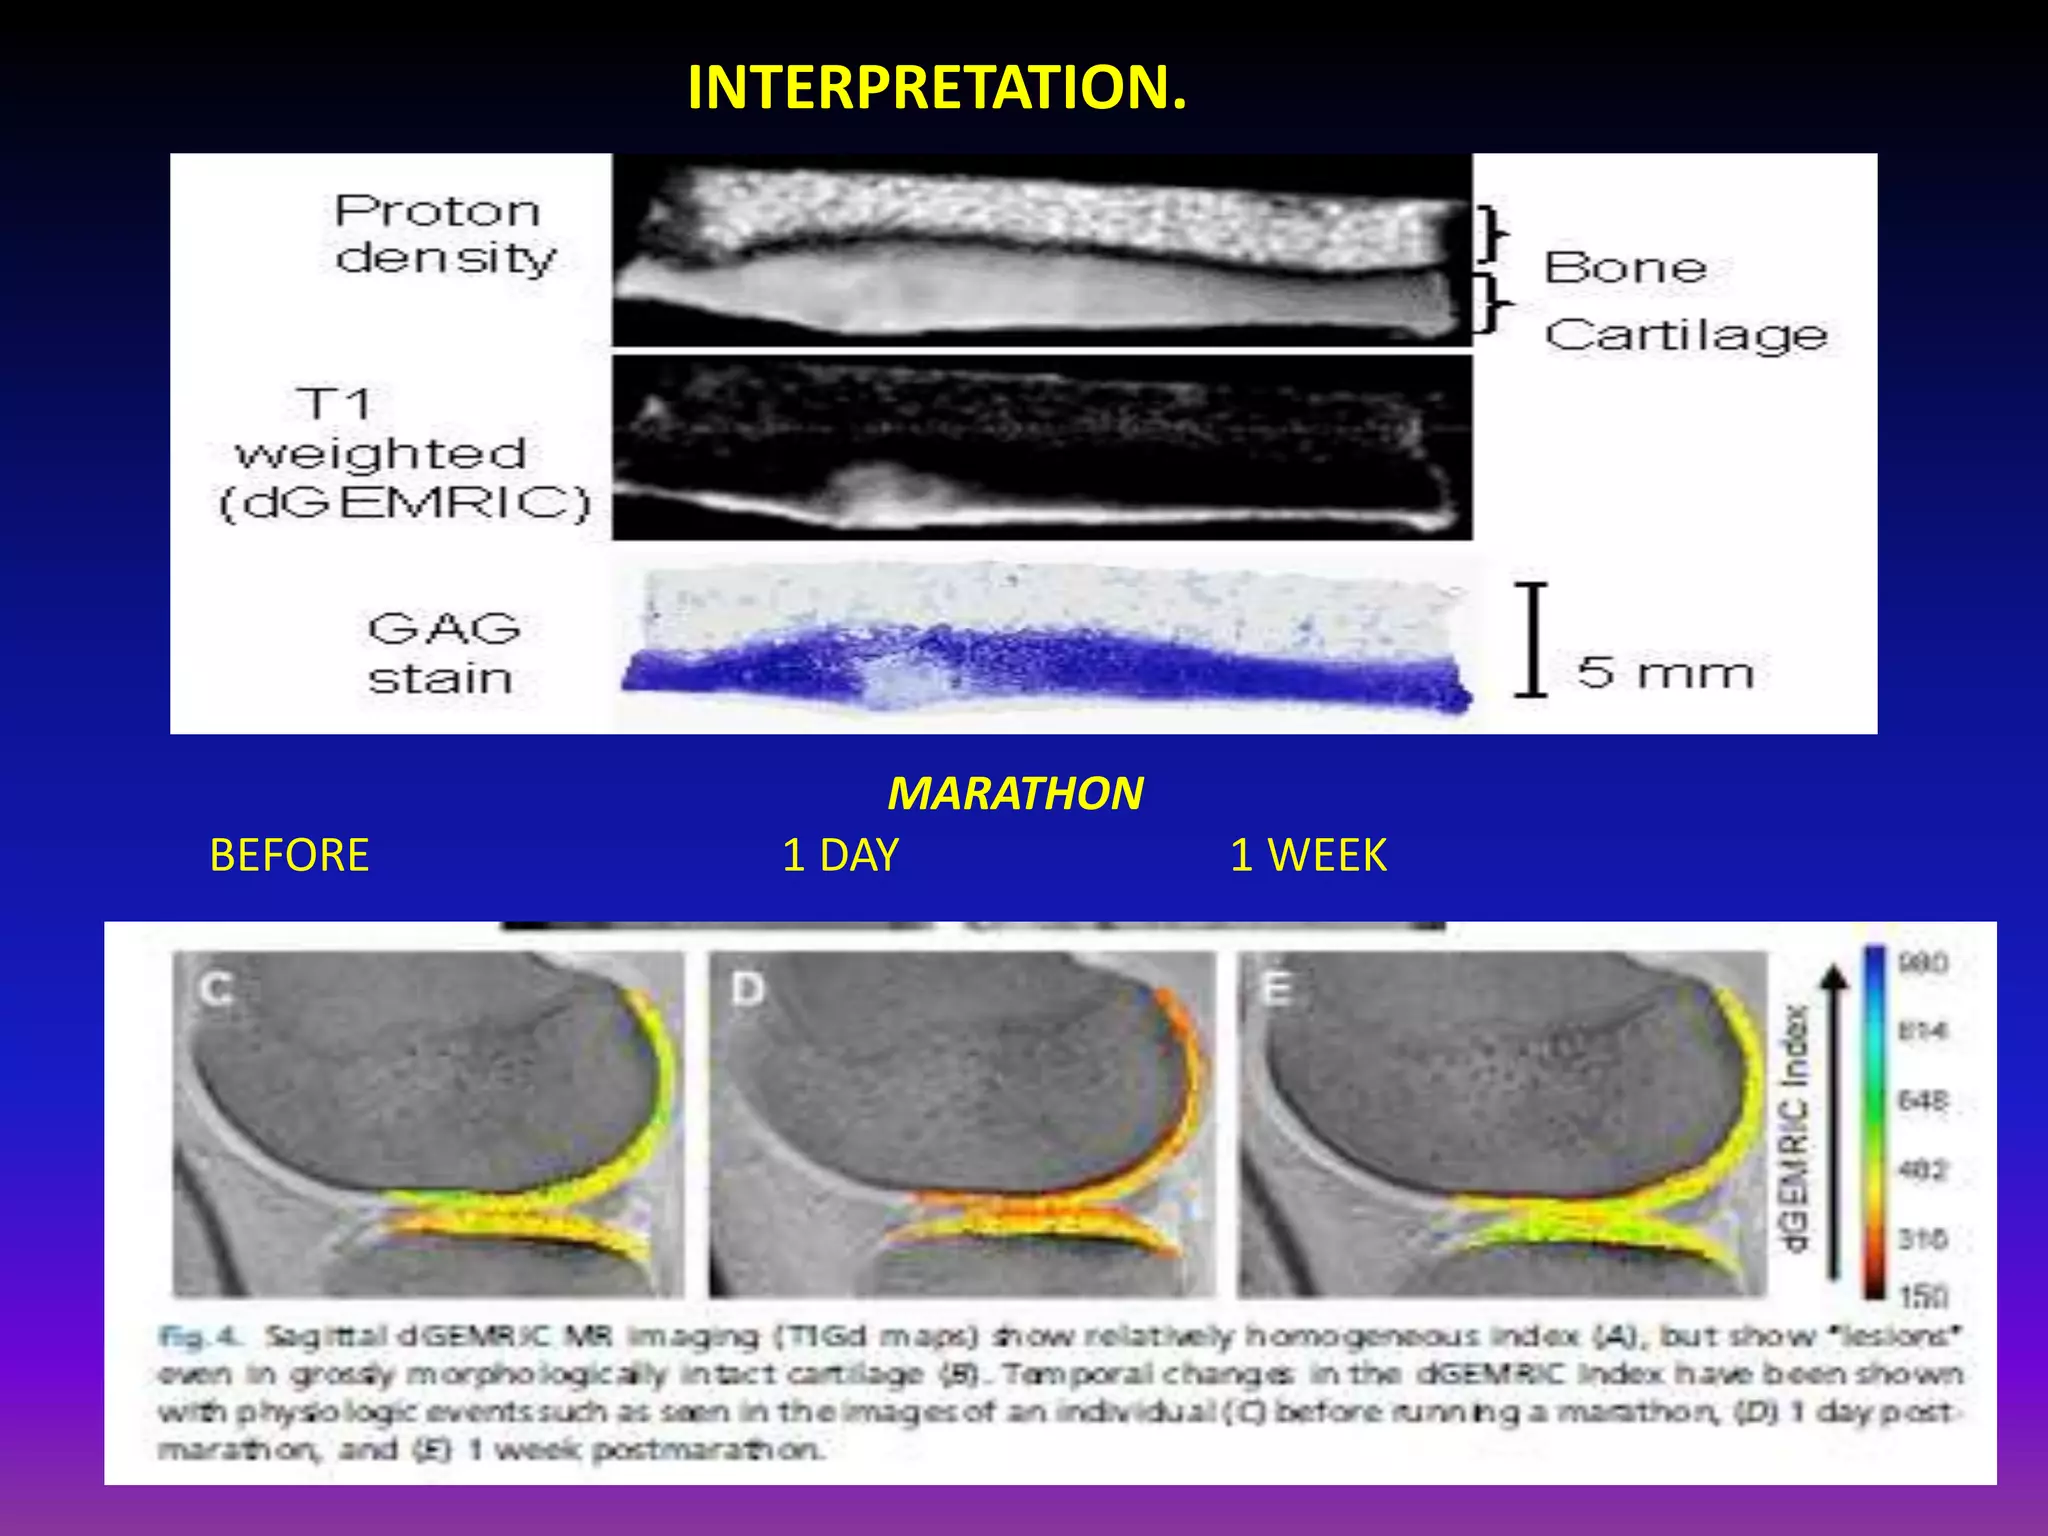
![VALIDATION.
• Reproducible.
• Excellent in vitro
Correlation.
• Higher dGEMRIC index
(less Gd , higher [GAG])
= higher resistance to
mechanical compression.](https://image.slidesharecdn.com/presentation1-140411170030-phpapp01/75/Presentation1-pptx-imaging-of-the-cartilage-32-2048.jpg)
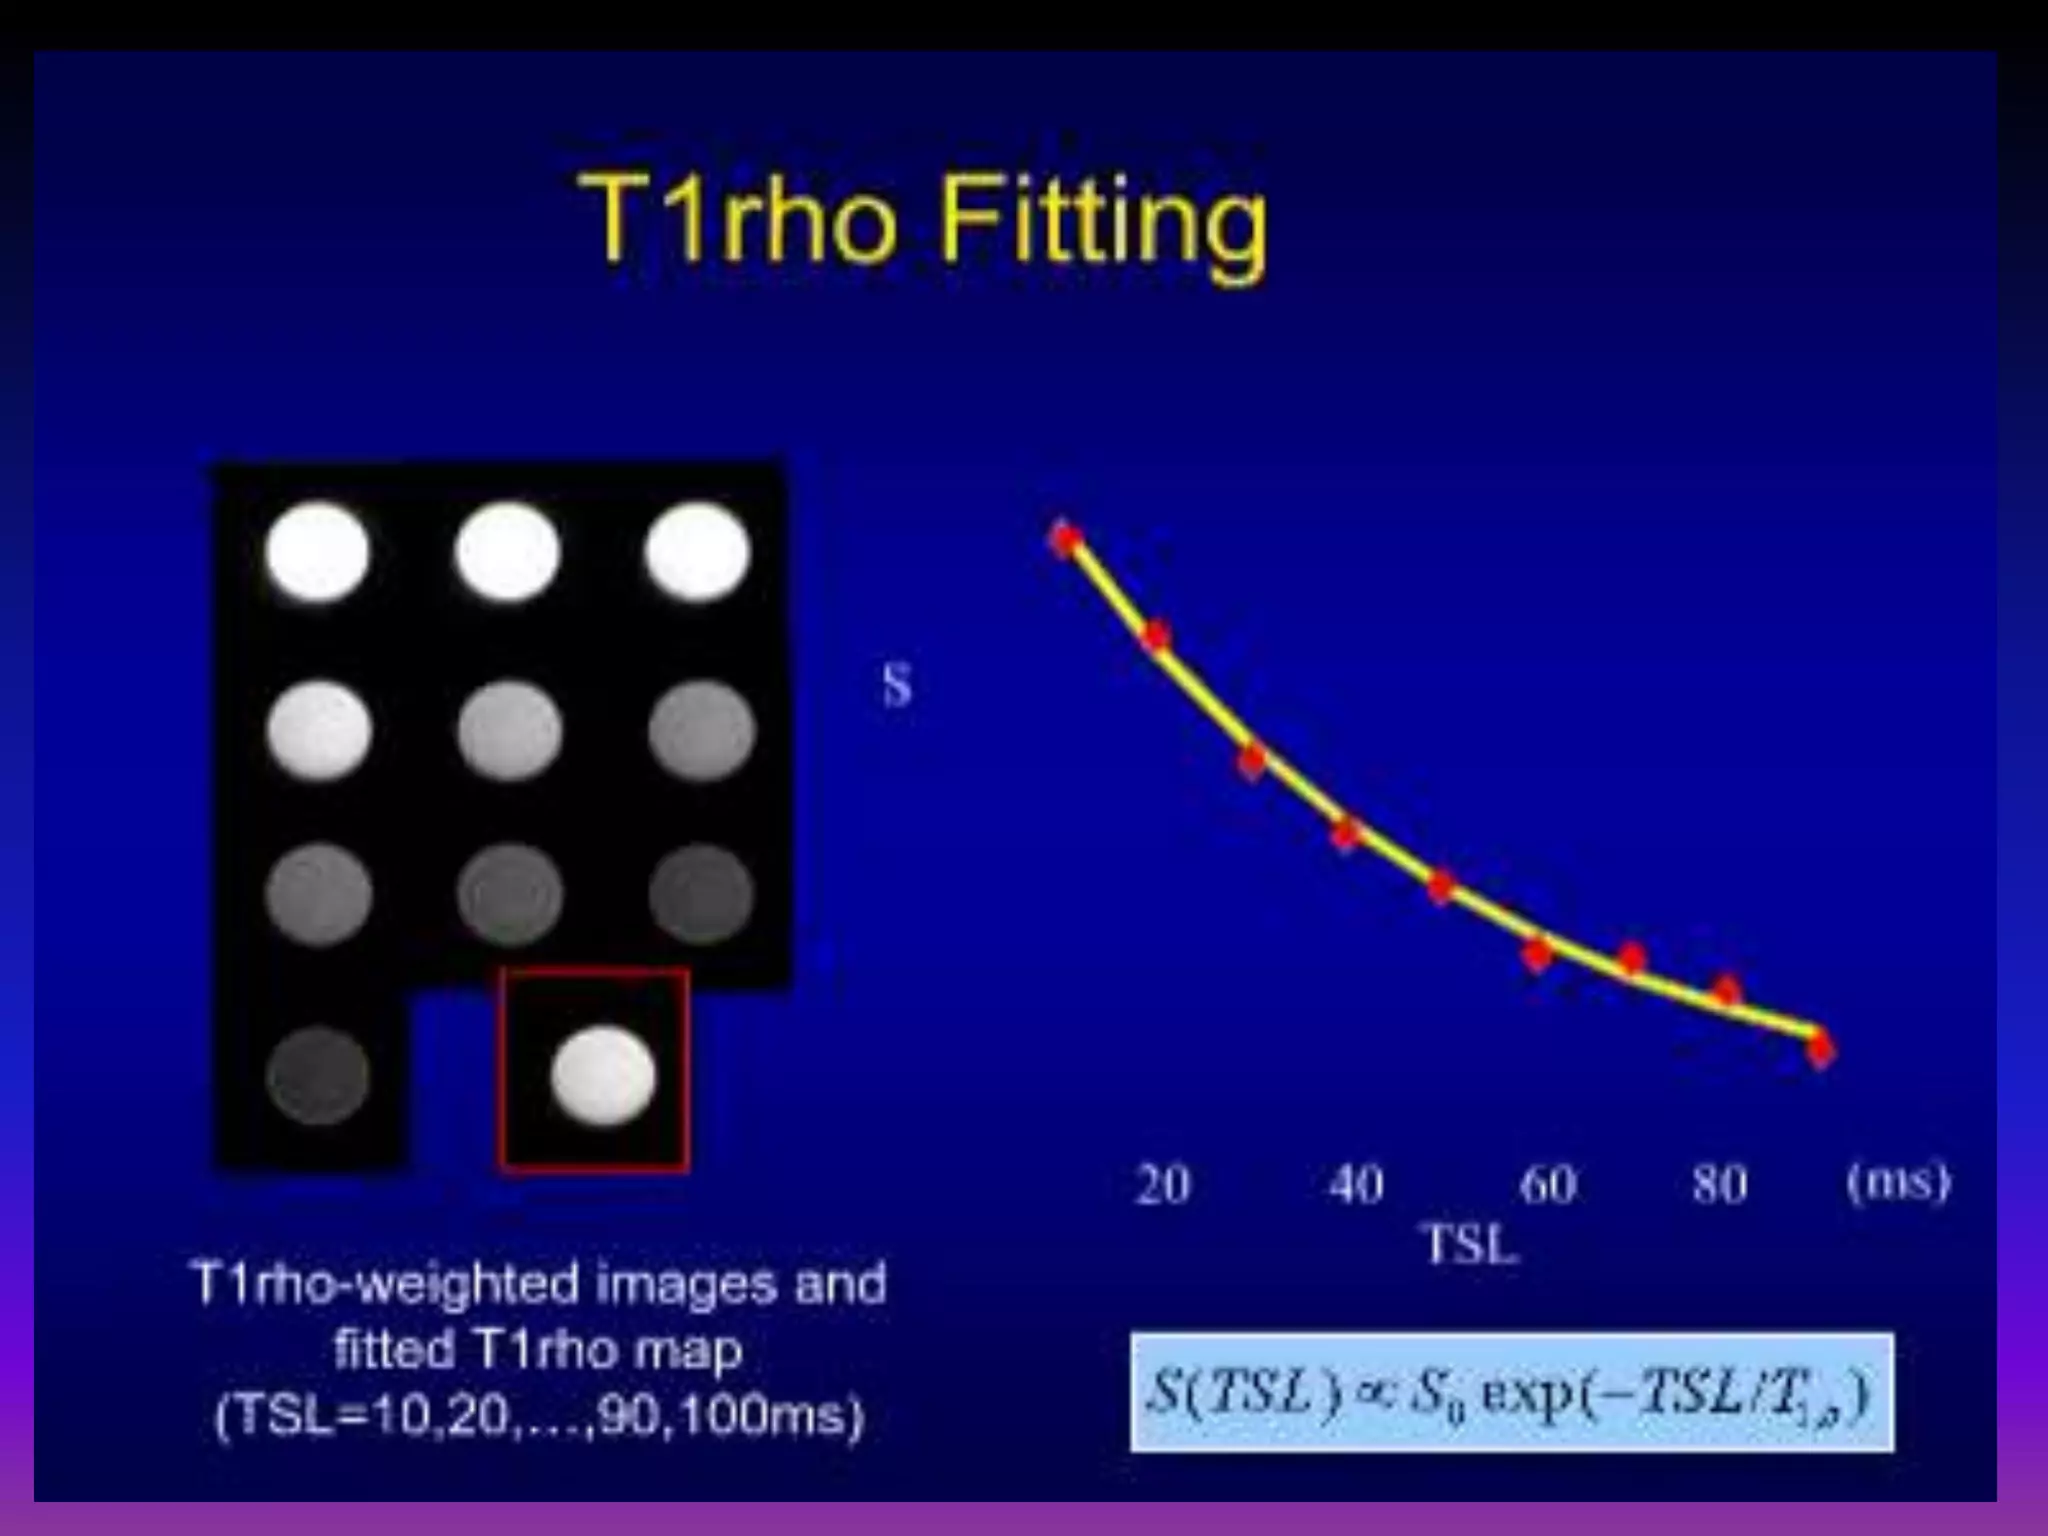
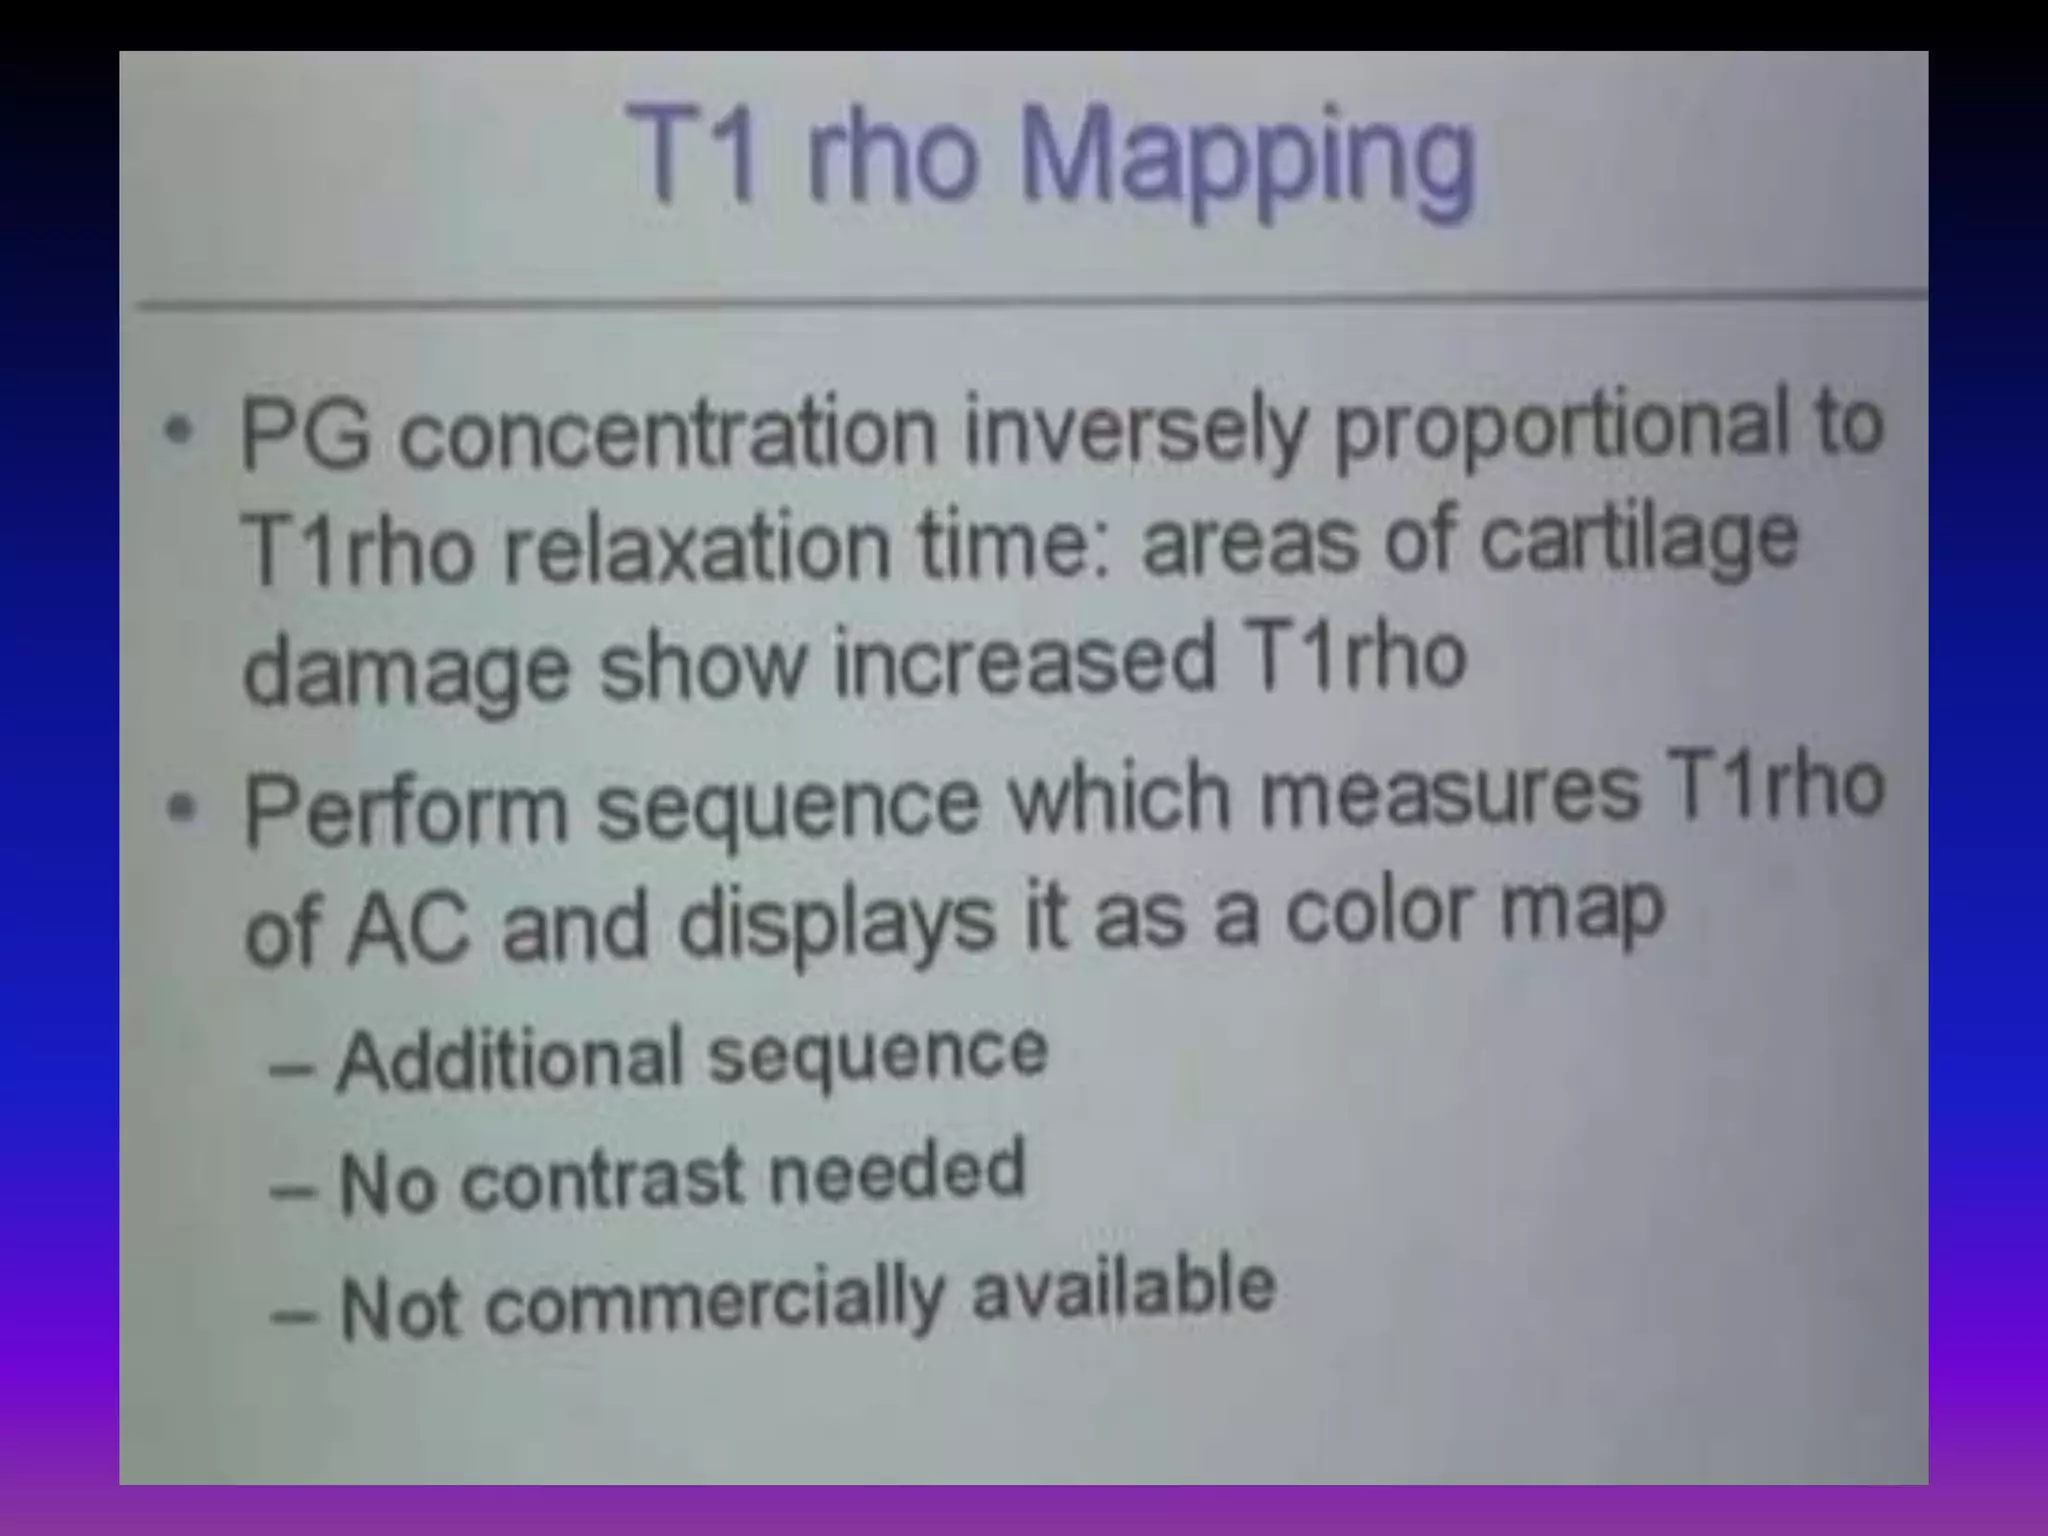
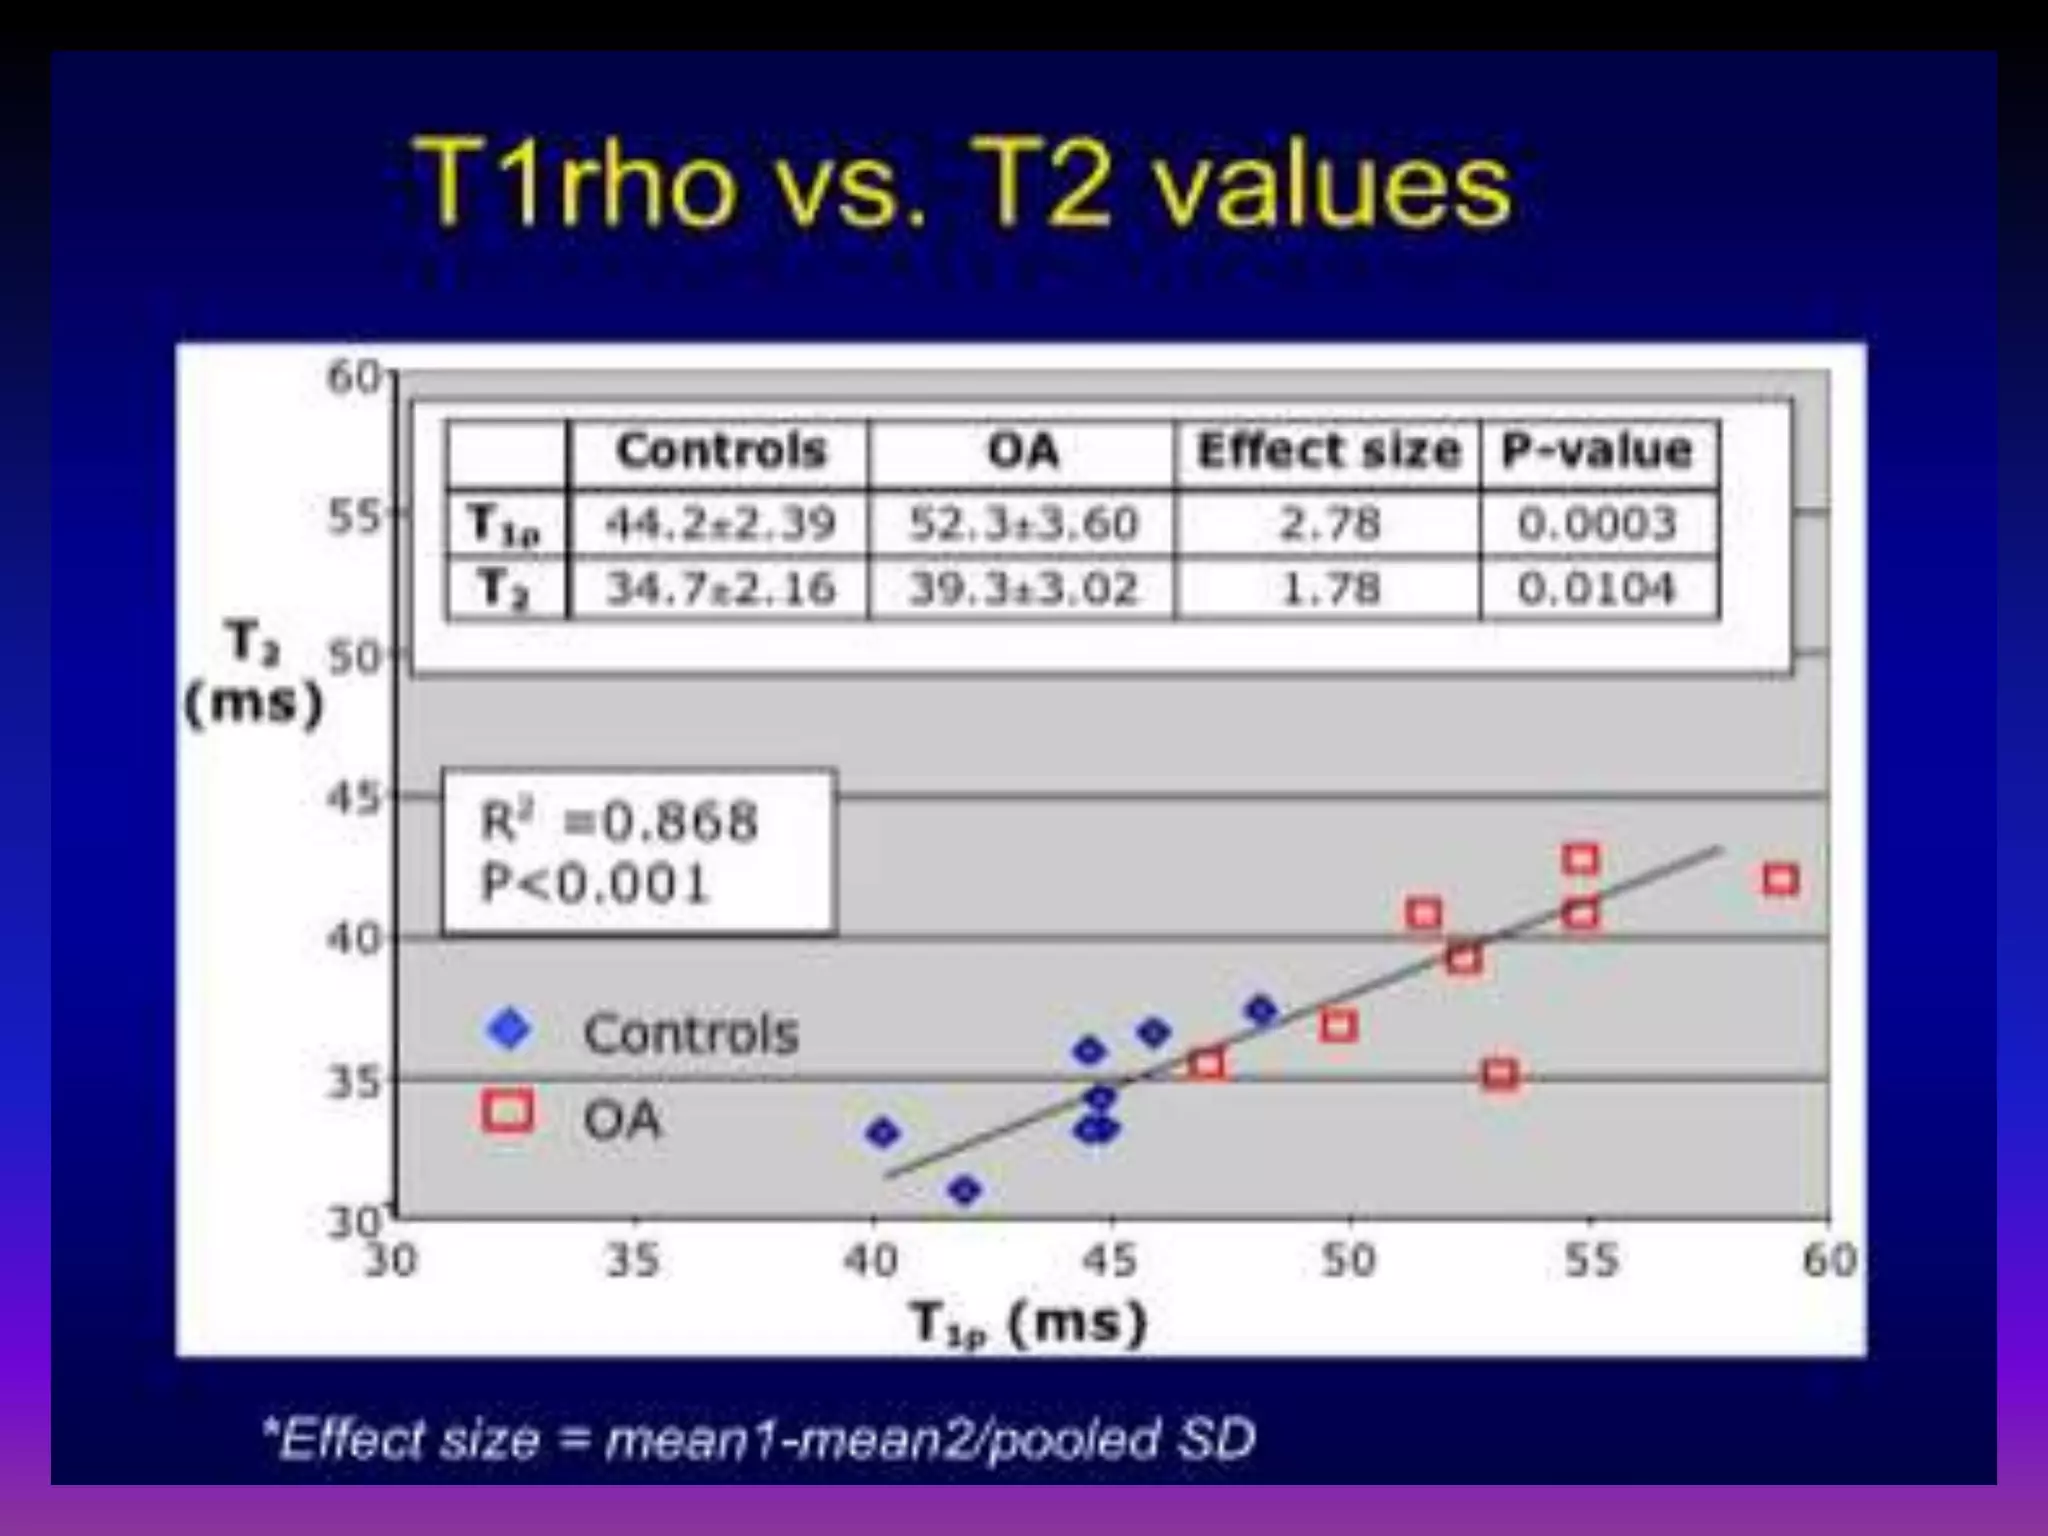
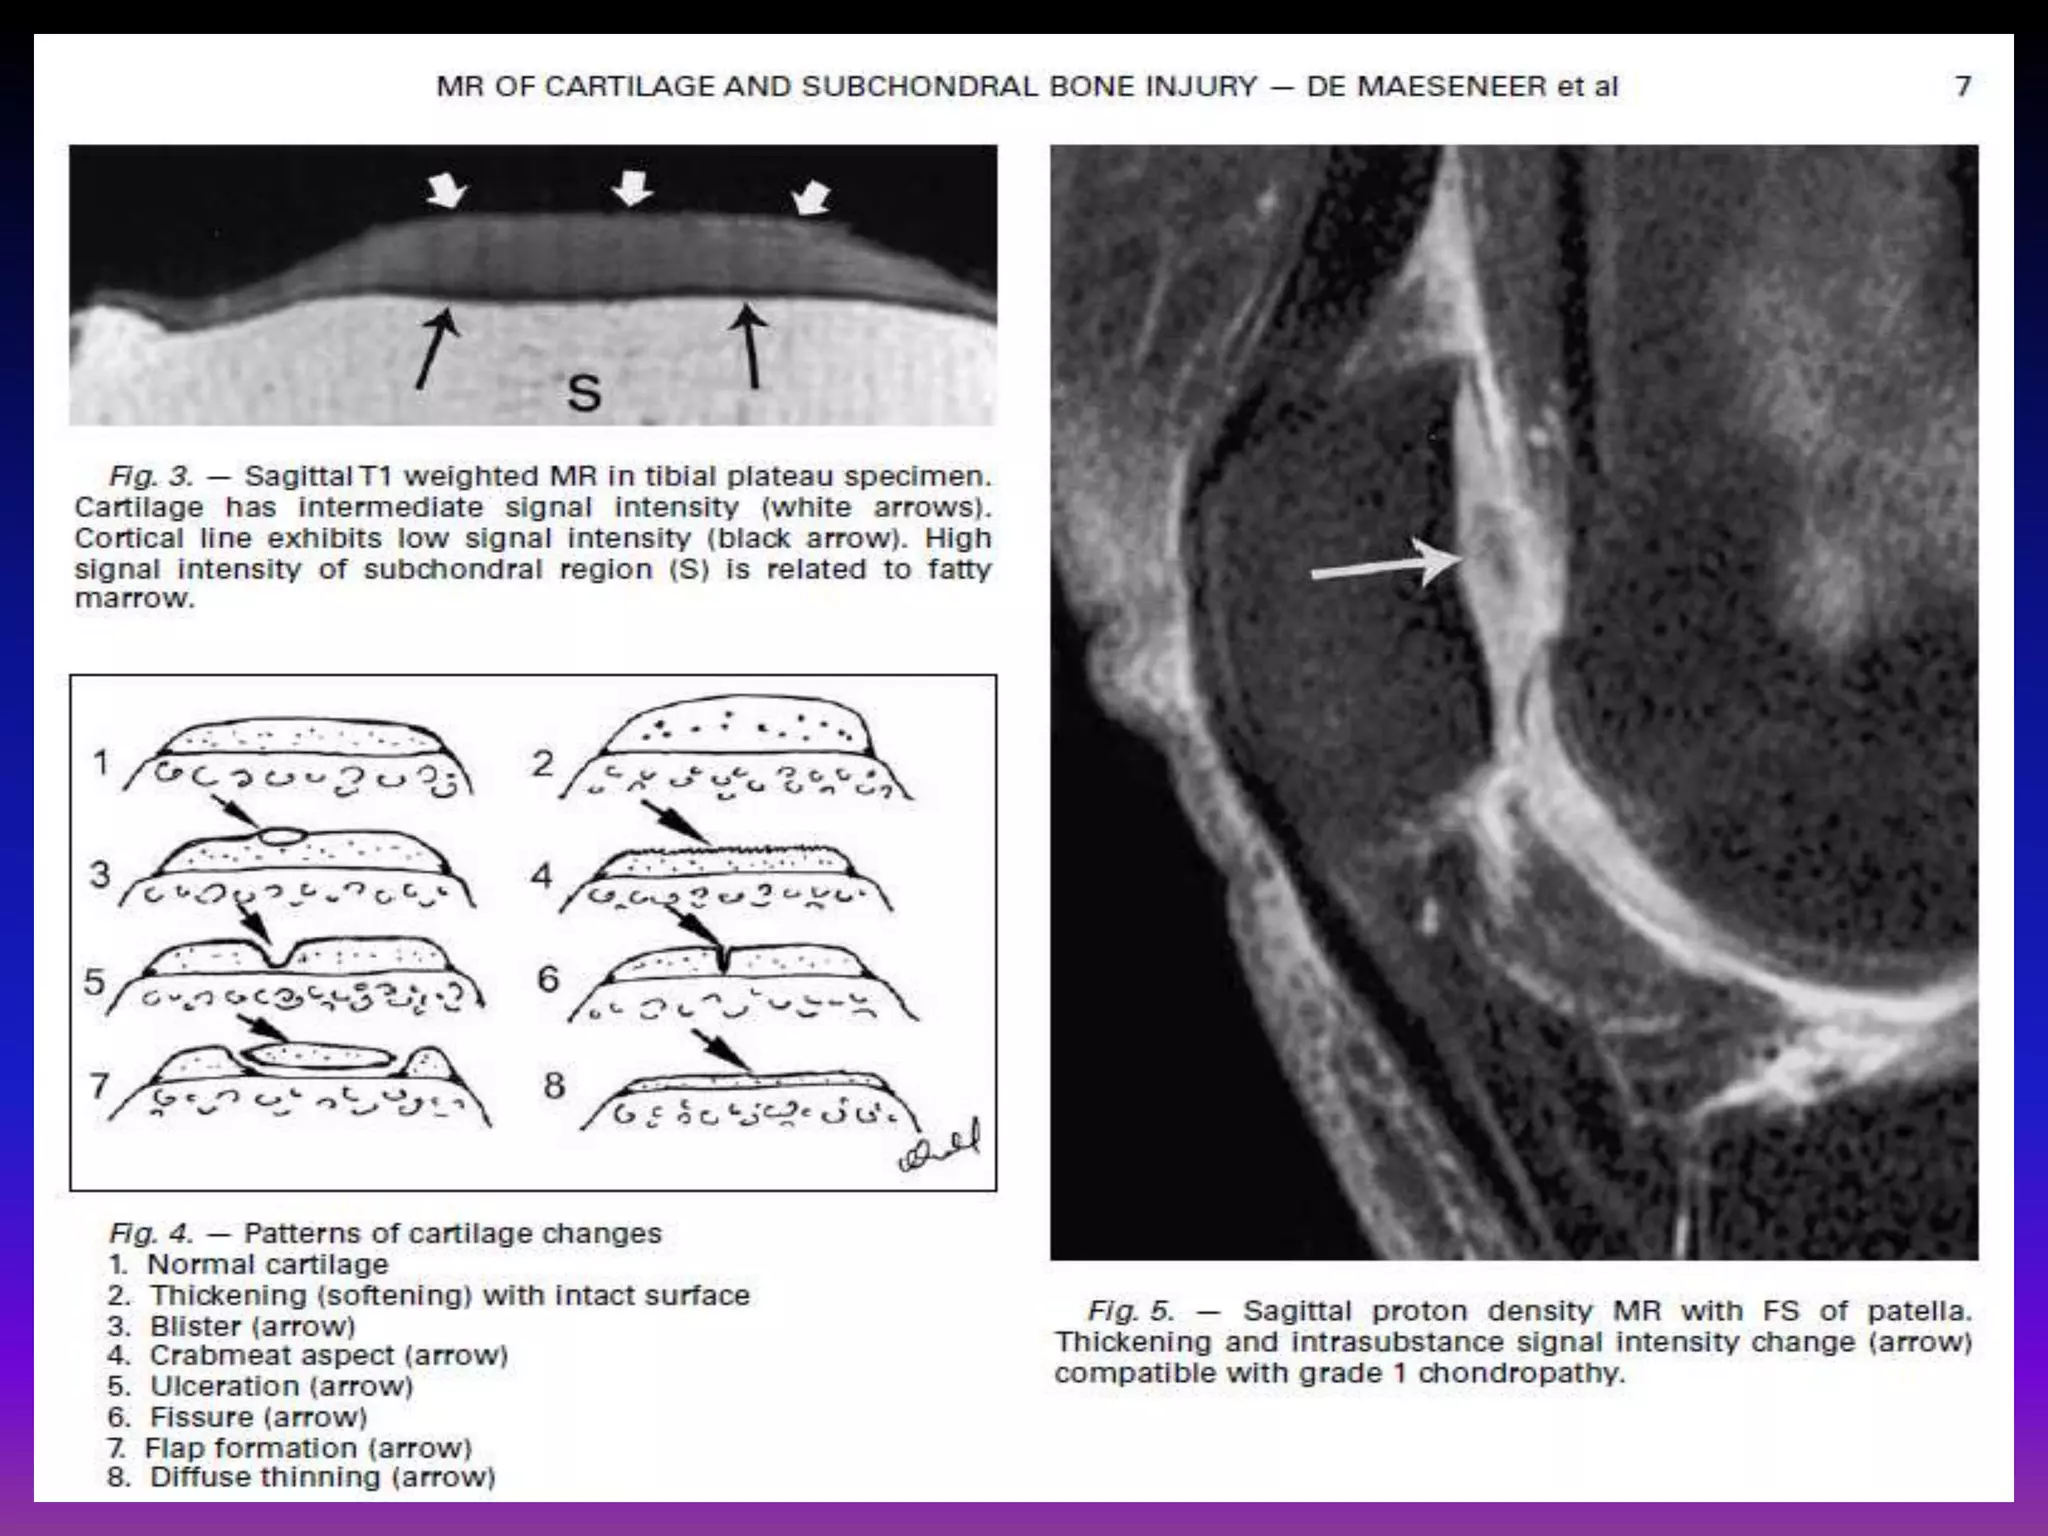
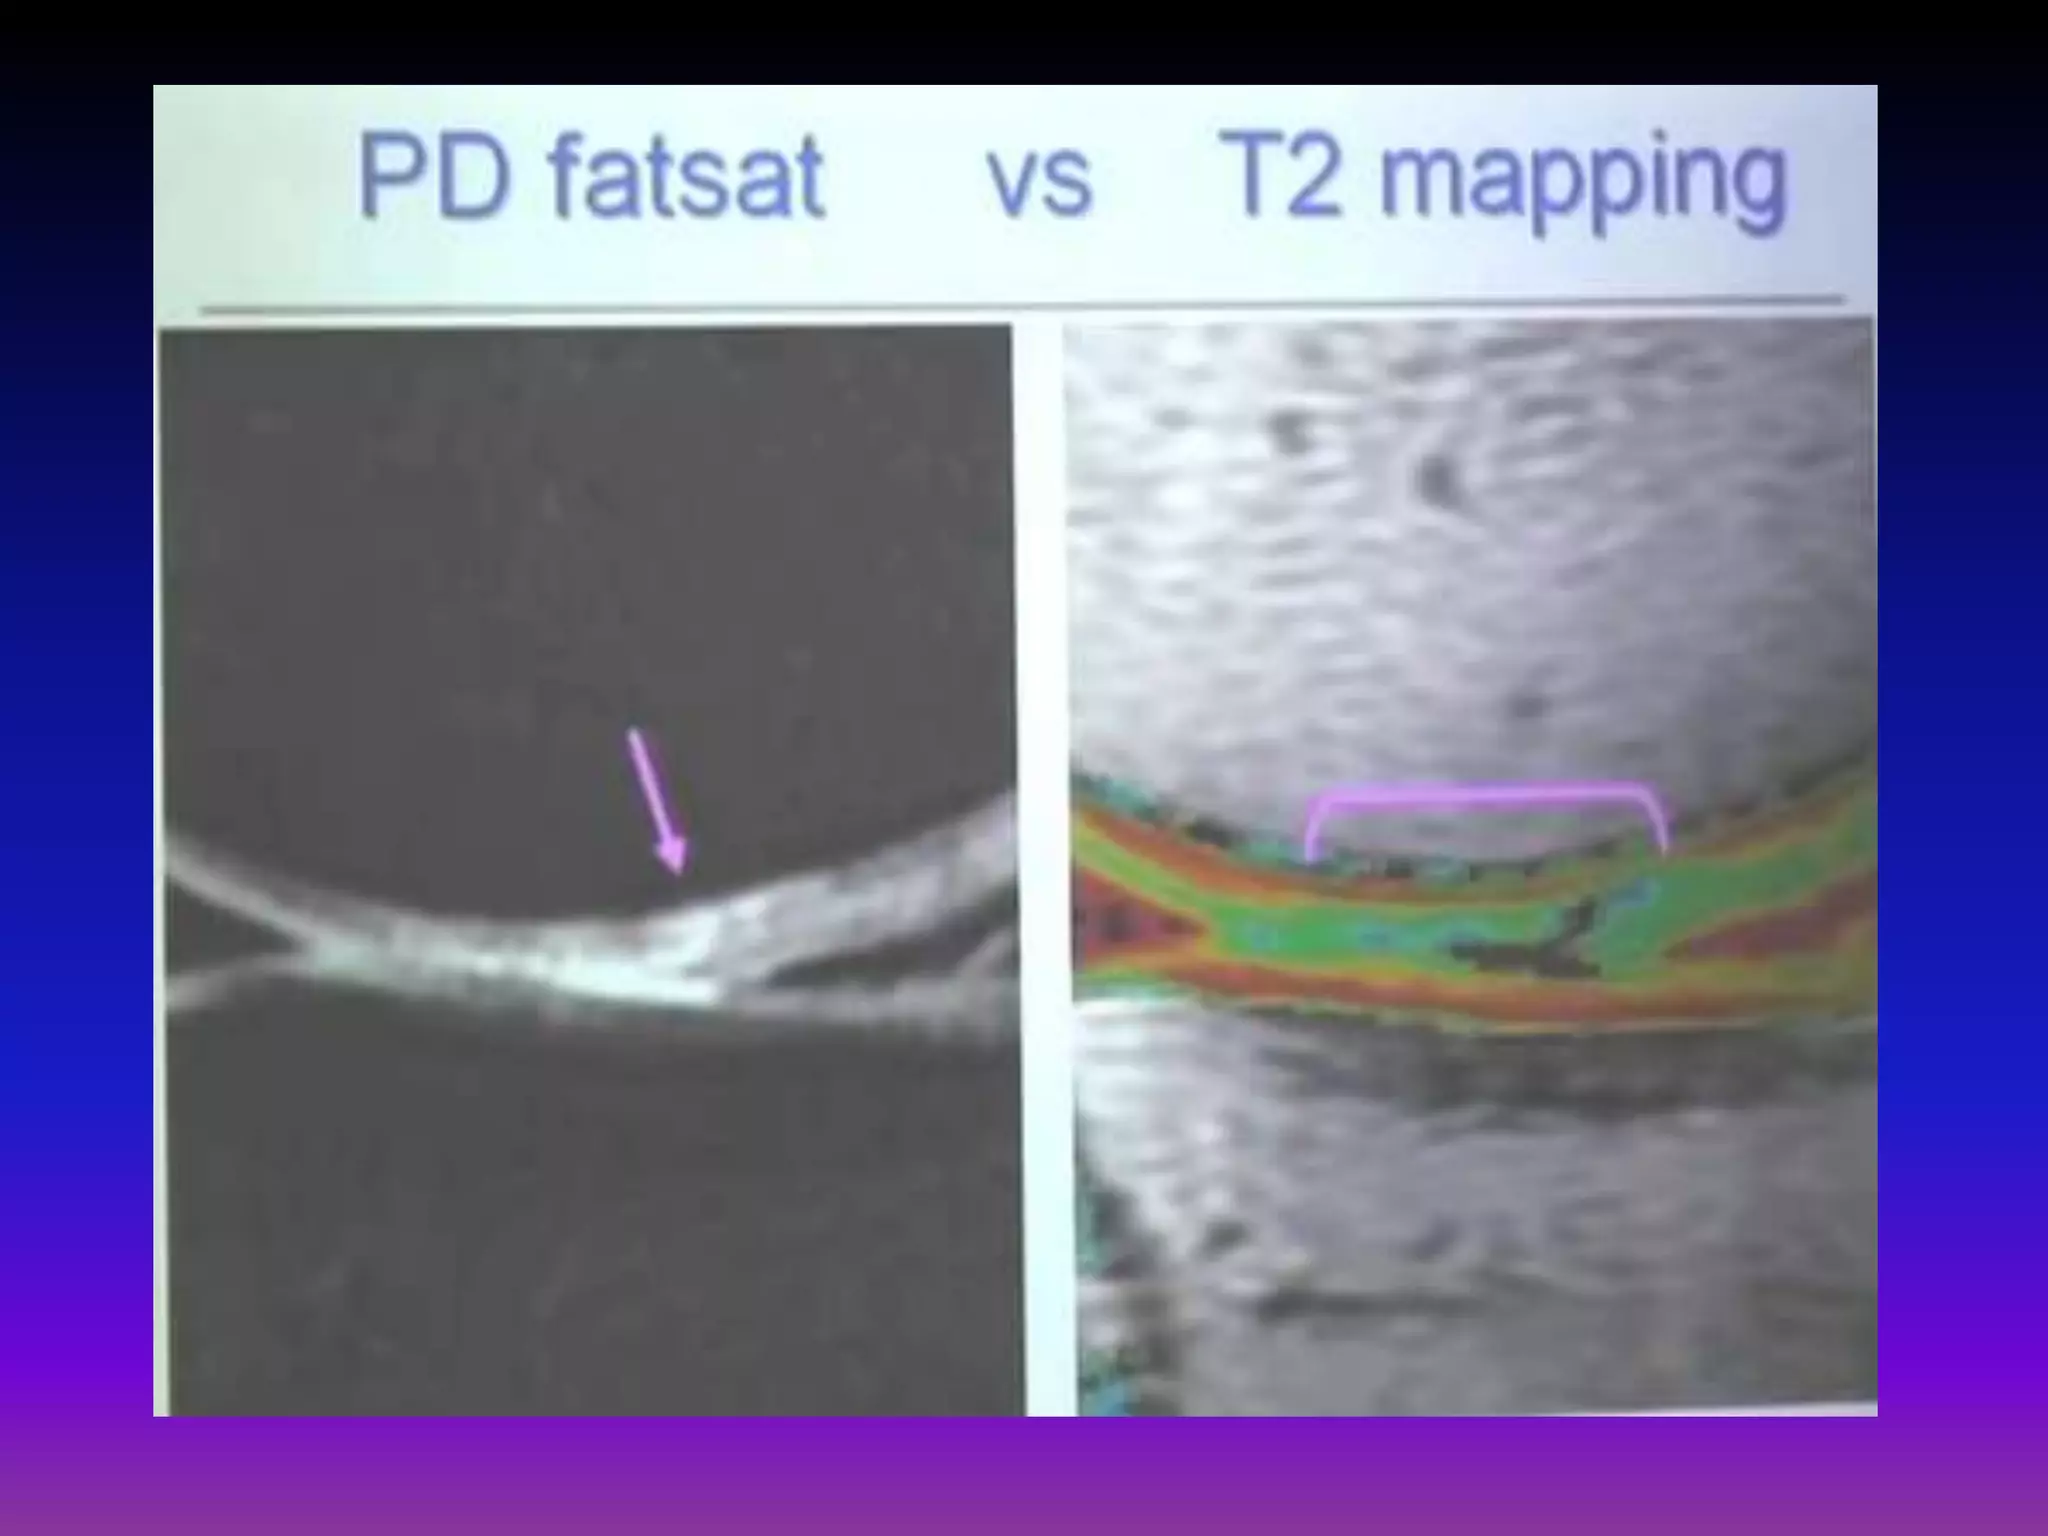
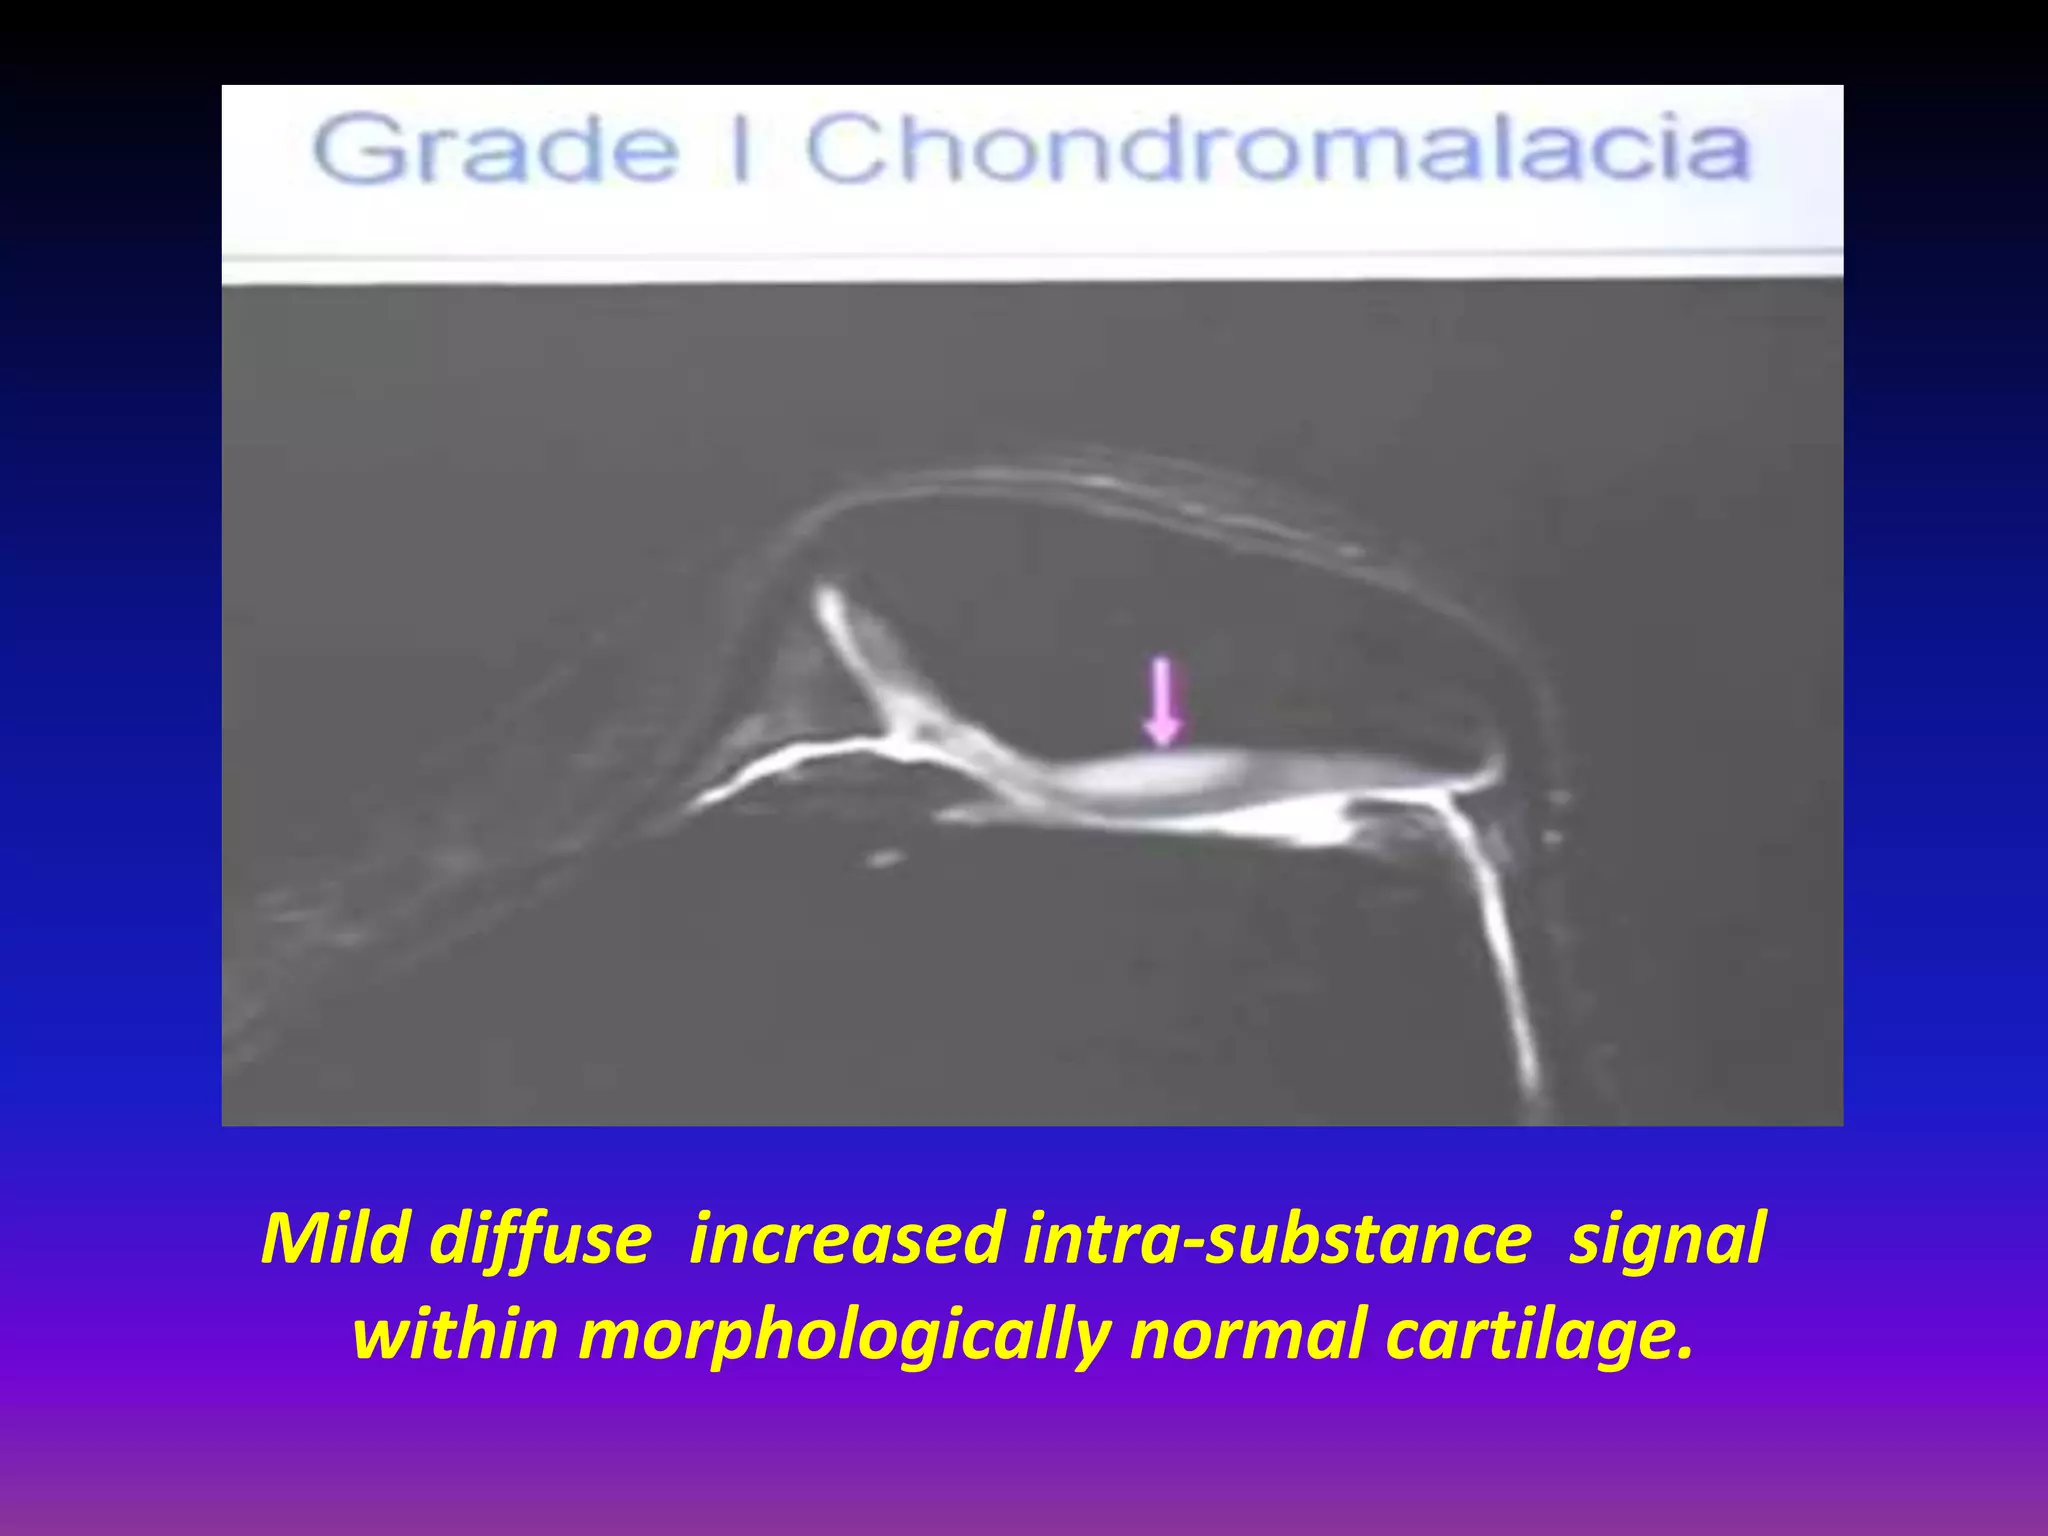
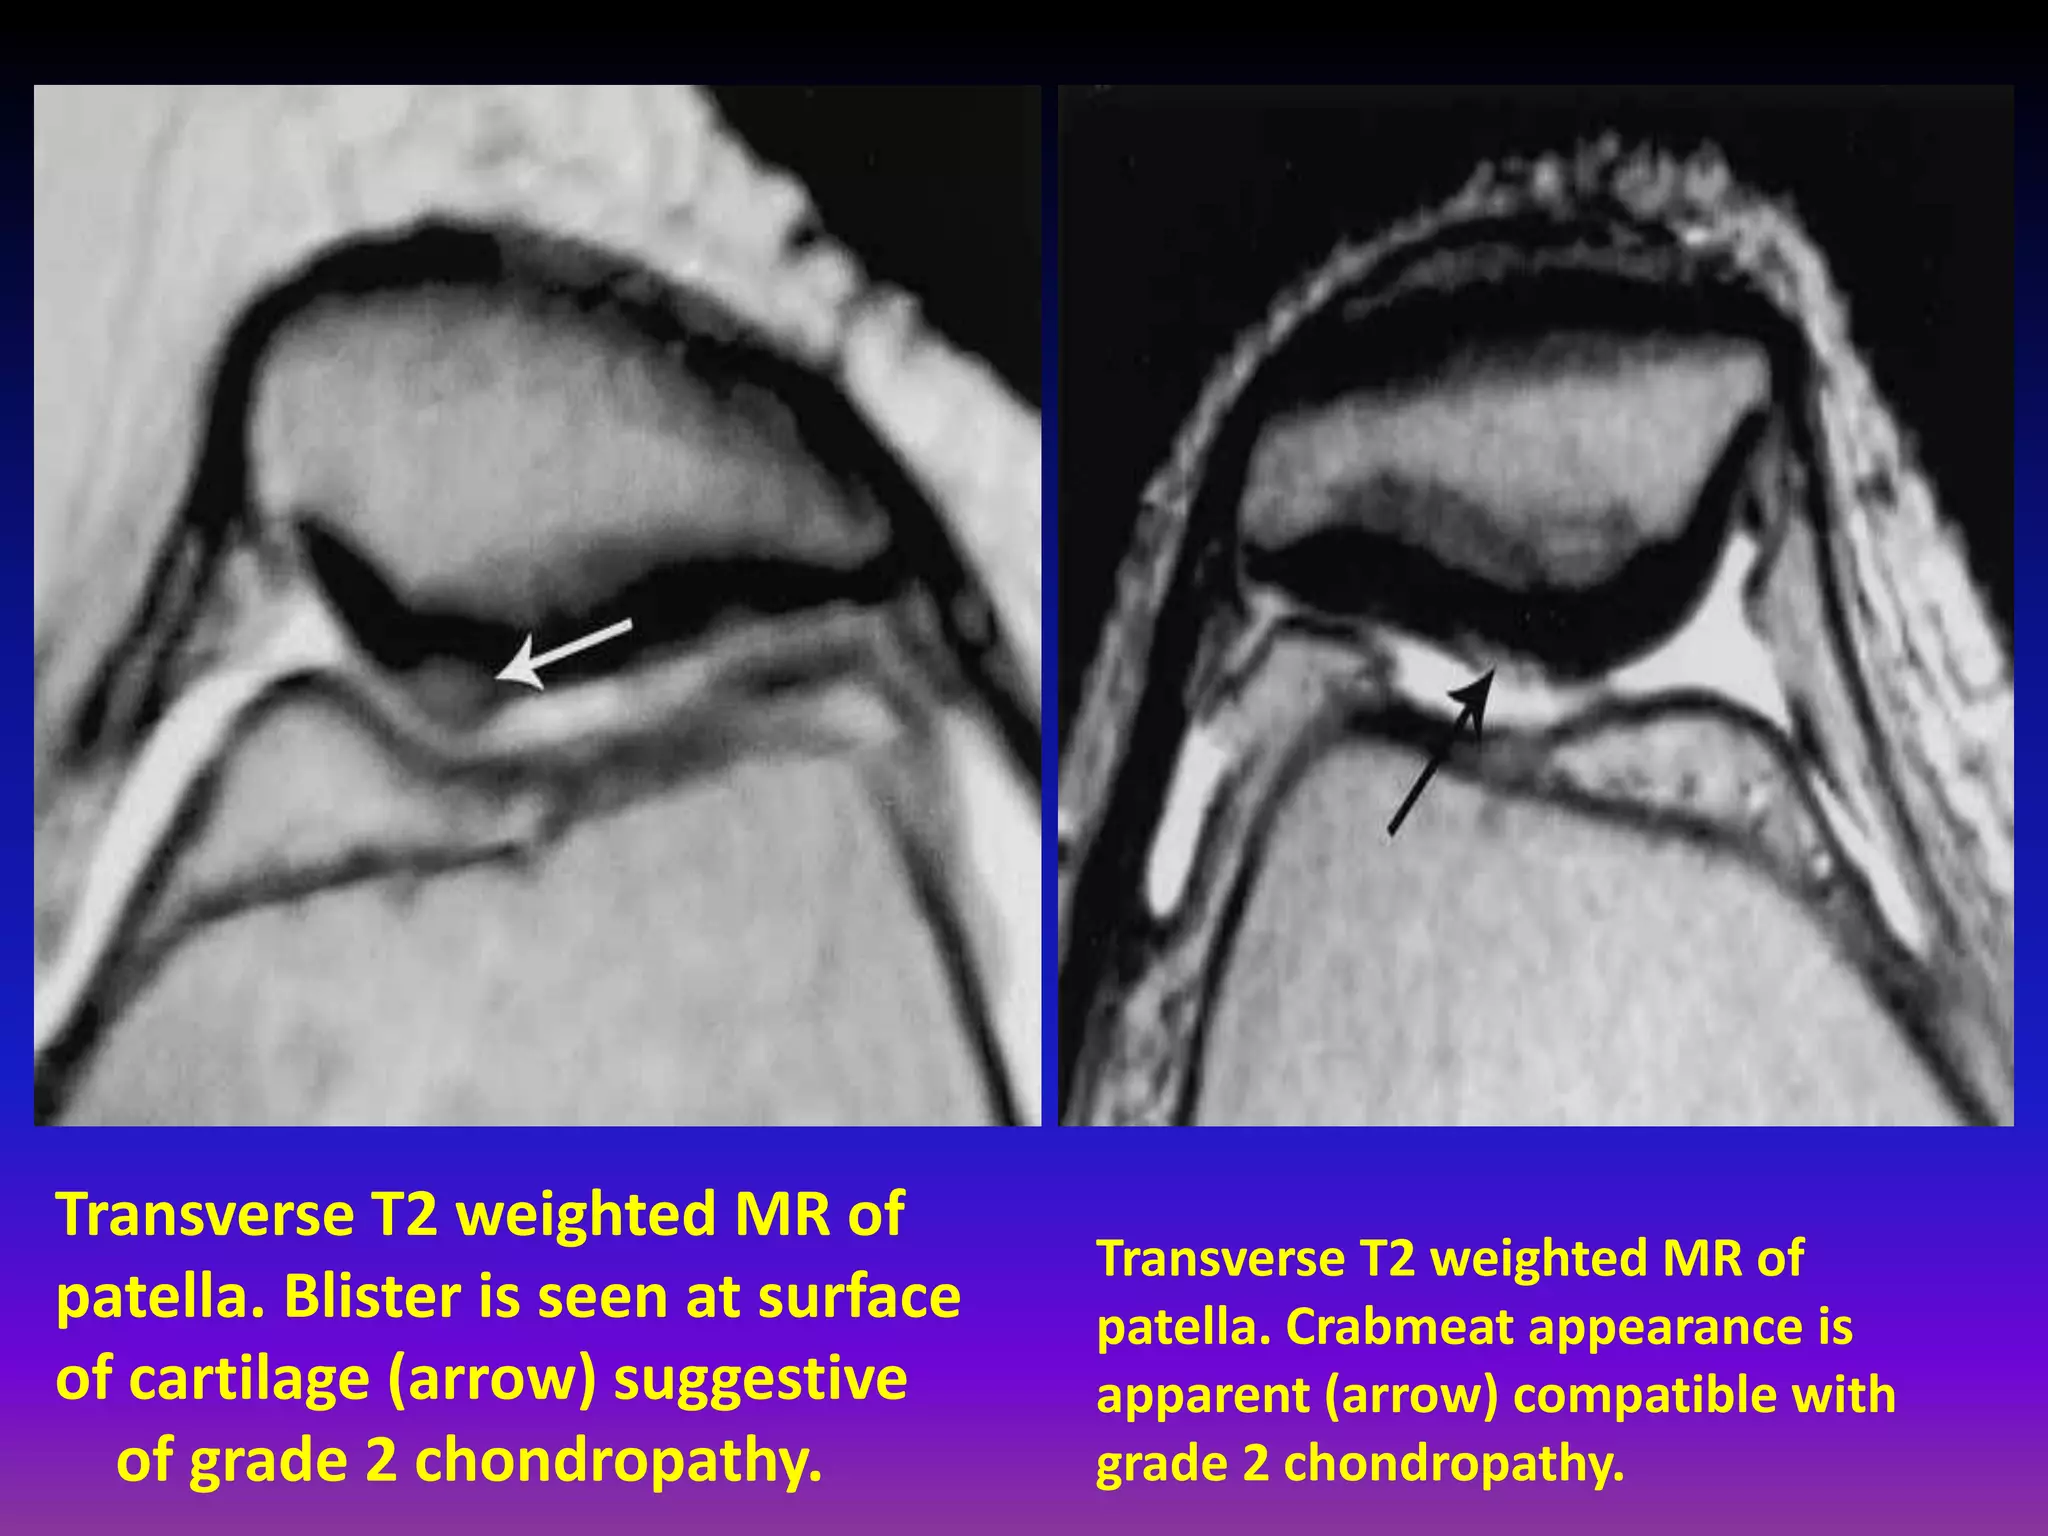
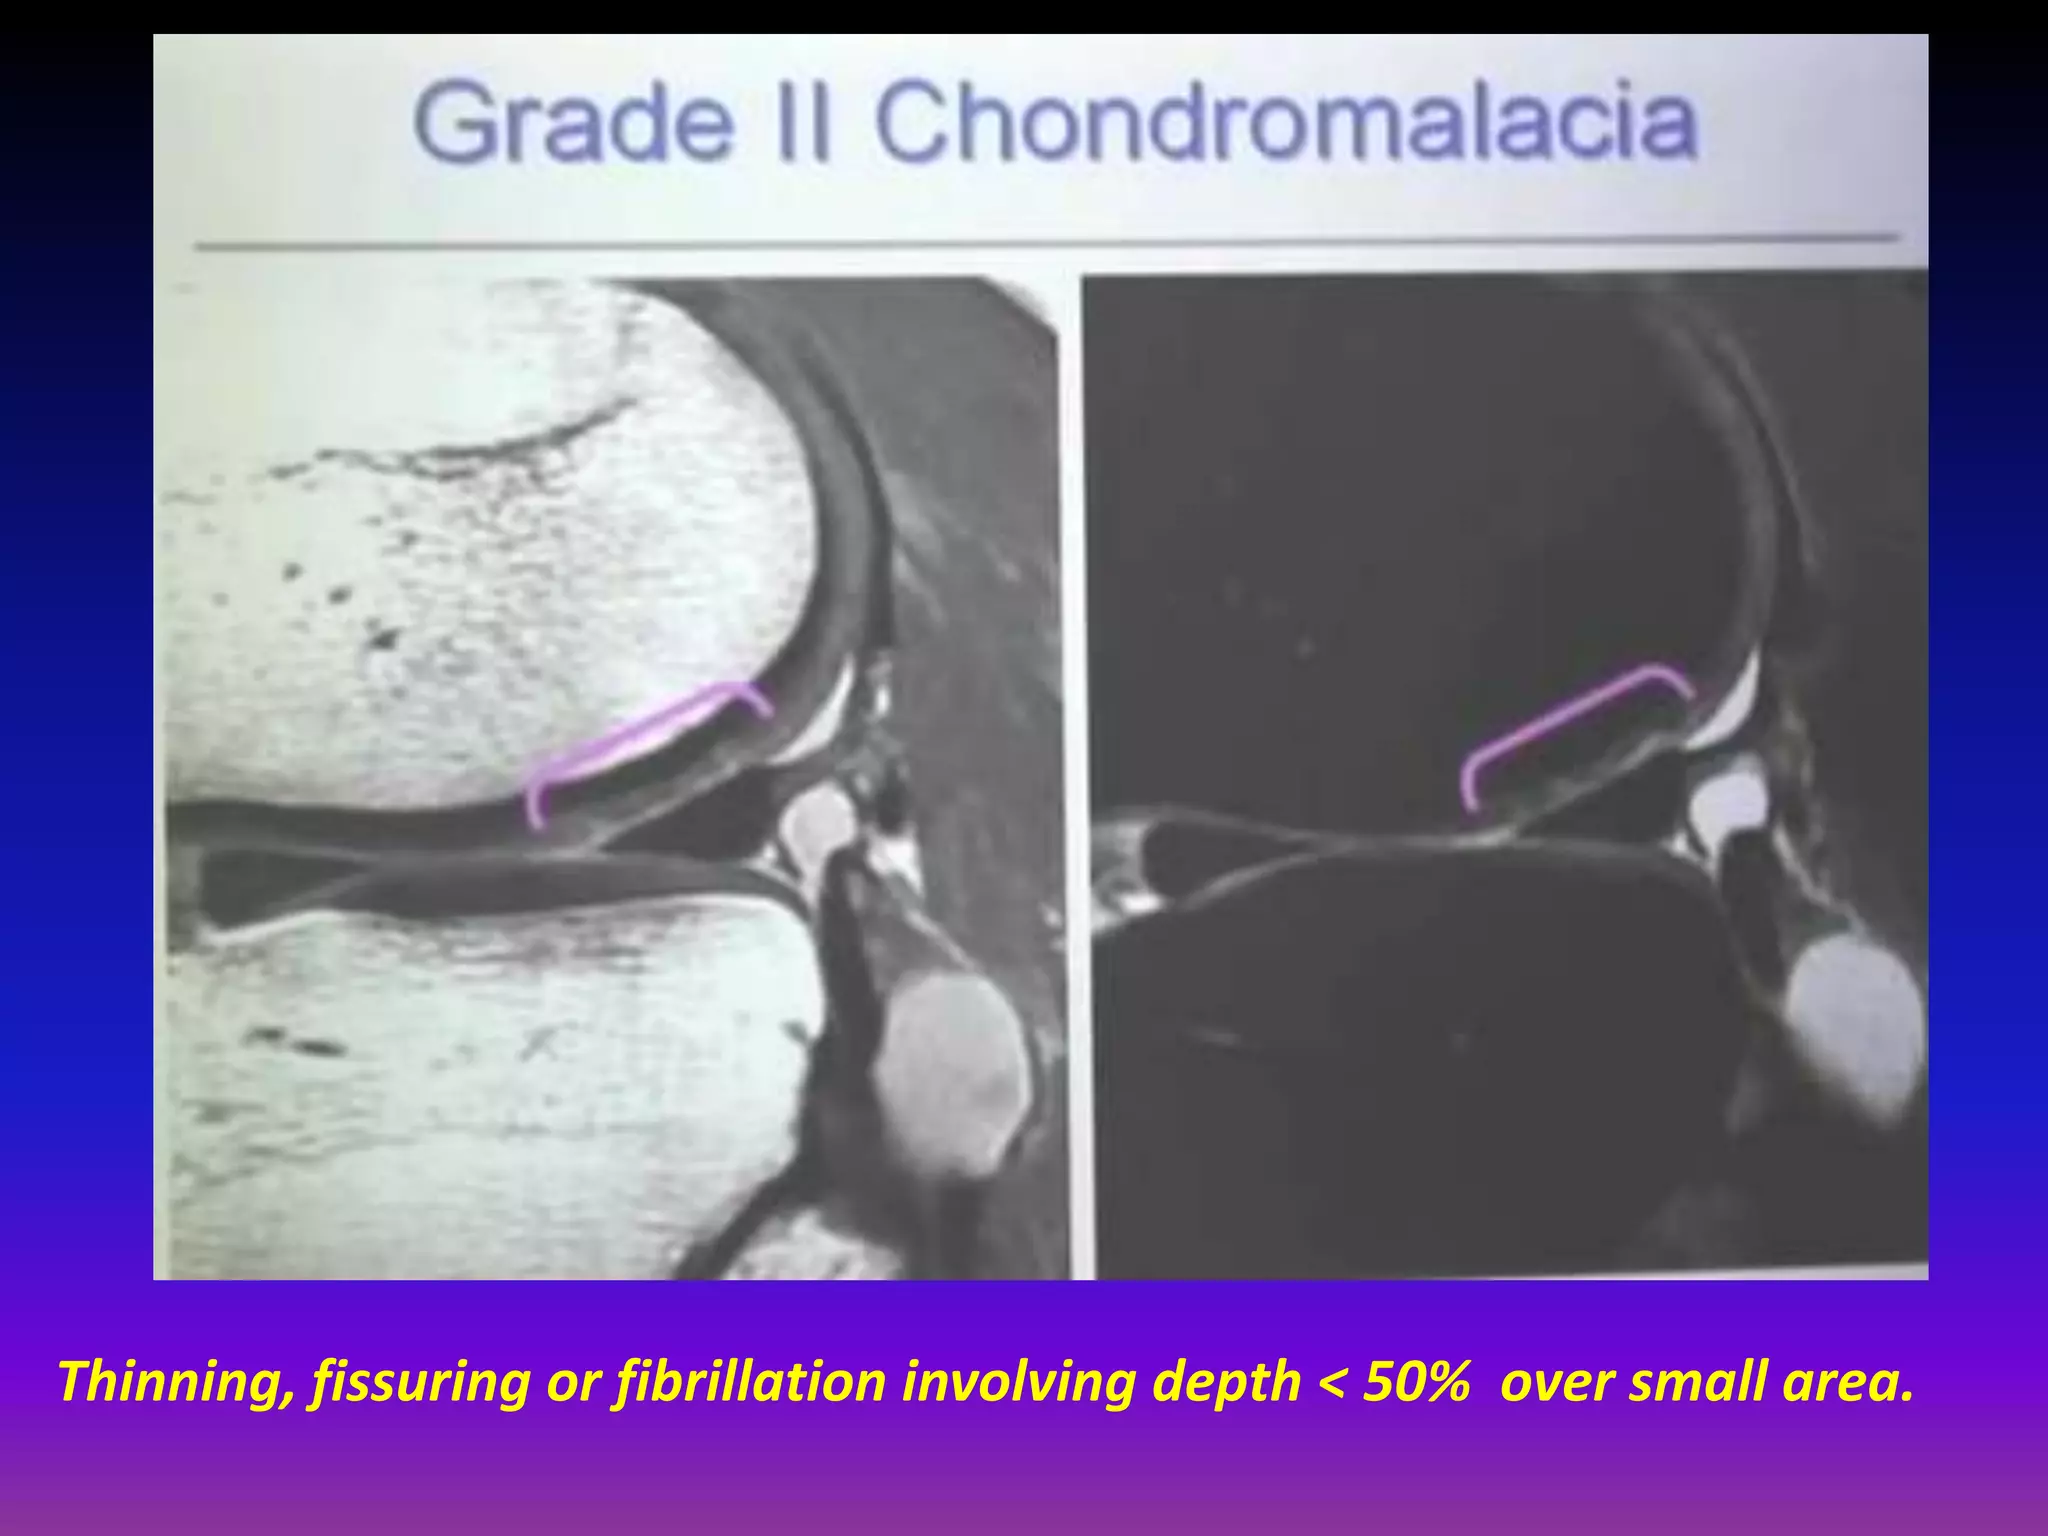
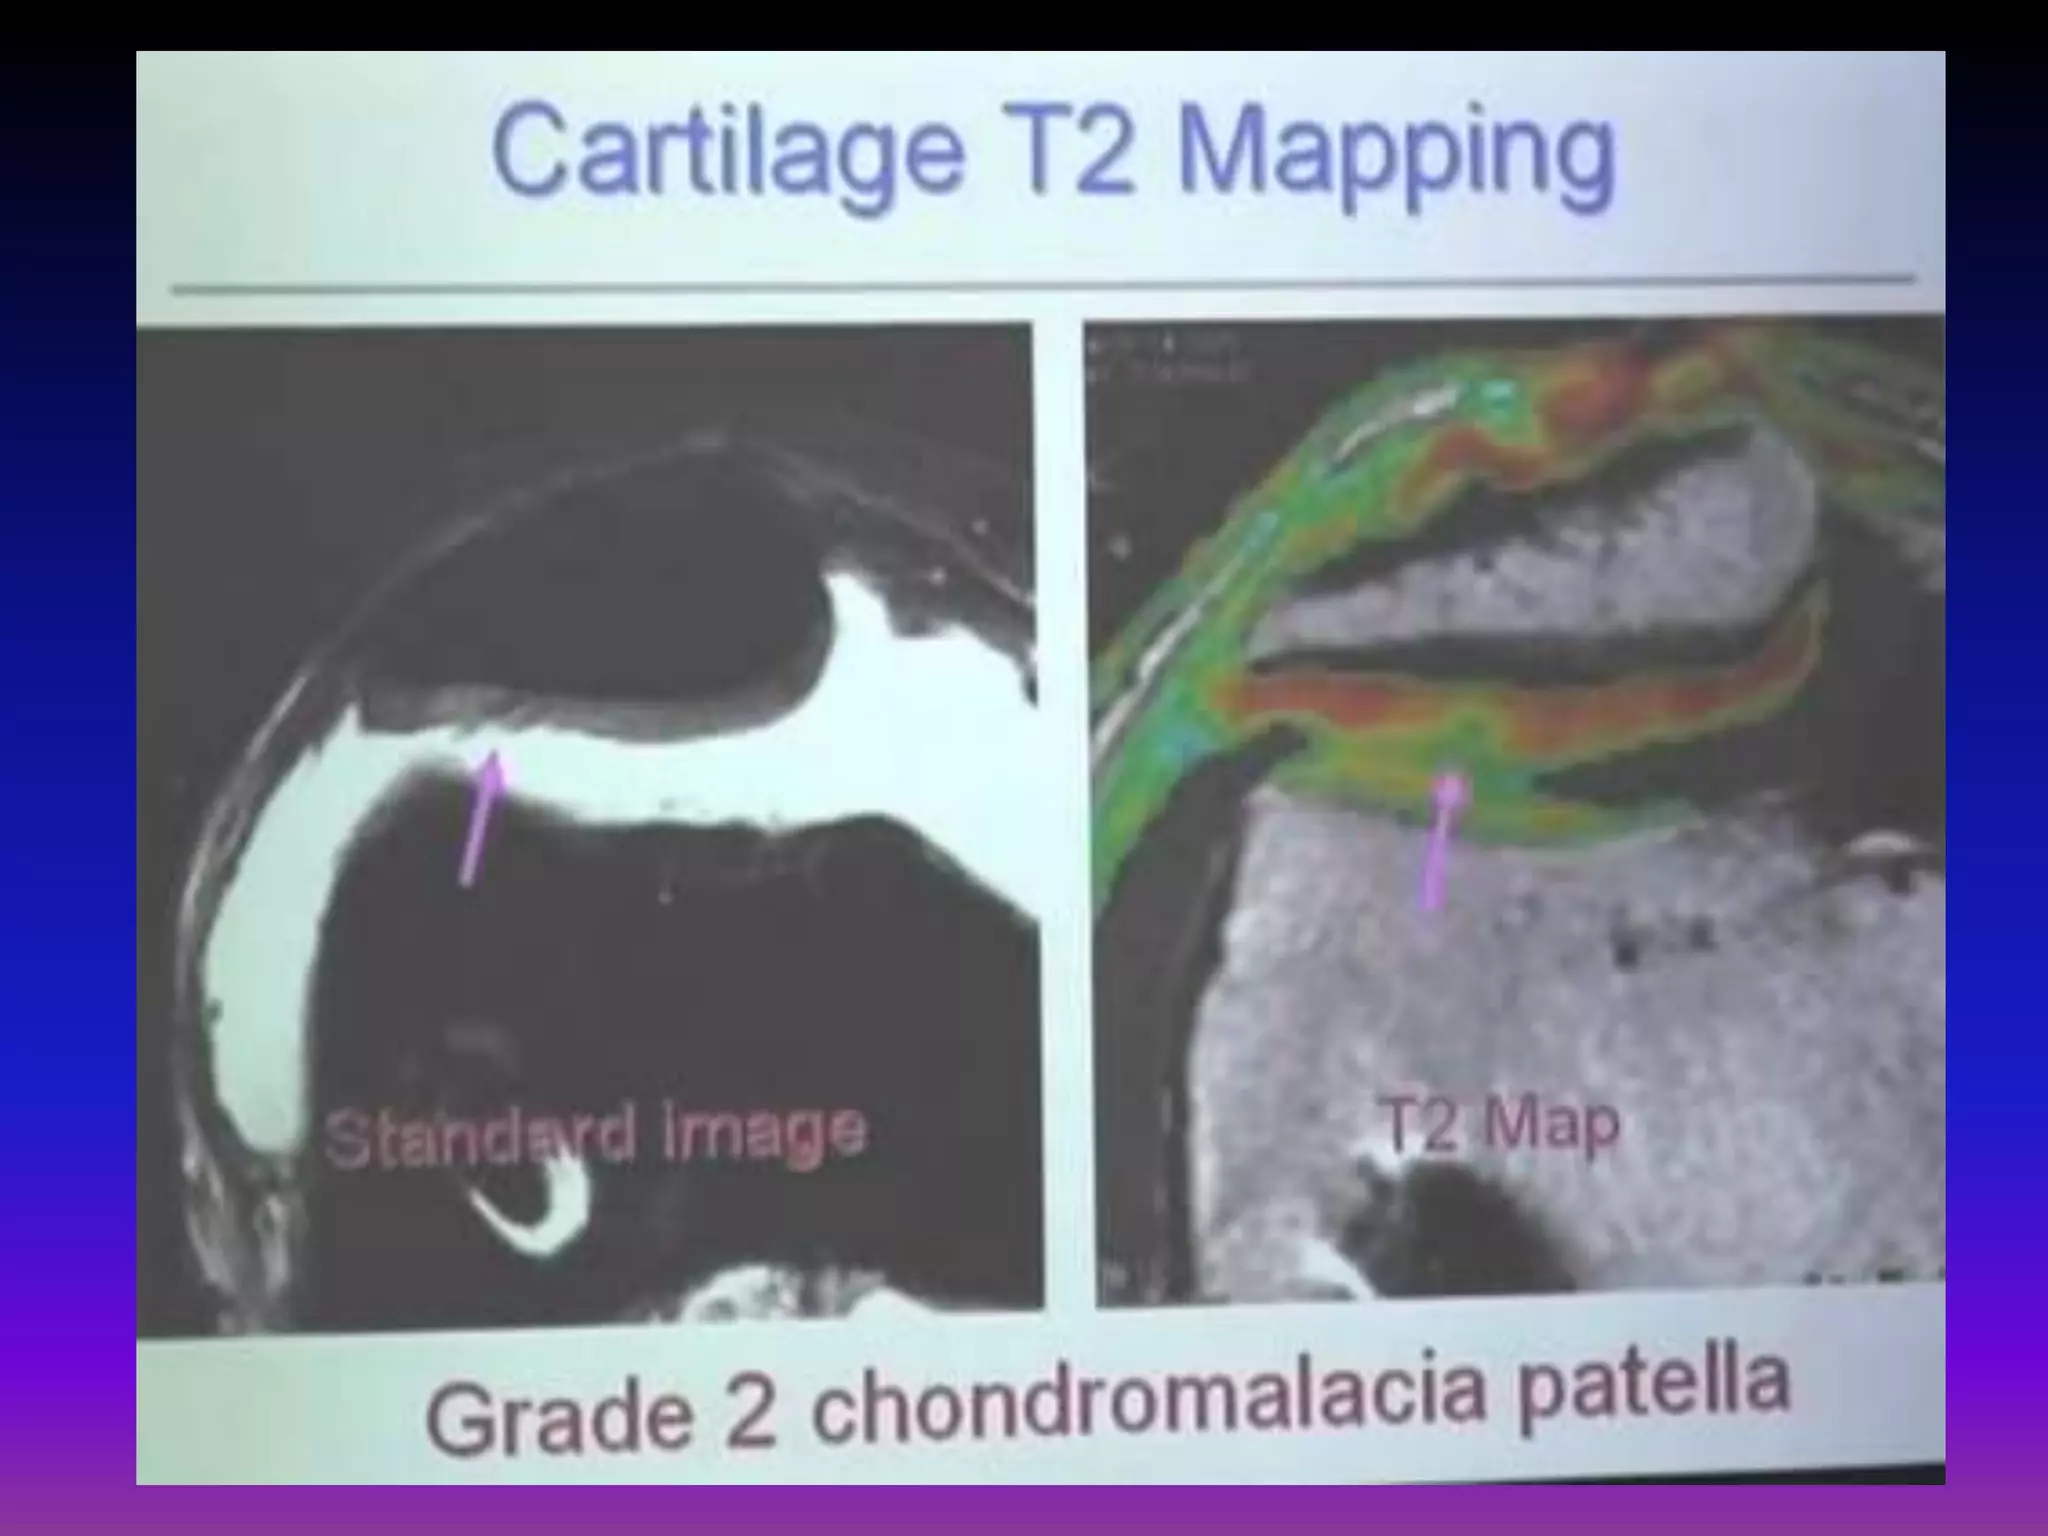
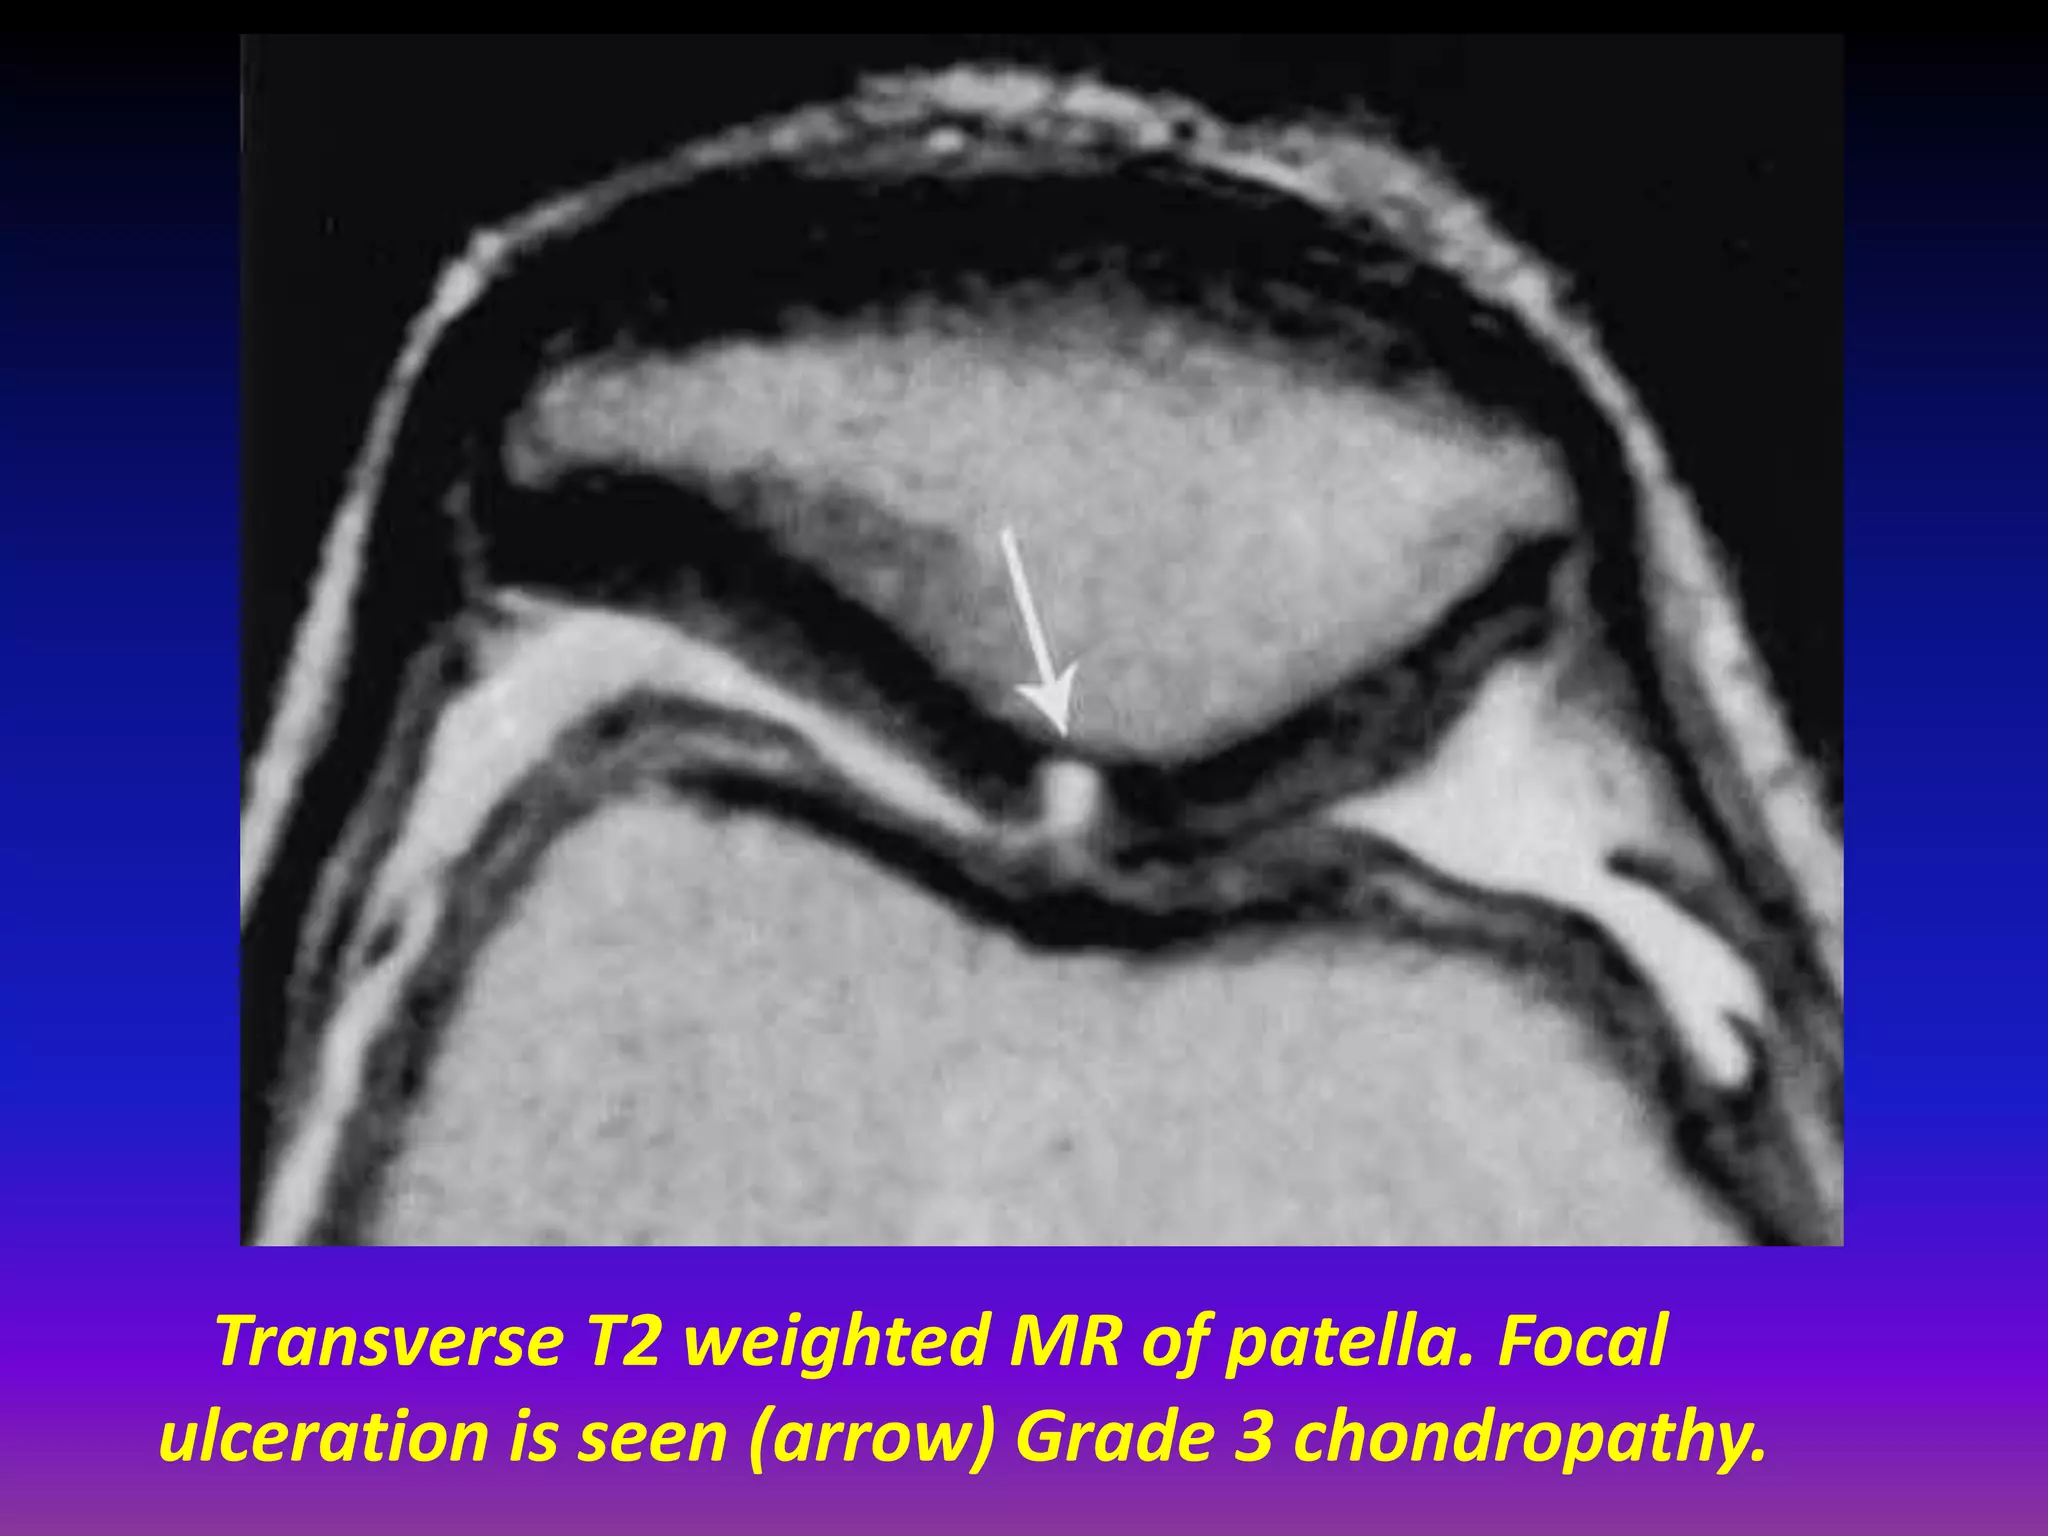
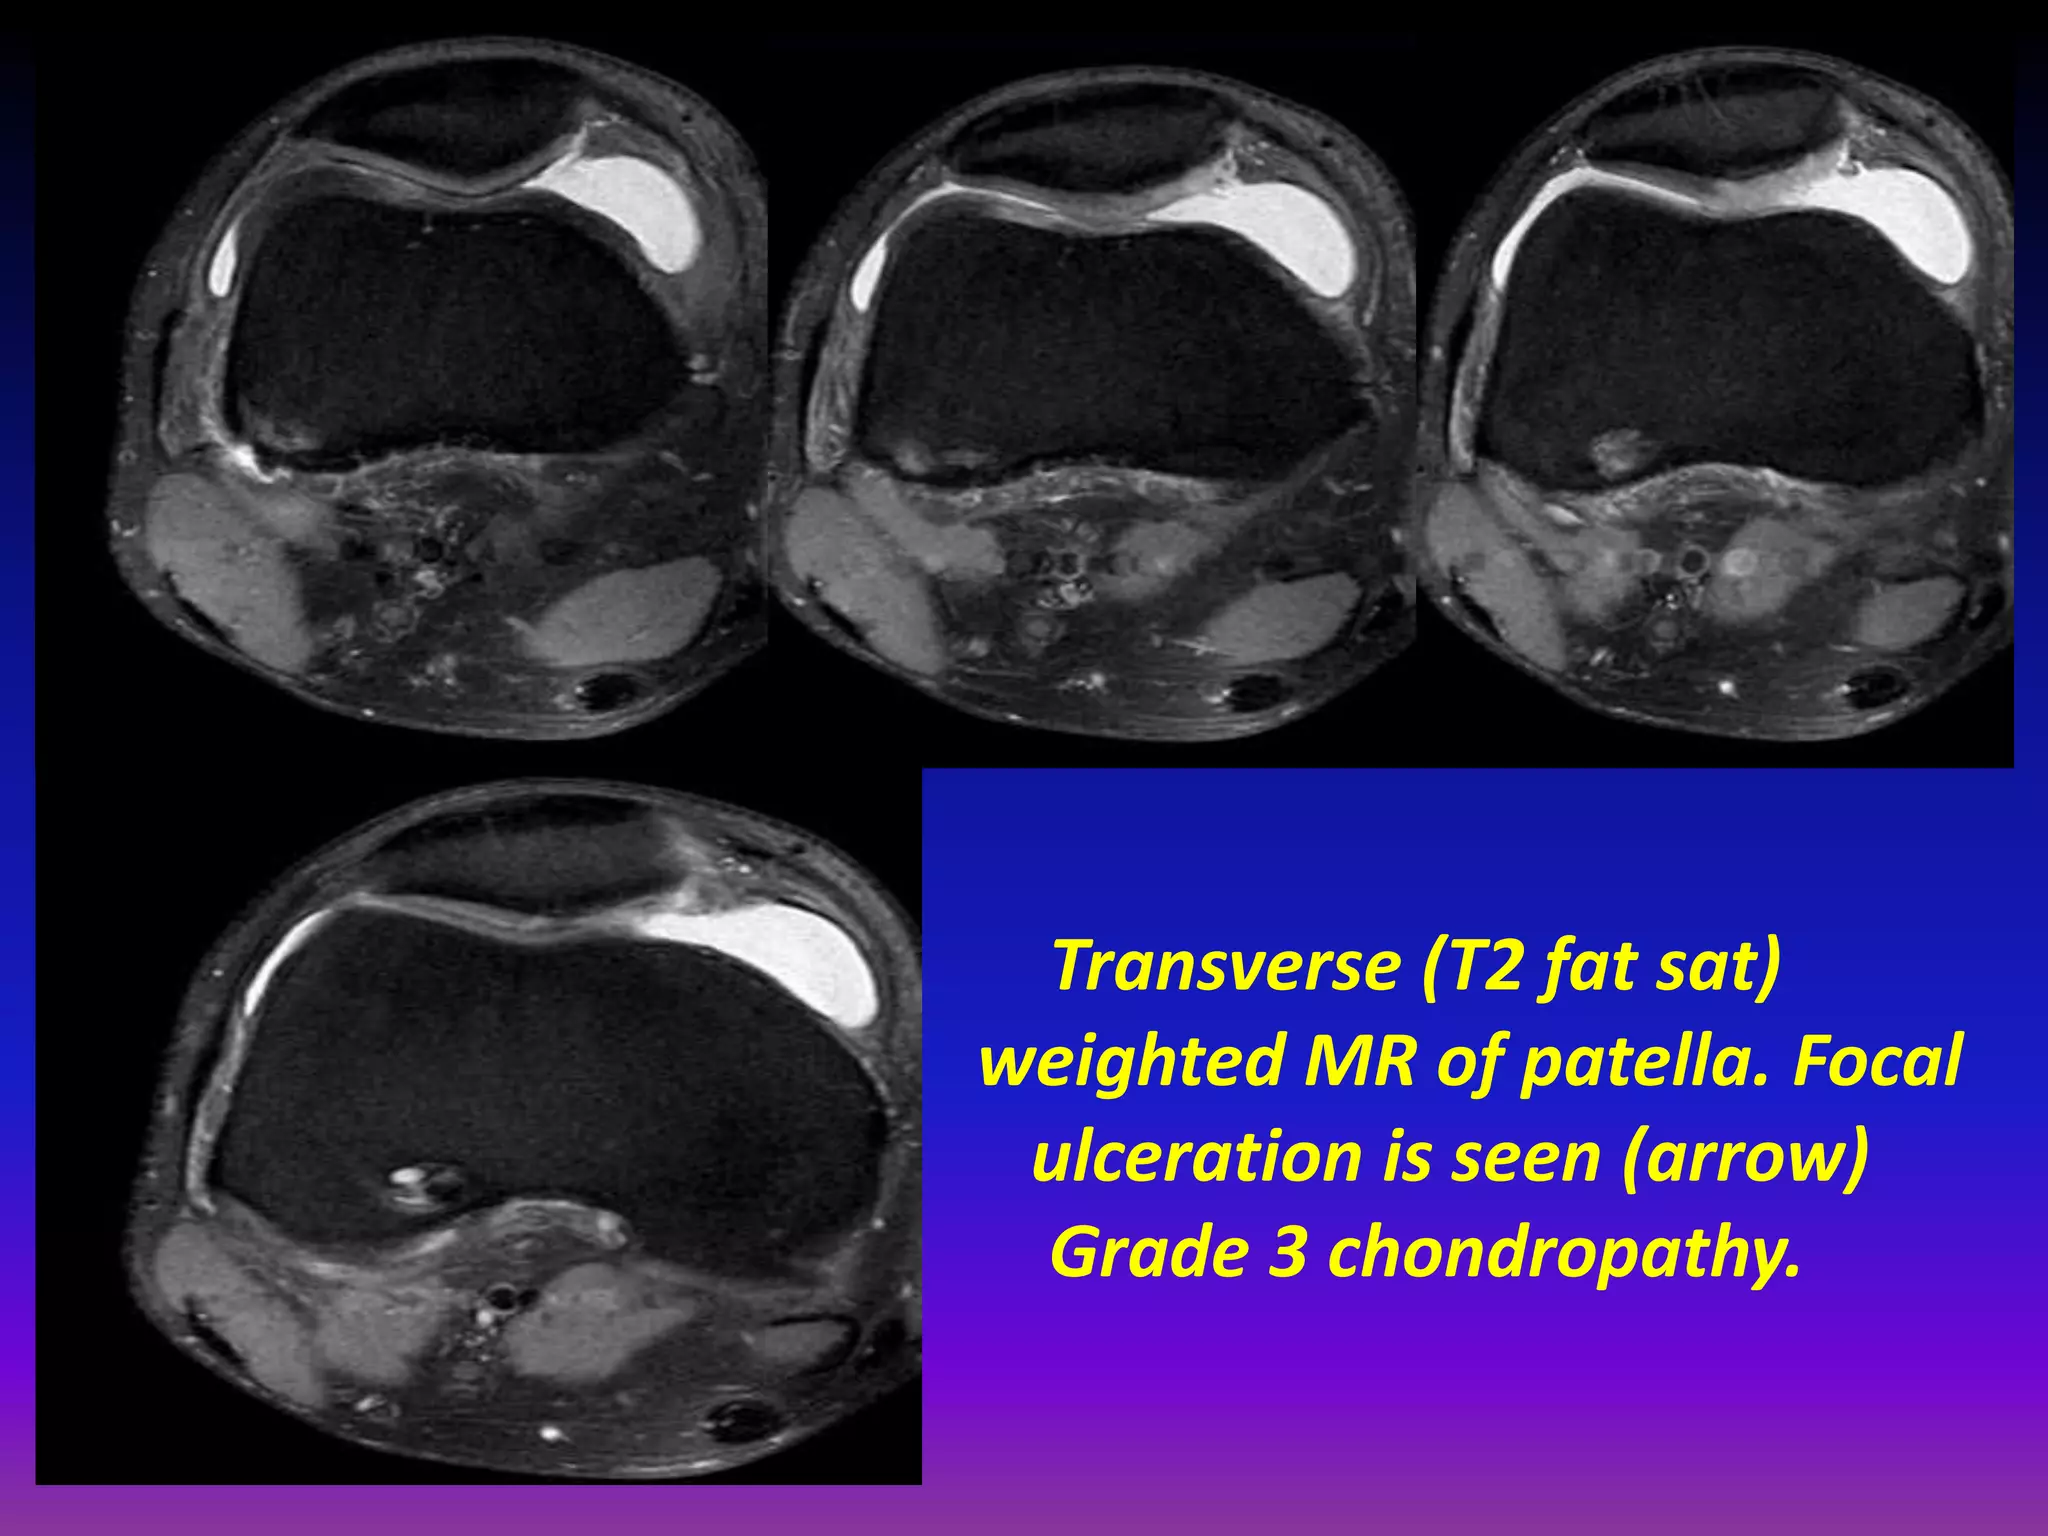
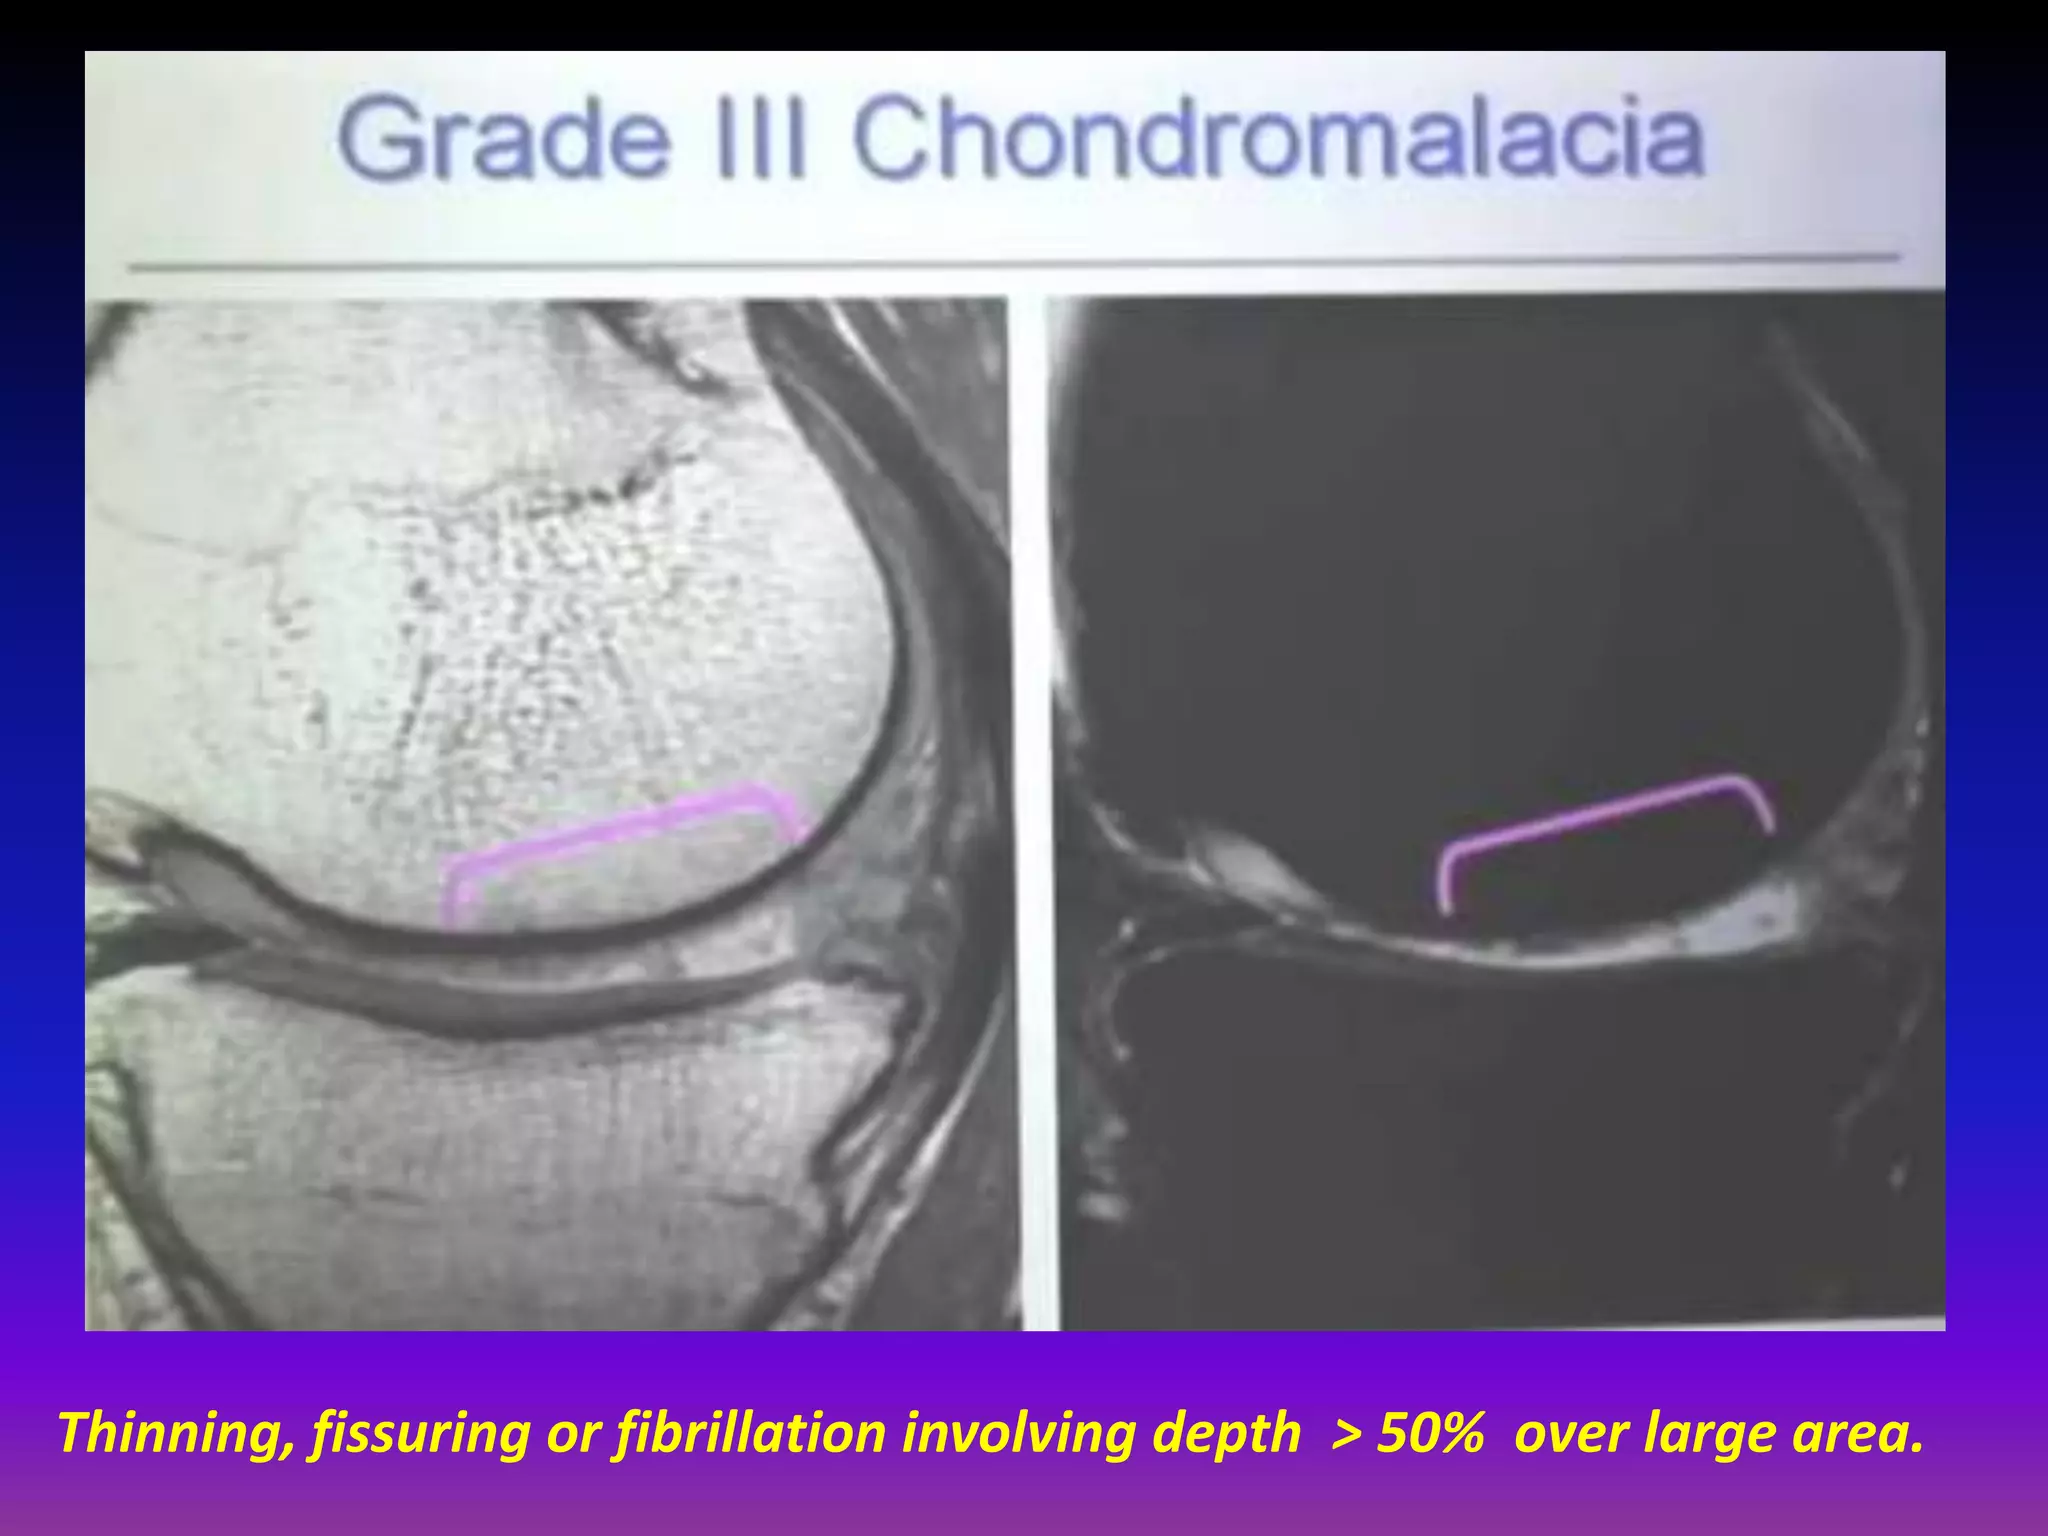
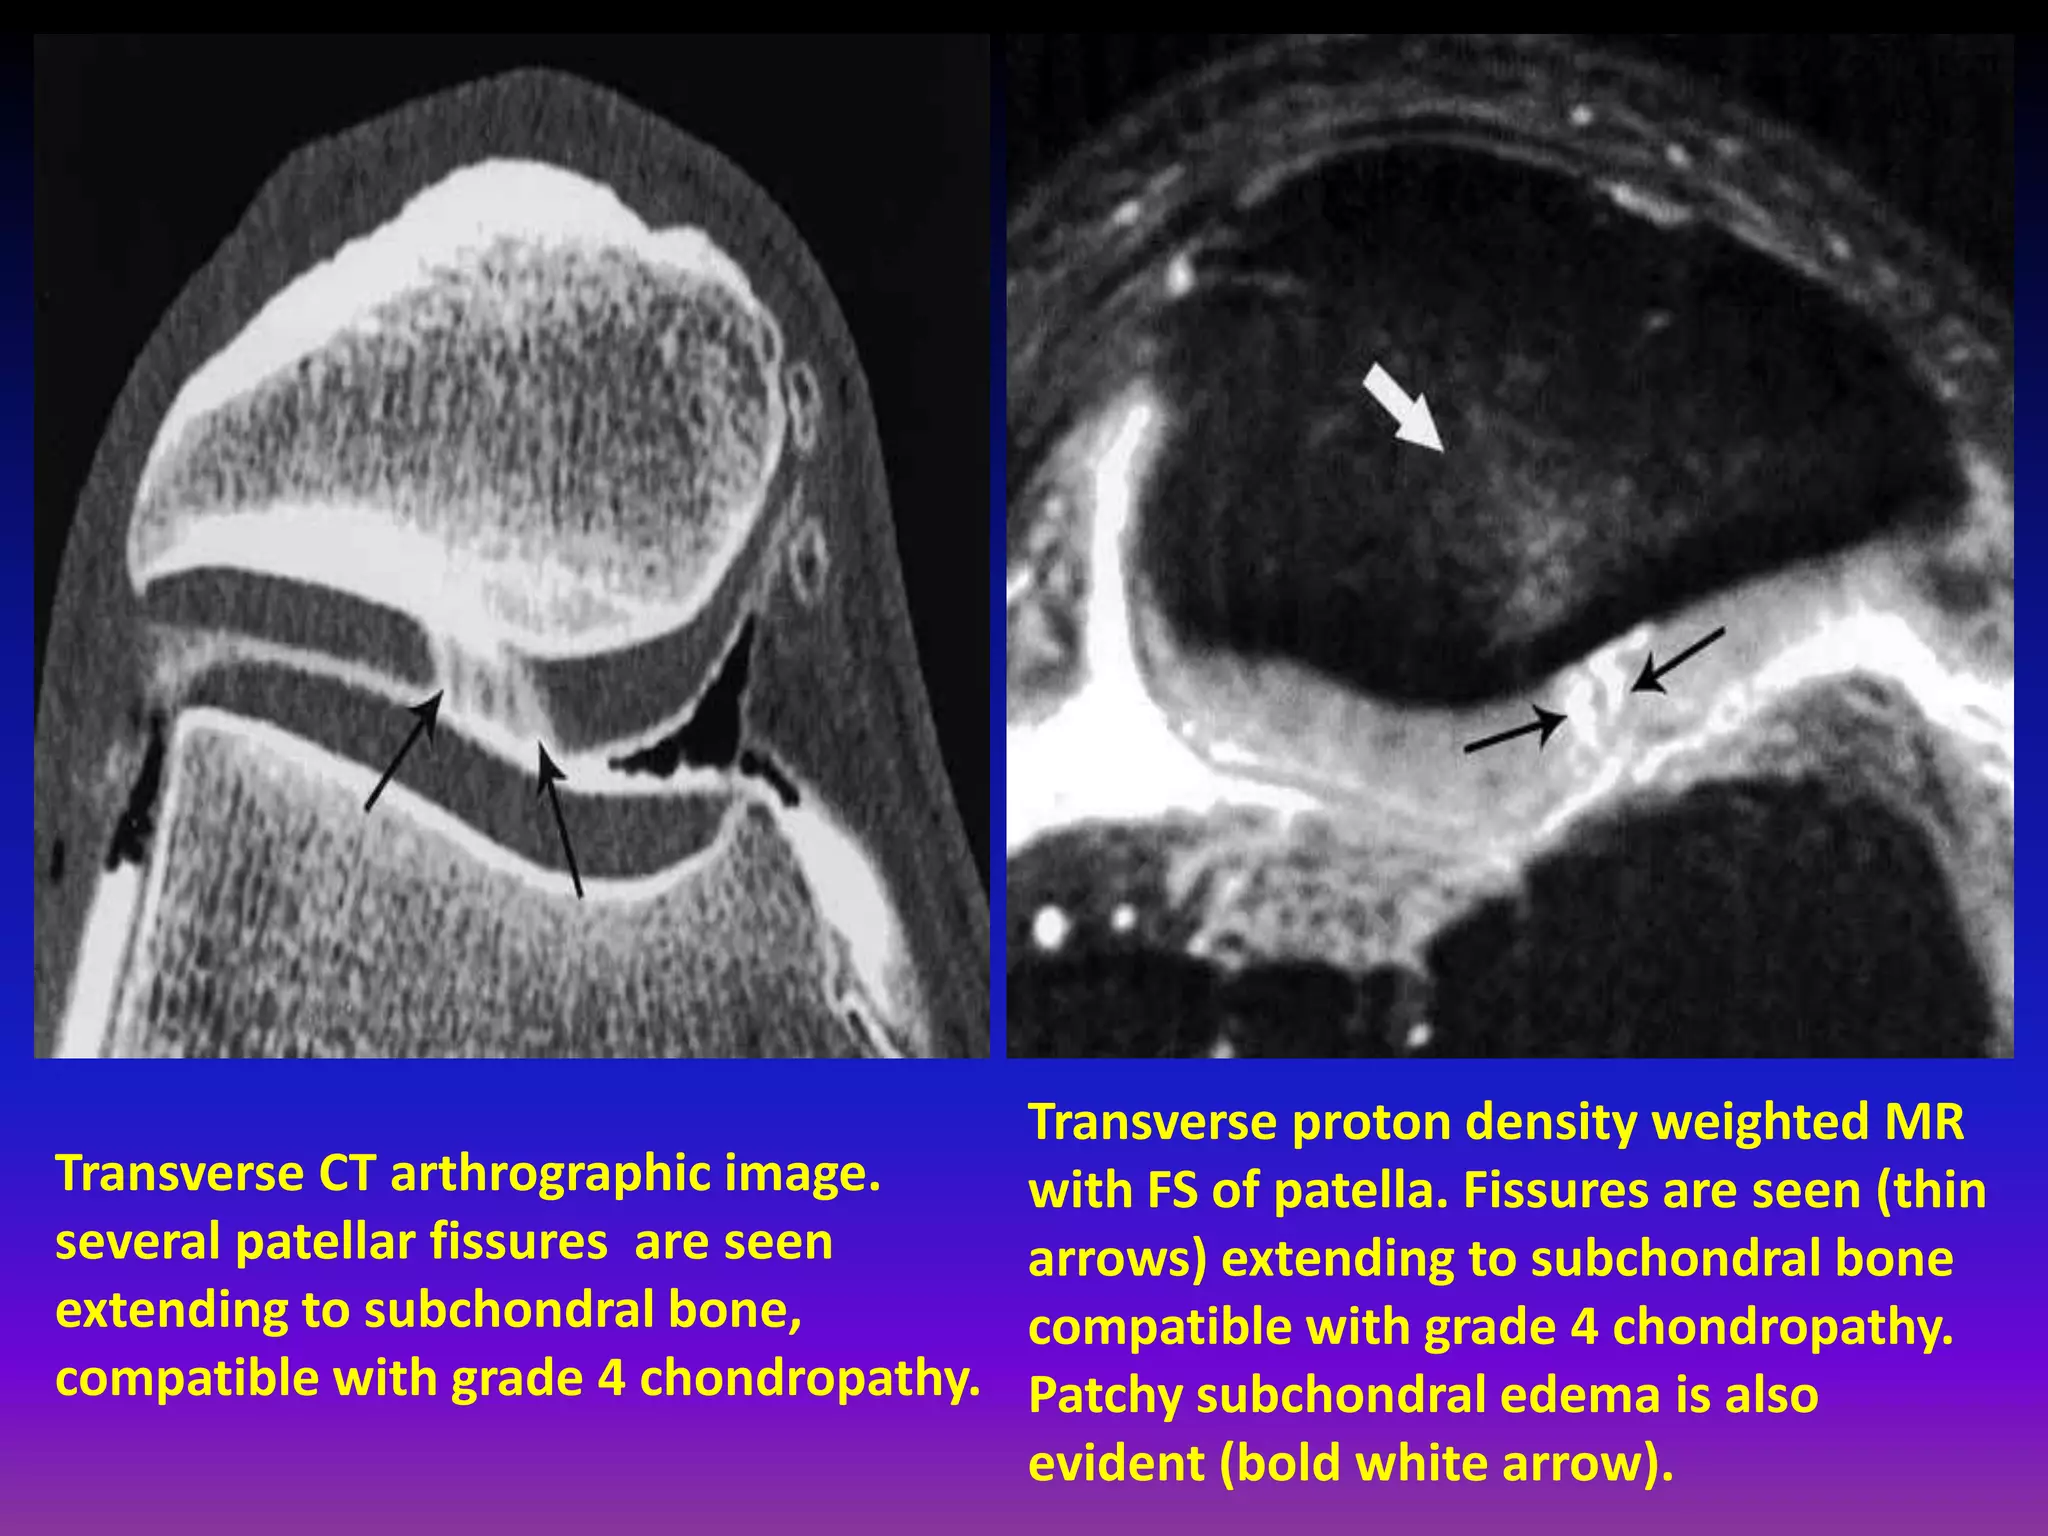
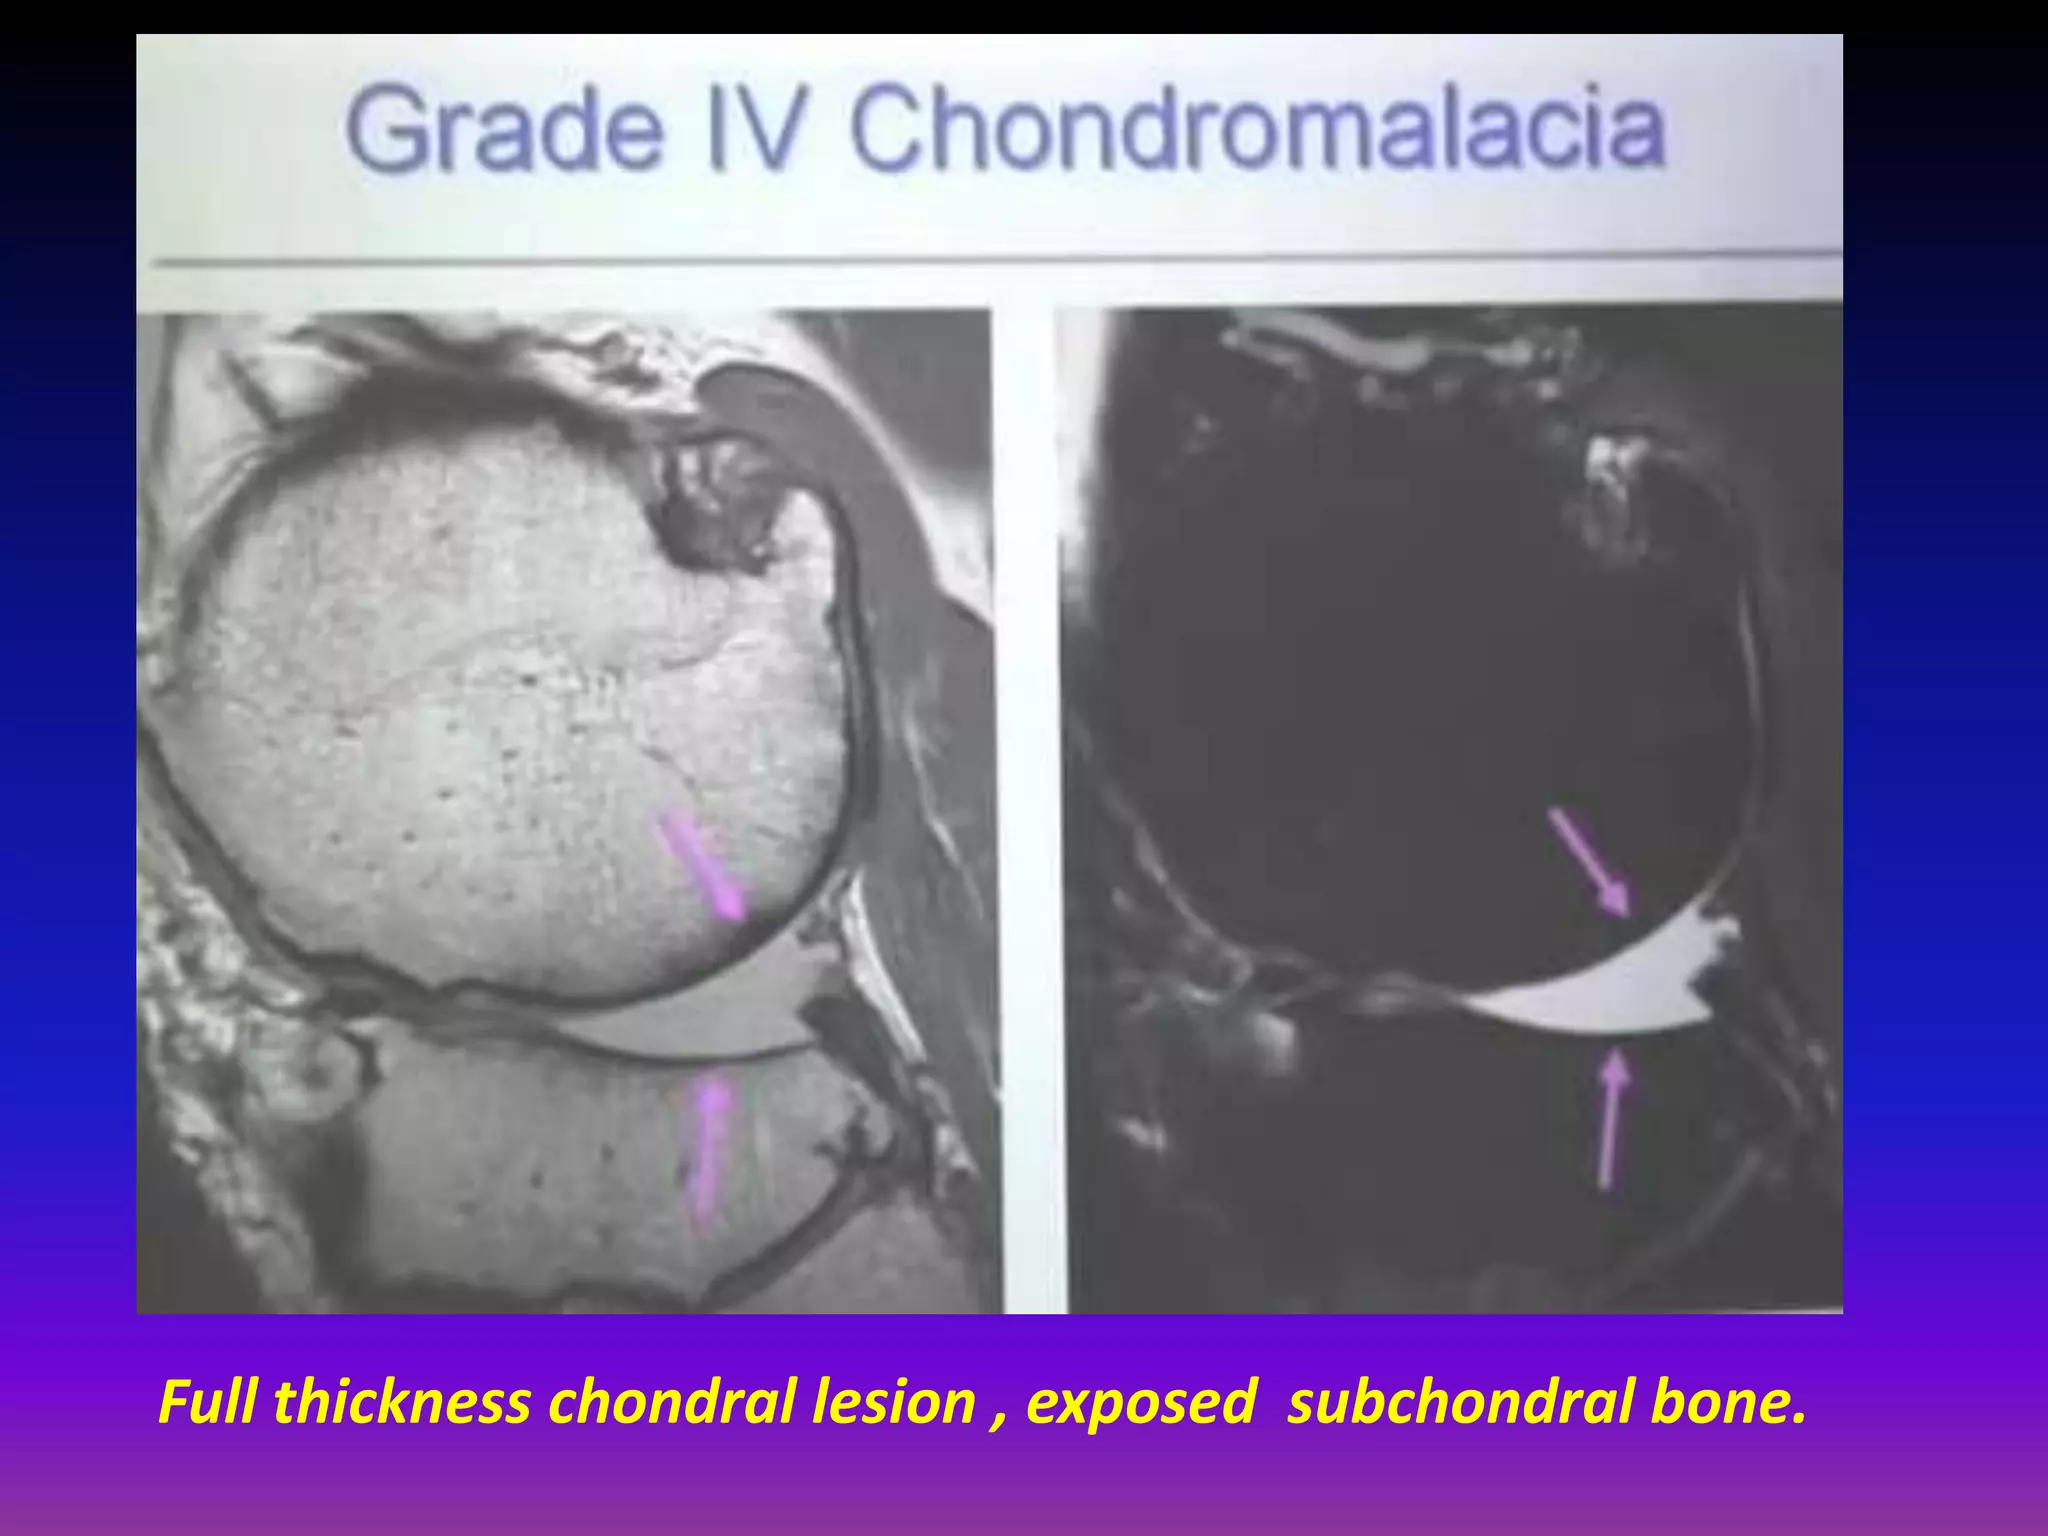
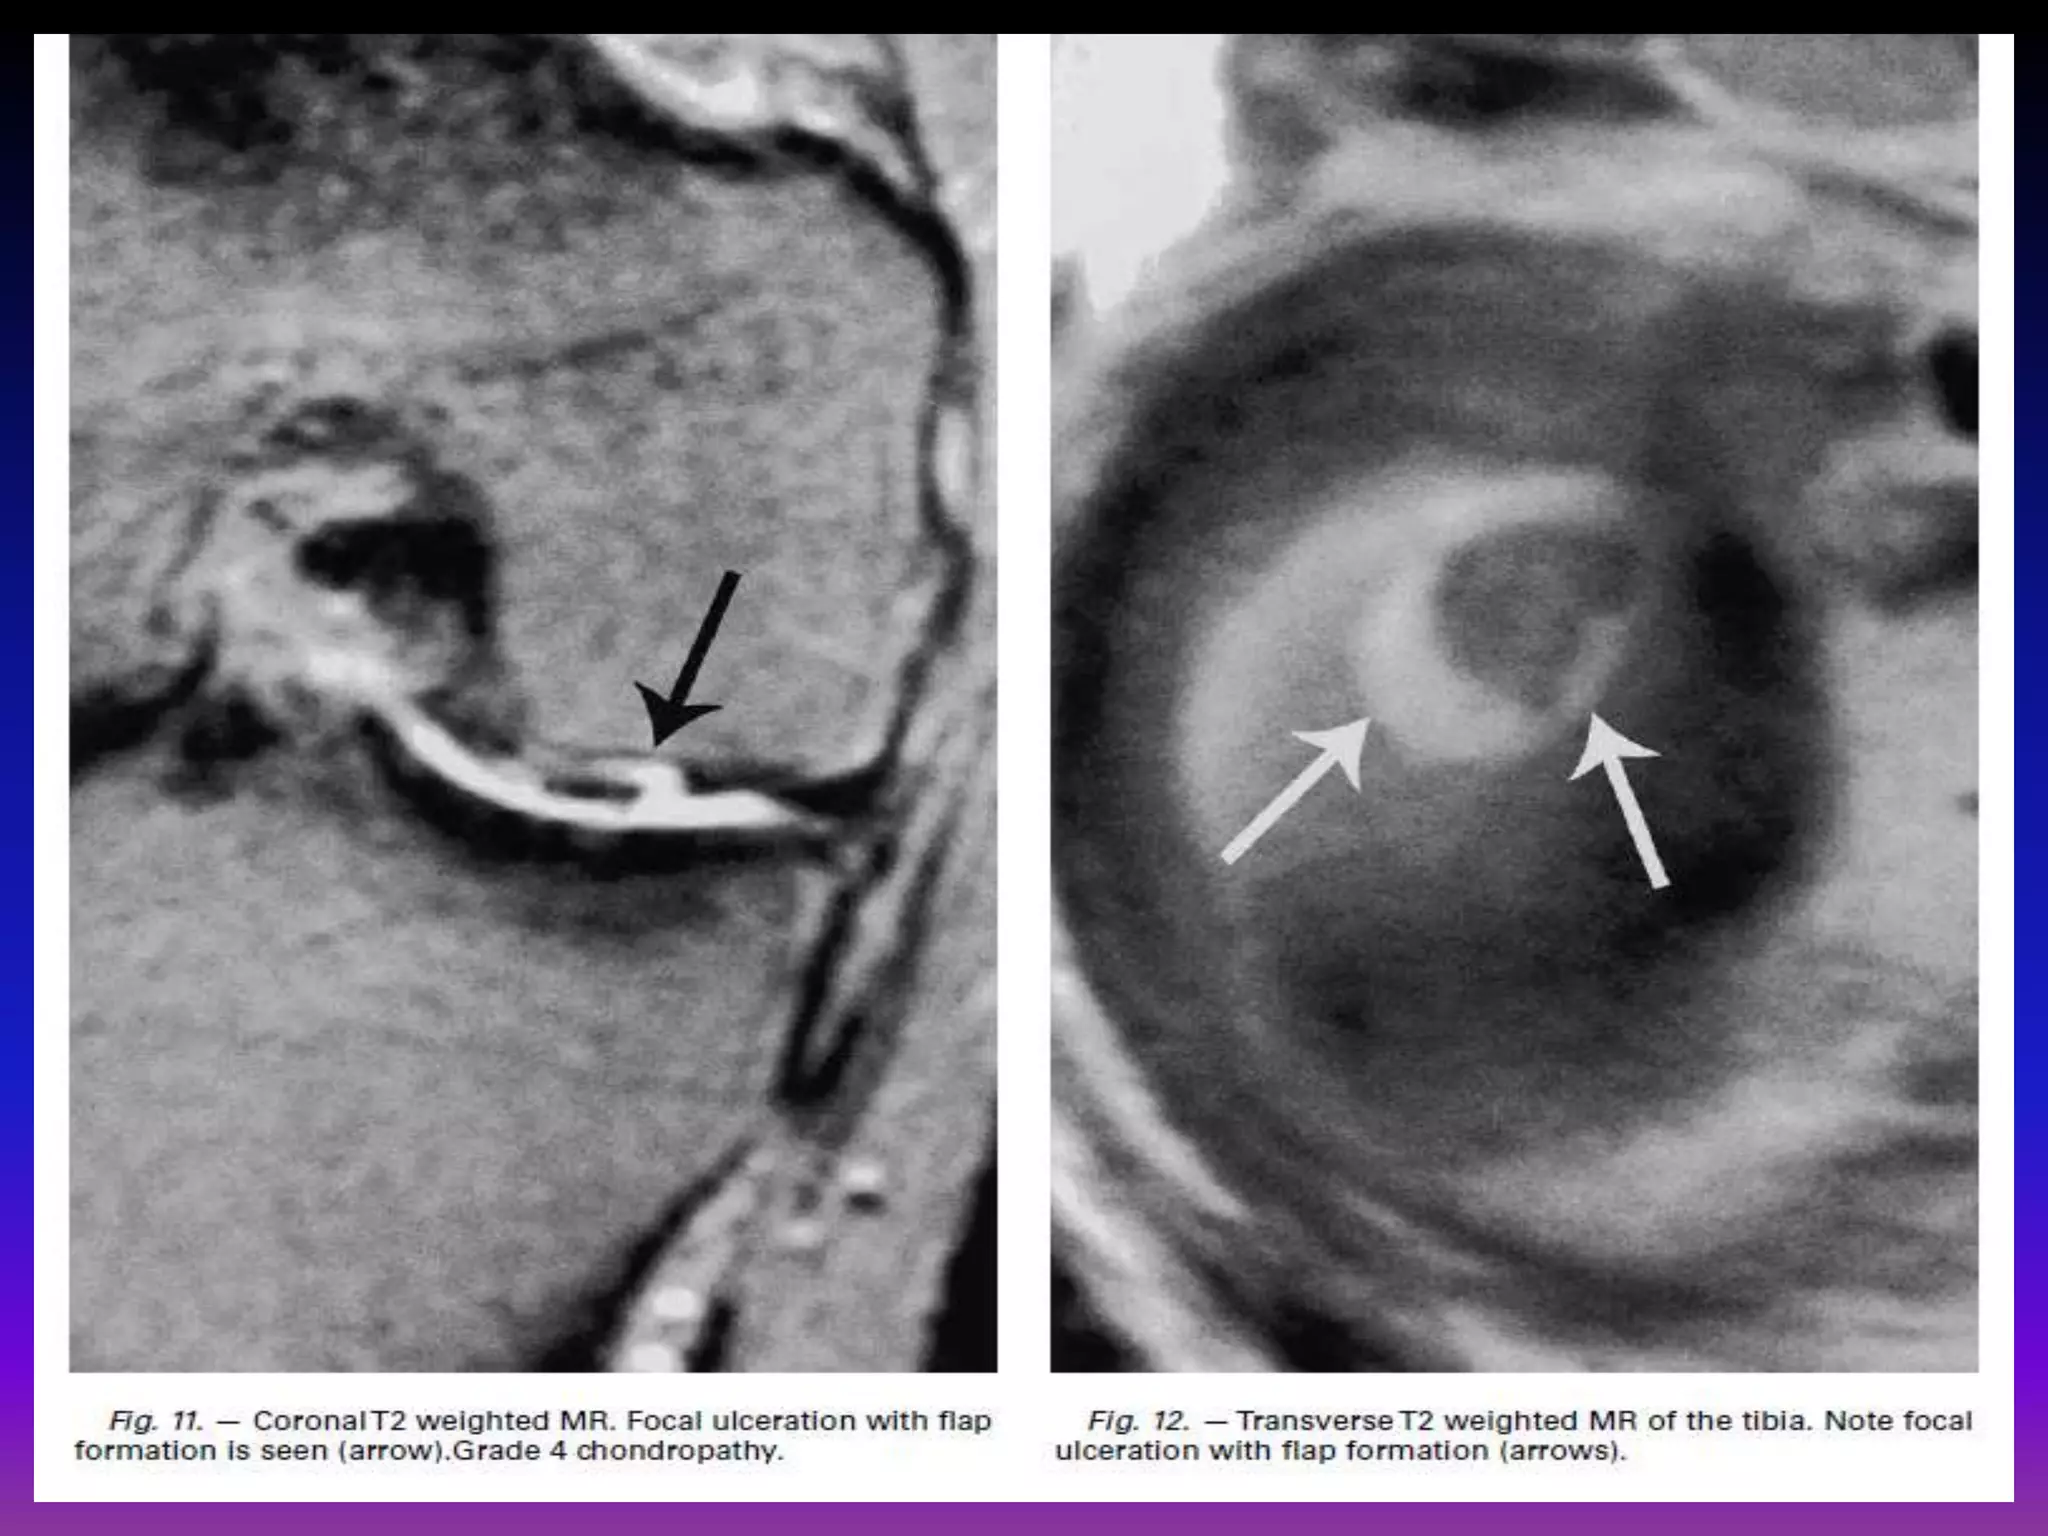
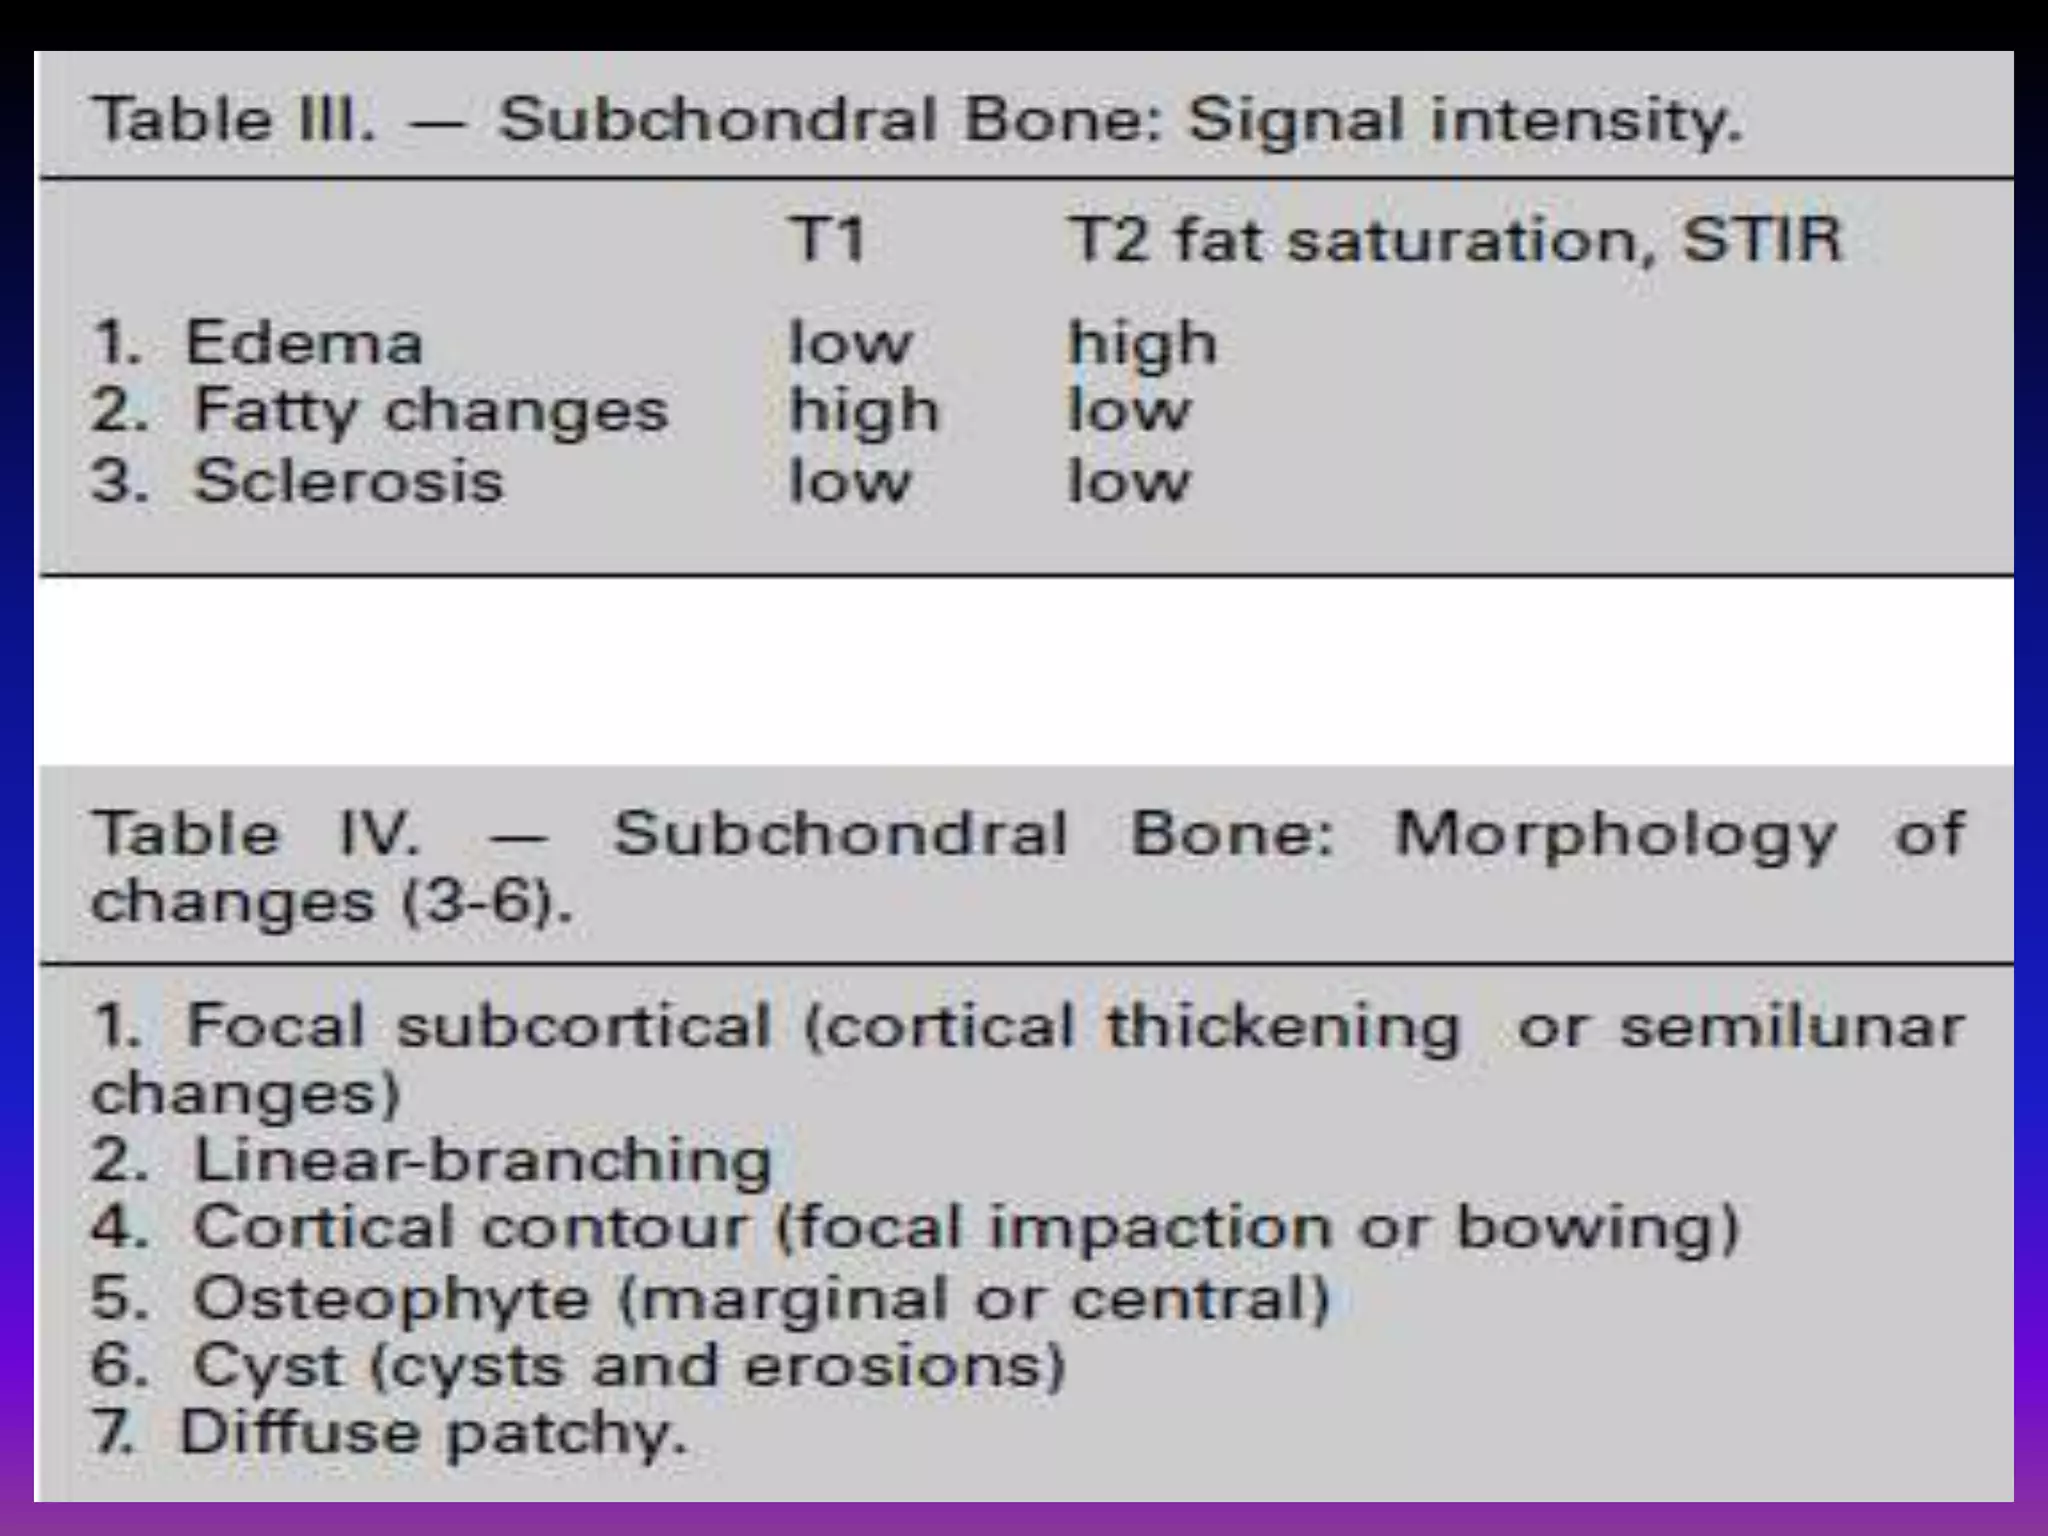
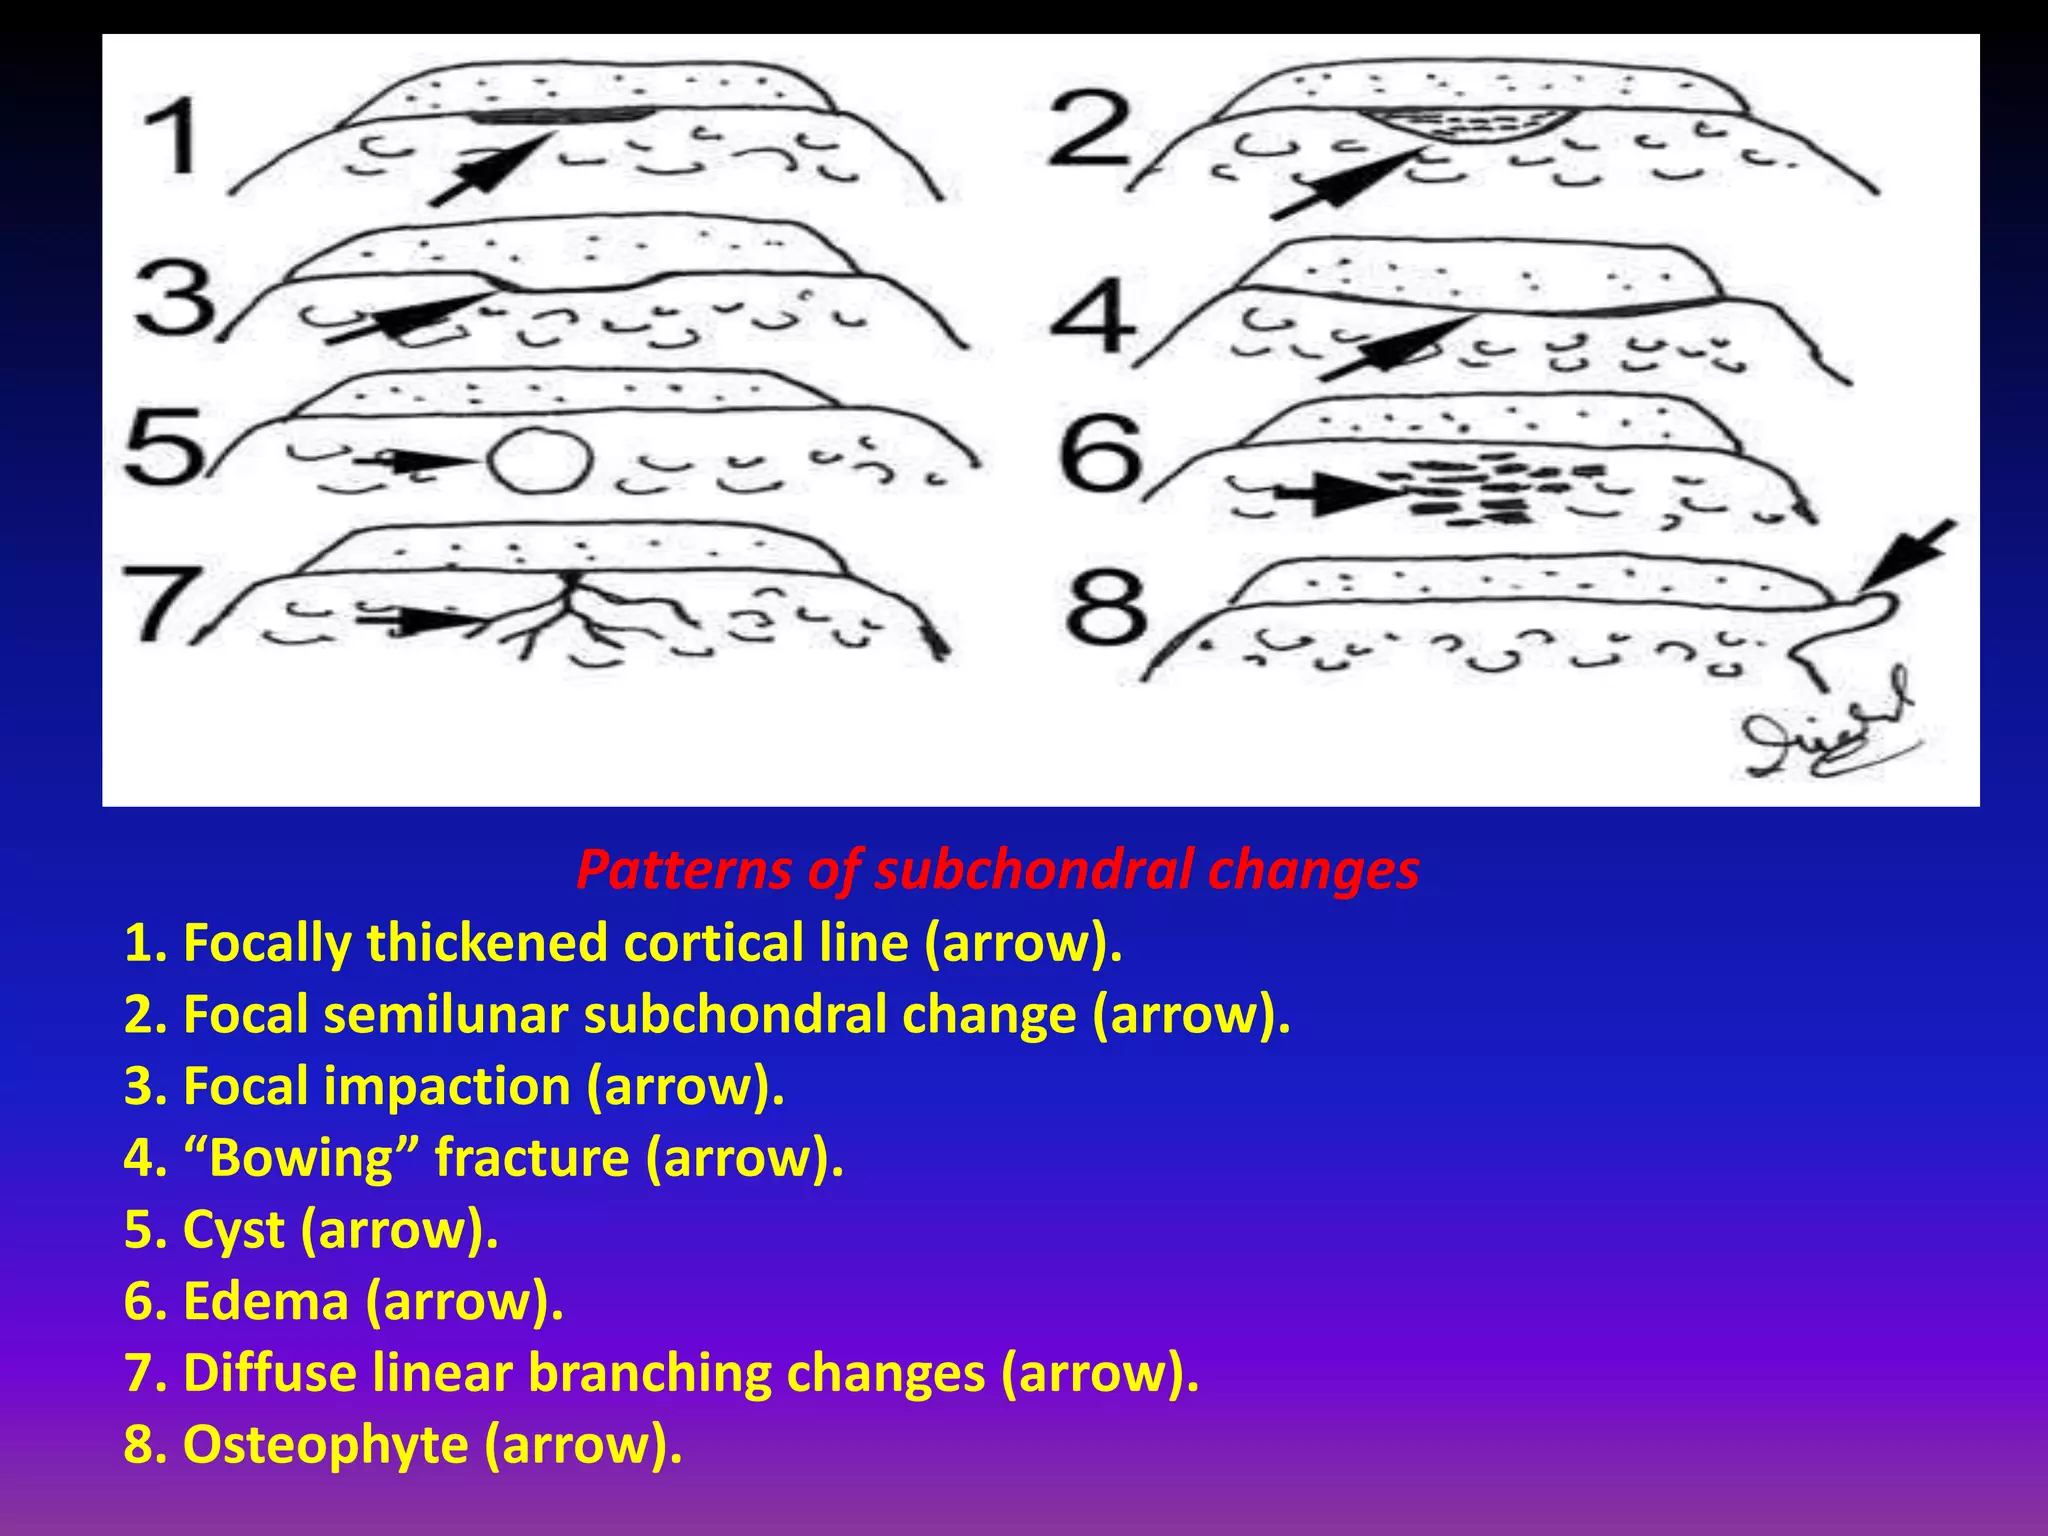
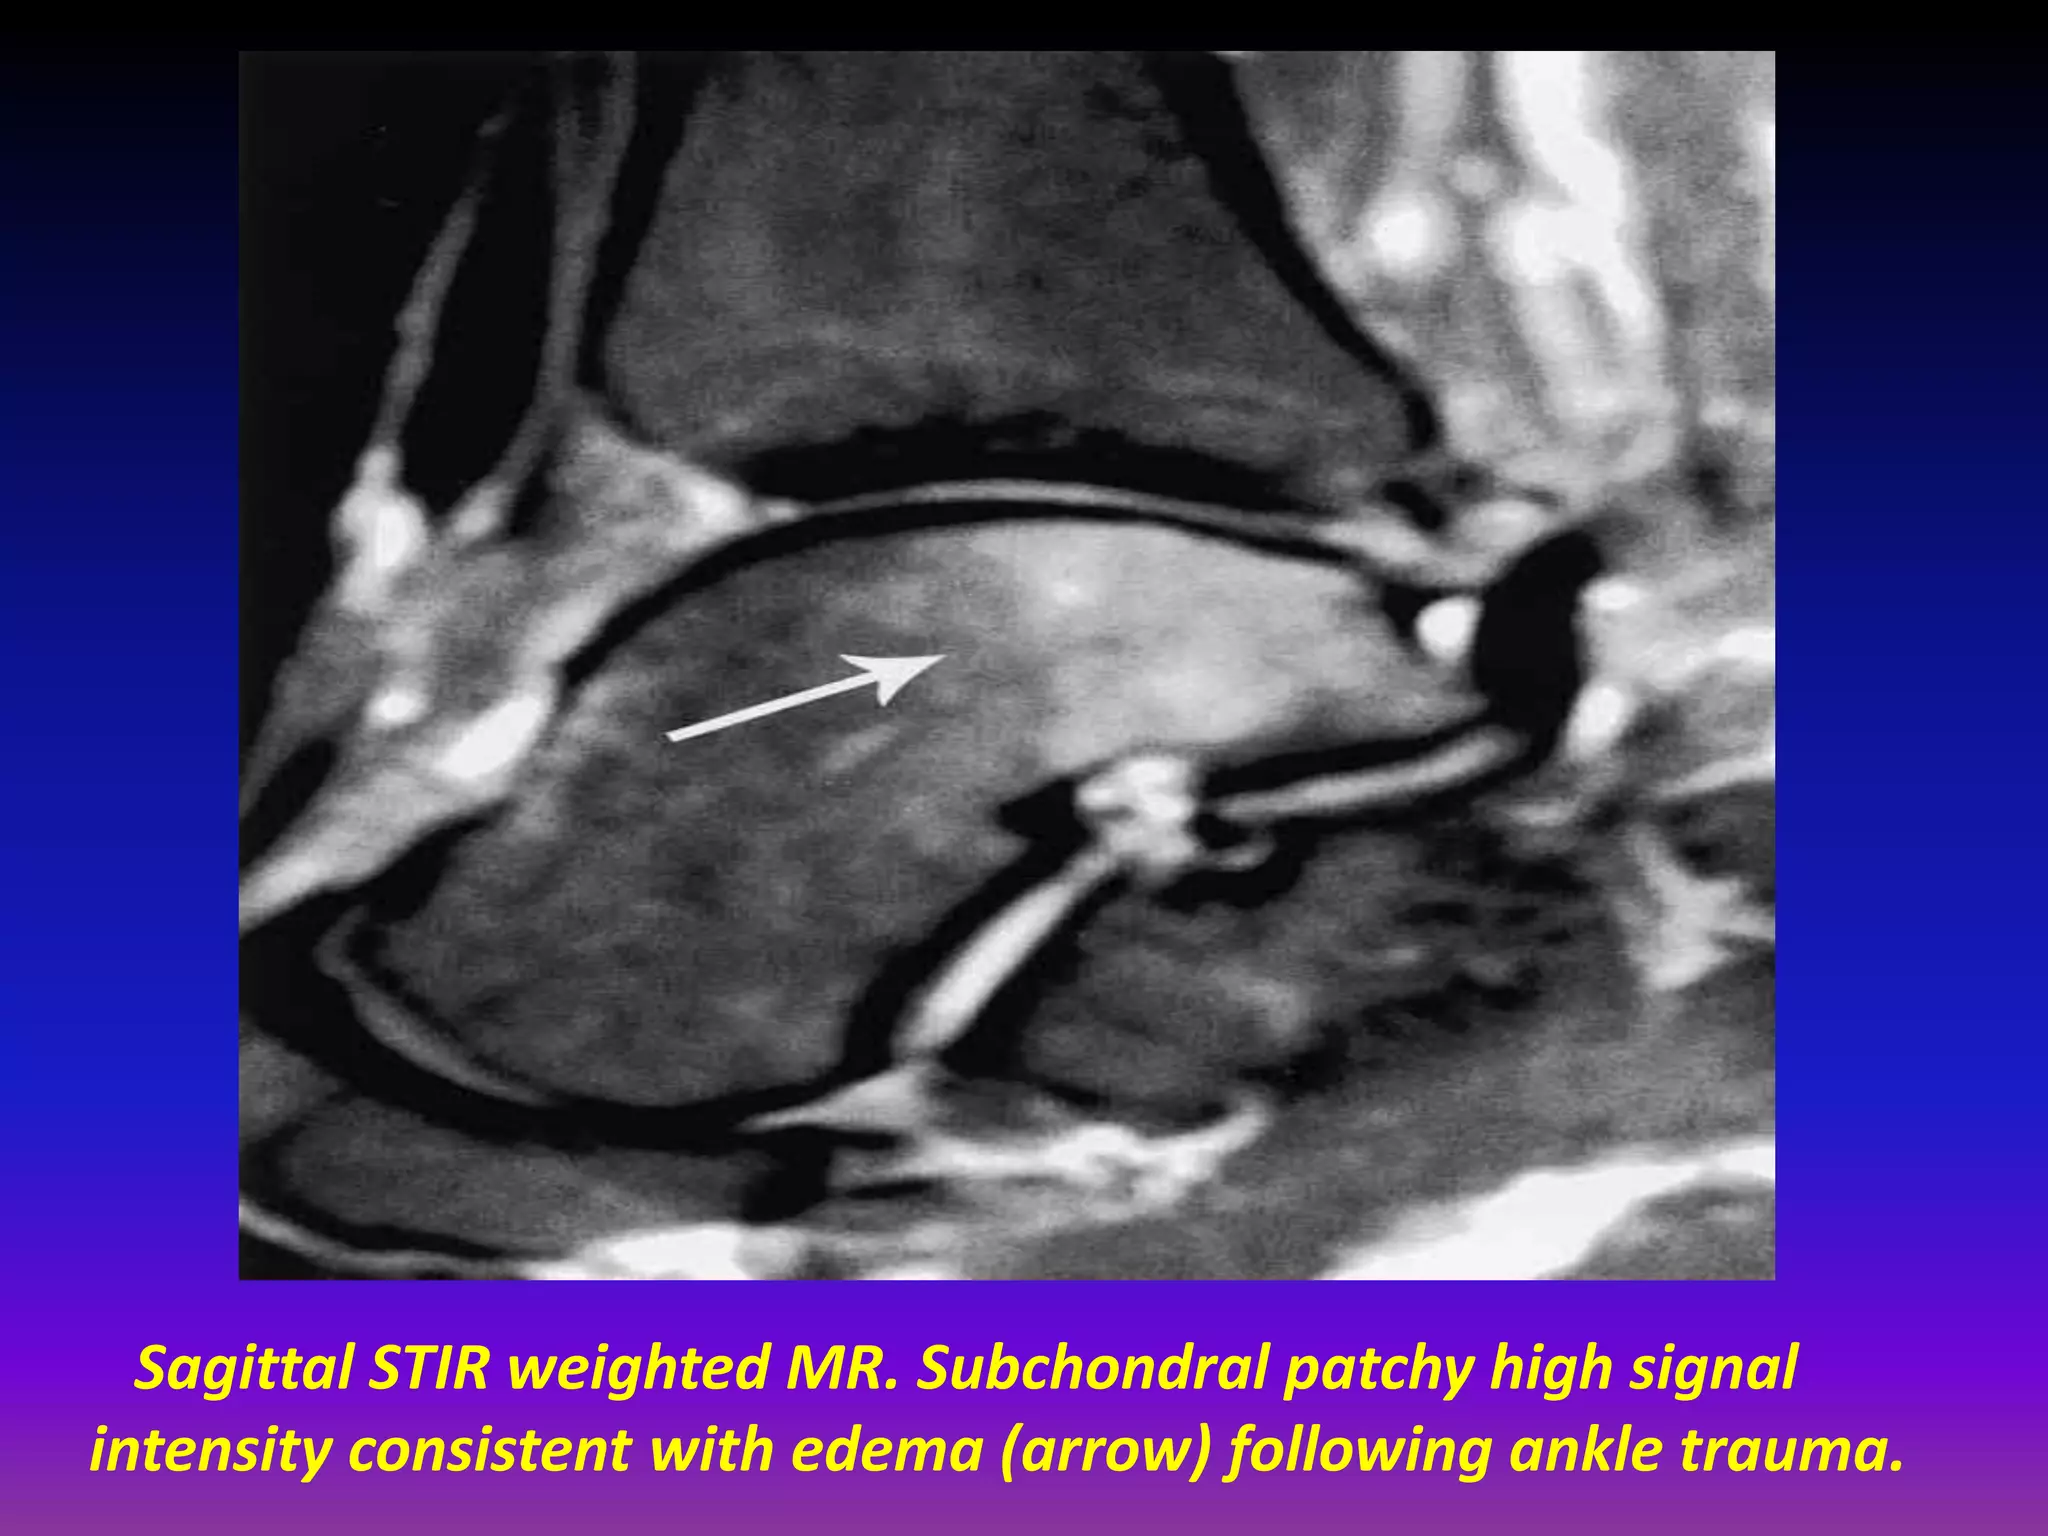
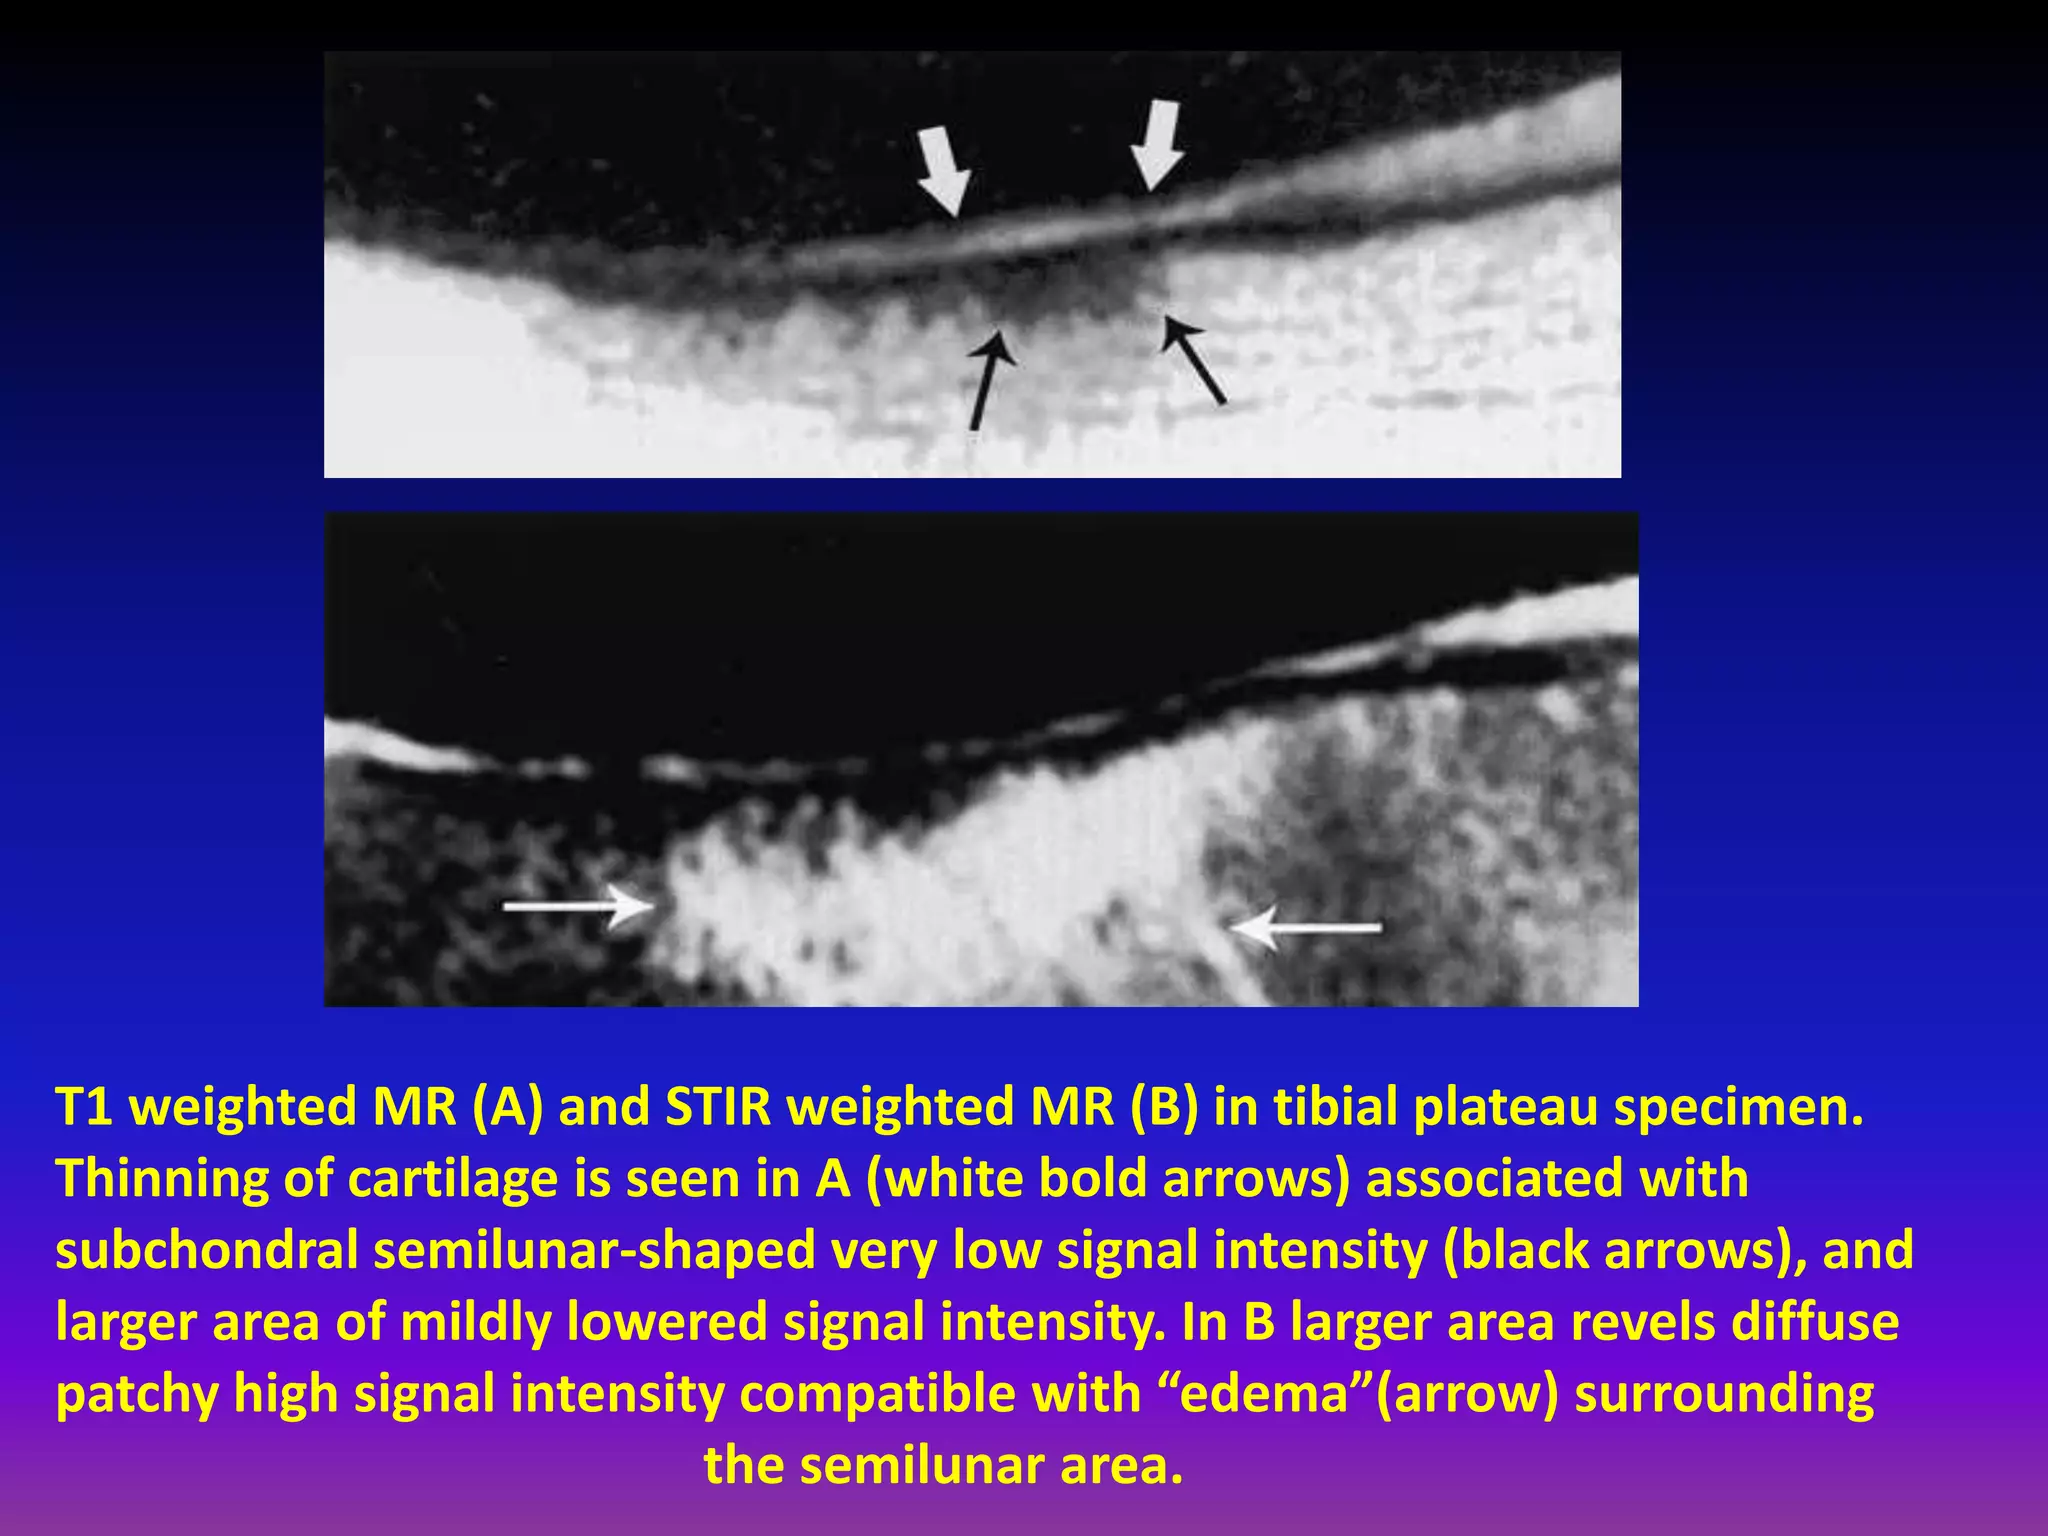
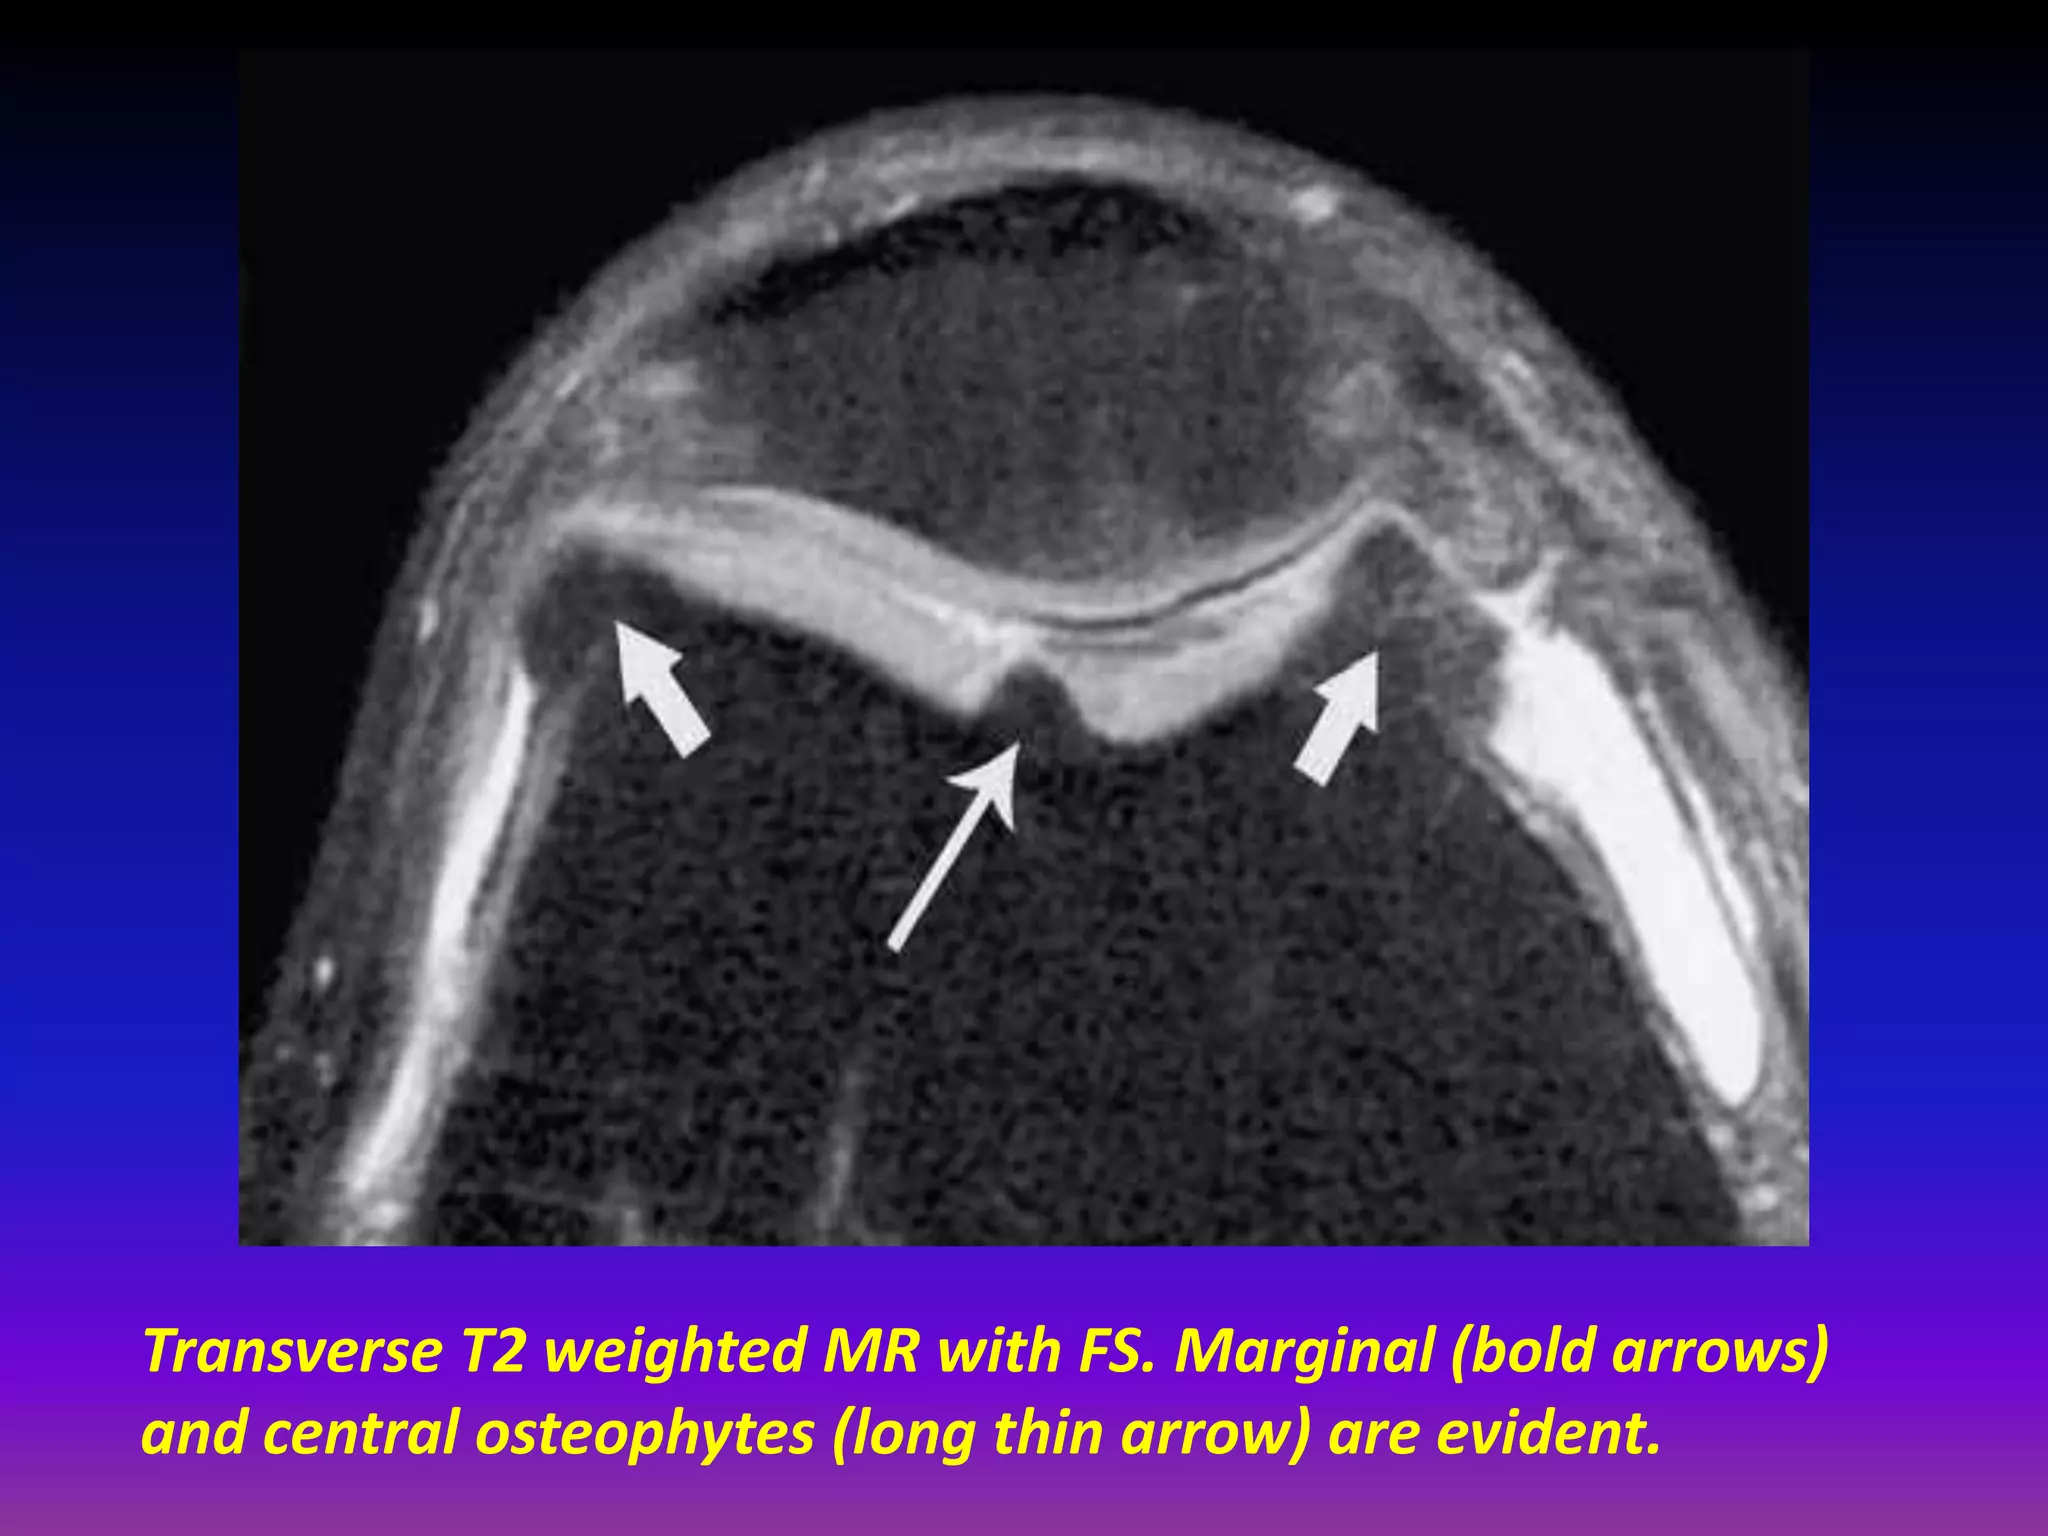
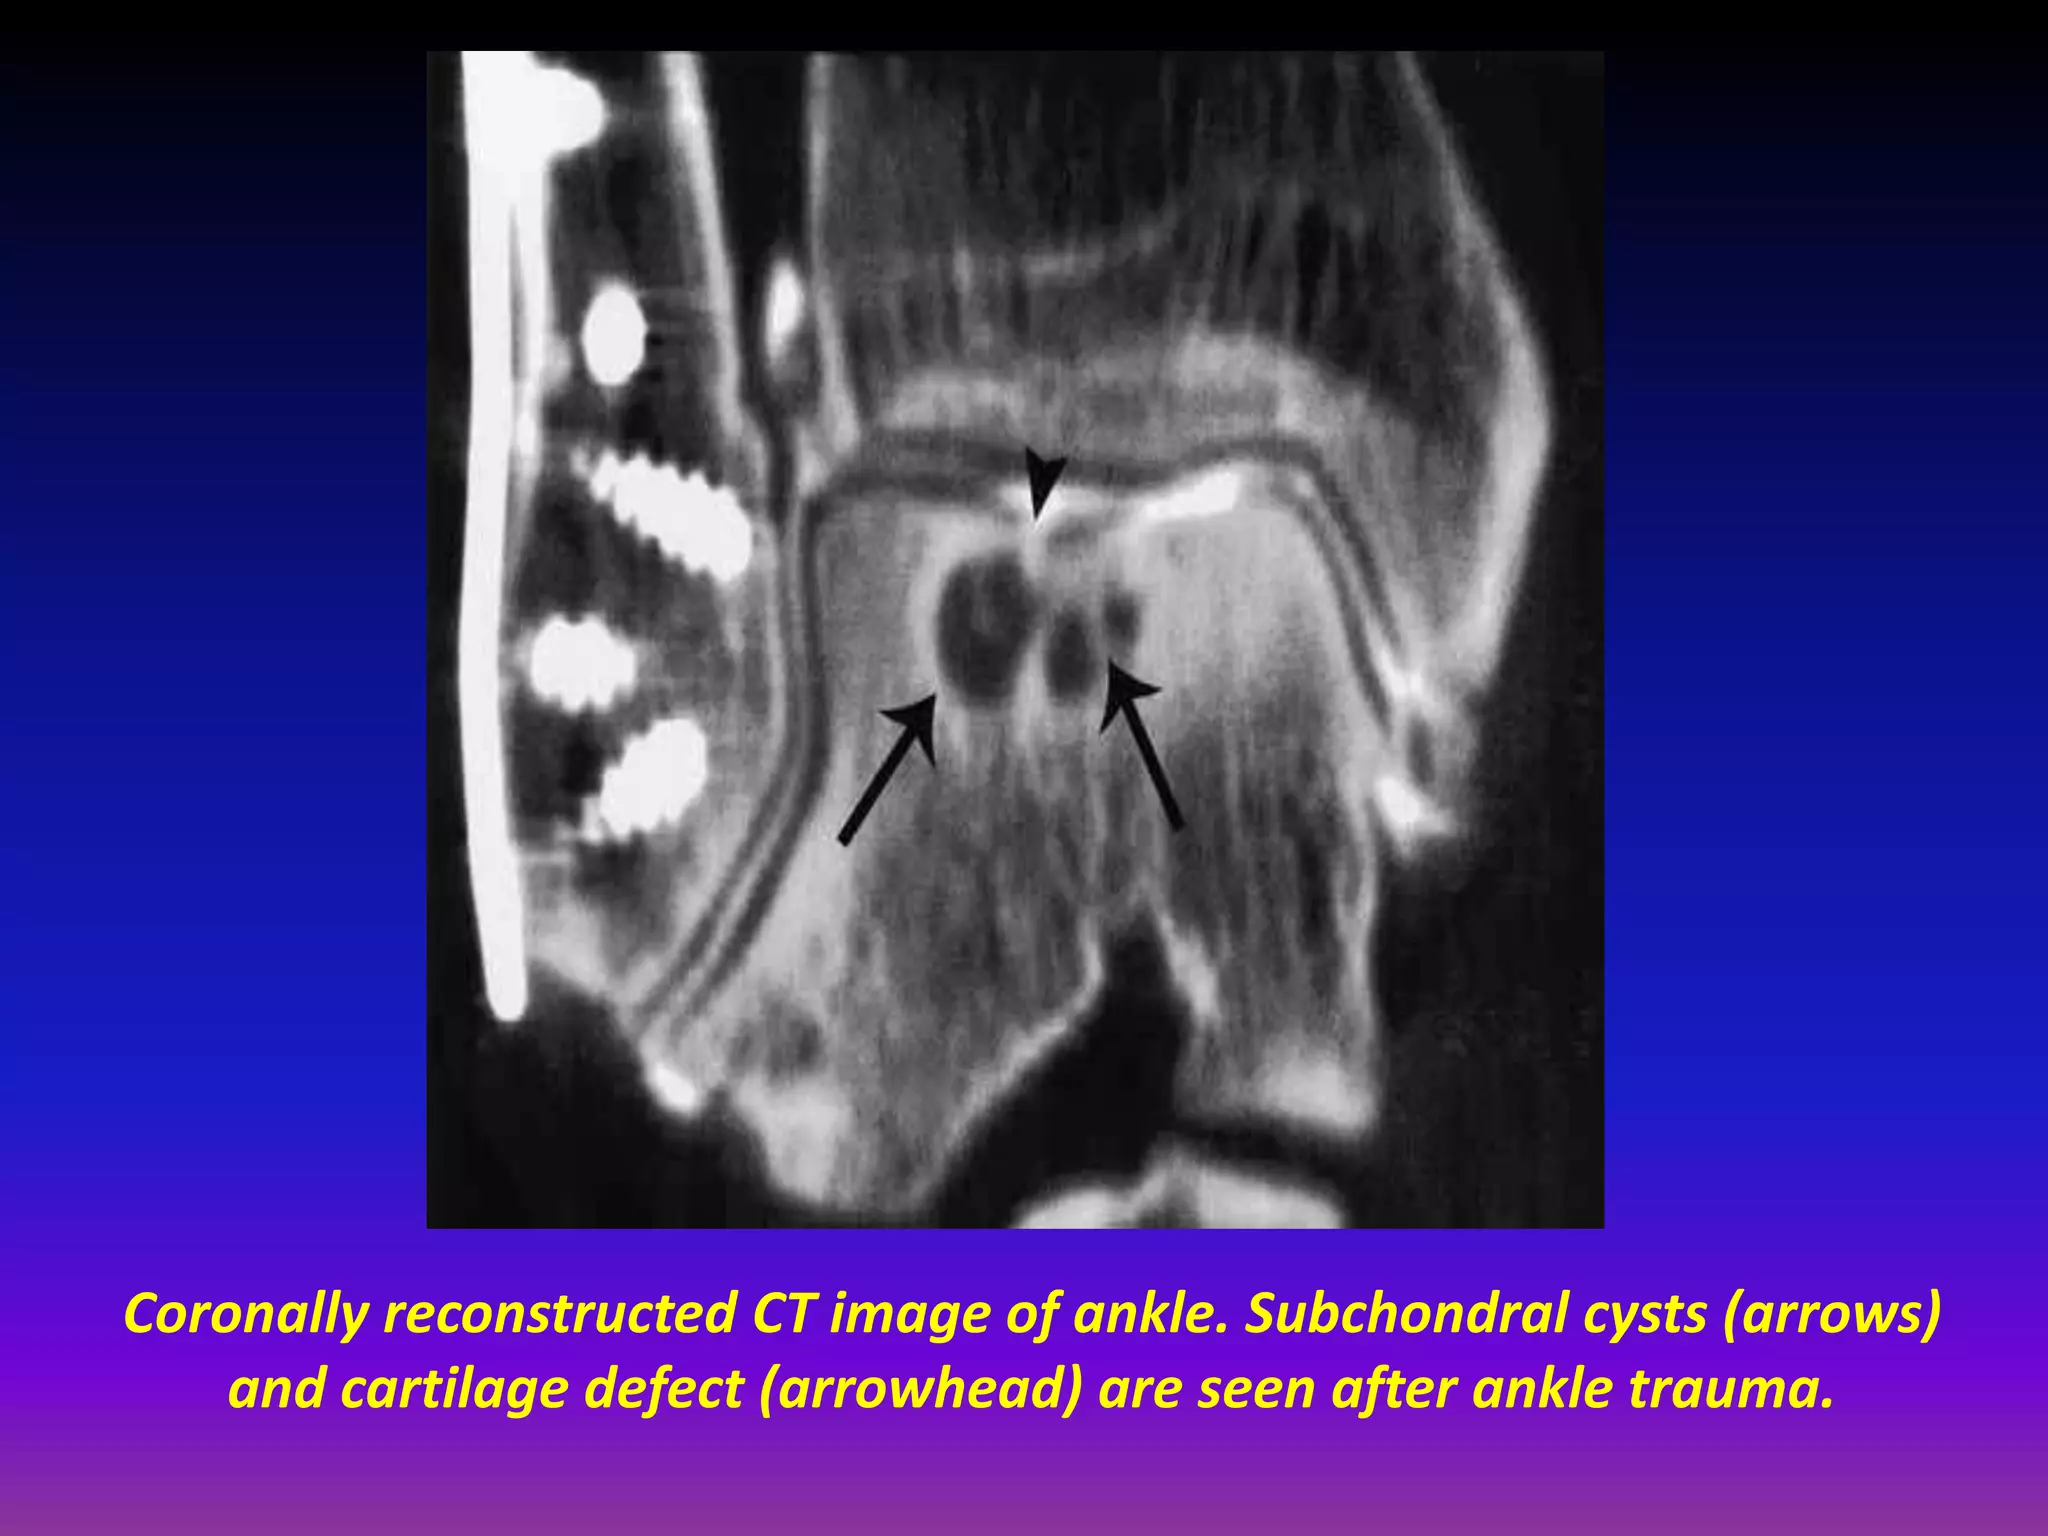
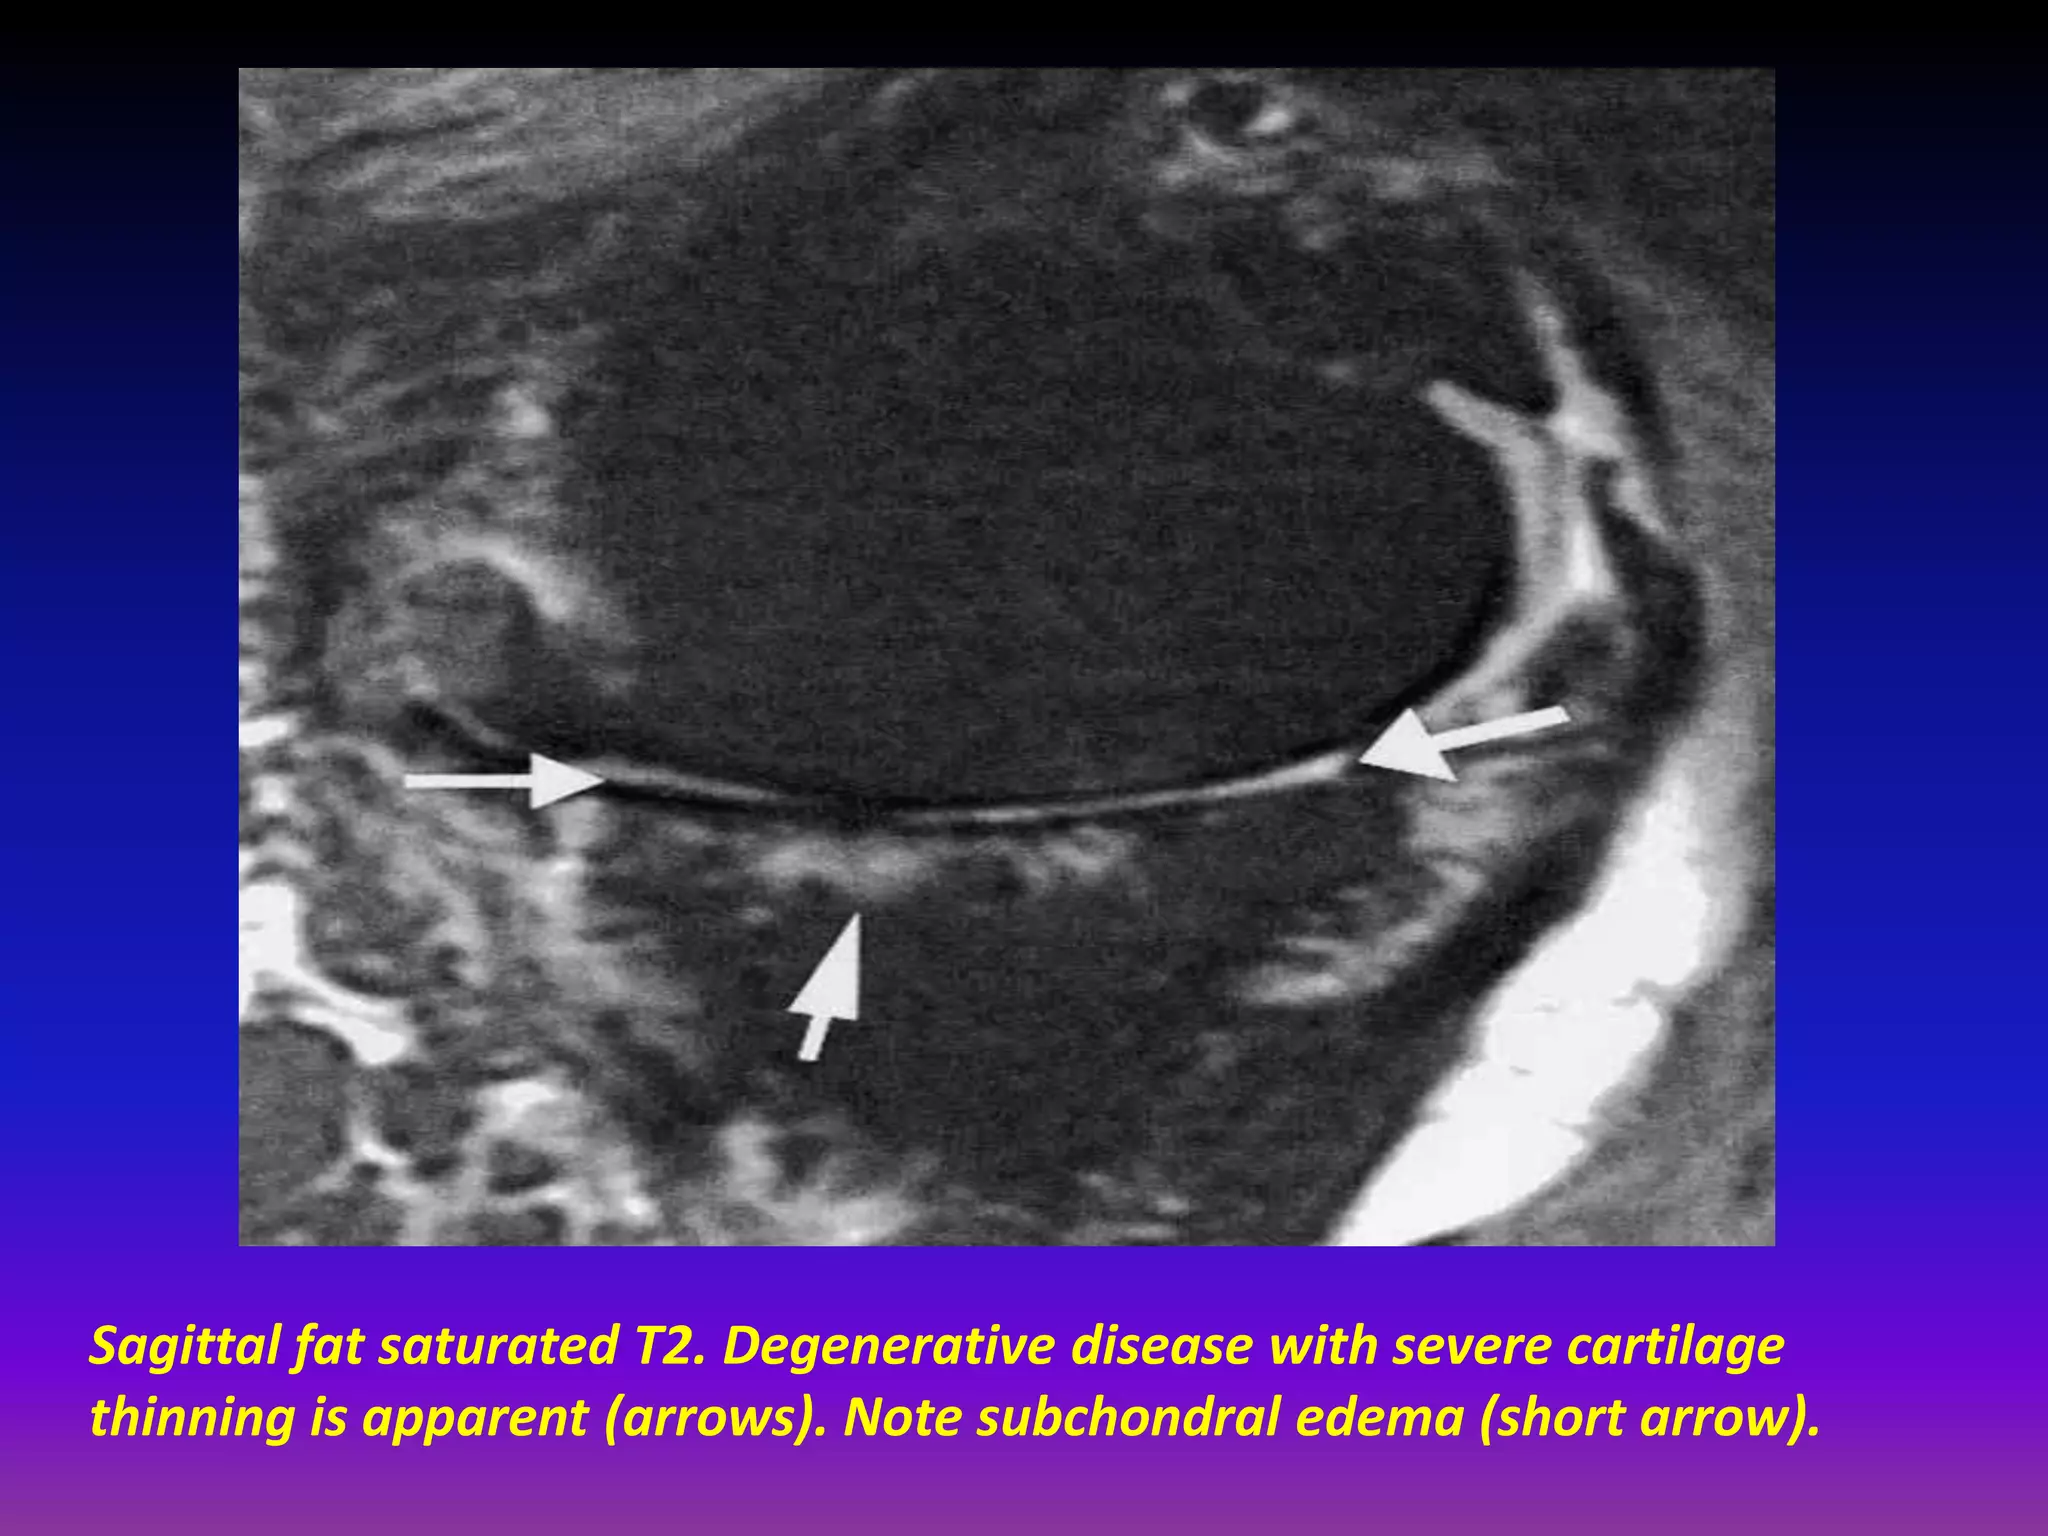


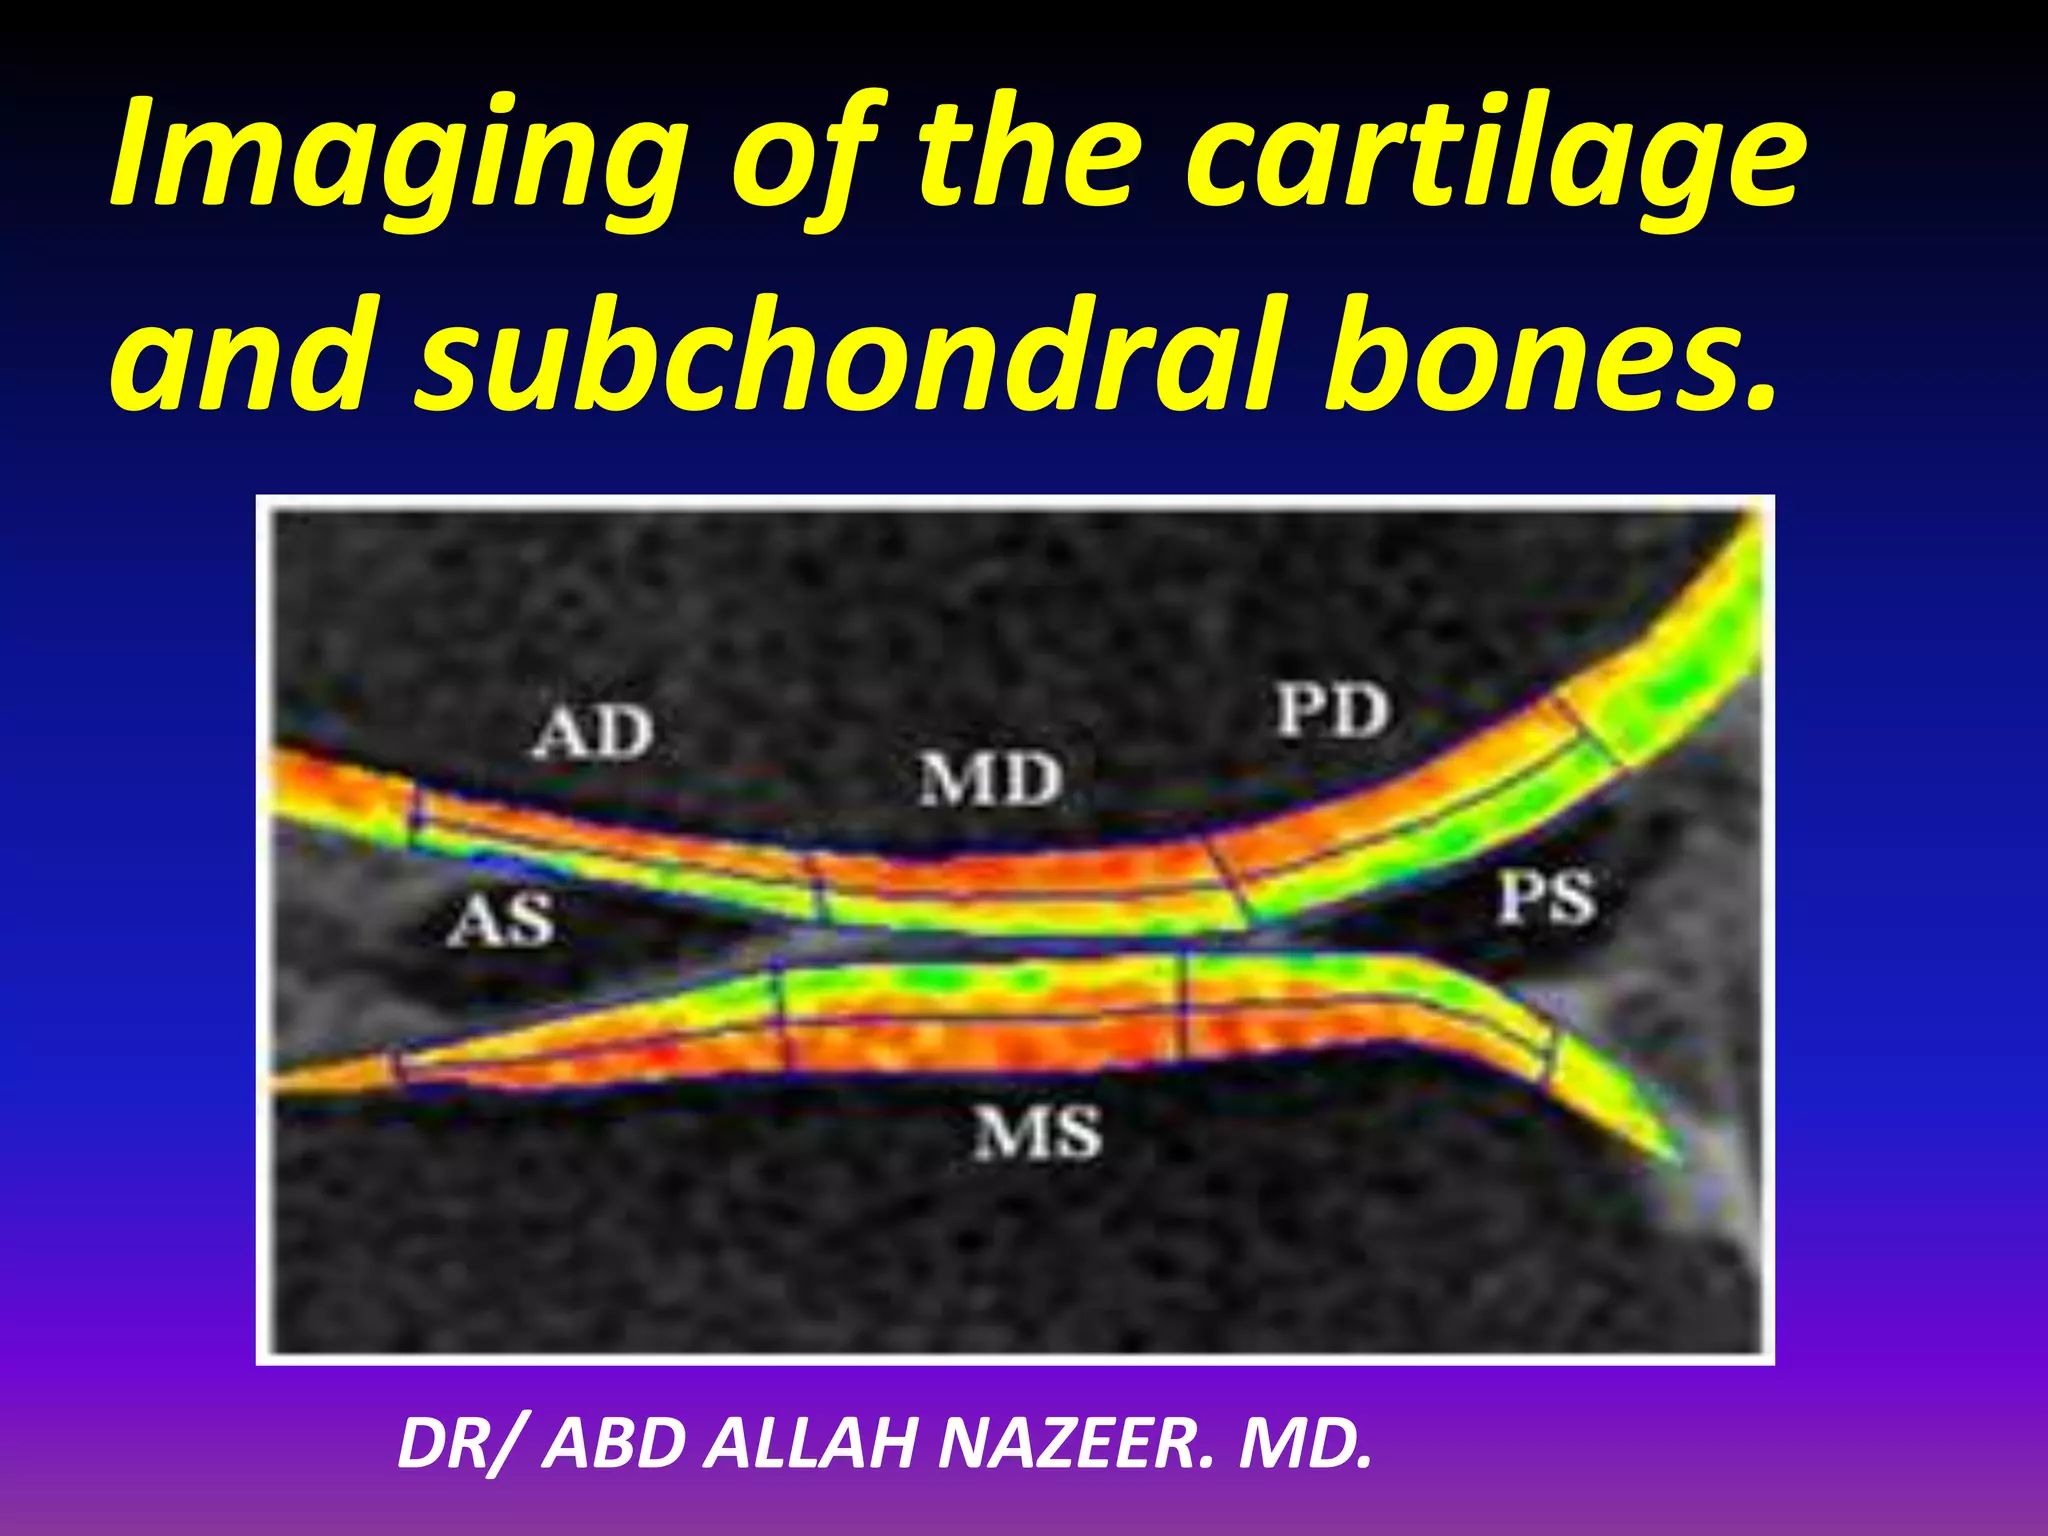
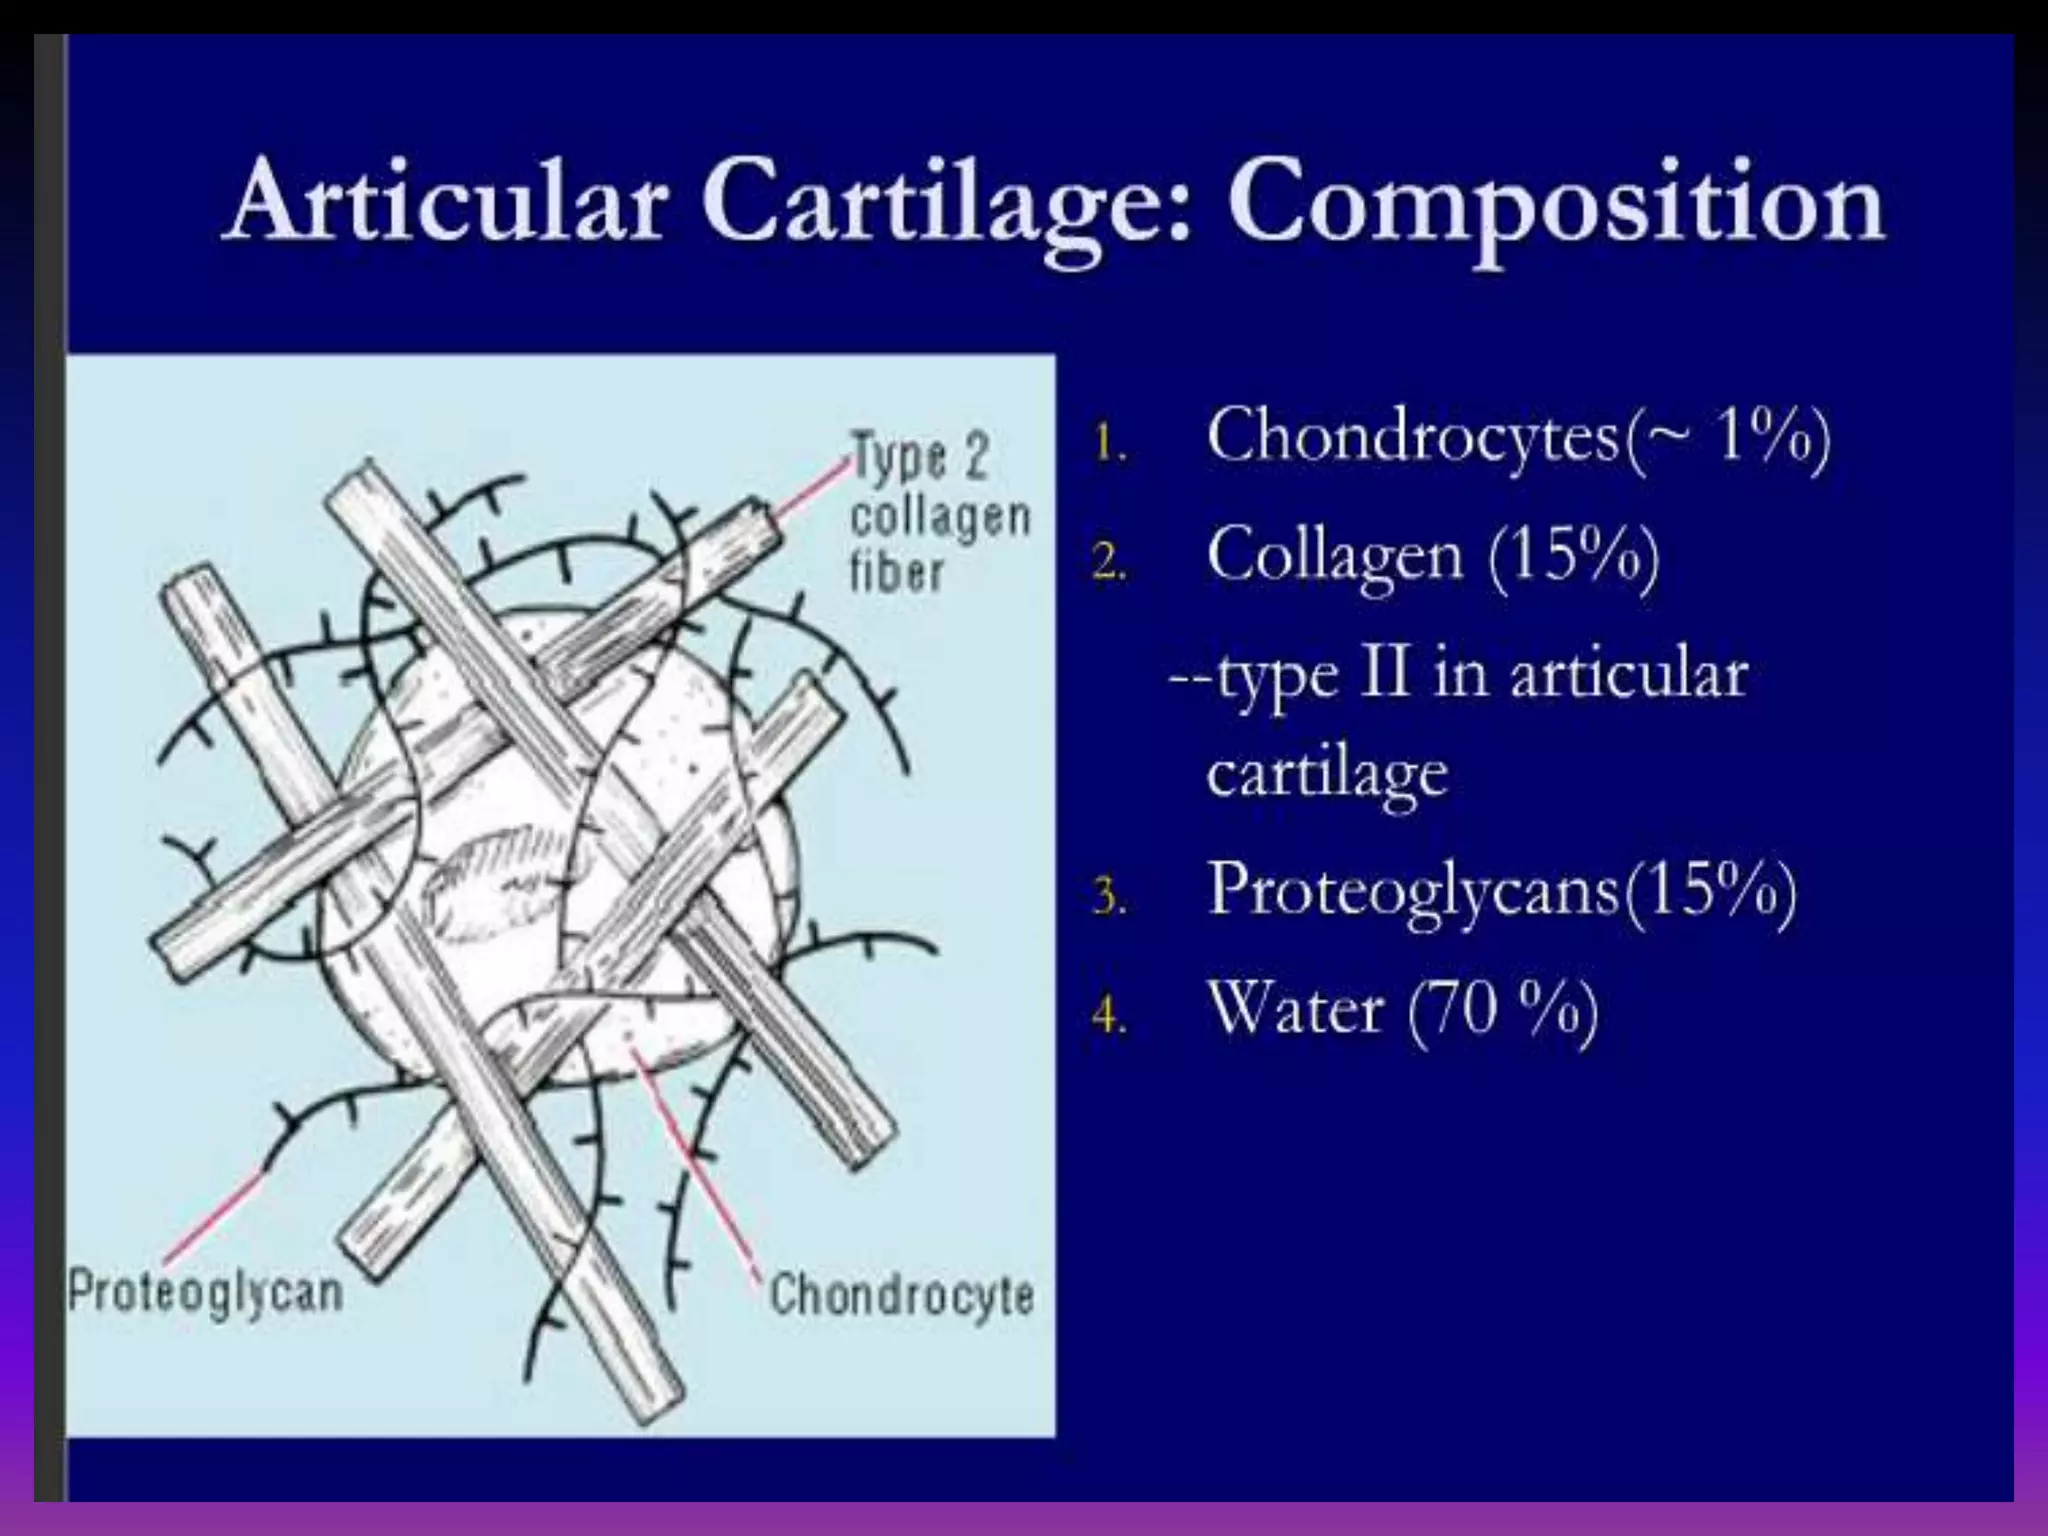
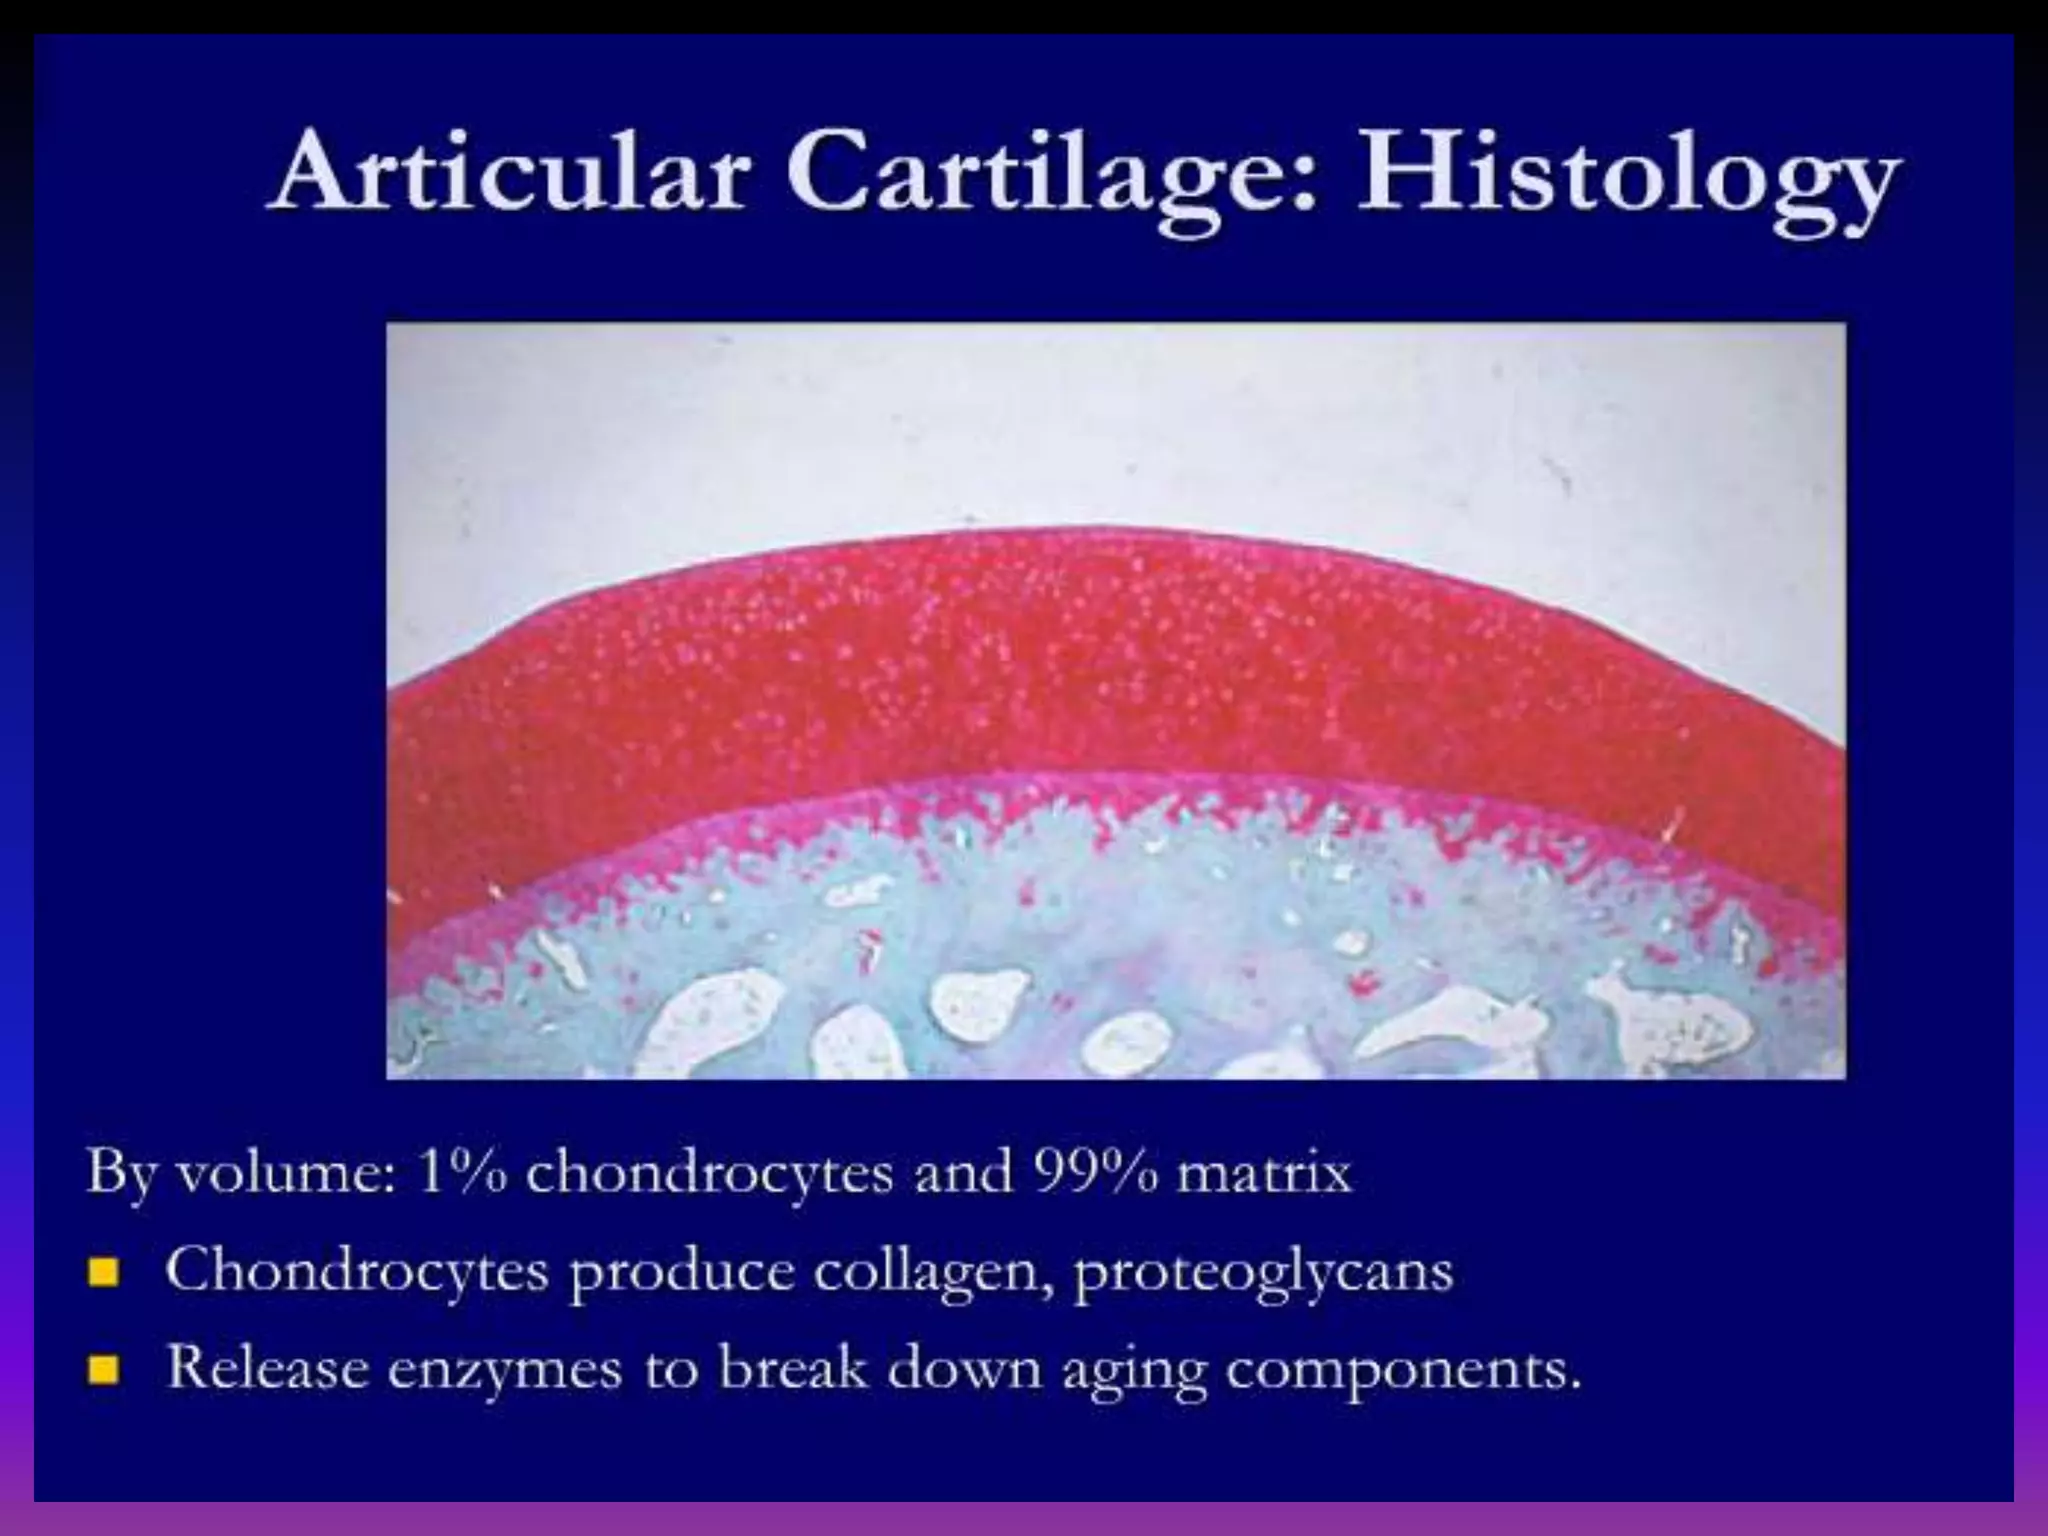
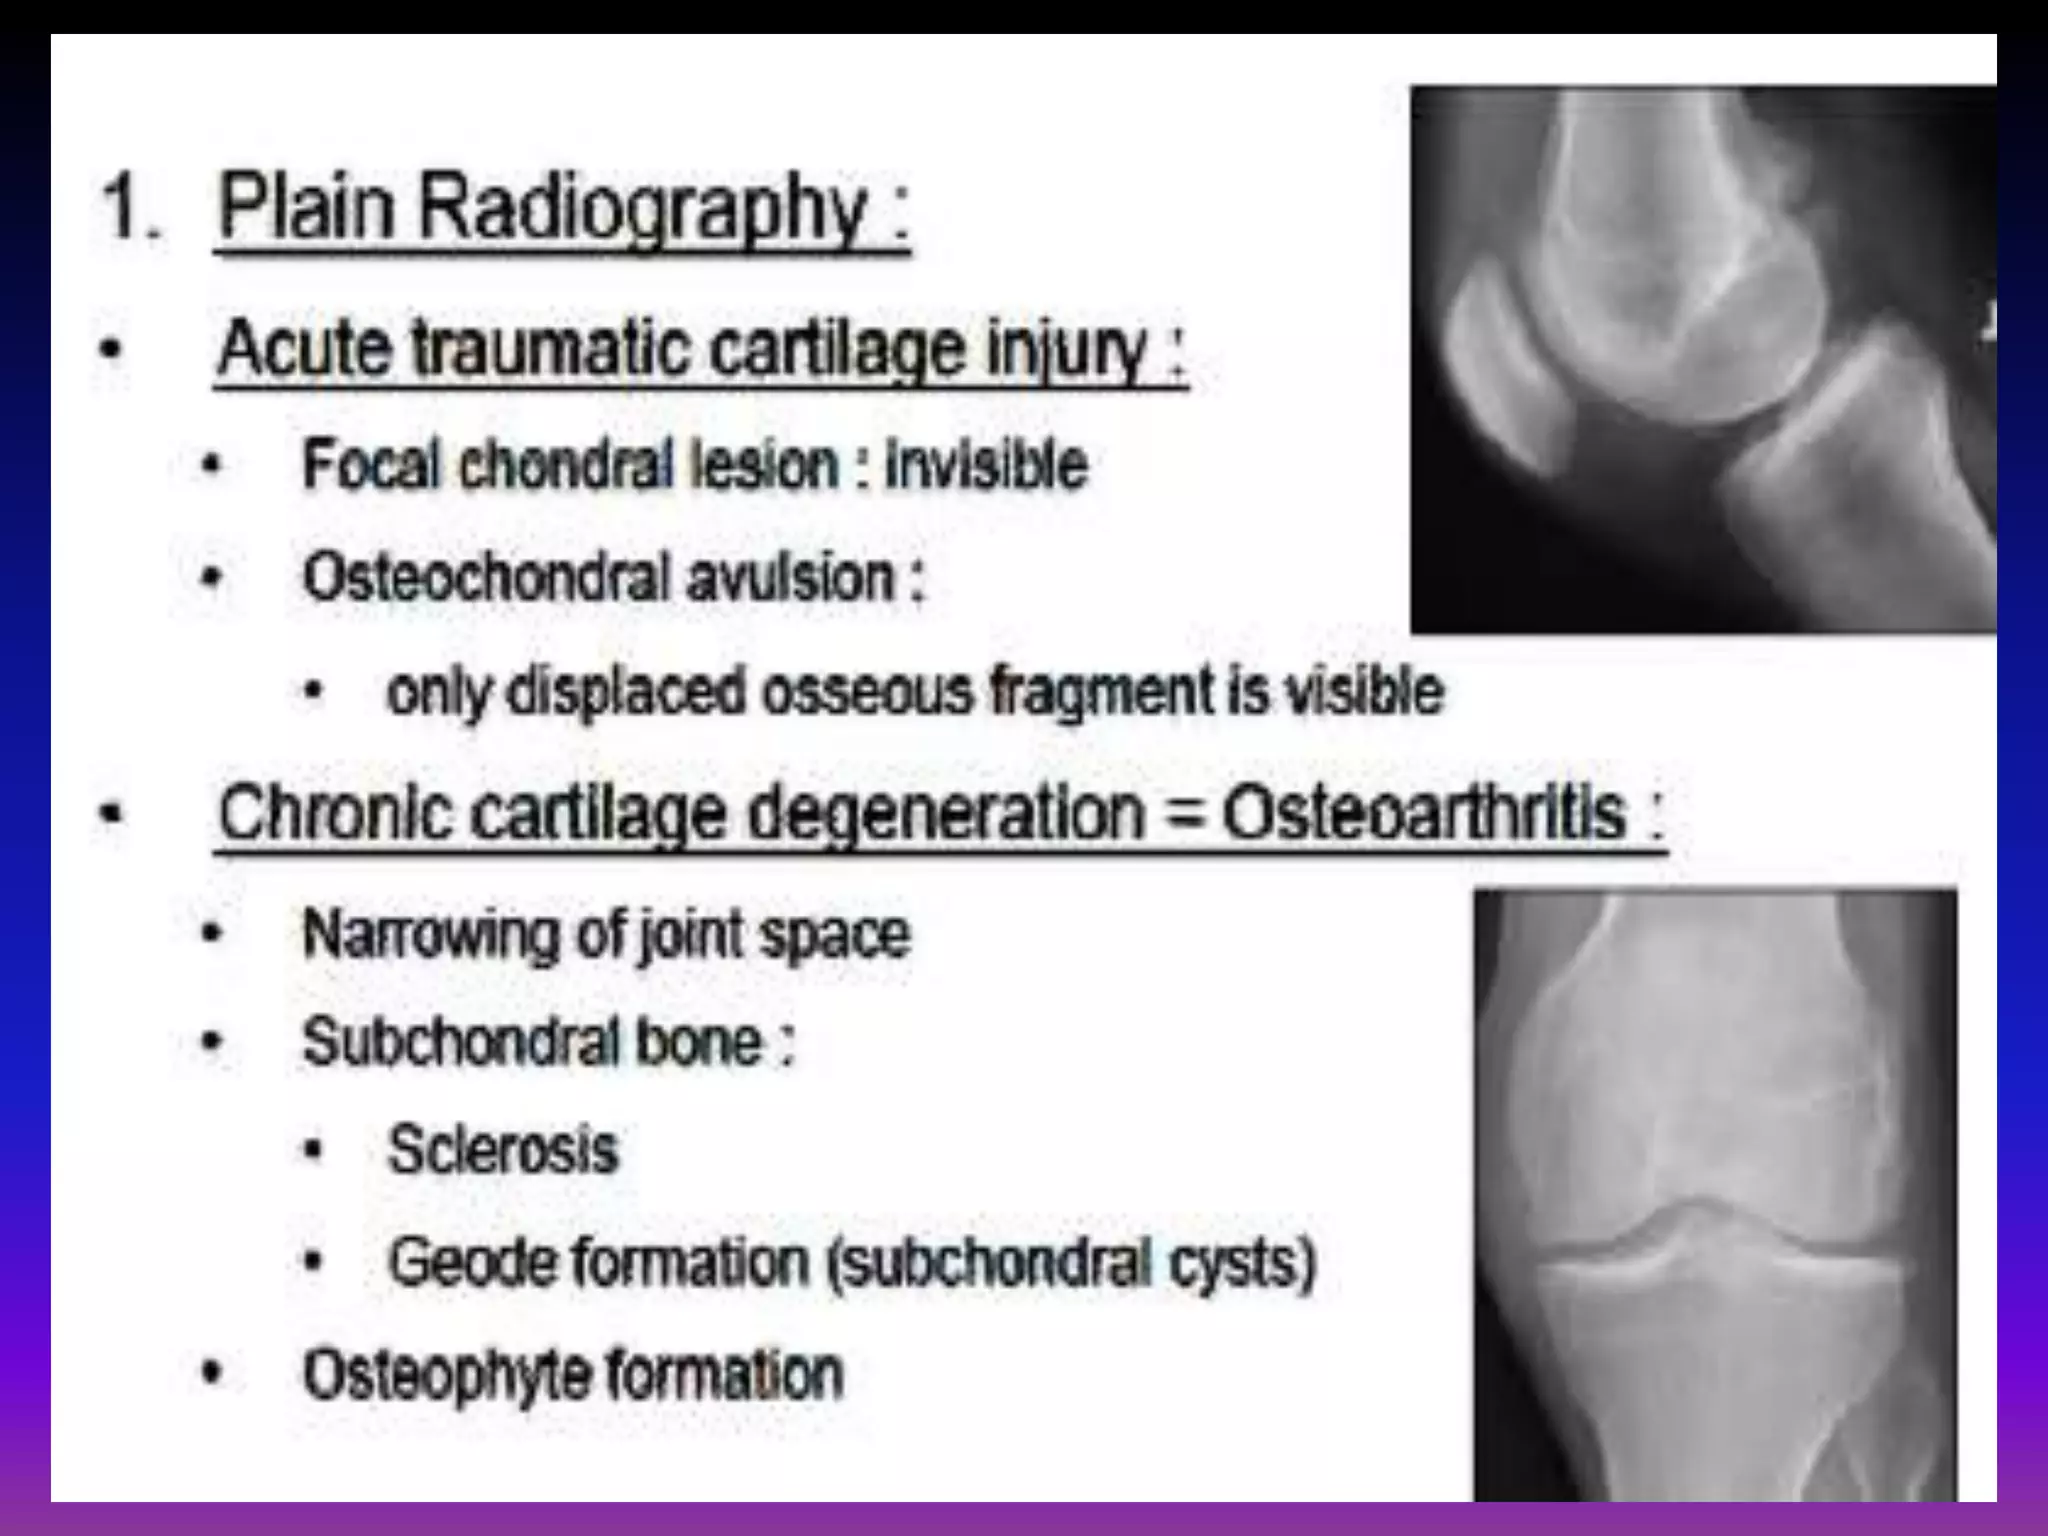
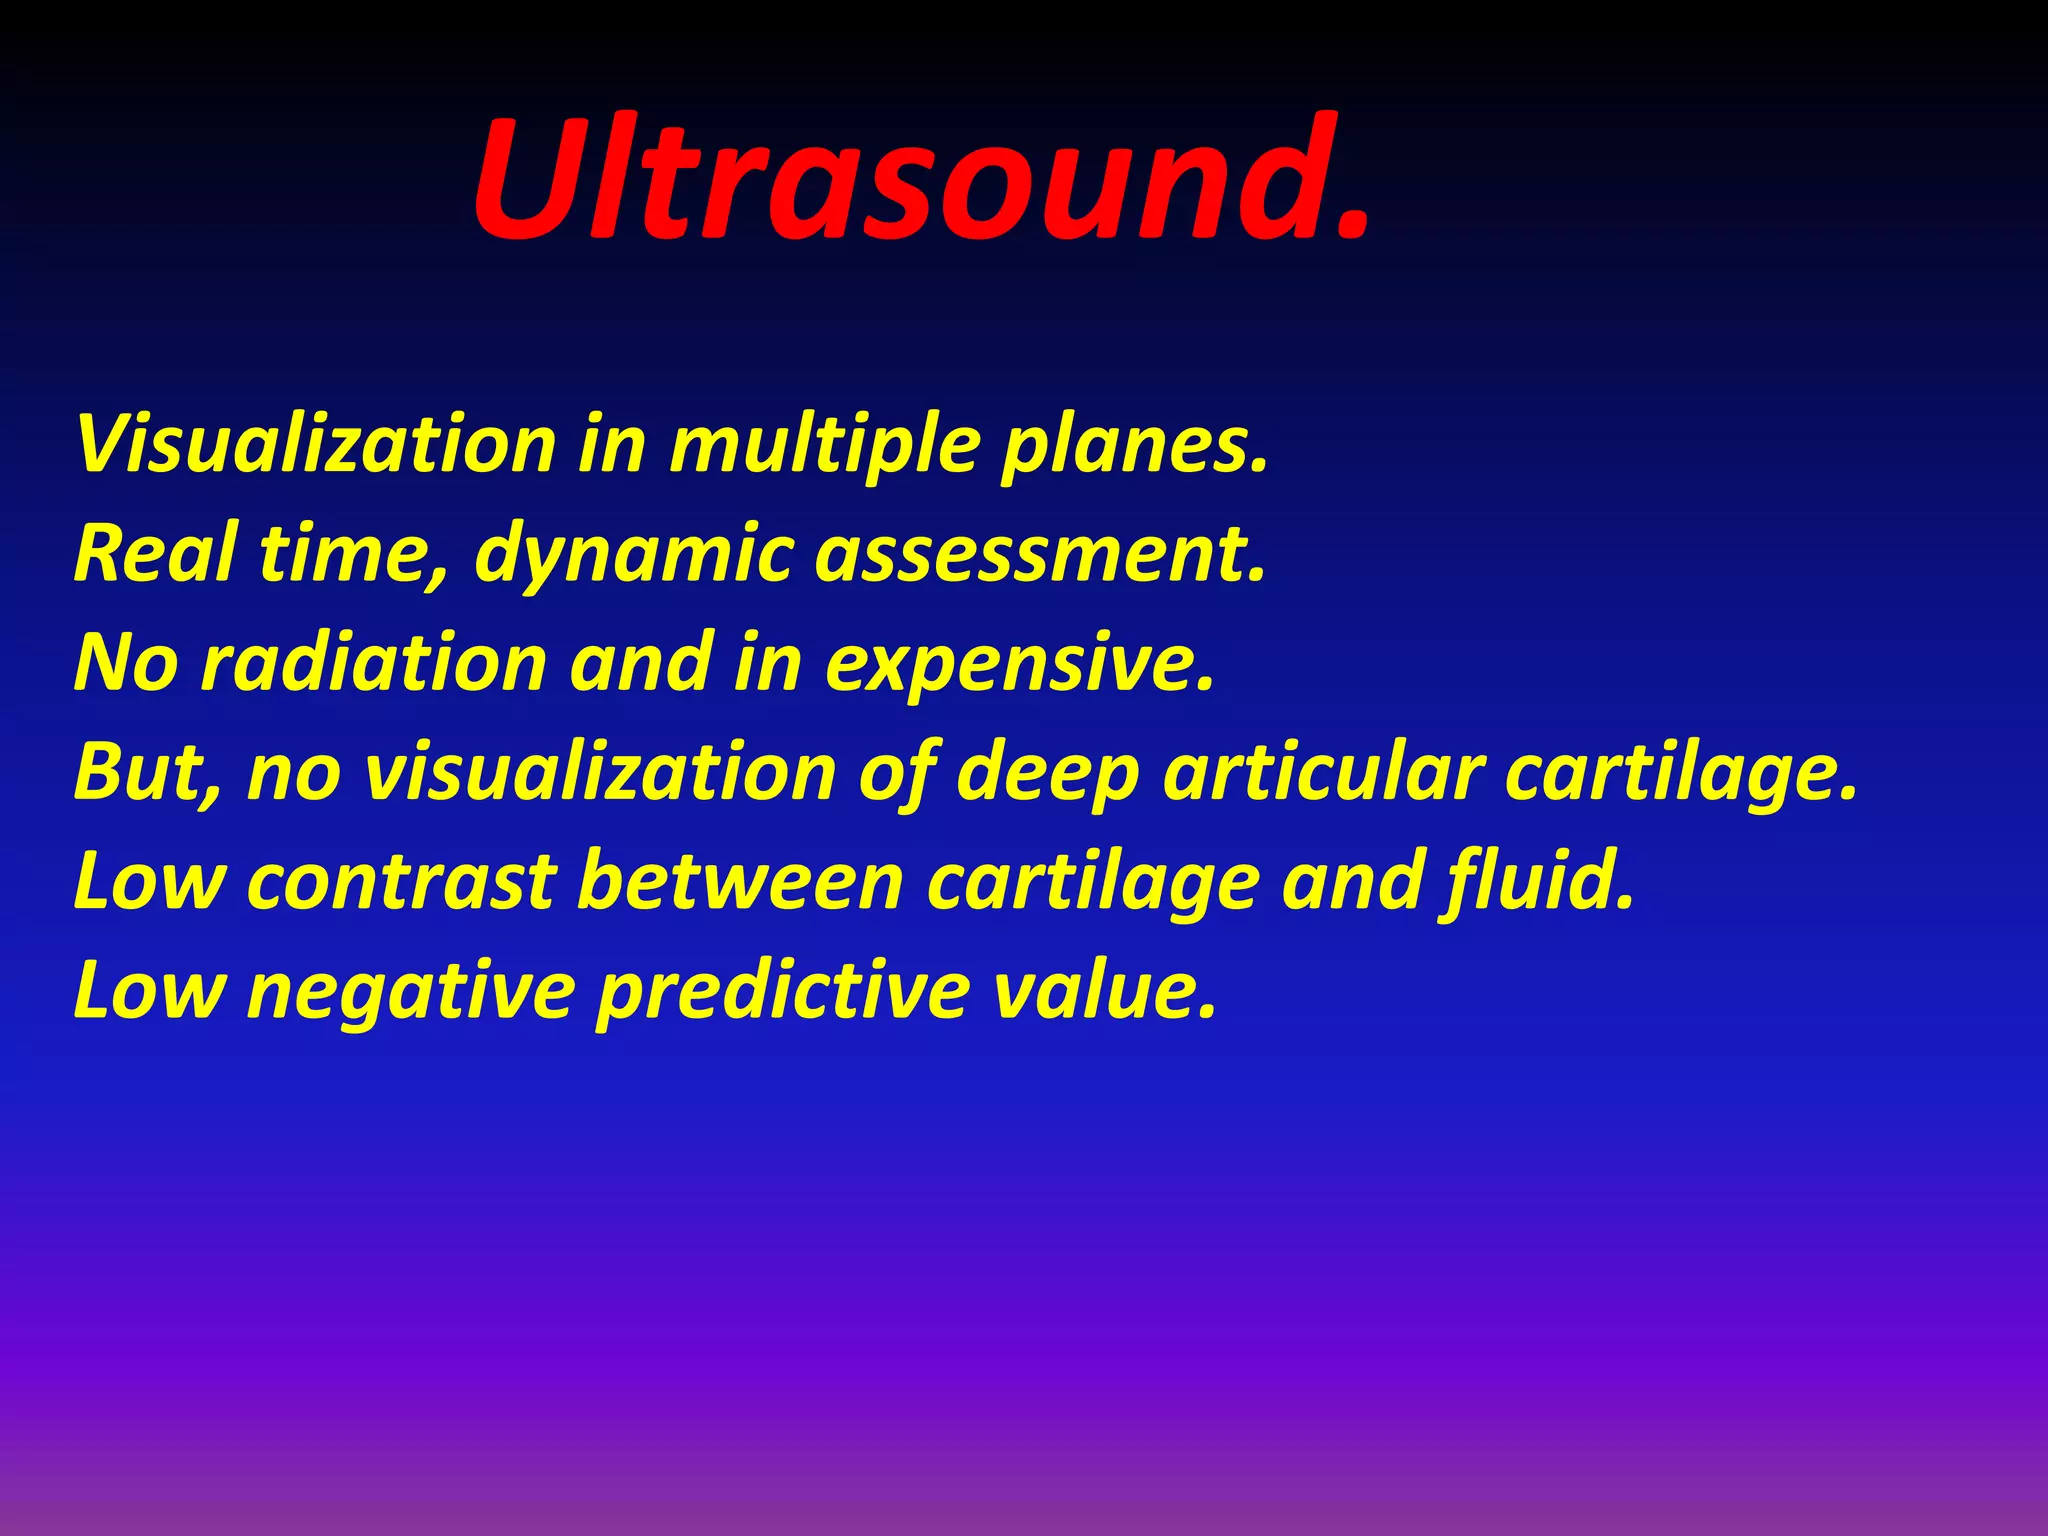
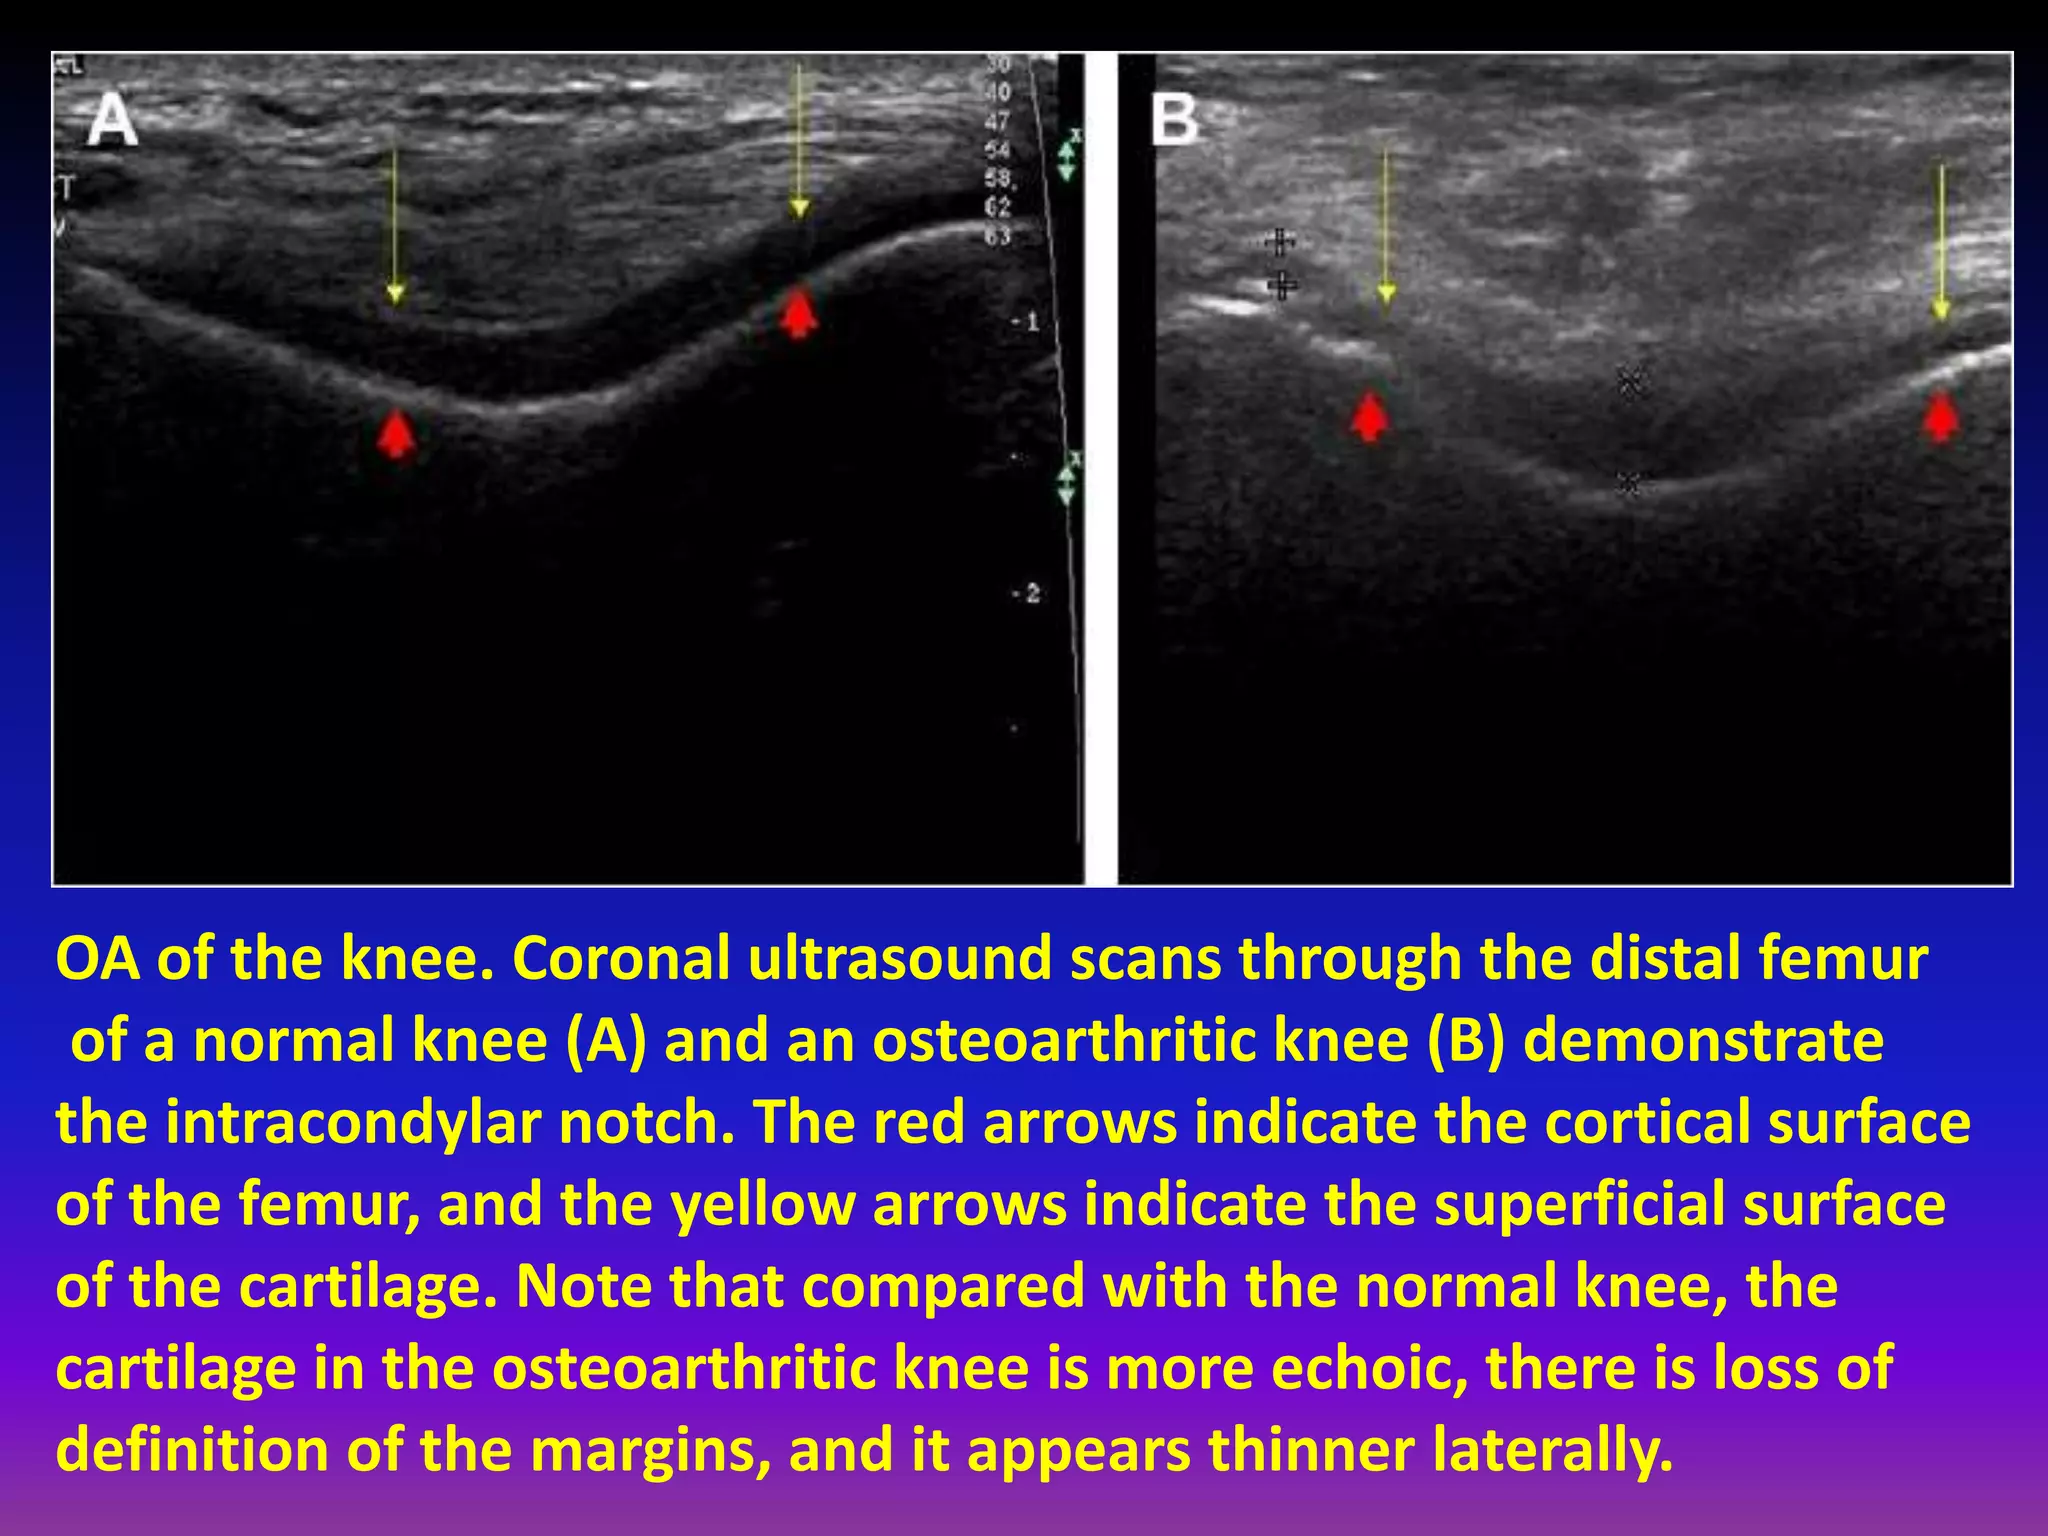
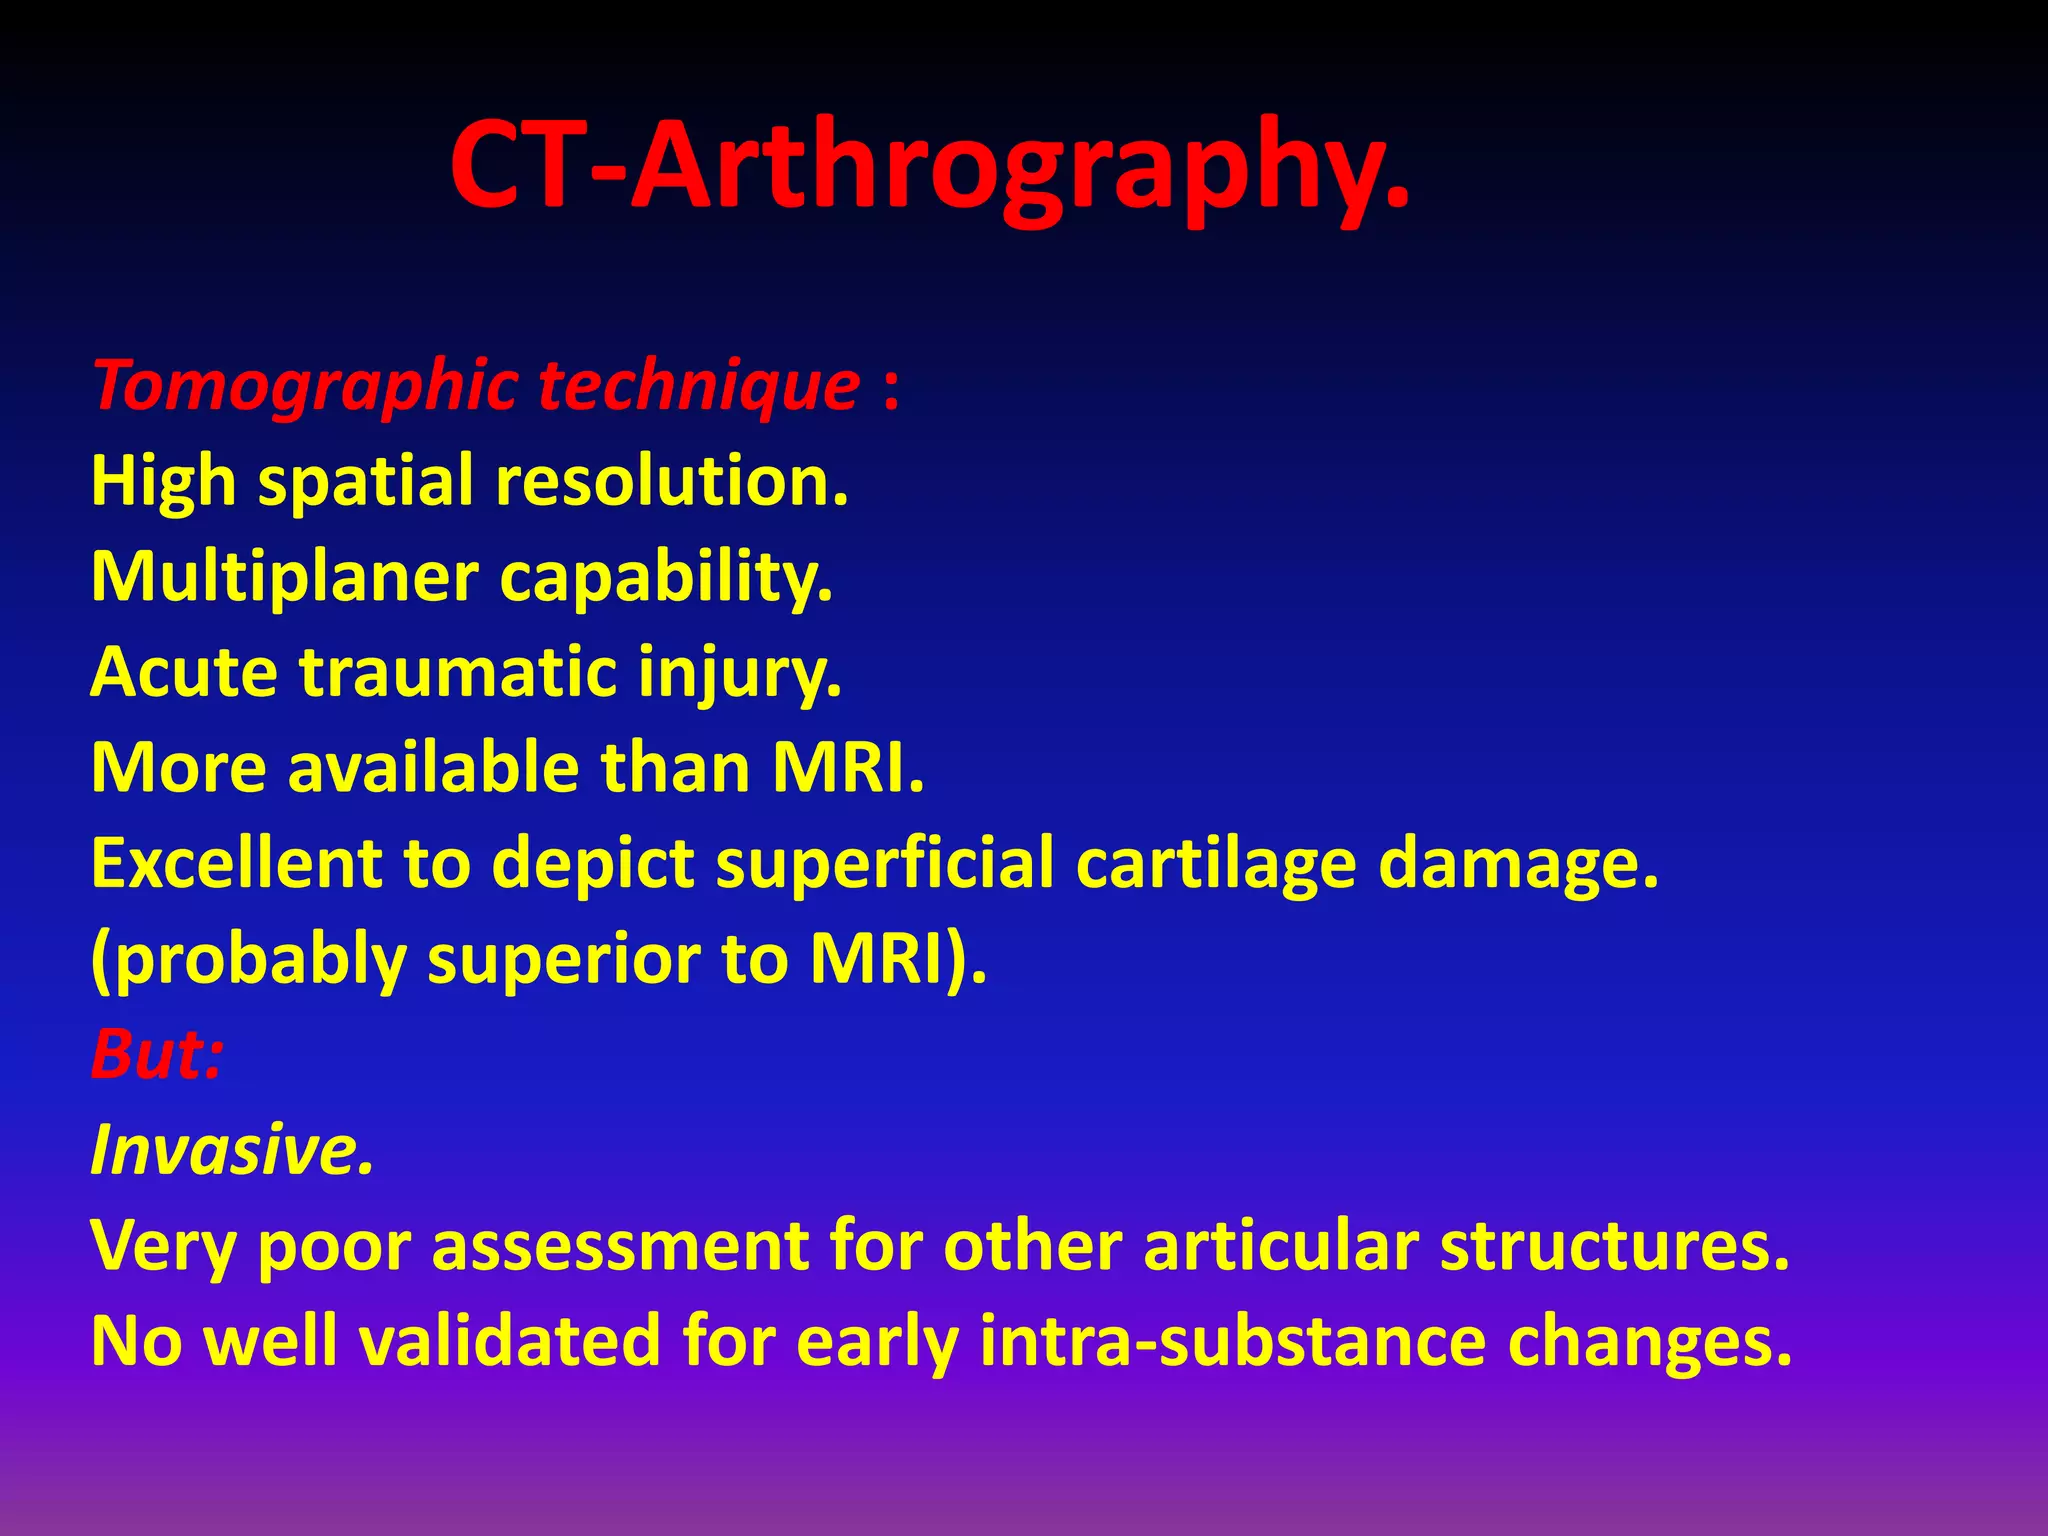
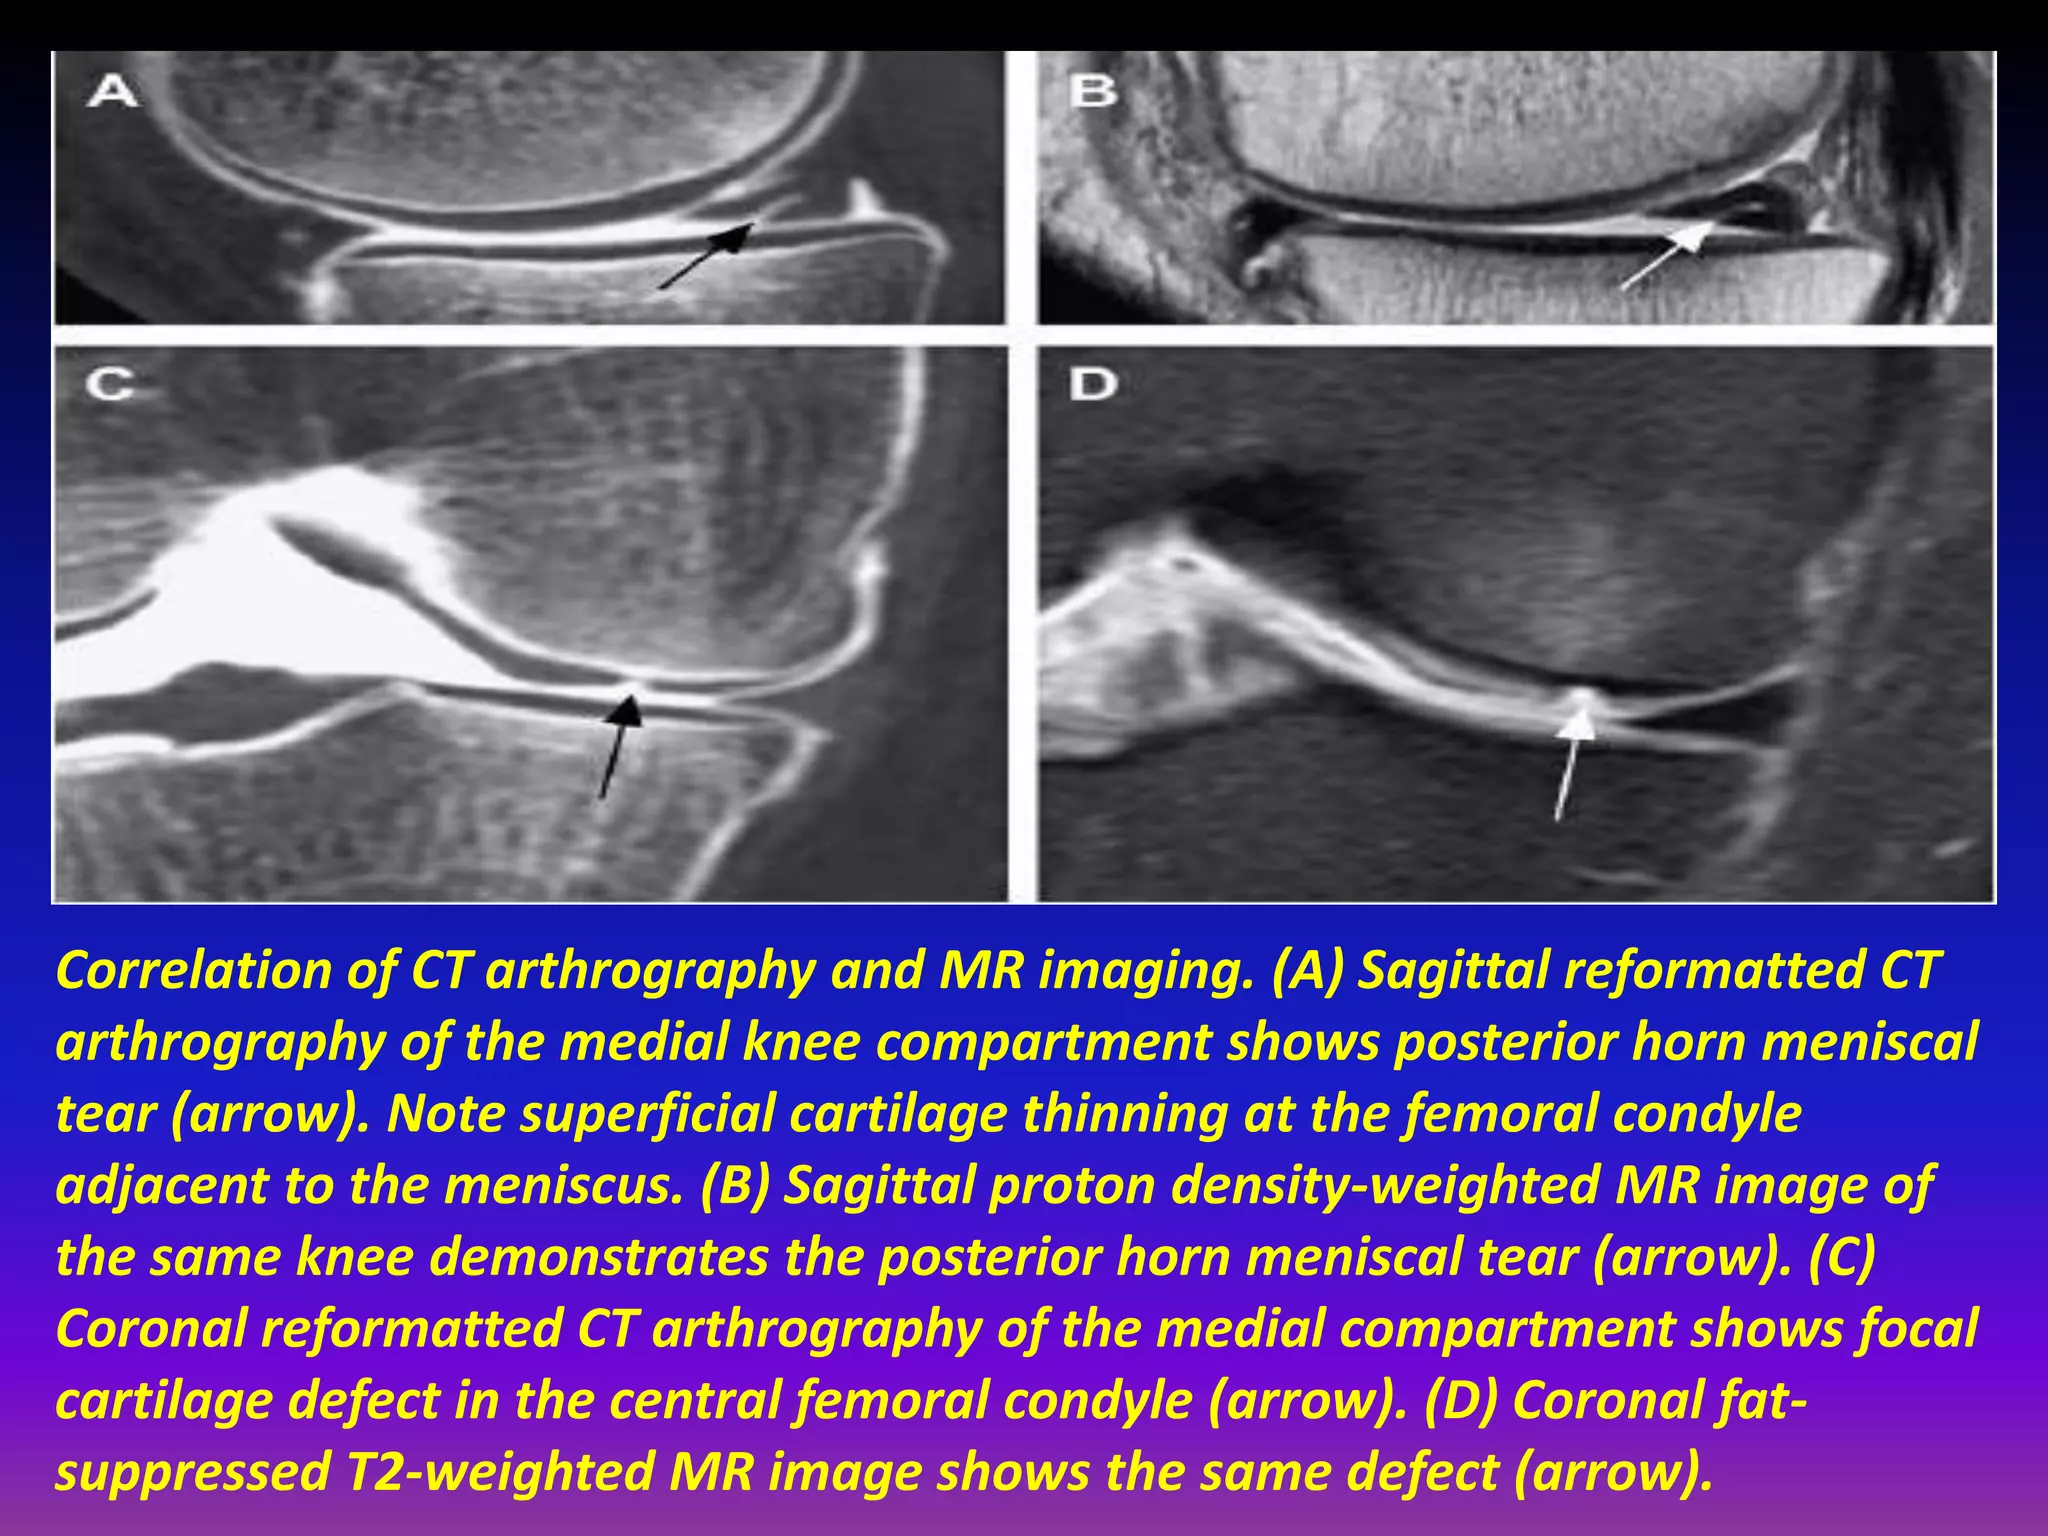
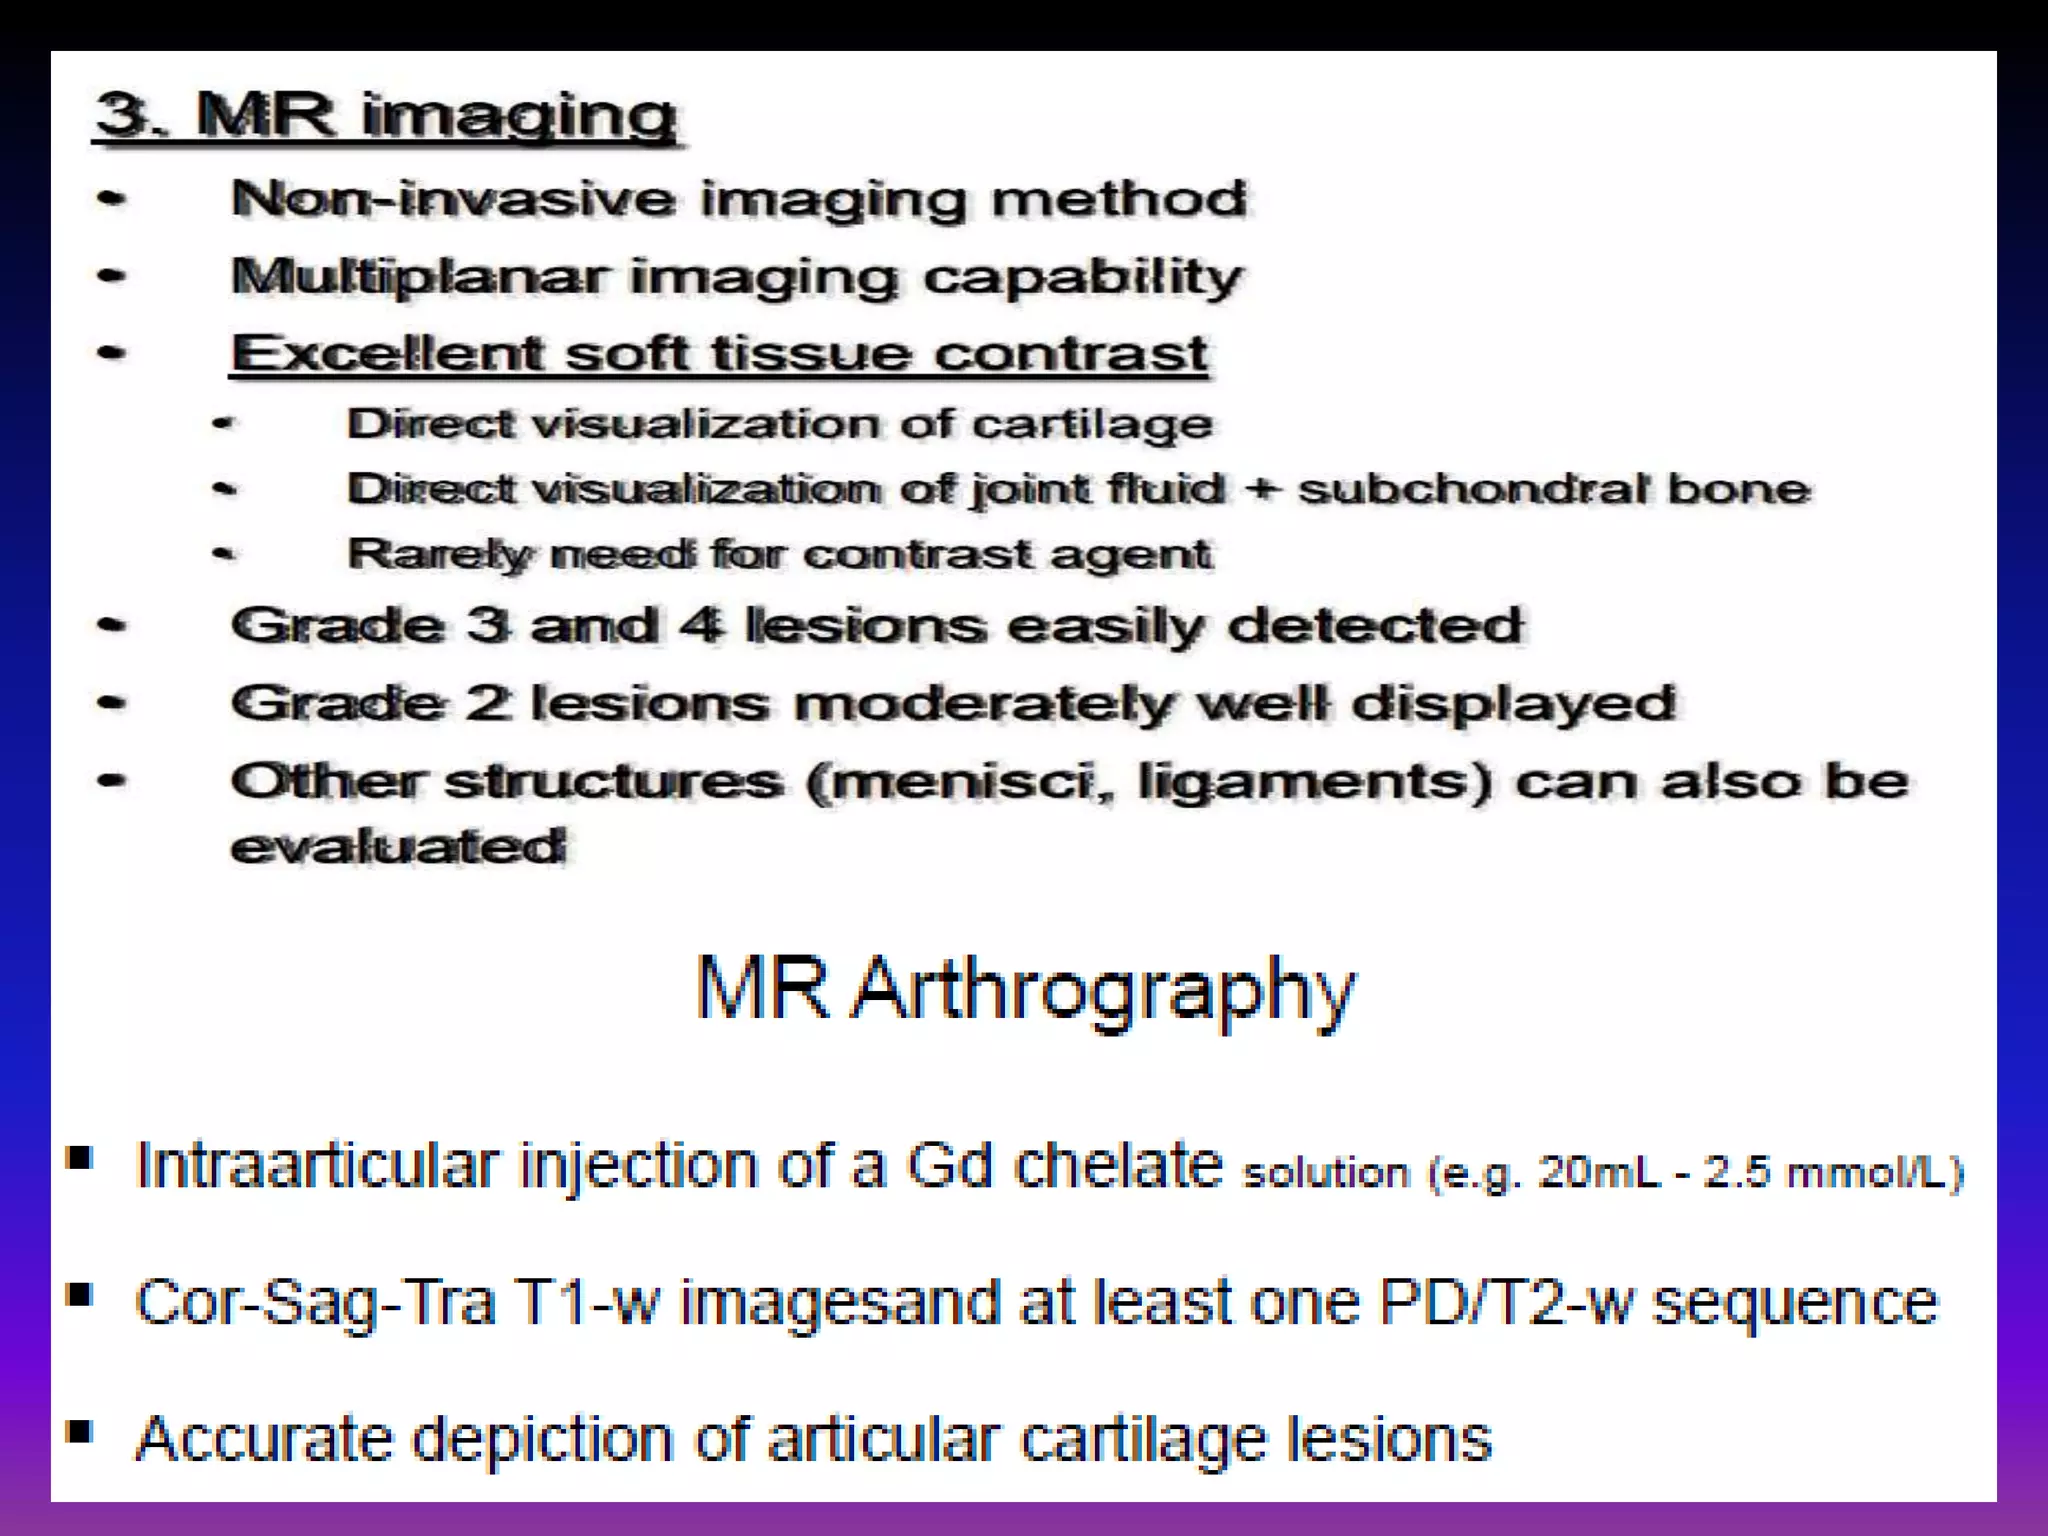
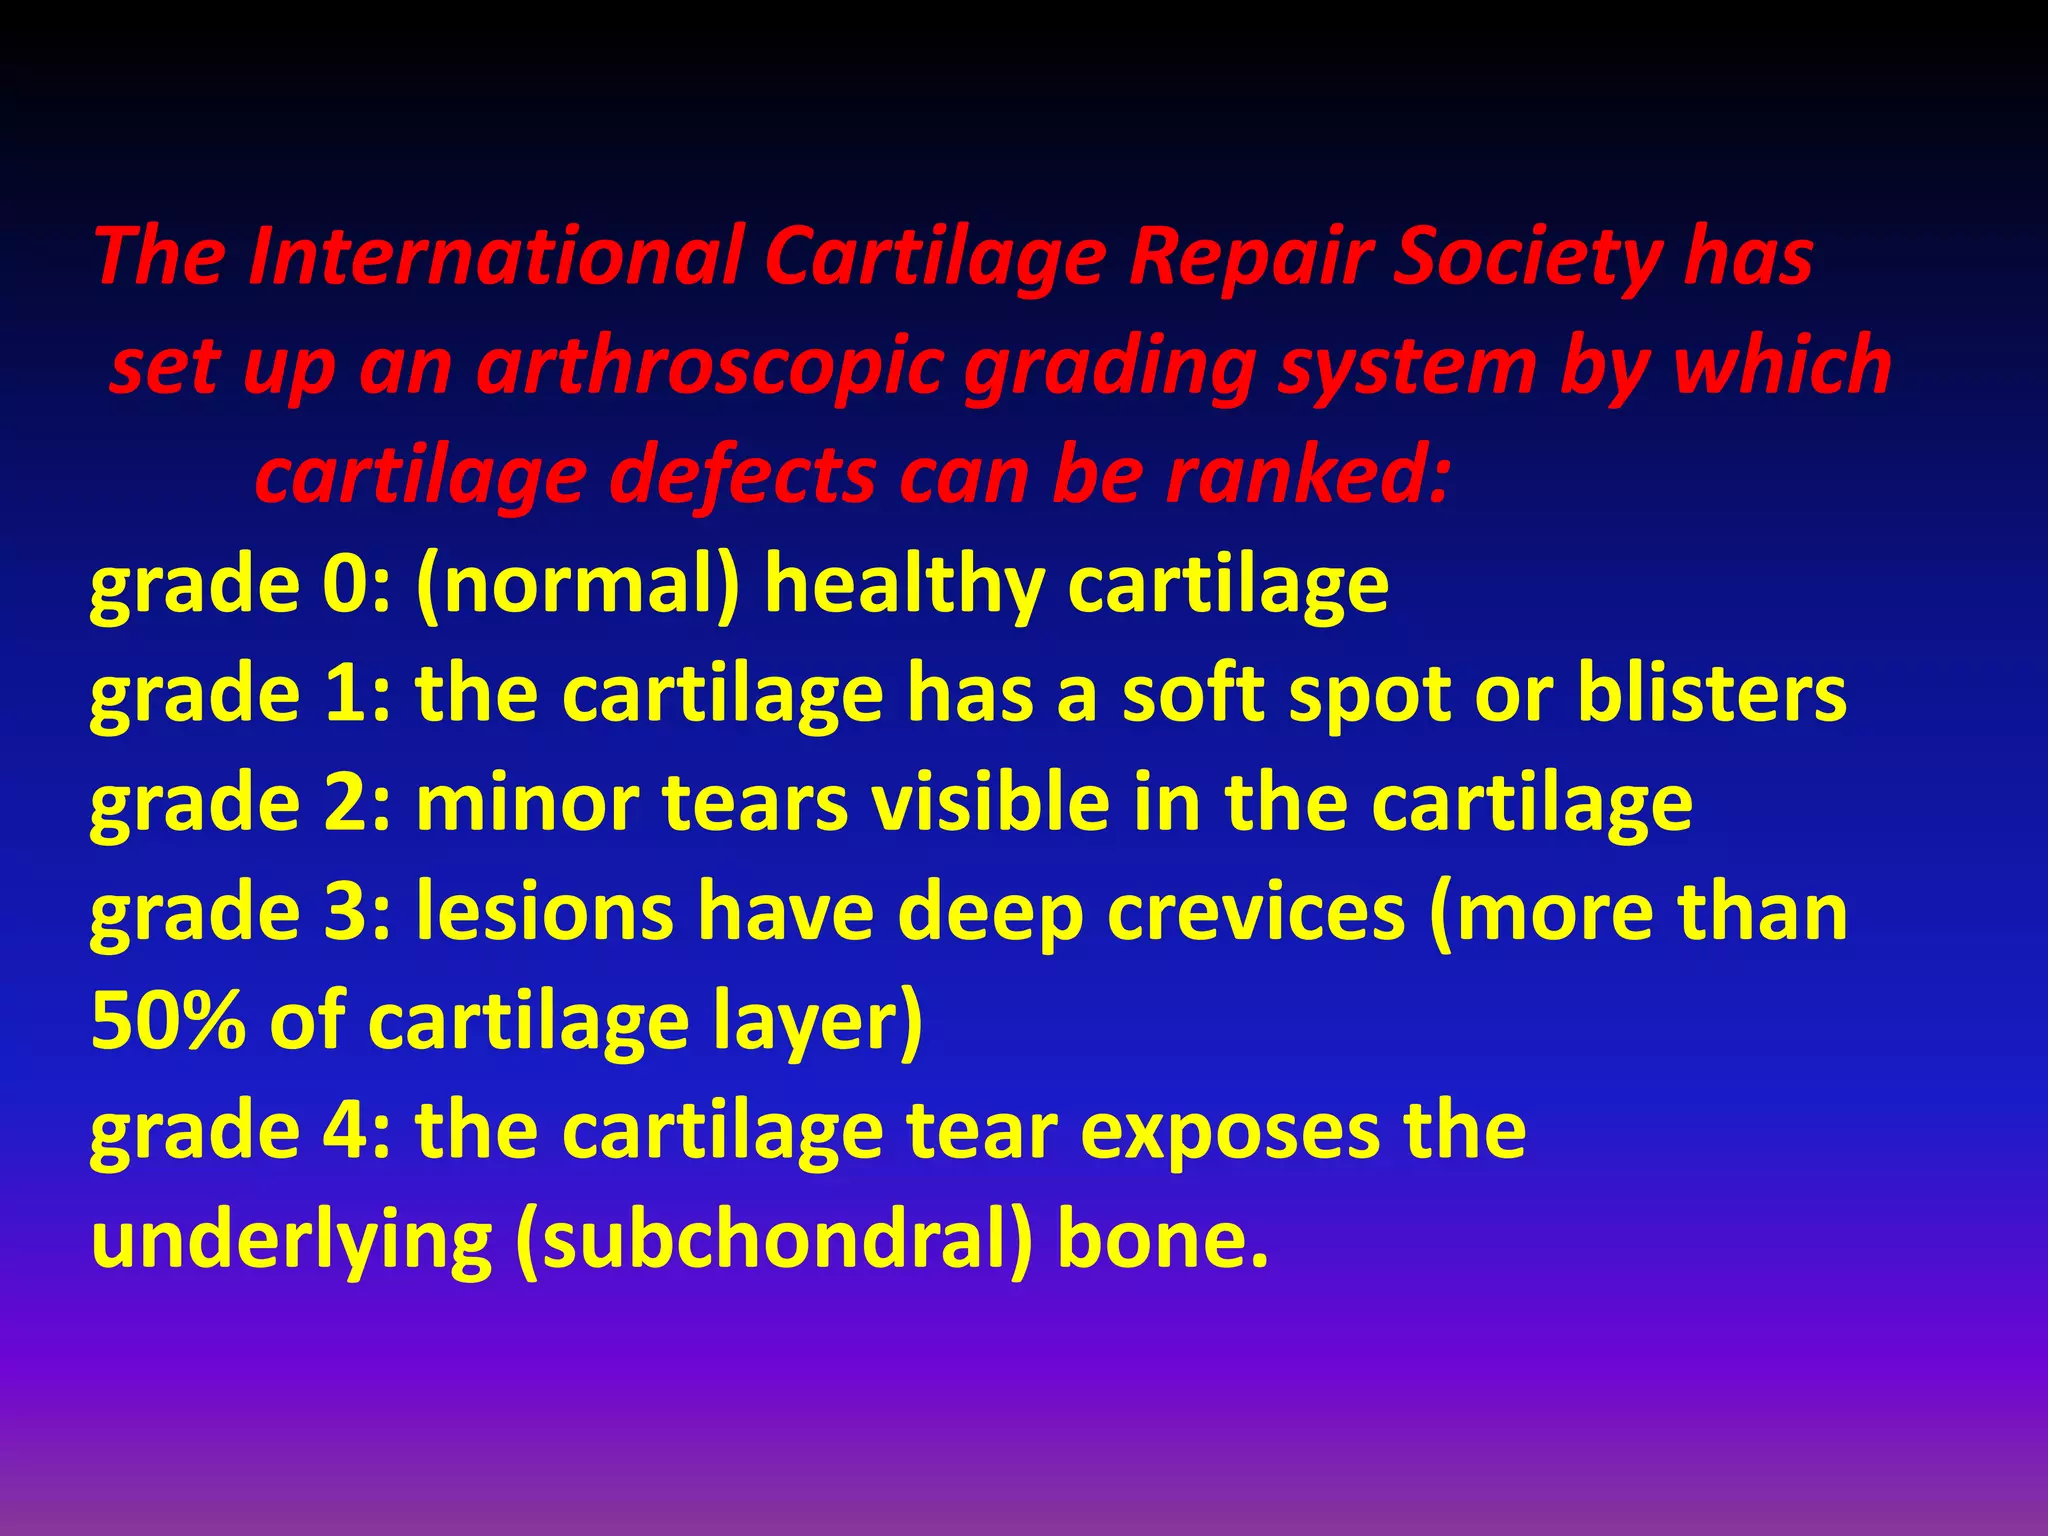
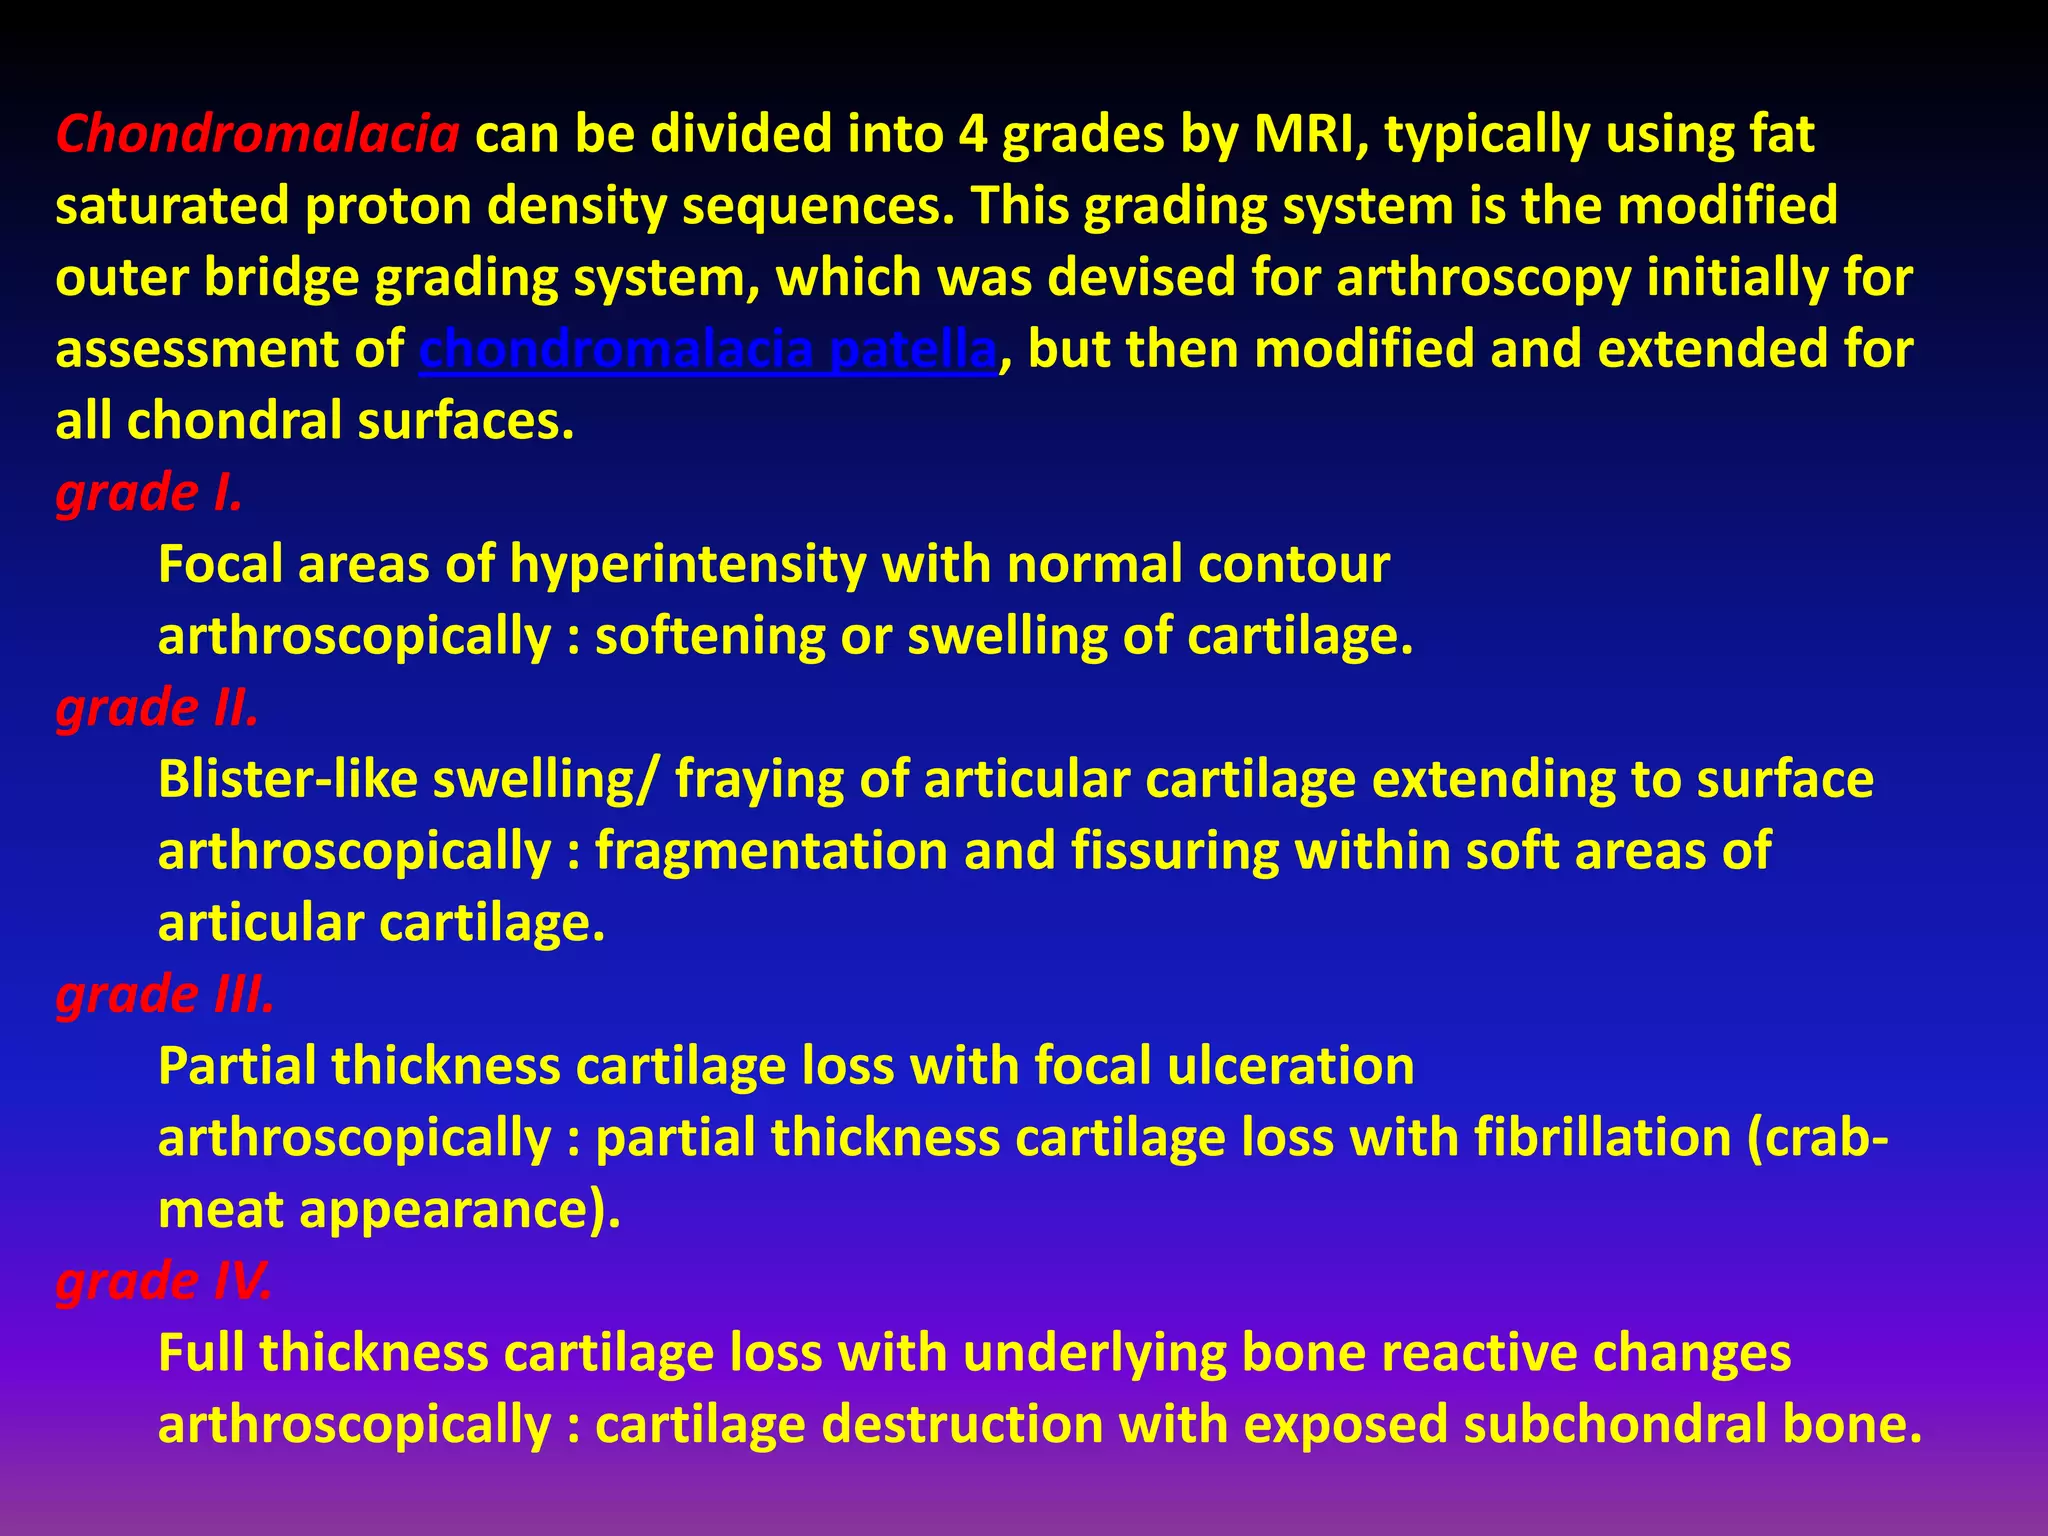
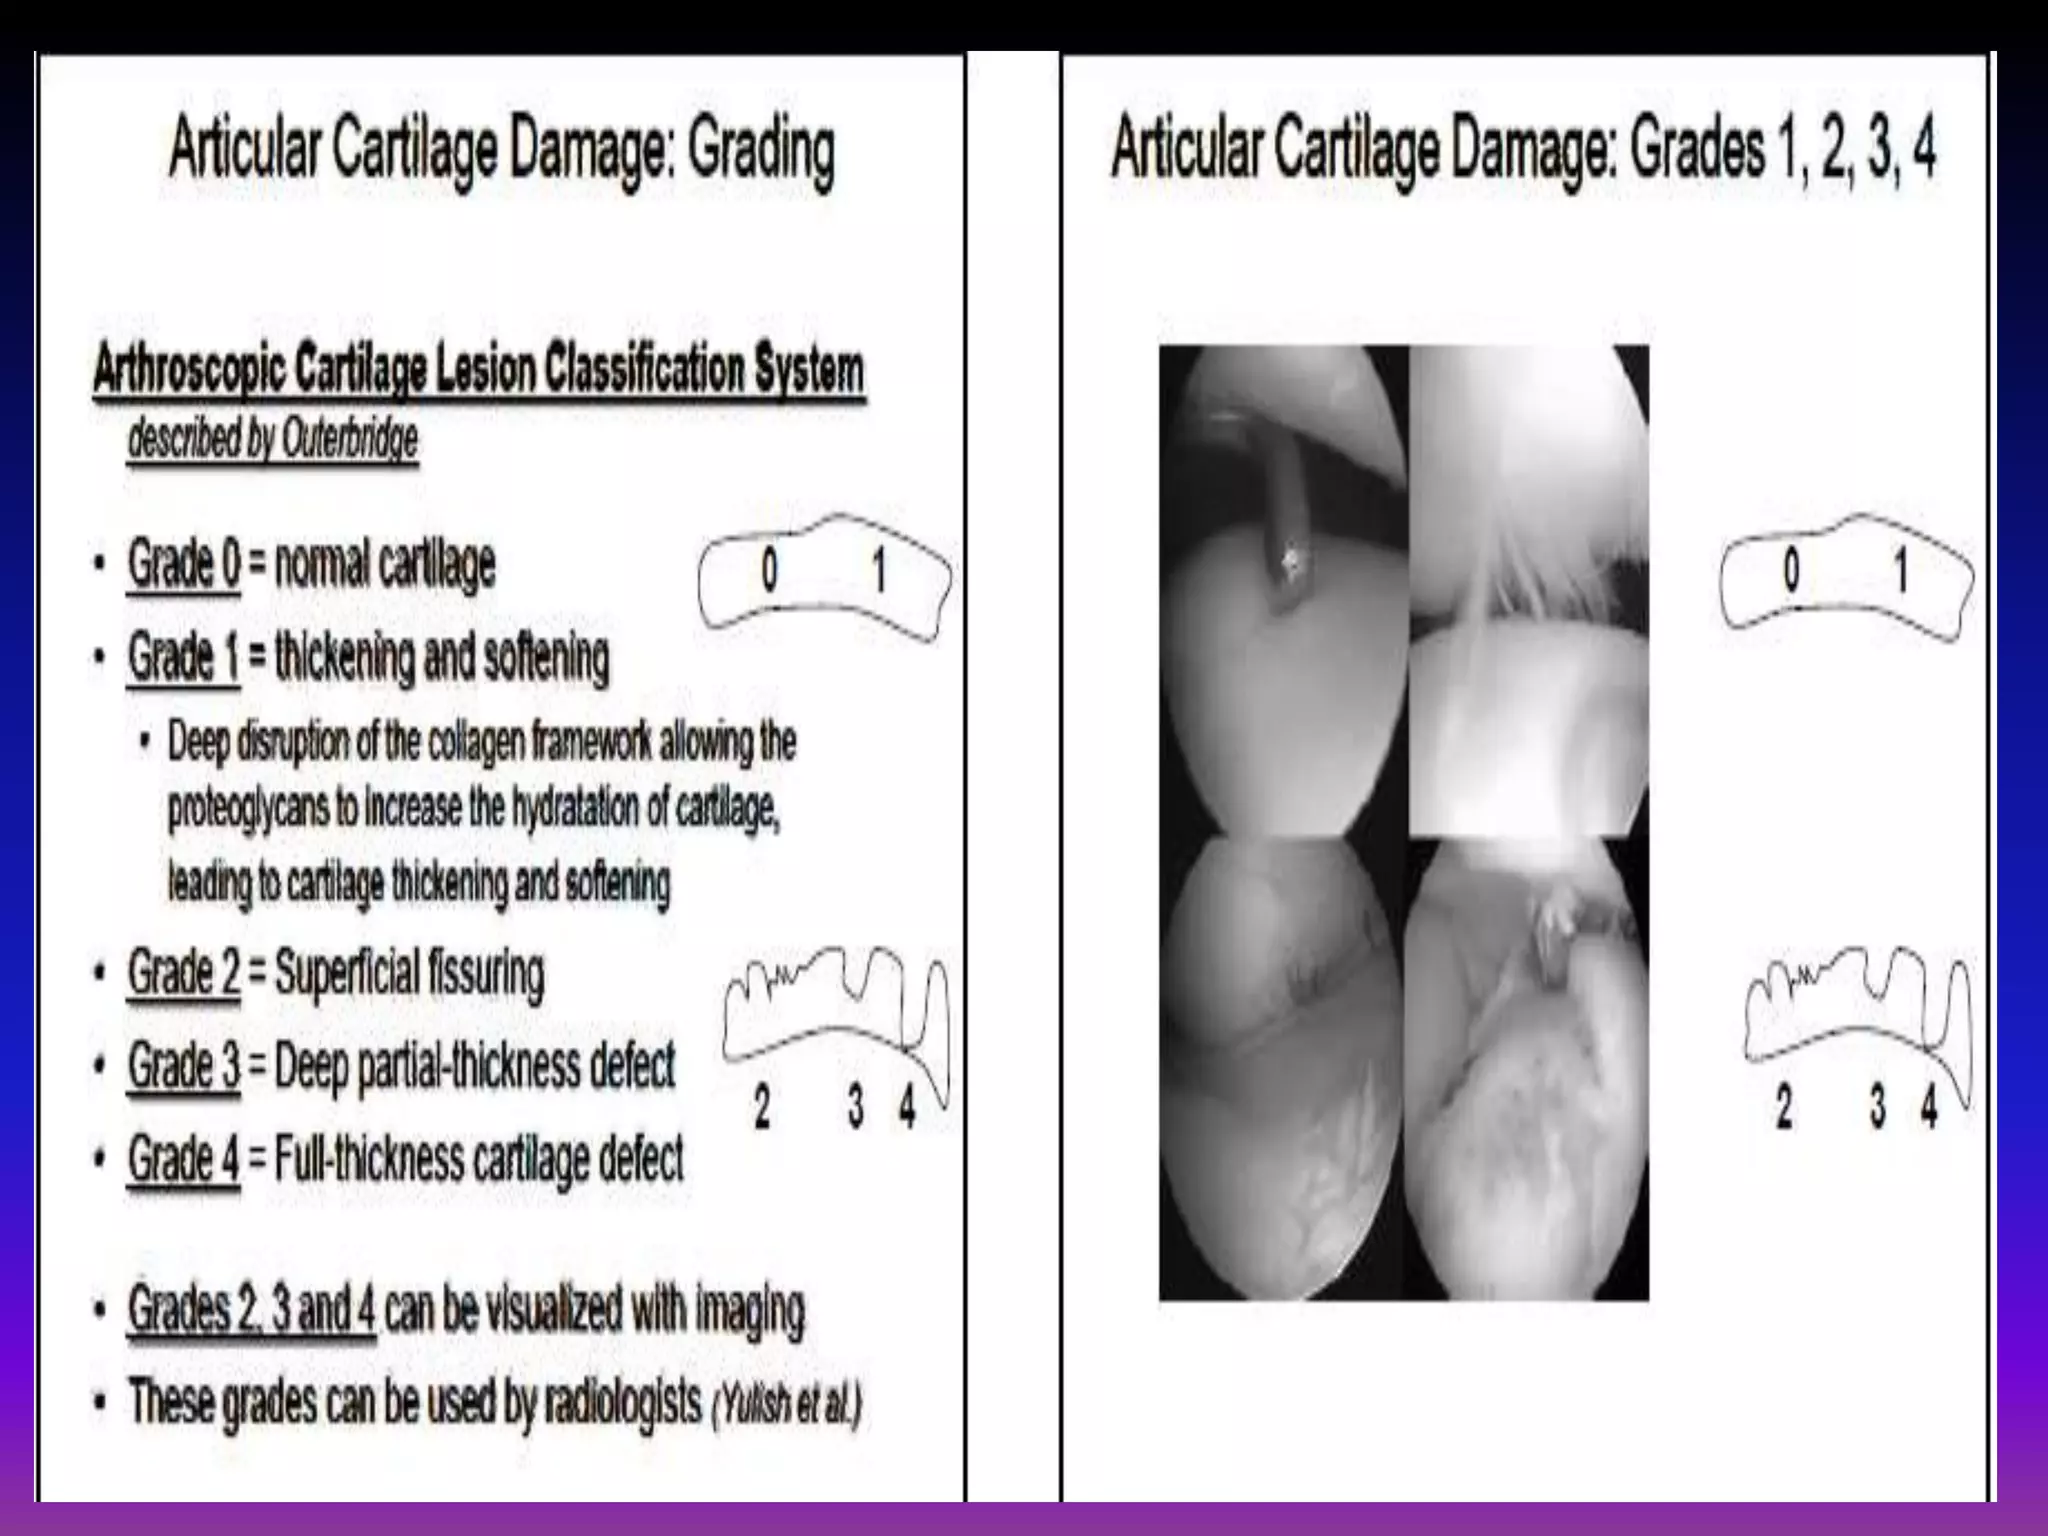
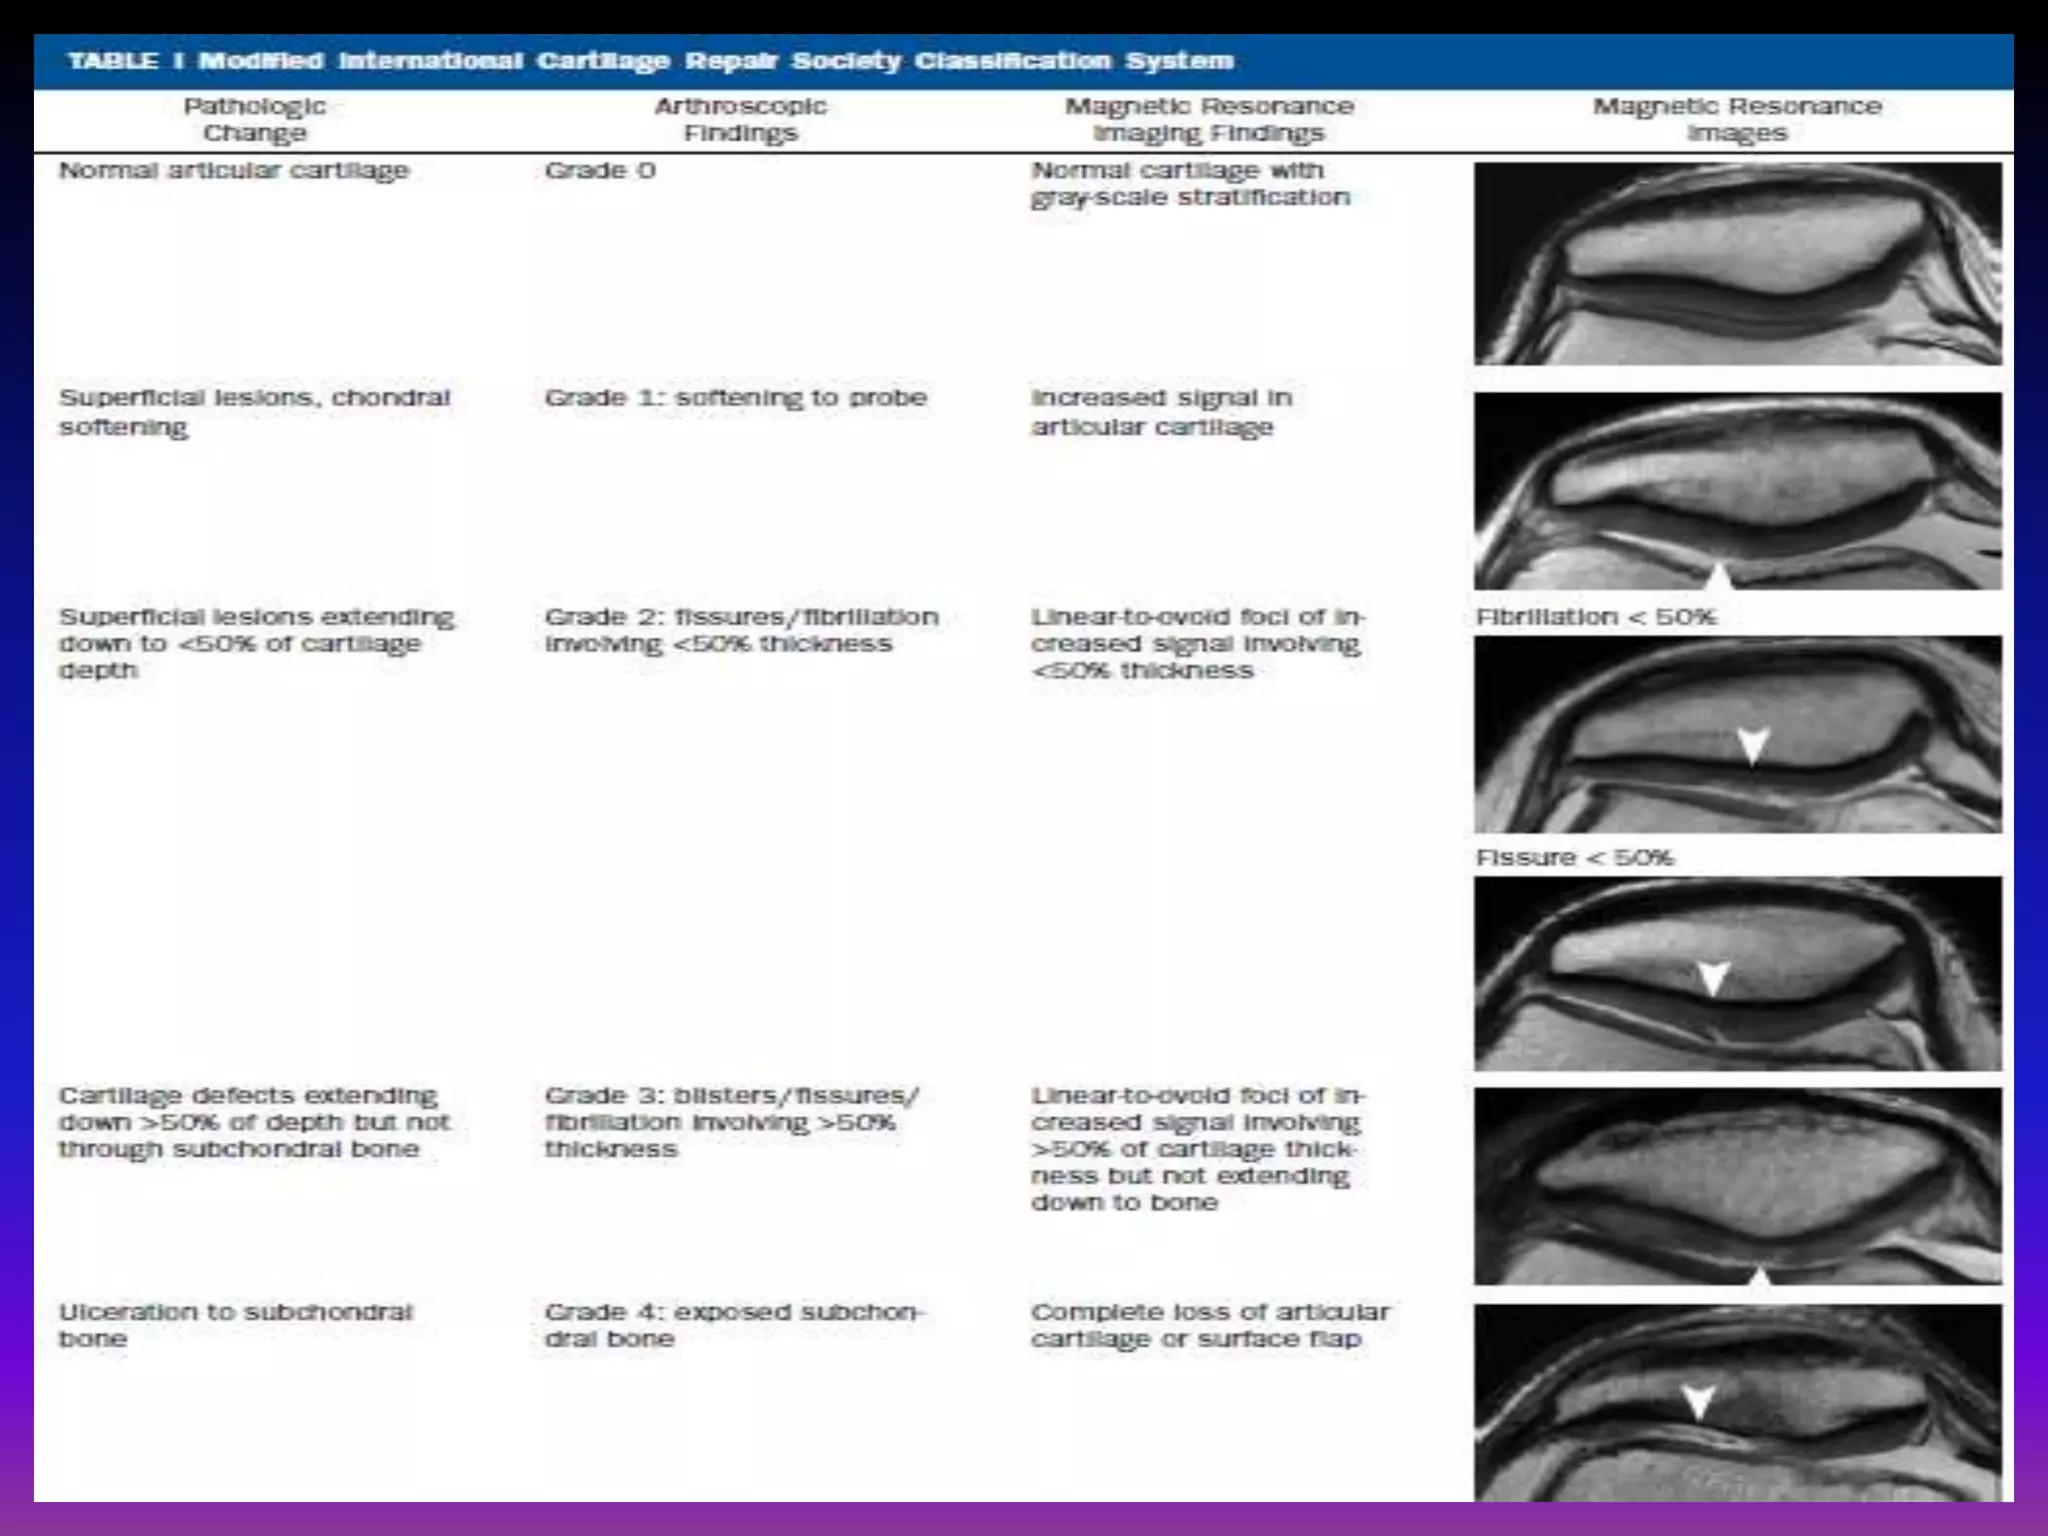
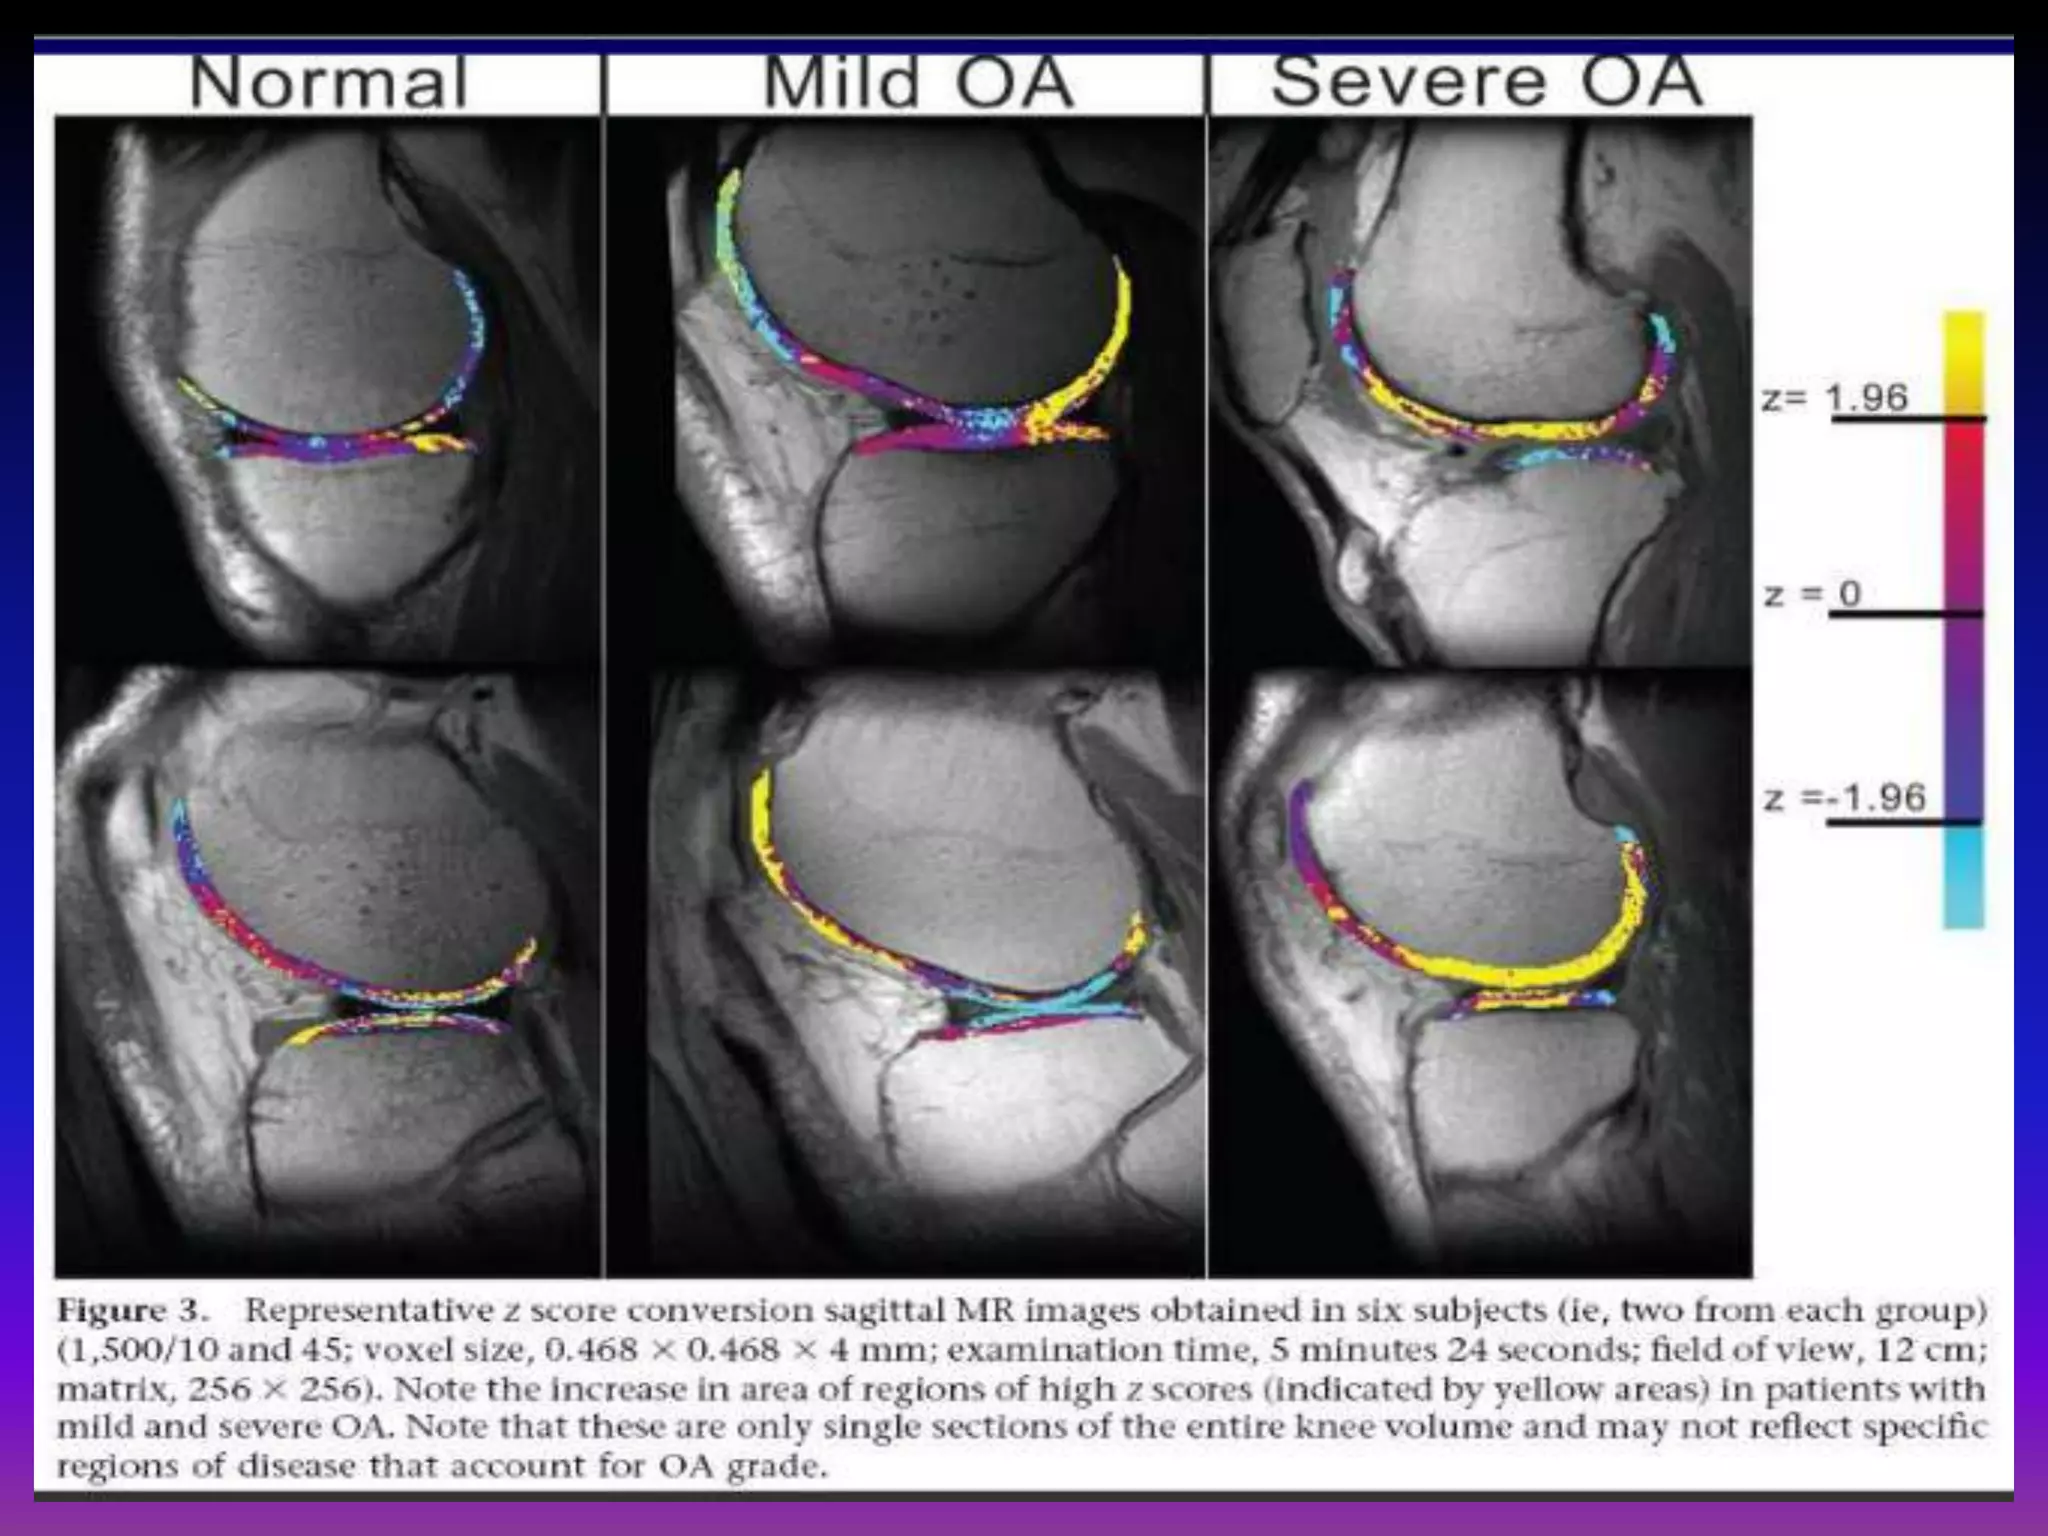
1. Imaging modalities such as radiography, ultrasound, CT arthrography, and MRI are used to evaluate articular cartilage and subchondral bone. MRI is the preferred method as it can detect early cartilage degeneration without radiation exposure. 2. Cartilage damage is graded on MRI from Grade I (mild increased signal) to Grade IV (full thickness defects). Subchondral bone changes like edema, fractures, and osteophytes also provide information about the severity and cause of injury or disease. 3. Techniques like dGEMRIC and T1ρ mapping can detect early biochemical changes in cartilage like glycosaminoglycan loss prior to macroscopic defects, helping evaluate and monitor treatments.


