Presentation1, radiological film reading of the hip joint.
•Download as PPTX, PDF•
29 likes•2,862 views

Health&medicine

Recommended
More Related Content
What's hot
What's hot (20)
Similar to Presentation1, radiological film reading of the hip joint.
Similar to Presentation1, radiological film reading of the hip joint. (20)
More from Abdellah Nazeer
More from Abdellah Nazeer (20)
Recently uploaded
Recently uploaded (20)
Presentation1, radiological film reading of the hip joint.
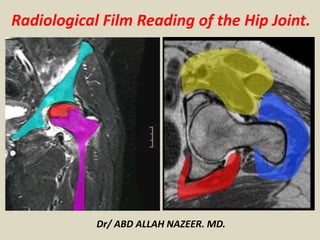
- 1. Radiological Film Reading of the Hip Joint. Dr/ ABD ALLAH NAZEER. MD.
- 2. AVASCULAR NECROSIS OF THE HIP.
- 4. Segmental distribution of bone marrow edema of femoral head, neck and intertrochanteric region (arrow), Suggestive of grade 1 avascular necrosis.
- 6. Early avascular necrosis on MRI shows diffuse marrow edema.
- 8. Grade 1 Avascular necrosis of the femoral head versus transient osteoporosis.
- 12. Grade 1 Avascular necrosis of the femoral head.
- 14. Grade 1 Avascular necrosis.
- 16. 47-year-old woman with osteonecrosis of femoral head with interval progression from stage 0 to stage 1 of disease 5 months after core decompression. A, Coronal T1-weighted image (TR/TE, 450/20) of left hip before core decompression shows no focal bone marrow abnormality in femoral head. B, Coronal T1-weighted image (450/20) obtained 5 months after core decompression shows newly developed hypointense signal line (arrows) of osteonecrosis between two drilling holes in femoral head. There was progressive change from stage 0 to stage 1 of disease.
- 19. Grade 11 avascular necrosis on MRI. FSE fat sat, fast spin-echo fat saturation. Consolidation of marrow edema in subchondral bone. Note anterosuperior location, typical of avascular necrosis of the hip.
- 21. 44-year-old woman with osteonecrosis of femoral head with interval change from stage 1 to stage 2 of disease 9 months after core decompression of right hip. A, Coronal T1-weighted image (TR/TE, 450/20) of right hip before core decompression shows hypointense line pattern (arrow) of osteonecrosis. B, Coronal T1-weighted image (450/20) obtained 9 months after core decompression shows collapse of femoral head (arrows).
- 24. Coronal T1-weighted (T1W) MRI image of the pelvis in a patient with bilateral avascular necrosis of the femoral head shows increased signal within the superior aspect of the femoral head, representing fat, surrounded by a line of decresed signal, representing sclerotic reactive margin. This is an MRI class A (fatlike).
- 26. Stage II
- 28. Stage 11 with T2 Double Line Sign.
- 30. Avascular necrosis of both femoral heads.
- 36. Several MRI sequences of avascular necrosis of the femoral head. Reparative granulation tissue, which strongly enhances, is seen around the periphery of the necrosis.
- 38. Coronal T1-weighted image-bilateral Ficat and Arlet Stage I avascular necrosis. Also noted old healed fracture at junction of right femoral head and neck.
- 40. Magnetic resonance imaging (MRI) of grade 2 femoral head avascular necrosis.
- 42. Grade 11 avascular necrosis with a ring-like subchondral area of AVN (arrow) present in the anterior-superior femoral head.
- 45. Grade 111 Avascular necrosis: double-line sign on MRI. Zone of hyperintense signal represents granulation tissue at the margin of dead and living bone.
- 47. Cor T1 and T2-weighted MRI image of the pelvis shows a stage B (blood-like) at the level of right femoral head with increased signal on T1W and T2W; AVN stage C (fluid-like) in left femoral head, with decreased signal intensity on T1W and increased signal on.
- 49. Cor, T1W and T2W MRI in a patient with AVN on the left femoral head with decreased signal intensity on T1W and T2W, representing a stage D (fibrous-like).
- 53. Left: Transverse T1 FSE (a1) and T2 fat saturated FSE (a2) in AVN of the right femoral head. There is a typical rim of T2-hyperintense granulation tissue around the subchondral necrosis. Right: Coronal T1 FSE (b1) and STIR (b2) of both hips in a case of asynchronous bilateral AVN of the hips.
- 55. Coronal T1-weighted image sequence-bilateral avascular necrosis demarcated by serpiginous hypointense line. Right femoral head and neck shows bone marrow edema appearing hypointense. (Ficat and Arlet Grade III on the right and Grade II on the left).
- 59. Grade 111 AVN
- 61. Coronal T1-weighted image-bilateral avascular necrosis Stage IV on right with reduction in joint space, Stage III on left with preserved joint space with loss of normal rounded contour of femoral heads on both sides
- 63. Coronal T1-weighted image-bilateral avascular necrosis femoral head with secondary osteoarthritis (left more than right showing resorption of femoral head — Ficat and Arlet Grade IV)
- 64. Coronal T1-weighted image-bilateral avascular necrosis femoral head with secondary osteoarthritis (left more than right showing resorption of femoral head — Ficat and Arlet Grade IV)
- 66. Coronal short tau inversion-recovery sequence-bilateral Ficat and Arlet Stage II avascular necrosis with double line sign. Also noted bone marrow edema in bilateral femoral necks with synovial effusion.
- 67. Perthes Disease.
- 69. A perfusion MRI provides multiple types of images and information of the hips. In the top image, the affected femoral head on the right side of the image appears dark black in the areas of no blood flow (circle). In the bottom image, the brighter white areas around the femoral head (arrows) indicate inflammation of the hip joint. The opposite hip joint appears normal with blood flow to the bone and no inflammation.
- 73. Perthes disease
- 75. Perthes disease.
- 77. Perthes disease.
- 79. Left: Coronal T1 FSE (a1) and STIR (a2) in right LCP disease (Caterall II, fragmentation stage). There is flattening and broadening of the femoral head epiphysis with an almost horizontal growth plate. Joint effusion and lateral subluxation of the femoral head can also be noted. Right, above: Coronal T1 FSE (b) of both hips in a case of early left LCP disease. There is a signal loss of two thirds of the femoral head epiphysis, accompanied by synovitis and edema of the metaphysis. Radiographs were still normal at this stage. Right, below: Coronal T1 FSE (b) of both hips in right LCP disease (Caterall IV, fragmentation stage). There is total signal loss of the fragmented ossification centre as well as broadening of the chondral epiphysis and the metaphysis. However, containment of the femoral head is still preserved.
- 83. Perthes disease.
- 85. Assessment of Femoral Head Revascularization in Legg-Calvé-Perthes Disease Using Serial Perfusion MRI
- 87. MRI of both hip joints. Note the right hip joint effusion, with deformed and collapsed right femoral head of altered signal intensity; picture is suggestive of high-grade Legg–Calv ́ –Perthes disease.
- 89. Bilateral Legg-Calvé-Perthes (LCP) disease. Three-dimensional T1-weighted spoiled gradient-recalled echo fat-saturated contrast-enhanced subtracted image acquired 1 minute after IV administration of gadolinium-containing contrast material shows necrosis of entire right femoral head. Bone scintigraphy image acquired 3 hours after IV injection of 99mTc methylene diphosphonate (MDP) shows no right femoral head radiopharmaceutical uptake (arrowhead), supporting diagnosis of necrotic phase LCP disease
- 91. 5-year-old girl with known right Legg-Calvé-Perthes disease. MRI examination was performed for staging purposes. Coronal T1-weighted spoiled gradient-recalled echo (SPGR) fat-saturated MR image reveals abnormal signal hypointensity involving central portion of right proximal femoral ossific nucleus (arrow).
- 93. 9-year-old boy with bilateral asynchronous Legg-Calvé-Perthes (LCP) disease. Two-dimensional T1-weighted spoiled gradient-recalled echo fat-saturated contrast-enhanced subtraction image shows non-enhancement of entire right femoral head and extensive right hip joint synovitis. Note heterogeneous enhancement of left proximal femoral epiphysis and left hip synovitis as well. MRI findings support diagnosis of bilateral LCP disease, with right hip in necrotic phase and left hip likely in revascularization phase.
- 95. MR image shows diffuse signal hypointensity (arrowheads) and flattening of right proximal femoral ossific nucleus.
- 97. 7-year-old boy with known left hip Legg-Calvé-Perthes disease. MRI examination was performed for staging purposes. Coronal MR image shows flattening and fragmentation of left proximal femoral ossific nucleus (arrowheads) as well as mild loss of containment. All ossific fragments show abnormal signal hypointensity.
- 103. 9-year-old boy with bilateral Legg-Calvé-Perthes disease. Coronal T1-weighted spoiled gradient-recalled echo fat- saturated MR image shows bilateral proximal femoral ossific nucleus flattening, fragmentation, and lateral extrusion. Femoral necks are abnormally shortened and broadened, whereas hip joint labra are horizontally oriented (arrows).
- 105. 7-year-old boy with known right Legg-Calvé-Perthes disease. Coronal T1-weighted spoiled gradient-recalled echo fat- saturated MR image shows abnormal osseous bridging between right central proximal femoral metaphysis and adjacent epiphysis (arrowheads). Central right proximal femoral physis is interrupted. Right femoral head is flattened and laterally extruded, whereas right femoral neck is abnormally broadened. Right hip joint labrum is horizontally oriented (arrow).
- 107. 14-year-old girl with history of left Legg-Calvé-Perthes disease, left hip pain, and hinged abduction at radiography. Coronal T1- weighted image of left hip after intraarticular administration of contrast material shows femoral head deformity, loss of containment with increased medial joint space fluid (asterisk), and horizontal displacement of labrum (arrow). Left labrum contains extensive increased signal that is likely due to repetitive trauma. Degenerative subchondral cyst is seen in left femoral head (arrowheads), and there is marked femoral head articular surface irregularity and cartilage thinning.
- 109. 11-year-old boy with left Legg-Calvé-Perthes disease and concern for intraarticular body. Coronal T1-weighted MR image shows focal signal hypointensity in left hip joint space (arrow), consistent with necrotic ossific intraarticular body. Note also evidence of femoral head deformity, loss of containment, and proximal femur physeal disturbance.
- 111. 3-year-old boy with left hip Legg-Calvé-Perthes disease. Coronal T1-weighted spin-echo MR image shows diffuse left proximal femoral ossific nucleus signal hypointensity (arrowheads). Additional focus of metaphyseal signal hypointensity abuts physis (arrow).
- 113. left Legg-Calvé-Perthes disease and increasing left hip pain. Coronal T1-weighted spin-echo MR image through anterior aspect of left femoral head shows multiple hyperintense subchondral cysts that contain proteinaceous fluid or blood products (black arrowheads). Note marked femoral head articular surface irregularity (white arrowhead).
- 115. left Old Legg-Calvé-Perthes (LCP) disease and intractable left hip pain and anterosuperior labral tear .
- 124. A slipped capital femoral epiphysis, or SCFE, is a separation of the femoral epiphysis from the metaphysis, most commonly in a varus relationship
- 126. Slipped capital femoral epiphysis.
- 128. Staging of SCFE. (a-d) Clinical staging. (a, b) Preslip stage in the same patient as in Figure 3, approximately 1 year earlier. Anterior radiograph (a) shows physeal widening on the left, but the frog-leg lateral radiograph (b) reveals no slip. (c) Acute slip. AP radiograph shows the metaphysis displaced from the epiphysis. The physeal margins are sharp but are not sclerotic. (d) Acute-on-chronic or chronic slip. Frog-leg lateral radiograph demonstrates sclerosis about the physis. The lateral margin of the metaphysis is rounded, indicating remodeling. (d-f) Radiographic staging. Frog-leg lateral radiographs show mild (d) and moderate (e) slips; AP radiograph (0 shows severe
- 130. Radiographs showed subtle widening of the physis on the right side on anteroposterior view, (a) posterior and medial displacement of the epiphysis of the right femur with respect to femoral neck on lateral (b) and frog's lateral view (c)
- 132. Coronal TI-WI (a) and T2-WI (b) magnetic resonance imaging images reveals physeal widening with indistinct margins and adjoining bone marrow edema.
- 134. Axial TI-WI (a), T2-WI (b), Sagittal TI-WI (c) and T2-WI (d) magnetic resonance imaging images reveal posterior and medial displacement of femoral capital epiphysis with respect to metaphysis with physeal widening with indistinct margins and adjoining bone marrow edema
- 136. Slipped Upper Femoral Epiphysis.
- 140. Slipped upper femoral epiphysis.
- 142. (A) The coronal T1 weighted image of hip joint shows patchy low signal intensity lesion in right femoral head (arrow), (B) which demonstrates high signal . Follow-up hip MRI showed no abnormal lesion in both femoral heads.
- 144. (a and b) STIR coronal images of the pelvis reveal hyperintense signal in the left femoral head and neck, suggestive of diffuse edema. There is evidence of joint effusion. Femoral head contour is maintained with no evidence of subchondral fracture, no synovitis seen
- 146. (a and b) Coronal T1 weighted image of the pelvis shows a hypointense band convex with the articular margin in the left anterosuperior femoral head s/o a subchondral fracture. Surrounding T1 hypointensity seen in left femoral head, neck which appears hyperintense on STIR images s/o diffuse edema
- 148. Bone scan shows increased radiotracer uptake in head and neck of femur on left side
- 150. TOH demonstrated as high signal intensity on STIR image involving the right femoral head and neck (arrow).
- 152. Right TOH. The bone marrow edema, shown as high on STIR (left) and low signal intensity on T1W (right) images, spares a thin rim of normal subchondral bone (arrows).
- 154. Regional migratory osteoporosis of a 47 year old man. In June 2005 he had TOH on the right side. He recovered in Nov 2005 and in June 2006 he developed TOH on the left side.
- 160. Idiopathic Transient Osteoporosis of the Hip (ITOH).
- 162. labral tear (arrowhead) involving base of labrum and extending into substance of labrum.
- 164. MR arthrogram shows delaminating nature of chondral lesion (arrowhead).
- 166. images of left hip show tear of superior labrum (arrow) that extends into anterosuperior labrum (not shown). Full-thickness chondral defect (small arrowhead) is present at chondrolabral junction. Small subarticular cyst (large arrowhead, A) is evident on coronal image.
- 168. MR image shows area of delamination (arrow) involving acetabular cartilage and chondral fissuring (arrowhead).
- 170. MR images show anterosuperior-superior labral tear (arrow). Delaminating chondral lesion (arrowhead, A) is present in anterosuperior aspect. Partial tear of ligamentum teres (arrowhead, B) also is present.
- 172. Posterior labral and capsular tear/avulsion (arrow). MR arthrogram image demonstrates contrast fully extending across the base of the labrum at the labral- cartilaginous juncture (arrow) representing a tear.
- 174. MR arthrographic images moving from lateral (left) to medial (right) in a 15 year-old with hip pain following a sports injury demonstrating contrast extending into an anterior labral tear (arrows).
- 176. 43 y/o male with chronic hip pain. Axial oblique fat- suppressed proton density- weighted images (above) and an axial T-weighted image with fat suppression (below) demonstrate a normal anterior sublabral recess at the 9 o'clock position (arrows). Note the normal triangular shaped labral tissue lateral to the recess.
- 178. Fat-suppressed proton density-weighted image in this 10 year-old boy complaining of hip pain reveals a subchondral 'crescent sign' due to a fracture line along the anterosuperior aspect of the femoral ossification center (arrow). There is localized surrounding marrow edema present and a joint effusion is present.
- 179. Bursae around the hip.
- 180. Bursae around the hip.
- 197. PVNS of the right hip with destruction of the joint. Note the focal soft tissue masses and the bony erosions (blue arrows).
- 199. PVNS (same patient as in Fig. 29). Note the low signal intensity artifact from the hemosiderin deposits (blue arrow) on T2- weighted image and the enhancing soft tissue lesions following contrast administration (white arrow).
- 201. Osteochondromatosis of the right hip. Note the bony loose bodies with similar intensity to the normal bone (arrows) within the joint space and regional bursa.
- 203. Idiopathic synovial osteochondromatosis of the right hip.
- 209. Patient with systemic juvenile idiopathic arthritis after having multiple hip infections at the age of 4 years.
- 211. Marked erosive changes in the hips in addition to coxa vara, short broad femoral necks, and synovitis/joint effusion as seen on the radiograph (A) and axial T1-weighted (B) and T2-weighted (C) magnetic resonance images of the right hip.
- 213. 9-year-old boy with acute septic arthritis in Rt. hip joint. (A) Coronal T1-weighted spin- echo MR image Siemens (IR/TE,450/11), (B) T2-weighted spin-echo MR image (3000/99), (C) fat-suppressed gadolinium-enhanced T1-weighed spin-echo MR image (735/14), demonstrate effusion in Rt. hip joint and diffuse enhancement in Rt. hip joint synovium.
- 217. Septic arthritis.
- 219. Septic arthritis.
- 221. Septic arthritis.
- 222. Thank You.