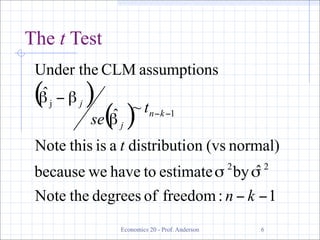
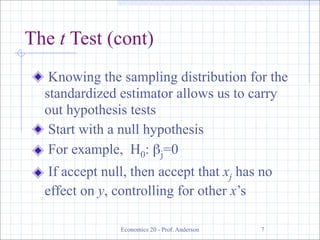
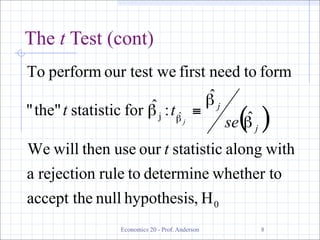
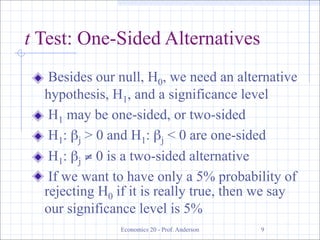
Multiple regression analysis allows modeling of a dependent variable (y) as a function of multiple independent variables (x1, x2,...xk). The model takes the form y = β0 + β1x1 + β2x2 +...+ βkxk + u. For classical hypothesis testing of the coefficients (β1, β2,...βk), the model assumes u is independent of the x's and normally distributed. The t-test can be used to test hypotheses about individual coefficients, such as H0: βj = 0, while the F-test allows jointly testing hypotheses about multiple coefficients, such as exclusion restrictions that several coefficients equal zero. P-values indicate the probability of observing test statistics at least
Nec 602 unit ii Random Variables and Random processDr Naim R Kidwai
The presentation explains concept of Probability, random variable, statistical averages, correlation, sum of random Variables, Central Limit Theorem,
random process, classification of random processes, power spectral density, multiple random processes.
Chapter 4 part3- Means and Variances of Random Variablesnszakir
Statistics, study of probability, The Mean of a Random Variable, The Variance of a Random Variable, Rules for Means and Variances, The Law of Large Numbers,
Aris Spanos: A Note on Correlation Analysis: statistically spurious vs. non-spurious results
This note uses an empirical example to illustrate (i) how one can inadvertently derive spurious correlation results and (ii) how such results can be transformed into statistically reliable ones.
Mayo Slides: Part I Meeting #2 (Phil 6334/Econ 6614)jemille6
Slides Meeting #2 (Phil 6334/Econ 6614: Current Debates on Statistical Inference and Modeling (D. Mayo and A. Spanos)
Part I: Bernoulli trials: Plane Jane Version
Talk on the design on non-negative unbiased estimators, useful to perform exact inference for intractable target distributions.
Corresponds to the article http://arxiv.org/abs/1309.6473
In this presentation, we will discuss the mathematical basis of linear regression and analyze the concepts of p-value, hypothesis testing, and confidence intervals, and their interpretation.
(Theory)1 A statistical hypothesis is (TFTFTF.docxaryan532920
(
Theory
)
1 A statistical hypothesis is
(
T
F
T
F
T
F
)a random variable a pivotal quantity
an assertion about unknown distribution of one or more random variables
2 (
∼
)Given arandom variable(absolutely)continue X F(x),F(x)unknown,siaX1,...,Xna sample from XandFn(x)the empirical distribution function.The Kolmogorov-Smirnovtest is usedtoverify
(
T
F
T
F
T
F
)the hypothesis H0 : X ∼ F0 vs Ha : H0 is false, where F0(x) is the hypothesized distribution for X the hypothesis H0 : X hasthe Kolmogorov distribution vs Ha : X hasthe Smirnov distribution the hypothesis H0 : X ∼ F0 vs Ha : H0 is false, using the test statistic sup |Fn(x) − F0(x)|
3 (
x
∈
R
) (
TV
F
TV
F
TV
F
TV
F
)Ina hypothesis testthep−valueisthe significance 1−γ
the value of test statistic
the probabilityof rejecting the true hypothesis
the smallest significancewith which you couldreject H0 when it’s true
4 (
TV
F
TV
F
TV
F
)In a hypothesis testthesignificance level αisthe value of test statistic
the probabilitywith which you could reject H0 when H0 is true
the probabilitywith which you could accept H0 when H0 is false
5
(
),
)For a given experimentare only and only possible,sincompatible resultsSi(i=1,...,sand s≥2), each one of hypothesized probabilityπi=P[Si]; .Repeating n times the experiment the result Si will be observed Ni times. Obviously . Let ni the observed value of Ni and let the chi-squared with s-1 degrees of freedom. Answer correctly.
(
TV
F
)the values represent the observed frequencies of the result Si
(
TV
F
)the statistic is approximately normal when n is big
TV
F
(
TV
F
)the condition is sufficient to ensure that
(
pag.
8
)
6 Given two hypothesis test simple,T1andT2to decide between the null hypothesis Hoand the alternativeHa,with error probability of 1stand 2ndtype respectively equal to α1, β1 for T1 and α2, β2 forT2, then T1 will be preferable to T2 if:
(
TV
F
TV
F
TV
F
TV
F
)α1 <α2 e β1 <β2 α1 = α2 e β1 >β2 α1 = α2 e β1 <β2 α1 >α2 e β1 <β2
(
Part B
)
1. Let U1 and U2 twouniform random variables on [0; 1] and independent.
1.1 To find the joint densityfU(u1,u2)of the vectorU=(U1,U2)Tand to draw the graph.
1.2 LetT=U1+U2.We denote by FT(t)the cumulative function of T.To show that, if 0≤t≤1,then FT(t)is the volume of parallelepiped in blue drawn in the picture. Calculate this volume.
Hint:Calculate P[U1+U2≤t]whereas the points(u1,u2)favorable are such that
{(u1,u2):0≤u1≤1;0≤u2≤1:0≤ u1 + u2 ≤t}.
1.3 Now, it will be easy to show that:
Calculate the probability that
Let now
0.523 0.556 0.994 1.000 1.052 1.087 1.154 1.322 1.485 1.549 (1)
10 observations from an unknown population X.
1.4 To write the sample distribution function Fn(x)concerning the observations(1).
We want to decide about the test (non parametric)
H0:FX(x)=FT(x) Ha : FX(x)
Using the techniques of Kolmogorov-Smirnov.
≠ FT(x) (2)
1.5 At this scope,calledxk; withk=1,...,10the ...
Final Josh Kim Counterpoint Educause December 09Joshua Kim
Learning Management Technologies: Enterprise System or Consumer Good?
This session will compare and contrast approaches in the use of learning management technologies in higher education: an enterprise model where a learning management system is centrally provided versus a consumer model where faculty are encouraged to use a wide variety of available Web 2.0 tools (blogs, Facebook, Twitter). Two presenters with expertise on both sides of the issue will discuss the relative merits of each model. They will also illuminate a shared challenge: the "humanware" (people helping people) investments that support the use of these technologies by faculty on campus are critical to their success.
http://www.educause.edu/E09+Hybrid/EDUCAUSE2009FacetoFaceConferen/LearningManagementTechnologies/175842
Blended Librarian Webcast: Becoming an Educational Change Agent on Thursday, May 21, 2009 @ 3pm Eastern
by LearningTimes The current moderation status is approved.Change the moderation status by clicking the following links.Approved1 star of excellence2 stars of excellence3 stars of excellence
Steven Bell and John Shank, co-founders of the Blended Librarians Online Learning Community and their guests, Josh Kim and Barbara Knauff, invite you to join the next webcast, “Becoming an Educational Change Agent” On Thursday, May 21, 2009 at 3 pm. EDT.
Event Description:
In this session, we'll explore the changing role of academic teaching and learning "support" staff. How has it evolved over the past decade, and where are our job descriptions going? How much of our work is reactive, and how much of is advocacy for changes in instructional paradigms? How are the roles between instructional designers and librarians demarcated, and where are they beginning to shift or merge? Is learning technology itself an emerging academic discipline? We'll begin with a brief presentation on these issues by Josh Kim and Barbara Knauff, Senior Learning Technologists at Dartmouth College (see their recent Educause Review column on these issues, "Business Cards for the Future", but the majority of the session will be given over to a participant discussion of these issues
Introduction to AI for Nonprofits with Tapp NetworkTechSoup
Dive into the world of AI! Experts Jon Hill and Tareq Monaur will guide you through AI's role in enhancing nonprofit websites and basic marketing strategies, making it easy to understand and apply.
Unit 8 - Information and Communication Technology (Paper I).pdfThiyagu K
This slides describes the basic concepts of ICT, basics of Email, Emerging Technology and Digital Initiatives in Education. This presentations aligns with the UGC Paper I syllabus.
How to Make a Field invisible in Odoo 17Celine George
It is possible to hide or invisible some fields in odoo. Commonly using “invisible” attribute in the field definition to invisible the fields. This slide will show how to make a field invisible in odoo 17.
Read| The latest issue of The Challenger is here! We are thrilled to announce that our school paper has qualified for the NATIONAL SCHOOLS PRESS CONFERENCE (NSPC) 2024. Thank you for your unwavering support and trust. Dive into the stories that made us stand out!
Synthetic Fiber Construction in lab .pptxPavel ( NSTU)
Synthetic fiber production is a fascinating and complex field that blends chemistry, engineering, and environmental science. By understanding these aspects, students can gain a comprehensive view of synthetic fiber production, its impact on society and the environment, and the potential for future innovations. Synthetic fibers play a crucial role in modern society, impacting various aspects of daily life, industry, and the environment. ynthetic fibers are integral to modern life, offering a range of benefits from cost-effectiveness and versatility to innovative applications and performance characteristics. While they pose environmental challenges, ongoing research and development aim to create more sustainable and eco-friendly alternatives. Understanding the importance of synthetic fibers helps in appreciating their role in the economy, industry, and daily life, while also emphasizing the need for sustainable practices and innovation.
Acetabularia Information For Class 9 .docxvaibhavrinwa19
Acetabularia acetabulum is a single-celled green alga that in its vegetative state is morphologically differentiated into a basal rhizoid and an axially elongated stalk, which bears whorls of branching hairs. The single diploid nucleus resides in the rhizoid.
2024.06.01 Introducing a competency framework for languag learning materials ...Sandy Millin
http://sandymillin.wordpress.com/iateflwebinar2024
Published classroom materials form the basis of syllabuses, drive teacher professional development, and have a potentially huge influence on learners, teachers and education systems. All teachers also create their own materials, whether a few sentences on a blackboard, a highly-structured fully-realised online course, or anything in between. Despite this, the knowledge and skills needed to create effective language learning materials are rarely part of teacher training, and are mostly learnt by trial and error.
Knowledge and skills frameworks, generally called competency frameworks, for ELT teachers, trainers and managers have existed for a few years now. However, until I created one for my MA dissertation, there wasn’t one drawing together what we need to know and do to be able to effectively produce language learning materials.
This webinar will introduce you to my framework, highlighting the key competencies I identified from my research. It will also show how anybody involved in language teaching (any language, not just English!), teacher training, managing schools or developing language learning materials can benefit from using the framework.
A workshop hosted by the South African Journal of Science aimed at postgraduate students and early career researchers with little or no experience in writing and publishing journal articles.
A Strategic Approach: GenAI in EducationPeter Windle
Artificial Intelligence (AI) technologies such as Generative AI, Image Generators and Large Language Models have had a dramatic impact on teaching, learning and assessment over the past 18 months. The most immediate threat AI posed was to Academic Integrity with Higher Education Institutes (HEIs) focusing their efforts on combating the use of GenAI in assessment. Guidelines were developed for staff and students, policies put in place too. Innovative educators have forged paths in the use of Generative AI for teaching, learning and assessments leading to pockets of transformation springing up across HEIs, often with little or no top-down guidance, support or direction.
This Gasta posits a strategic approach to integrating AI into HEIs to prepare staff, students and the curriculum for an evolving world and workplace. We will highlight the advantages of working with these technologies beyond the realm of teaching, learning and assessment by considering prompt engineering skills, industry impact, curriculum changes, and the need for staff upskilling. In contrast, not engaging strategically with Generative AI poses risks, including falling behind peers, missed opportunities and failing to ensure our graduates remain employable. The rapid evolution of AI technologies necessitates a proactive and strategic approach if we are to remain relevant.
Safalta Digital marketing institute in Noida, provide complete applications that encompass a huge range of virtual advertising and marketing additives, which includes search engine optimization, virtual communication advertising, pay-per-click on marketing, content material advertising, internet analytics, and greater. These university courses are designed for students who possess a comprehensive understanding of virtual marketing strategies and attributes.Safalta Digital Marketing Institute in Noida is a first choice for young individuals or students who are looking to start their careers in the field of digital advertising. The institute gives specialized courses designed and certification.
for beginners, providing thorough training in areas such as SEO, digital communication marketing, and PPC training in Noida. After finishing the program, students receive the certifications recognised by top different universitie, setting a strong foundation for a successful career in digital marketing.
4. Assumptions of the Classical
Linear Model (CLM)
So far, we know that given the Gauss-
Markov assumptions, OLS is BLUE,
In order to do classical hypothesis testing,
we need to add another assumption (beyond
the Gauss-Markov assumptions)
Assume that u is independent of x1, x2,…, xk
and u is normally distributed with zero
mean and variance σ2: u ~ Normal(0,σ2)
Economics 20 - Prof. Anderson 2
5. CLM Assumptions (cont)
Under CLM, OLS is not only BLUE, but is
the minimum variance unbiased estimator
We can summarize the population
assumptions of CLM as follows
y|x ~ Normal(β0 + β1x1 +…+ βkxk, σ2)
While for now we just assume normality,
clear that sometimes not the case
Large samples will let us drop normality
Economics 20 - Prof. Anderson 3
6. The homoskedastic normal distribution with
a single explanatory variable
y
f(y|x)
. E(y|x) = β + β x
.
0 1
Normal
distribution
s
x1 x2
Economics 20 - Prof. Anderson 4
9. The t Test (cont)
Knowing the sampling distribution for the
standardized estimator allows us to carry
out hypothesis tests
Start with a null hypothesis
For example, H0: βj=0
If accept null, then accept that xj has no
effect on y, controlling for other x’s
Economics 20 - Prof. Anderson 7
10. The t Test (cont)
Economics 20 - Prof. Anderson 8
11. t Test: One-Sided Alternatives
Besides our null, H0, we need an alternative
hypothesis, H1, and a significance level
H1 may be one-sided, or two-sided
H1: βj > 0 and H1: βj < 0 are one-sided
H1: βj ≠ 0 is a two-sided alternative
If we want to have only a 5% probability of
rejecting H0 if it is really true, then we say
our significance level is 5%
Economics 20 - Prof. Anderson 9
12. One-Sided Alternatives (cont)
Having picked a significance level, α, we
look up the (1 – α)th percentile in a t
distribution with n – k – 1 df and call this c,
the critical value
We can reject the null hypothesis if the t
statistic is greater than the critical value
If the t statistic is less than the critical value
then we fail to reject the null
Economics 20 - Prof. Anderson 10
13. One-Sided Alternatives (cont)
yi = β0 + β1xi1 + … + βkxik + ui
H0: βj = 0 H1: βj > 0
Fail to reject
reject
(1 − α) α
0 c
Economics 20 - Prof. Anderson 11
14. One-sided vs Two-sided
Because the t distribution is symmetric,
testing H1: βj < 0 is straightforward. The
critical value is just the negative of before
We can reject the null if the t statistic < –c,
and if the t statistic > than –c then we fail to
reject the null
For a two-sided test, we set the critical
value based on α/2 and reject H1: βj ≠ 0 if
the absolute value of the t statistic > c
Economics 20 - Prof. Anderson 12
15. Two-Sided Alternatives
yi = β0 + β1Xi1 + … + βkXik + ui
H0: βj = 0 H1: βj ≠ 0
fail to reject
reject reject
α/2 (1 − α) α/2
-c 0 c
Economics 20 - Prof. Anderson 13
16. Summary for H0: βj = 0
Unless otherwise stated, the alternative is
assumed to be two-sided
If we reject the null, we typically say “xj is
statistically significant at the α % level”
If we fail to reject the null, we typically say
“xj is statistically insignificant at the α %
level”
Economics 20 - Prof. Anderson 14
17. Testing other hypotheses
A more general form of the t statistic
recognizes that we may want to test
something like H0: βj = aj
In this case, the appropriate t statistic is
Economics 20 - Prof. Anderson 15
18. Confidence Intervals
Another way to use classical statistical testing is
to construct a confidence interval using the same
critical value as was used for a two-sided test
A (1 - α) % confidence interval is defined as
Economics 20 - Prof. Anderson 16
19. Computing p-values for t tests
An alternative to the classical approach is
to ask, “what is the smallest significance
level at which the null would be rejected?”
So, compute the t statistic, and then look up
what percentile it is in the appropriate t
distribution – this is the p-value
p-value is the probability we would observe
the t statistic we did, if the null were true
Economics 20 - Prof. Anderson 17
20. Stata and p-values, t tests, etc.
Most computer packages will compute the
p-value for you, assuming a two-sided test
If you really want a one-sided alternative,
just divide the two-sided p-value by 2
Stata provides the t statistic, p-value, and
95% confidence interval for H0: βj = 0 for
you, in columns labeled “t”, “P > |t|” and
“[95% Conf. Interval]”, respectively
Economics 20 - Prof. Anderson 18
21. Testing a Linear Combination
Suppose instead of testing whether β1 is equal to a
constant, you want to test if it is equal to another
parameter, that is H0 : β1 = β2
Use same basic procedure for forming a t statistic
Economics 20 - Prof. Anderson 19
23. Testing a Linear Combo (cont)
So, to use formula, need s12, which
standard output does not have
Many packages will have an option to get
it, or will just perform the test for you
In Stata, after reg y x1 x2 … xk you would
type test x1 = x2 to get a p-value for the test
More generally, you can always restate the
problem to get the test you want
Economics 20 - Prof. Anderson 21
24. Example:
Suppose you are interested in the effect of
campaign expenditures on outcomes
Model is voteA = β0 + β1log(expendA) +
β2log(expendB) + β3prtystrA + u
H0: β1 = - β2, or H0: θ1 = β1 + β2 = 0
β1 = θ1 – β2, so substitute in and rearrange
⇒ voteA = β0 + θ1log(expendA) +
β2log(expendB - expendA) + β3prtystrA + u
Economics 20 - Prof. Anderson 22
25. Example (cont):
This is the same model as originally, but
now you get a standard error for β1 – β2 = θ1
directly from the basic regression
Any linear combination of parameters
could be tested in a similar manner
Other examples of hypotheses about a
single linear combination of parameters:
β1 = 1 + β2 ; β1 = 5β2 ; β1 = -1/2β2 ; etc
Economics 20 - Prof. Anderson 23
26. Multiple Linear Restrictions
Everything we’ve done so far has involved
testing a single linear restriction, (e.g. β1 = 0
or β1 = β2 )
However, we may want to jointly test
multiple hypotheses about our parameters
A typical example is testing “exclusion
restrictions” – we want to know if a group
of parameters are all equal to zero
Economics 20 - Prof. Anderson 24
27. Testing Exclusion Restrictions
Now the null hypothesis might be
something like H0: βk-q+1 = 0, ... , βk = 0
The alternative is just H1: H0 is not true
Can’t just check each t statistic separately,
because we want to know if the q
parameters are jointly significant at a given
level – it is possible for none to be
individually significant at that level
Economics 20 - Prof. Anderson 25
28. Exclusion Restrictions (cont)
To do the test we need to estimate the “restricted
model” without xk-q+1,, …, xk included, as well as
the “unrestricted model” with all x’s included
Intuitively, we want to know if the change in SSR
is big enough to warrant inclusion of xk-q+1,, …, xk
Economics 20 - Prof. Anderson 26
29. The F statistic
The F statistic is always positive, since the
SSR from the restricted model can’t be less
than the SSR from the unrestricted
Essentially the F statistic is measuring the
relative increase in SSR when moving from
the unrestricted to restricted model
q = number of restrictions, or dfr – dfur
n – k – 1 = dfur
Economics 20 - Prof. Anderson 27
30. The F statistic (cont)
To decide if the increase in SSR when we
move to a restricted model is “big enough”
to reject the exclusions, we need to know
about the sampling distribution of our F stat
Not surprisingly, F ~ Fq,n-k-1, where q is
referred to as the numerator degrees of
freedom and n – k – 1 as the denominator
degrees of freedom
Economics 20 - Prof. Anderson 28
31. The F statistic (cont)
f(F) Reject H0 at α
fail to reject significance
level
if F > c
reject
(1 − α) α
0 c F
Economics 20 - Prof. Anderson 29
32. The R2 form of the F statistic
Because the SSR’s may be large and unwieldy, an
alternative form of the formula is useful
We use the fact that SSR = SST(1 – R2) for any
regression, so can substitute in for SSRu and SSRur
Economics 20 - Prof. Anderson 30
33. Overall Significance
A special case of exclusion restrictions is to test
H0: β1 = β2 =…= βk = 0
Since the R2 from a model with only an intercept
will be zero, the F statistic is simply
Economics 20 - Prof. Anderson 31
34. General Linear Restrictions
The basic form of the F statistic will work
for any set of linear restrictions
First estimate the unrestricted model and
then estimate the restricted model
In each case, make note of the SSR
Imposing the restrictions can be tricky –
will likely have to redefine variables again
Economics 20 - Prof. Anderson 32
35. Example:
Use same voting model as before
Model is voteA = β0 + β1log(expendA) +
β2log(expendB) + β3prtystrA + u
now null is H0: β1 = 1, β3 = 0
Substituting in the restrictions: voteA = β0
+ log(expendA) + β2log(expendB) + u, so
Use voteA - log(expendA) = β0 +
β2log(expendB) + u as restricted model
Economics 20 - Prof. Anderson 33
36. F Statistic Summary
Just as with t statistics, p-values can be
calculated by looking up the percentile in
the appropriate F distribution
Stata will do this by entering: display
fprob(q, n – k – 1, F), where the appropriate
values of F, q,and n – k – 1 are used
If only one exclusion is being tested, then F
= t2, and the p-values will be the same
Economics 20 - Prof. Anderson 34