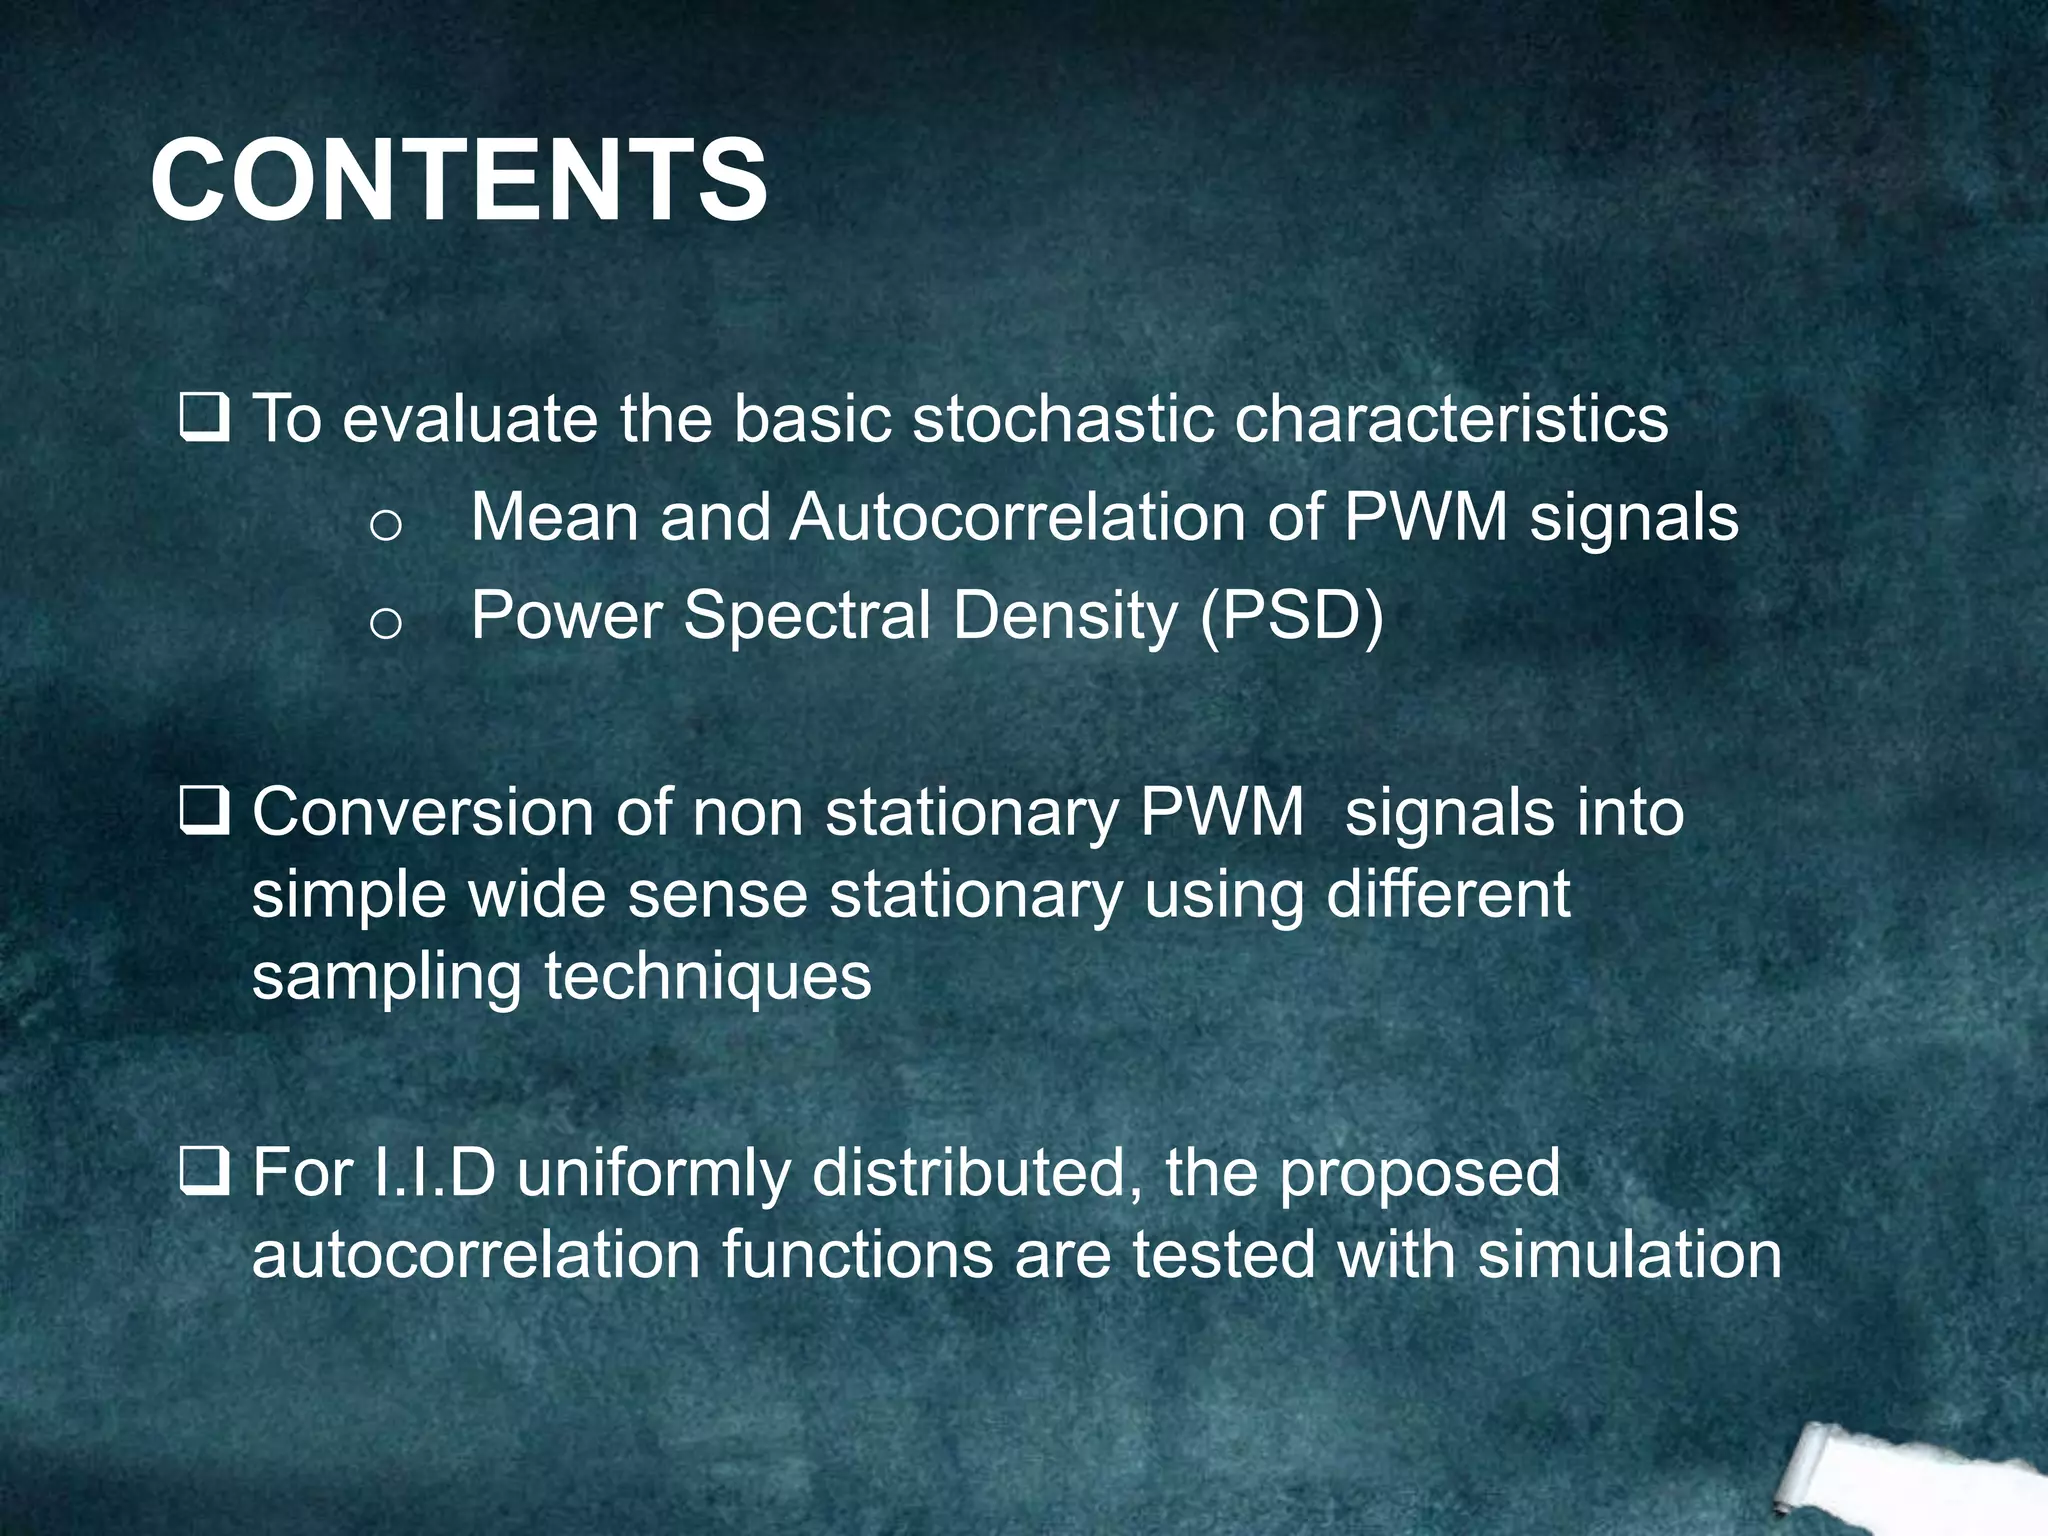
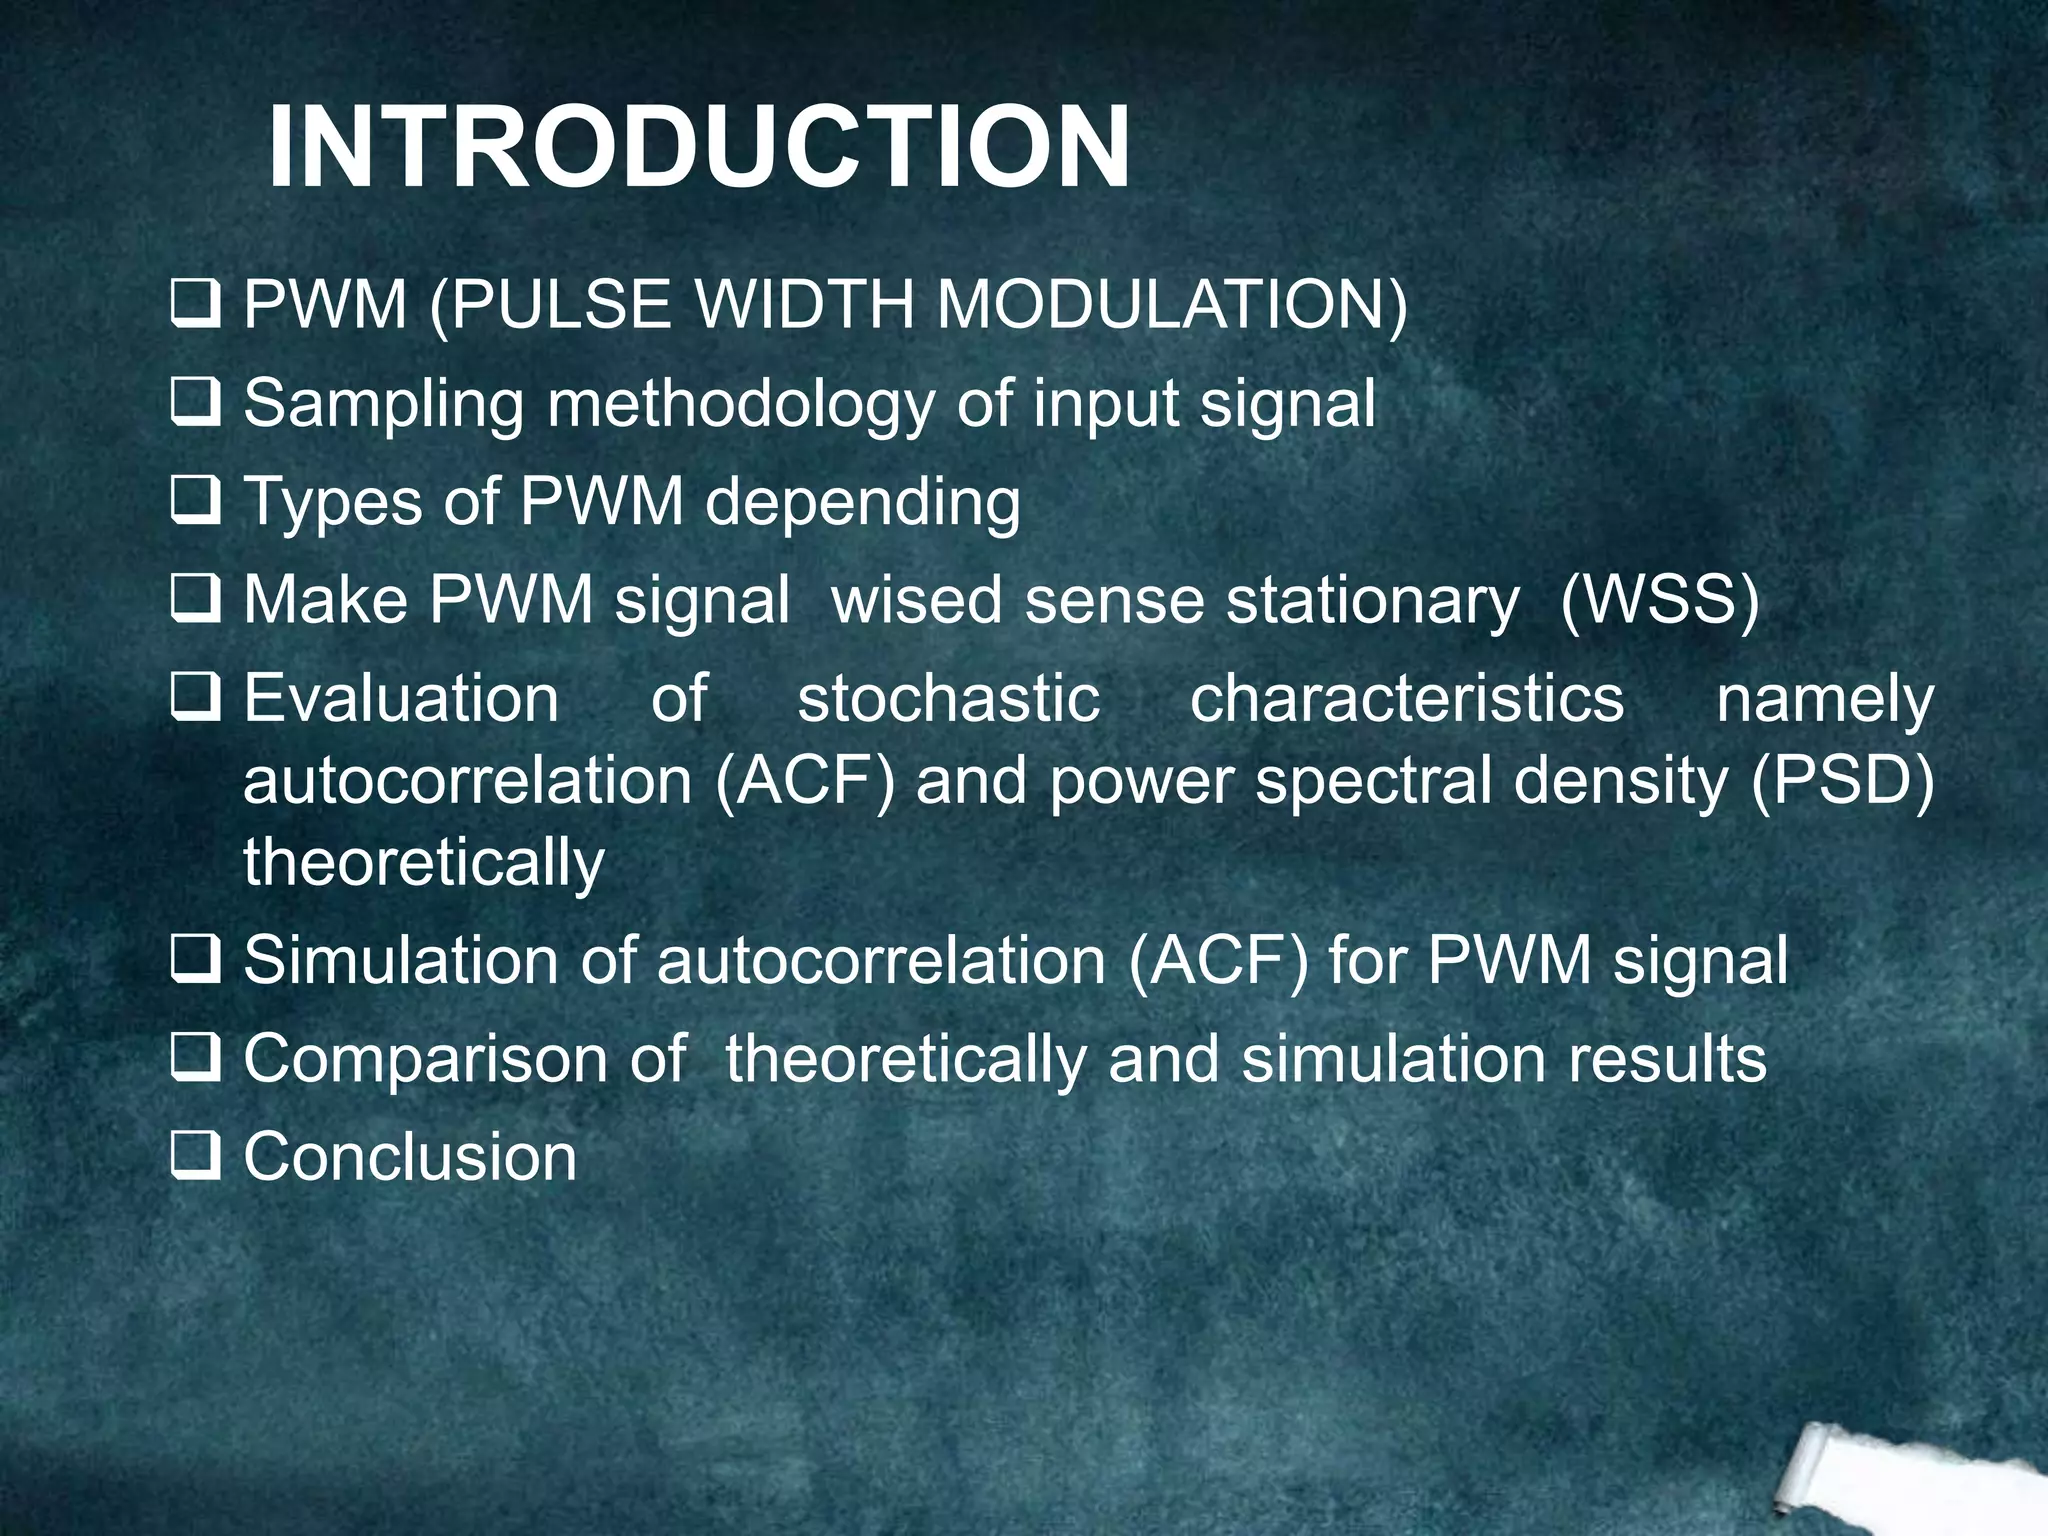
The document presents an analysis of pulse width modulation (PWM) signals, focusing on their stochastic characteristics, including mean, autocorrelation, and power spectral density (PSD). It discusses the conversion of non-stationary PWM signals into wide sense stationary (WSS) signals through different sampling techniques and presents simulation results compared with theoretical expectations. The findings indicate that PWM signals with randomized starting points and independent and identically distributed (i.i.d.) pulse widths are necessarily WSS.


![ Randomizing starting point
by Φ, uniformly distributed
over [0,T]
Limiting input signal
amplitude(bk) over sample
interval [0,1] uniformly and
using sampling methodology
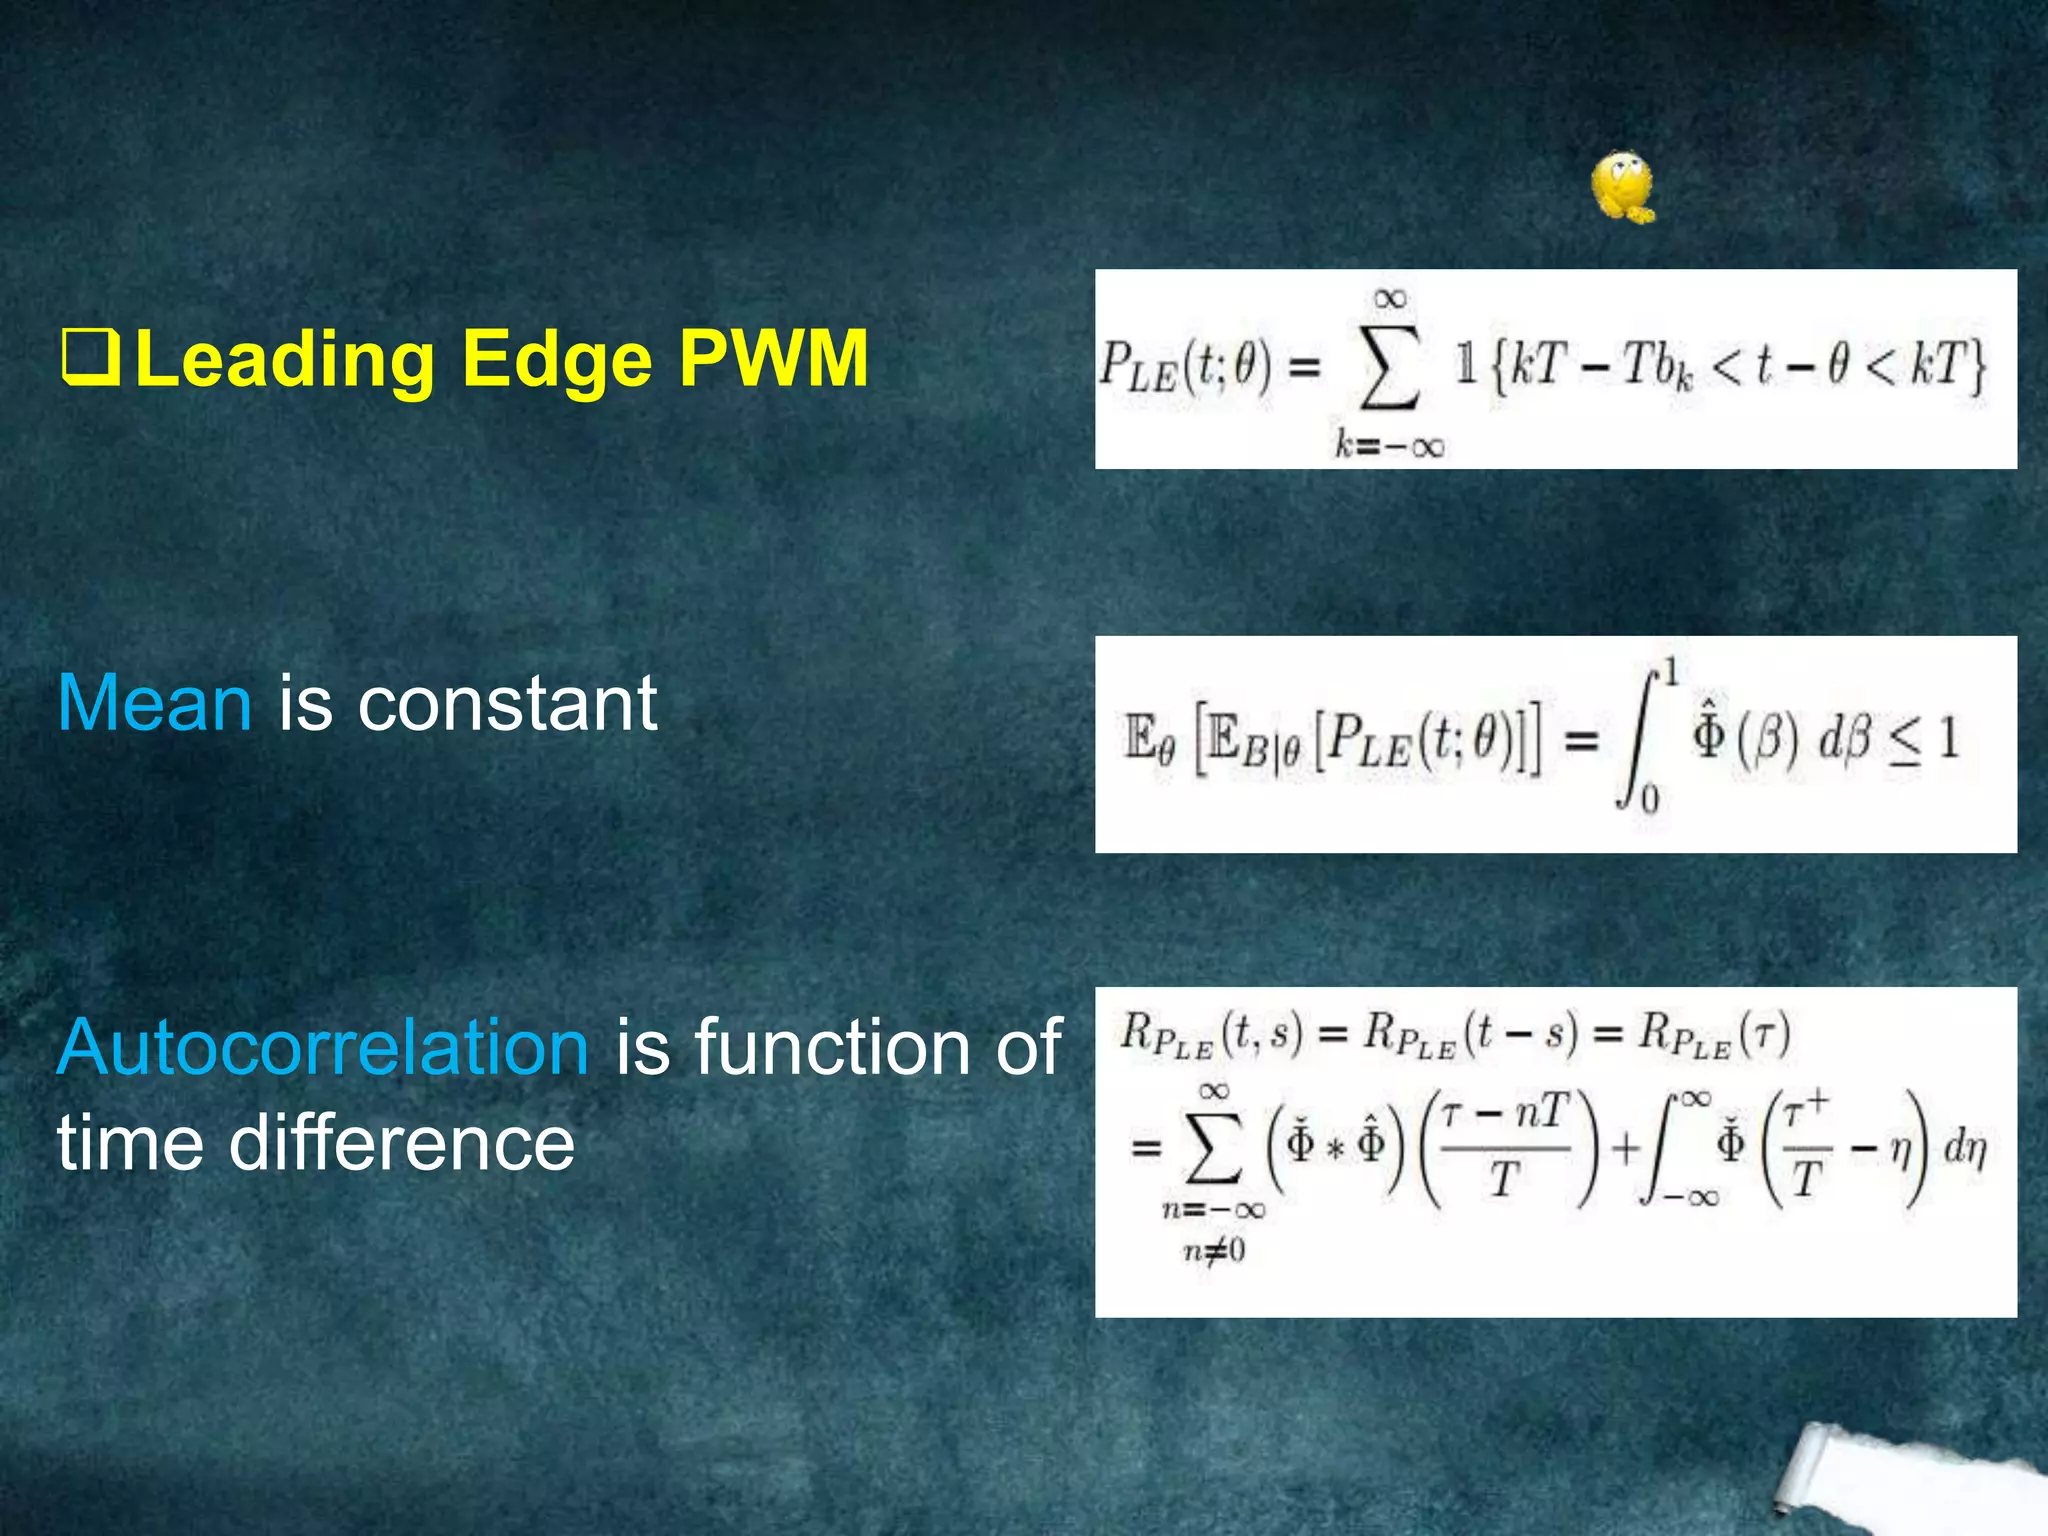
WSS and IID PWM signal
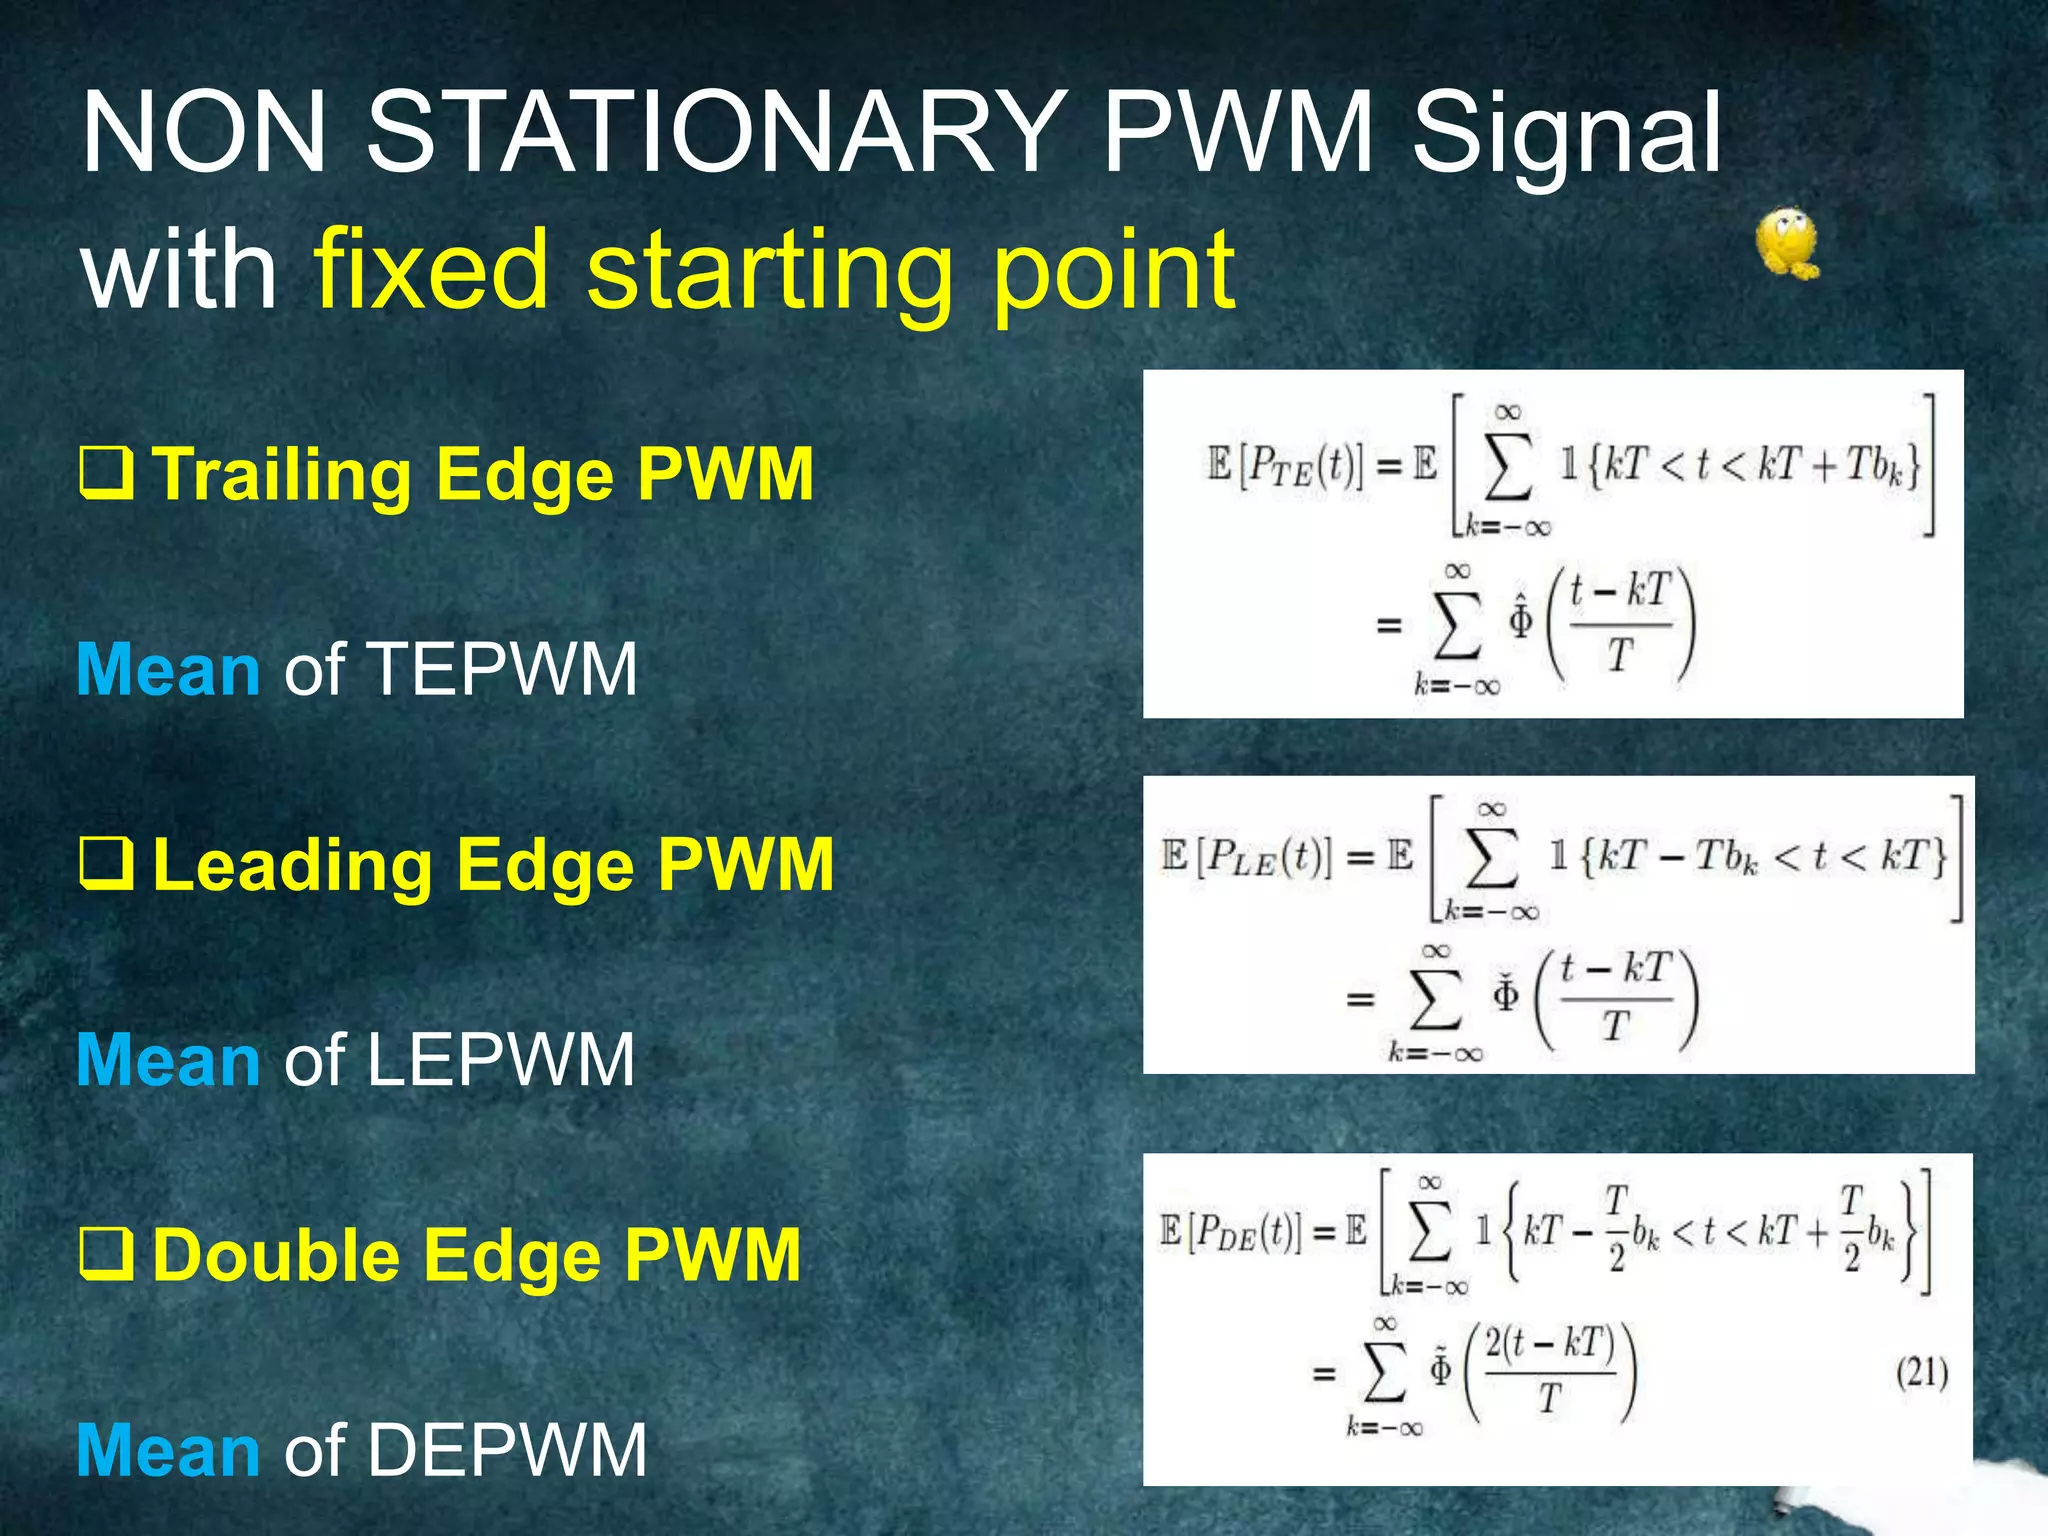
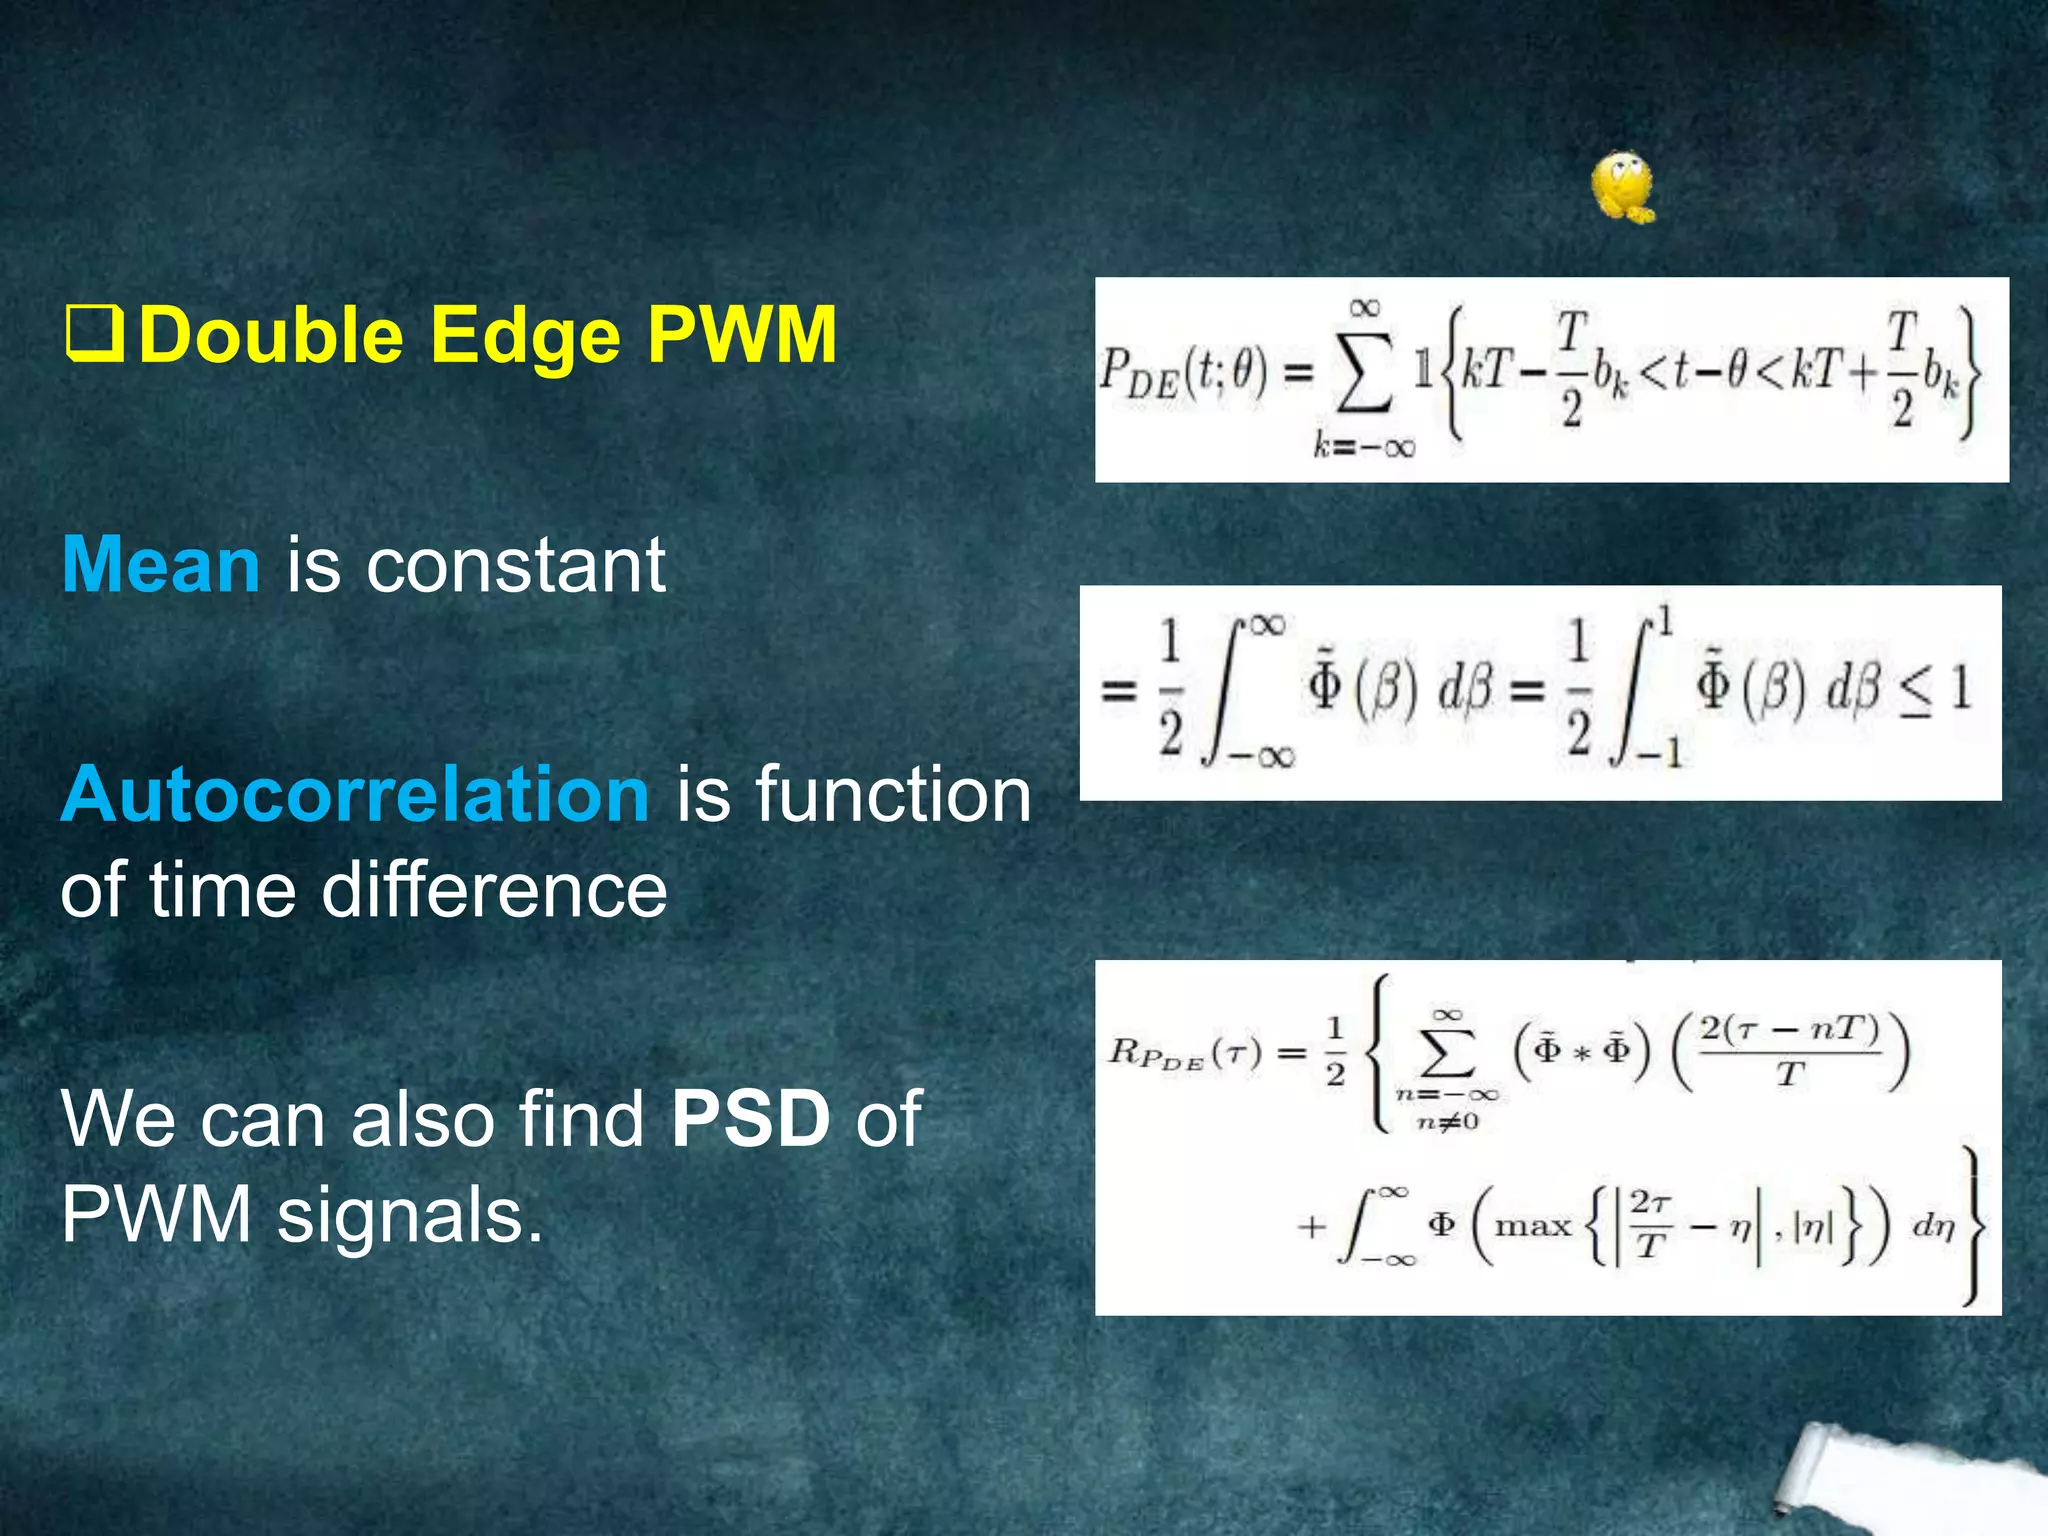
Trailing Edge PMW Mean is
constant Autocorrelation is
function of difference as
τ=t-s
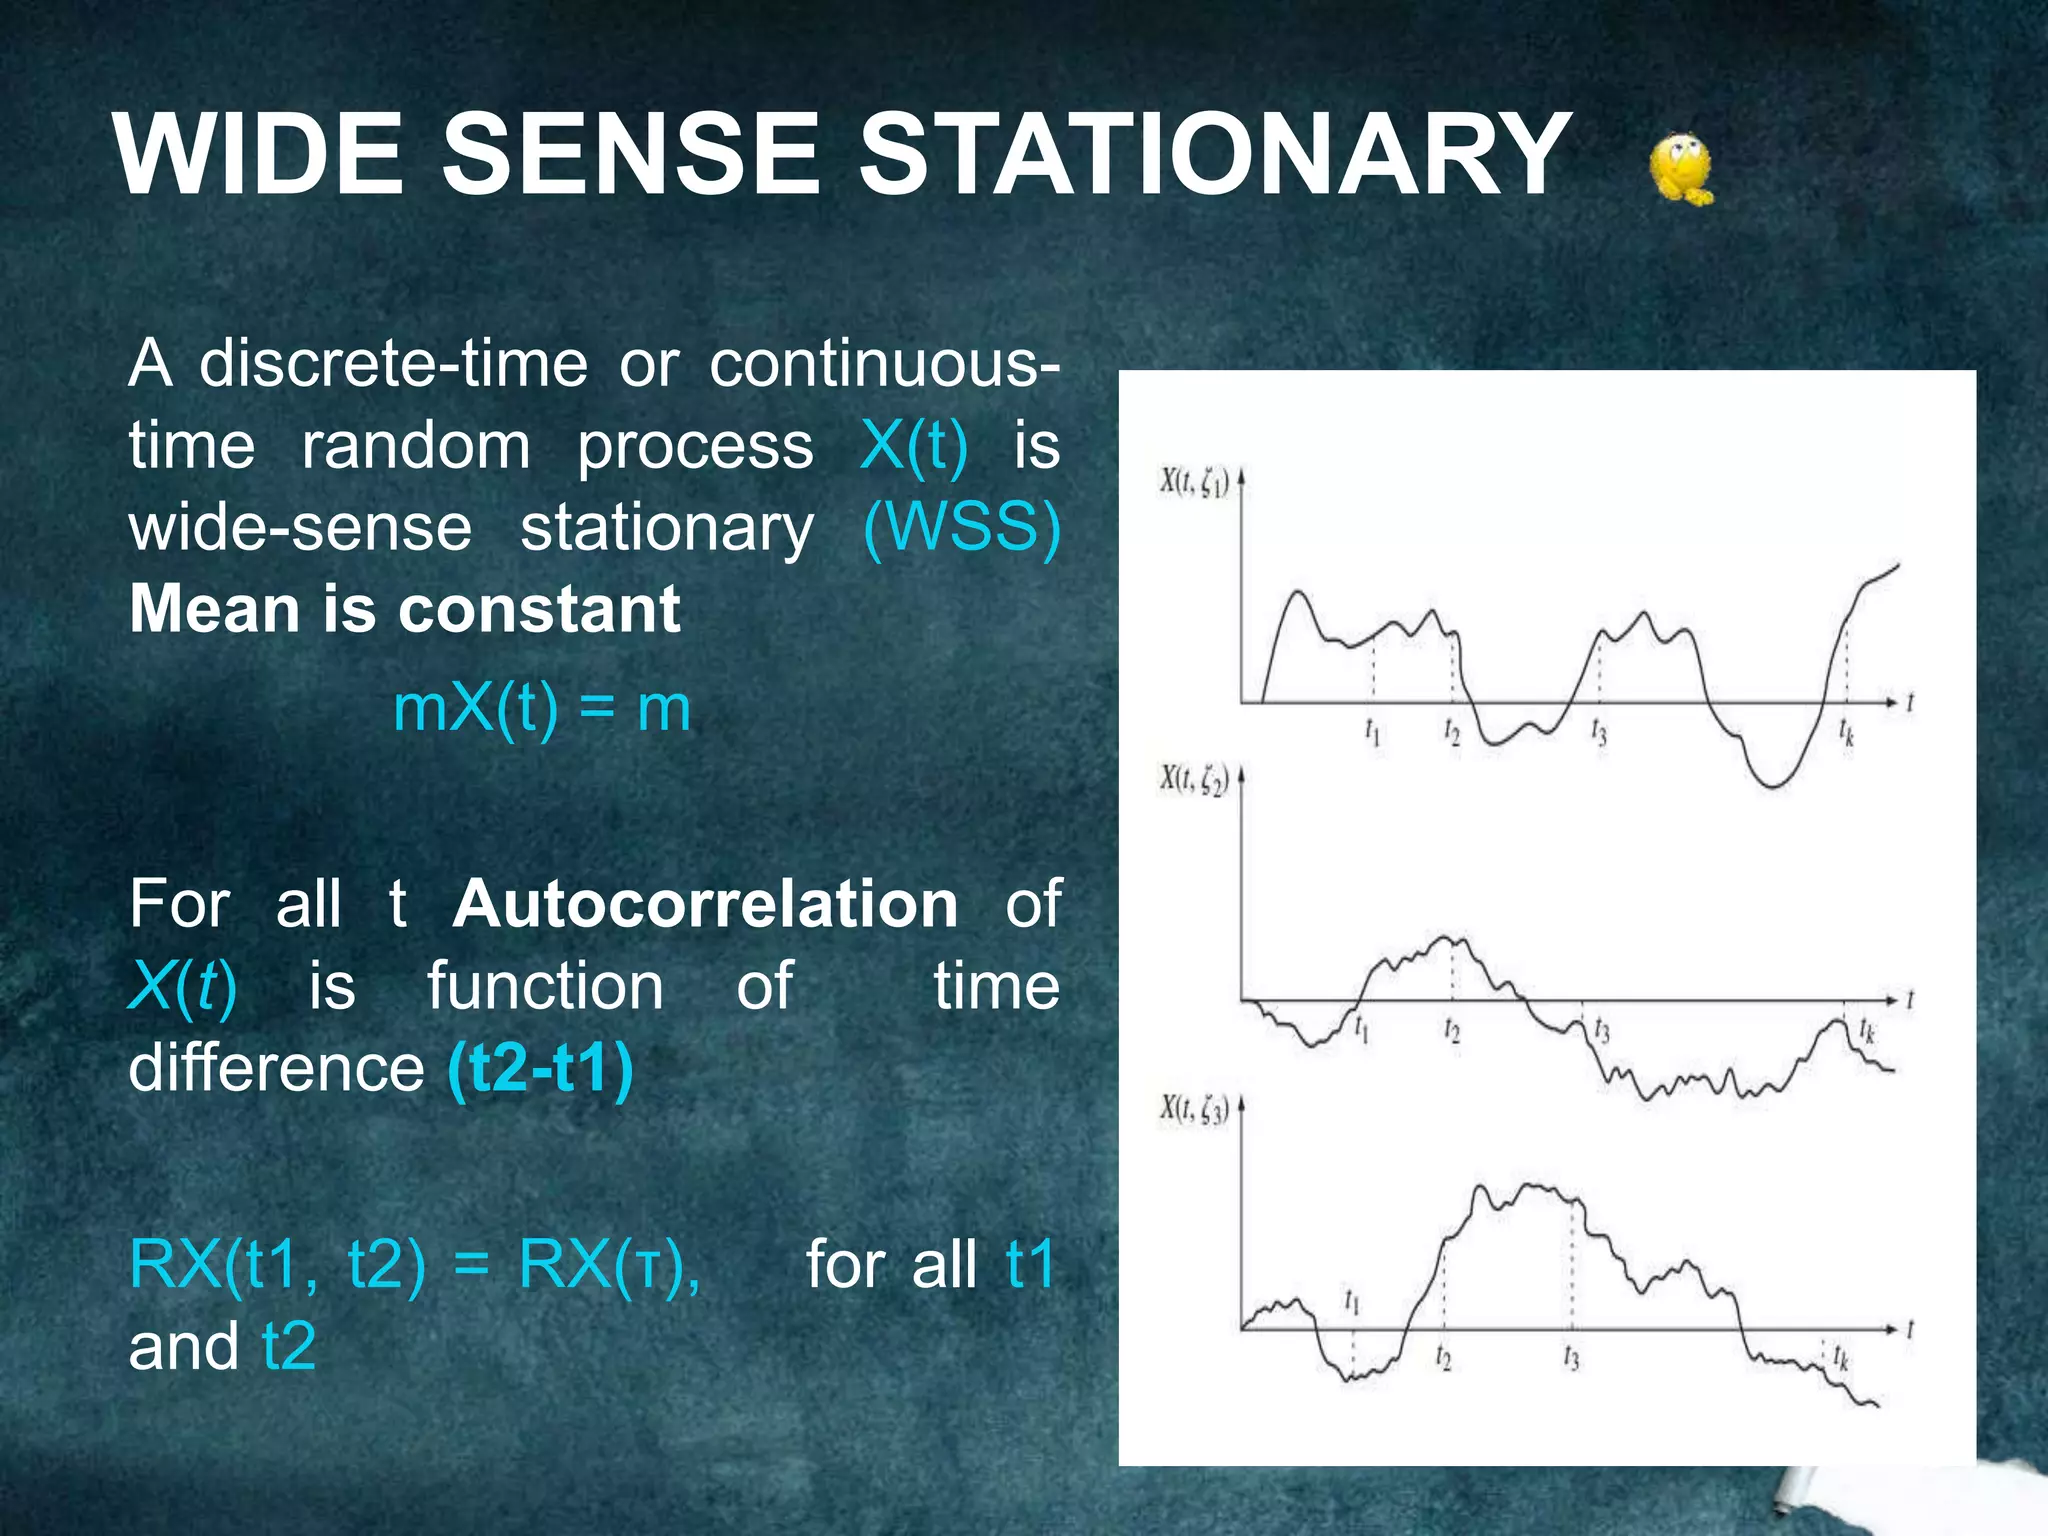
CONVERSION IN WIDE SENSE
STATIONARY](https://image.slidesharecdn.com/stocasticproject-170202121807/75/presentation-on-research-paper-related-to-scotastic-12-2048.jpg)


![3.[14 28]space vector based dual zero-vector random centered distribution pwm...](https://cdn.slidesharecdn.com/ss_thumbnails/3-14-28spacevectorbaseddualzero-vectorrandomcentereddistributionpwmalgorithmfordirecttorquecontrolofinductionmotordriveforreducedacousticalnoise-111203185000-phpapp02-thumbnail.jpg?width=640&height=640&fit=bounds)