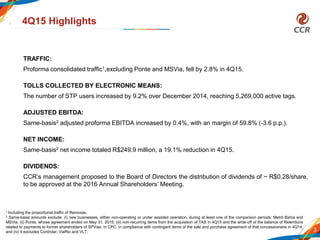
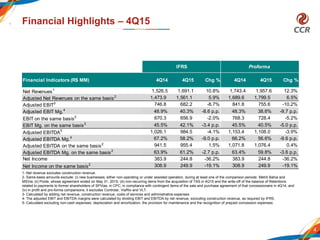
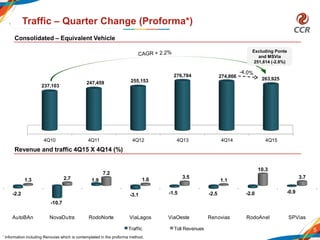
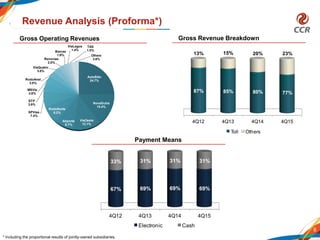
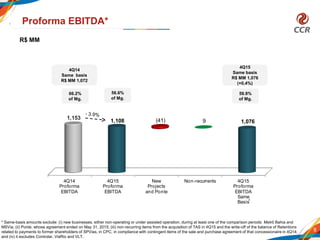
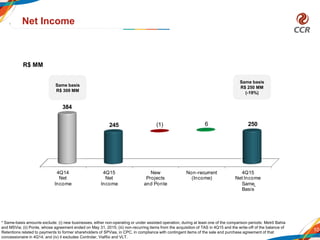
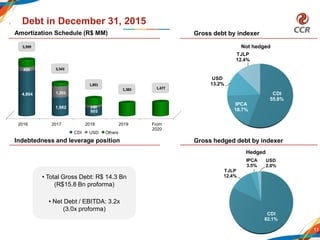
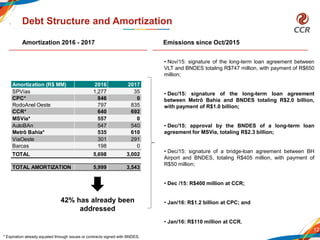
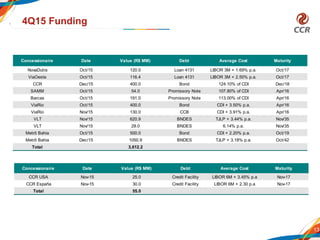
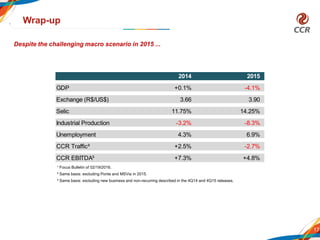
- Traffic fell 2.8% in 4Q15 excluding new businesses. Toll collection via electronic means increased to 69% of total.
- Adjusted EBITDA on a same-basis increased slightly by 0.4% with margins of 59.8%. Net income on the same basis fell 19.1%.
- The company addressed 42% of debt maturing in 2016-2017 and obtained new funding of over R$3.6 billion in 4Q15 at favorable rates.
- Traffic decreased 3.7% in 2Q16 excluding new acquisitions. Adjusted EBITDA increased 5.9% with a margin of 63.3%, up 1.9 percentage points. Net profit decreased 36.8% to R$147.8 million on the same basis.
- Gross debt totaled R$14.7 billion, with debt amortization of R$1.346 billion in 2016 and R$4.347 billion in 2017. Average debt cost was 124.95% of CDI. Net debt to EBITDA was 3.3x.
- Recent funding included R$4.047 billion in debentures and loans, extending debt maturity profile. Invest
- Traffic fell 2.4% in 1Q16 excluding new projects
- Adjusted EBITDA increased 7.1% to R$1.122 billion on a same-basis
- Net income grew 2.9% to R$252.7 million in 1Q16 on a same-basis
CCR reported financial results for the third quarter of 2016. Consolidated traffic decreased 1.5% year-over-year excluding a new acquisition. Adjusted EBITDA increased 151.1% due to a one-time gain from the sale of STP shares, or increased 3.2% excluding this gain. Net profit reached R$1,151.1 million, an increase of 366.0% driven primarily by the STP sale, or decreased 1.7% excluding one-time items. CCR also provided highlights on recent debt issuances and an extension of its debt maturity profile.
- Traffic fell 7.0% in 4Q16 compared to 4Q15. Adjusted EBITDA increased 0.4% with a margin of 58.4% (+0.2 p.p.).
- Net income totaled R$169.5 million, down 30.8%. Same-basis net income was R$214.4 million, down 12.9%.
- In February 2017, the Company announced the completion of a primary share offering that raised R$4.07 billion through the issue of 254 million new shares.
- Traffic fell 2.8% in 1Q17 compared to 1Q16. Adjusted EBITDA increased 3.9% to R$1.03 billion with a margin of 61.0%.
- Net income was R$329.0 million, down 32.9%. Excluding new businesses, net income was R$338.5 million, down 46.6%.
- Gross debt was R$14.9 billion, up 1.1%. Net debt to EBITDA was 1.8x. The Company raised R$362 million in local debt and USD$8 million in international loans.
- CCR's consolidated traffic excluding Ponte fell 2.0% in 2Q15 compared to the previous year. Toll revenue collected electronically increased 10.6% reaching over 5 million active tags.
- Adjusted EBITDA on a same-basis increased 4.9% in 2Q15 versus 2Q14, with an EBITDA margin of 62.6% representing a 1.1 percentage point reduction.
- Net income on a same-basis totaled R$284.6 million in 2Q15, a 0.5% reduction over 2Q14.
- Traffic fell 0.8% while adjusted EBITDA increased 69.7% and net profit increased 357.9%
- Key corporate events included acquiring control of ViaQuatro and increasing stake in ViaRio
- Financial highlights showed increases in revenues, adjusted EBITDA, and net income, while margins expanded significantly
- Costs grew due to variable compensation, collective bargaining agreements, and one-off acquisition effects
- Fundraising efforts in the quarter raised over R$1.3 billion, while debt metrics like net debt/EBITDA remained stable
- CCR's consolidated traffic fell 0.7% in 4Q14 but grew 2.5% in 2014. Toll collection by electronic means increased, with over 4.8 million active tags.
- Adjusted EBITDA on a same-basis increased 4% in 4Q14, with a margin of 64.1%. In 2014, adjusted EBITDA grew 7.3% with a margin of 65.3%.
- Net income on a same-basis decreased 10.7% in 4Q14 due to new projects not yet generating revenue. CCR proposed additional dividends of R$100.8 million.
- Traffic grew 4.1% in 3Q17 compared to 3Q16. Adjusted EBITDA on a same-basis grew 5.7% with margins of 63.8% (+0.6 p.p.). Net income on a same-basis grew 63.1%.
- Cash costs were up 2.0% on a same-basis to R$731 million due to inflation adjustments. Adjusted EBITDA was up 5% on a same-basis to R$1.28 billion.
- Gross debt was R$14.7 billion, with net debt/EBITDA of 2.2x. The company raised R$1.295 billion in new debt in 3
- Traffic fell 3.8% in 1Q15 compared to 1Q14. Adjusted EBITDA on a same-basis increased 2.8% with a margin of 65.6%. Net income on a same-basis was R$312.6 million, down 13.8%.
- Costs increased due to new projects, wage increases, and a tax provision effect for Ponte. Excluding these factors, cash costs increased 5.2% and EBITDA margin was maintained at 65.6%.
- Financial results were impacted by higher debt and interest rates. Net debt/EBITDA was 2.5x. The leverage reflects investment needs but not potential cash generation from new businesses.
- Traffic grew 4.4% in 4Q17 compared to 4Q16. Adjusted EBITDA increased 17.9% on a same-basis compared to 4Q16, with a margin of 61.3% (+2.9 percentage points).
- Net income totaled R$329.1 million, up 94.2% compared to 4Q16. The company's board proposed additional dividends of approximately R$0.20 per share.
- In January 2018, the company was selected as the best bidder to operate subway lines 5 and 17 in São Paulo through 2038.
Telecom Italia Group reported its 2Q'17 results, with positive trends across key metrics. Total revenues grew 3.2% year-over-year in Italy driven by higher mobile and fixed revenues. EBITDA increased in both Italy and Brazil, with organic EBITDA growth of 8.3% and 16% respectively. Recurring net cash flow was up €1 billion in 1H'17 compared to the same period in 2016, demonstrating continued financial improvements.
BBVA reported results for the third quarter of 2016. Key highlights included:
- Attributable profit of €965 million, an increase of 23.1% compared to the third quarter of 2015 excluding corporate operations.
- Gross income increased 12.7% driven by growth in net interest income, fees and commissions, and trading income.
- Operating expenses grew 4.3% as the bank continued cost control efforts.
- Sound asset quality with the NPL ratio stable at 5.1% and cost of risk at 0.9%.
- Capital generation was strong with the CET1 ratio reaching 11.00%.
- Telecom Italia Group reported its 3Q'17 results, with total revenues of €4.907 billion, up 2.0% YoY on an organic basis. Service revenues were €4.593 billion, up 1.8% YoY organically.
- EBITDA was €2.226 billion for the quarter, representing organic growth of 2.0% YoY. Domestic EBITDA margin was resilient at 47.7% despite commercial investment.
- Domestic service revenues showed stabilization, with positive mobile trends and strong fiber broadband net additions of 249k in the quarter. Total mobile customers grew 333k QoQ.
- Telecom Italia Group reported its 1Q'17 results, showing continued improvement across key metrics. Total revenues increased 0.6% year-over-year, with service revenues up 2.2%. EBITDA grew 5.1% and adjusted net debt declined 7.5%.
- Results were driven by strong performances in both the Domestic and Brazil segments. Domestic revenues grew 1.0% with service revenues up 2.2%, while Brazil revenues increased 2.5%.
- The company is ahead of schedule in its turnaround, with cash cost efficiency targets already 30% achieved for FY2017. Network investments also accelerated to expand fiber and LTE infrastructure across Italy and Brazil.
- Traffic grew 2.3% consolidated and 3.1% proforma including recent acquisitions
- Adjusted EBITDA increased 9.3% on a same-basis and 17.0% reported, with margins of 62.0% and 62.2% respectively
- Net income grew 32.3% on a same-basis and 35.8% as reported
- Telecom Italia Group reported its results for the third quarter of 2016. Total revenues were €3.8 billion, up 1.0% year-over-year on an organic basis.
- Domestic business revenues grew organically by 7.8% year-over-year driven by strong growth in fixed broadband and ICT services. Mobile service revenues increased 1.1% year-over-year.
- TIM Brasil saw a revenue recovery with mobile service revenues up 0.4% year-over-year excluding MTR inflation. Organic EBITDA turned positive in the third quarter reaching a 33.1% margin.
- CCR's consolidated traffic grew 3.9% in 2Q14, while toll revenues increased 5.7%. Adjusted proforma EBITDA increased 5.2% in 2Q14.
- Total costs increased 5.4% in 2Q14 versus 2Q13, driven by a higher average SELIC rate and increased debt levels. Net income decreased 9.4% due to financial expenses.
- CCR maintained a comfortable leverage ratio of 2.0x net debt to EBITDA. The company continues investing in maintenance and improvements across its portfolio.
TIM FY’16 and New Plan: A Transforming CompanyGruppo TIM
This document provides a preliminary report on the financial results of Telecom Italia Group for fiscal year 2016 as well as the company's strategic plan for 2017-2019. It includes an overview of key financial metrics for FY2016 such as revenues, EBITDA, net debt, and cash flow. Performance improvements are seen in the second half of 2016 compared to the first half. The strategic plan aims to further improve infrastructure, enhance commercial approaches, and drive efficiency across the company and its subsidiaries.
Gross revenue for Arezzo&Co reached R$367.0 million in 4Q15, a decrease of 2.3% over 4Q14. Net income was R$33.5 million, with a margin of 11.8% and growth of 9.4% excluding non-recurring items in 4Q14. EBITDA for 4Q15 amounted to R$44.7 million, with a margin of 15.8%. The company opened 18 new stores and expanded 3 existing stores, growing its sales area by 7.3% over the last 12 months. Cash generation was strong at R$49.3 million in the quarter.
- Traffic fell 3.9% in 4Q18 compared to 4Q17, excluding suspended axle exemptions traffic increased 0.4%
- Adjusted EBITDA increased 3.6% in 4Q18 on a same-basis compared to 4Q17, with an adjusted margin of 61.7% (+0.4 percentage points)
- Same-basis net income in 4Q18 totaled R$356.9 million, down 21.1% from 4Q17
- Earnings results for 1Q14 showed consolidated traffic growth of 9.1% and tolls collected electronically increasing 14.2%. Adjusted EBITDA on a same basis increased 14.6% and net income on a same basis grew 7.5%.
- Costs were up 1.6% on a same basis, reflecting higher costs from new projects. Financial results declined due to higher debt levels and interest rates.
- The company maintained a comfortable leverage ratio and dividend payout remains over 50% of net income, demonstrating a continued commitment to shareholders.
This document summarizes Magnesita's earnings call for the second quarter of 2015. It discusses financial results including revenues, gross profit margins, sales by segment and region. It also provides information on capital expenditures, working capital, debt levels and leverage ratios. Key highlights include a 1% increase in revenues year-over-year and a 14.3% EBITDA margin. Net debt to EBITDA was 3.7x at the end of the quarter. Contact information is provided for the investor relations team.
This document contains the agenda and presentation slides for Telecom Italia Group's 3Q 2015 results presentation. The presentation discusses recent highlights such as domestic performance and regulatory changes. It provides an overview of 3Q 2015 results including declines in total revenues and service revenues but improvements in mobile revenues. Charts and data are presented on key metrics like fixed broadband users, fiber coverage, mobile subscribers and ARPU, and EBITDA performance.
1. BBVA reported its first quarter 2015 results with income growth across all regions. Net attributable profit increased significantly both including and excluding Venezuela.
2. Risk indicators continued to improve with the NPL ratio down and coverage ratio up. Capital levels remained strong with fully-loaded leverage ratio of 6.2%.
3. Business activity increased in all regions including Spain where new loan production was more dynamic and the digital transformation plan is ongoing. Income grew in the US, Mexico and South America on strong operating performance.
This document summarizes the key financial and operating highlights of TIM Group for the first three months of 2017. The Group reported consolidated revenues of 4.8 billion euros, up 8.5% compared to the first quarter of 2016. EBITDA was 1.99 billion euros, up 16.2% compared to the first quarter of 2016, with an EBITDA margin of 41.3%. Operating profit was 865 million euros, up 22.9% compared to the first quarter of 2016. Adjusted net financial debt at March 31, 2017 was 25.235 billion euros.
Earnings Release Presentation - First Quarter 2010 (1Q10).MRVRI
MRV reported strong financial results for the first quarter of 2010. Net revenue increased 108.7% to R$568.5 million while net income rose 147.4% to R$115.9 million. EBITDA also grew 136.4% to R$195.7 million compared to the first quarter of 2009. For 2010, MRV expects contracted sales to be between R$3.7-4.3 billion with an EBITDA margin of 25-28%.
- Consolidated traffic fell 5.5% in 2Q18 compared to 2Q17. Adjusted EBITDA on a same-basis increased 1.0% to R$1,091.7 million, with a margin of 58.3% (-0.4 p.p.). Net income on a same-basis totaled R$300.9 million, down 5.2%.
- Leonardo Couto Vianna took over as CEO of CCR on August 1, 2018. ViaMobilidade's commercial operations began on August 4, 2018.
- Gross debt totaled R$16.6 billion as of June 30, 2018, with an average cost of debt of C
- Traffic fell 1.8% in 3Q15 excluding new businesses, while toll revenue increased 1.9% due to toll increases.
- Adjusted EBITDA on a same-basis increased 8.8% to R$1.17 billion in 3Q15, with a margin of 67.8%.
- Net income on a same-basis was R$352 million, a 0.7% reduction, impacted by higher financial expenses due to increased debt levels related to investments in new projects.
- Traffic fell 0.8% while adjusted EBITDA increased 69.7% and net profit increased 357.9%
- The company acquired control of ViaQuatro and an additional stake in ViaRio
- Adjusted EBITDA on a same-basis increased 4.8% due to cost optimization efforts despite lower traffic
- Net debt to EBITDA was 1.8x due to strong earnings growth and debt refinancing at lower interest rates
BBVAResultsResults Presentation
1. BBVA reported results for the first quarter of 2016, with earnings impacted by seasonality, lower net trading income, and foreign exchange effects. Impairments and provisions were lower, mainly in Spain and real estate.
2. Net attributable profit was €709 million, down 53.8% year-on-year. Excluding one-off corporate operations, net profit fell 25.6%.
3. BBVA remains well capitalized with a fully-loaded Common Equity Tier 1 ratio of 10.54% and leverage ratio of 5.3% as of March 2016.
BBVA reported its 2015 results, highlighting resilience in key markets like the US and Spain, sustained domestic demand, and low interest rates. Gross income grew 8.7% to €16.4 billion for the year, while net attributable profit excluding corporate operations rose 5.6% to €3.8 billion. Digital transformation continued advancing, with a 45% increase in mobile customers to 8 million. The group maintained a strong solvency and liquidity position, with core capital of 12.1% and a leverage ratio of 6%.
This document provides key figures from VIDRALA's full year 2015 results. Some highlights include:
- Sales increased 71.4% to €802.6 million due to the acquisition of Encirc. On a proforma basis, sales grew 5.0% year-over-year.
- EBITDA grew 48.6% to €161.3 million. On a proforma basis, EBITDA declined 2.6% year-over-year.
- Free cash flow was €88.2 million, a 22.0% increase. Net debt declined 15.0% from the start of the year to €404.3 million.
- Earnings per share grew 18
BBVA reported its results for the second quarter of 2018. Key highlights included:
- Solid core revenue growth and improved efficiency leading to higher profits.
- Positive trends in digital sales and customers with digital transactions increasing 40.6% year-on-year.
- Sound risk indicators with the NPL ratio at 4.4% and coverage ratio at 71%.
- Continued focus on shareholder value with a proposed shareholders' remuneration of 11.40% of capital.
BBVAResultsResults Presentation
2016
- BBVA reported its 2Q16 results with solid quarterly results and earnings growth on track. Gross income grew 14.1% driven by higher net trading income and dividends.
- Recurring revenues showed a positive trend while risk indicators improved. Specific items in the quarter included gains from the VISA Europe deal and a contribution to the Single Resolution Fund.
- Attributable profit increased 5.4% vs 2Q15 driven by growth across most geographies except Spain, with a strong performance from Turkey. BBVA maintained solid capital ratios and ongoing cost control efforts.
CCR reported its 1Q13 earnings results. Some key highlights included:
- Traffic increased 2.0% compared to 1Q12. Electronic toll collection reached 3,875 thousand active tags, up 14.9% over March 2012.
- Net income increased 16.6% to R$336.7 million due to improved operational and financial performance.
- Adjusted EBITDA was R$783.6 million, up 7.4% over 1Q12, though the adjusted EBITDA margin declined slightly to 65.0% due to the addition of Barcas, which is still in the initial phase.
- The financial results improved, reflecting lower interest rates and active liability management, reducing
BBVA reported its 2Q18 results, with the following key highlights:
- Net attributable profit increased 18.2% to €1.3 billion
- Core revenues grew 10.4% driven by strong performance in Spain, Turkey and Mexico
- Efficiency improved with an 82 basis point decrease in the cost-to-income ratio
- Sound risk indicators with the NPL ratio decreasing 47 basis points and cost of risk down 11 basis points
- Capital position remains strong with a CET1 ratio of 11.4%
CCR reported financial results for the third quarter of 2014, with consolidated traffic falling 1.3% compared to the prior year. Revenue increased 5.9% to R$1.458 billion while adjusted EBITDA rose 5.3% to R$977.6 million on a same-basis excluding new projects. Net income on the same basis totaled R$366.2 million, an 8.1% reduction. The company maintained its disciplined approach to costs. CCR remains committed to paying at least 50% of net income as dividends and announced an interim dividend of R$0.7359 per share.
FY 2015 Preliminary Results & 2016-2018 Plan UpdateGruppo TIM
This document provides an agenda and summary of Telecom Italia Group's FY 2015 preliminary results presentation and 2016-2018 plan update. The presentation highlights include a decline in service revenues and EBITDA for FY 2015 but an increase in Capex. For Italy, service revenues grew quarter-over-quarter supported by growth in LTE users and fiber coverage. Mobile revenues approached parity in the fourth quarter compared to previous years. Fixed business saw a progressive build-up of broadband net additions. The document also outlines financial targets for 2016-2018 and an update on TIM Brasil's plan for the same period.
- Revenue for the year ended 31 March 2020 was £87.5 million, down 6% from the previous year. Adjusted EBITDA was £17.6 million, up 5% from the previous year.
- Operational efficiencies and network upgrades were completed during the year to improve margins. Recurring revenues returned to growth in the second half after declines in previous years.
- A settlement was reached with the FCA regarding past conduct, to be funded with £11.4 million to compensate shareholders. Minimal financial impact was seen from the COVID-19 pandemic.
This document provides a summary of BBVA's 2Q2015 results. Key highlights include a 12.4% increase in net interest income, growth in digital customers and mobile customers of 36% and 59% respectively, and a CET1 ratio of 10.4% on a fully-loaded basis and 12.3% on a phased-in basis. Net attributable profit increased 78.8% to €1.228 billion, driven by strong activity and P&L dynamics across most business areas.
This document summarizes BBVA's 3Q 2015 results. Key highlights include:
- Attributable profit increased 38.2% excluding corporate operations due to higher recurring revenue and improved risk indicators.
- Solid activity growth of 9% in lending and 11.6% in customer funds.
- Net interest income grew 12.5% and fees grew 16% year-to-date.
- The NPL ratio improved to 5.9% with coverage at 71% due to lower provisions in Spain.
- The document is an investor presentation for a company's third quarter 2016 financial results.
- It highlights improvements in adjusted EBITDA (+1,400%), earnings per share (+33%), gross profit margin (+210 bps), and total cash (+219%) compared to the third quarter of 2015.
- The presentation includes sections on financial highlights, operating metrics, and financial statements to summarize the company's performance and financial position.
Aggiornamento Business Plan FCA 2014-2018Mirco Magni
The document provides an update on a business plan for the years 2014-2018. It summarizes key actions taken since the original May 2014 plan to strengthen the company's balance sheet, including debt reductions, equity offerings, and the spin-off of Ferrari. It also provides updates for several regions, noting market changes and implications for the company. Targets for revenues, profits, debt, and volumes by 2018 are increased compared to the original plan.
CCR reported its 3Q13 earnings results. Consolidated traffic increased 7.4% compared to 3Q12. Adjusted EBITDA on the same basis increased 18.1% to R$922 million, with margins of 68.1%. Interim dividends of R$0.68 per share were approved. Subsequent events included the transfer of 10% of STP shares to Raízen and winning the concession for the Salvador metro system. The presentation discussed financial highlights, traffic trends, costs, debt levels and investments for the quarter.
- First quarter 2015 financial results showed solid performance with revenue increasing 8.2% on a constant currency basis and organic revenue growth of 6.1%. Adjusted EBITDA grew 3.4% and the adjusted EBITDA margin was maintained at 44.8%.
- Information segment organic revenue grew 6.3% driven by new business wins. Solutions segment organic revenue grew 14.4% due to growth in managed services and enterprise software. Processing segment organic revenue declined 2.4%.
- The company continues to maintain a strong balance sheet and reduced net debt by 28.3% through strong operating cash flow and cash inflows from option exercises.
- Qube Holdings reported solid underlying earnings for the first half of the 2016 fiscal year despite challenging market conditions. Revenue declined slightly due to lower volumes from existing customers.
- The company continued focusing on cost reductions and operational efficiencies to mitigate lower activity levels. New facilities also helped improve margins.
- Qube secured new customers and contracts through innovative logistics solutions, and pursued growth initiatives such as the proposed acquisition of Patrick Container Terminals and development at Moorebank.
4Q16/2016 Results Presentation - CPFL EnergiaCPFL RI
This document provides a summary of 4Q16 and full year 2016 results for CPFL Energia. Some key highlights include:
- Sales increased 6.8% in 4Q16 and decreased 3.3% excluding a new acquisition. Load decreased 3.3% excluding the acquisition.
- EBITDA decreased 15.7% in 4Q16 and 0.4% for the full year, driven by lower distribution results due to regulatory and market factors.
- Net income decreased 62.2% in 4Q16 and was flat for the full year, impacted by higher financial expenses from debt and exchange rate variations.
- The company maintained strong financial metrics with leverage of 3.21x net debt/
Este documento apresenta os resultados financeiros da CCR no quarto trimestre de 2018. Os principais pontos são:
1) O tráfego consolidado apresentou redução de 3,9%, enquanto o EBITDA ajustado cresceu 3,6% em relação ao mesmo período do ano anterior.
2) O lucro líquido atingiu R$356,9 milhões na mesma base de comparação, representando uma queda de 21,1%.
3) Eventos subsequentes incluem a assinatura do contrato de concessão da ViaSul e
O documento apresenta os resultados financeiros da CCR no 2T18. O tráfego consolidado teve redução de 5,5% em relação ao ano anterior. O EBITDA ajustado cresceu 1% na mesma base de comparação, com margem de 58,3%, enquanto o lucro líquido reduziu 5,2%. Novos negócios e eventos subsequentes são destacados.
Este documento apresenta os resultados financeiros da CCR no primeiro trimestre de 2018, destacando:
1) O tráfego consolidado cresceu 2,3% e o EBITDA ajustado aumentou 9,3%;
2) O lucro líquido atingiu R$ 446,8 milhões, um crescimento de 35,8%;
3) A dívida bruta total é de R$ 17,3 bilhões, com alavancagem de 2,2x medida pelo índice Dívida Líquida/EBITDA.
O relatório apresenta os resultados financeiros da CCR no 4T17, destacando:
1) Crescimento de 4,4% no tráfego consolidado e de 17,9% no EBITDA ajustado na mesma base em relação ao 4T16;
2) Lucro líquido de R$329,1 milhões no 4T17, aumento de 94,2% em relação ao 4T16;
3) Proposta de distribuição de dividendos complementares de R$0,20 por ação.
This document summarizes the key points from a presentation on organization, focus, and governance for perpetuating success at CCR Group. It discusses CCR's expansion from 5 companies in 2005 to over 20 companies in 2017 across roads, urban mobility, airports, and services in Brazil and internationally. The presentation outlines CCR's organizational structure and roles, as well as business opportunities in roads, urban mobility projects, and other markets in Brazil, Chile, and Argentina. Traffic trends, economic indicators, and specific projects are also mentioned.
O documento discute estratégias para perpetuar o sucesso da organização no futuro, abordando tópicos como organização, foco e governança. Apresenta o histórico de crescimento da empresa e oportunidades em contratos atuais e novos negócios no Brasil e no exterior.
O documento apresenta os resultados financeiros da CCR no 3T17, com destaque para:
1) Crescimento de 4,1% no tráfego consolidado e de 5,7% no EBITDA ajustado na mesma base em comparação com o 3T16.
2) Lucro líquido de R$ 472,3 milhões no trimestre, queda de 59% devido a efeitos não recorrentes no 3T16.
3) Endividamento bruto de R$ 14,7 bilhões, com alavancagem de 2,2x medida pelo í
O documento apresenta os resultados financeiros da CCR no 2T17. O tráfego consolidado teve queda de 0,8%, enquanto o EBITDA ajustado cresceu 69,7% e o lucro líquido aumentou 357,9%. Na mesma base, o EBITDA subiu 4,8% e o lucro líquido cresceu 195,8%. A dívida líquida total é de R$14,7 bilhões.
Este documento fornece um resumo dos resultados financeiros da CCR no primeiro trimestre de 2017, destacando:
1) O tráfego consolidado apresentou queda de 2,8%, enquanto o EBITDA ajustado cresceu 3,9% e a margem EBITDA foi de 61%;
2) O lucro líquido alcançou R$ 329 milhões, aumento de 32,9%;
3) As principais captações no trimestre somaram R$ 362,3 milhões.
O documento apresenta os resultados financeiros da CCR no 4T16, com ênfase nos seguintes pontos:
1) O tráfego consolidado apresentou queda de 7%, enquanto o EBITDA ajustado cresceu 0,4% e a margem foi de 58,4%;
2) O lucro líquido atingiu R$169,5 milhões, queda de 30,8%;
3) Em evento subsequente, foi realizada uma oferta de ações que levantou R$4,07 bilhões.
O documento apresenta a agenda de um evento da CCR com palestras sobre estratégias e projetos das empresas do grupo CCR em rodovias, mobilidade urbana e aeroportos. Inclui apresentações sobre a expansão da malha rodoviária e metrô de São Paulo e sobre o desempenho das concessionárias do grupo.
The agenda outlines the schedule for a CCR DAY event, including presentations on various CCR projects and business units from 9:30am to 3:40pm. Some of the featured presentations are on CCR Metrô Bahia works including the status of Line 1 and 2 stations and trains, CCR AutoBAn and CCR SPVias works, CCR ViaOeste projects, and CCR NovaDutra's request for new investments including projects in Serra das Araras.
O documento apresenta os resultados financeiros da CCR no 3T16. Destaca crescimento de 151,1% no EBITDA ajustado e de 366% no lucro líquido na comparação anual. A receita líquida consolidada teve alta de 14,4% no trimestre. O tráfego consolidado apresentou queda de 1,5% na mesma comparação. O endividamento bruto total da companhia é de R$14,9 bilhões com alongamento do perfil da dívida.
Este documento apresenta os resultados financeiros da CCR no 2T16. Destaca queda de 3,7% no tráfego consolidado e crescimento de 5,9% no EBITDA ajustado na mesma base. Apresenta também redução de 36,8% no lucro líquido na mesma base devido ao aumento no resultado financeiro líquido. Por fim, informa sobre emissões de dívida que totalizaram R$4 bilhões no trimestre.
Este documento apresenta os resultados financeiros da CCR no primeiro trimestre de 2016. O tráfego consolidado excluindo a Ponte e MSVia teve queda de 2,4%. O EBITDA ajustado na mesma base teve crescimento de 7,1% com margem de 64,8%. O lucro líquido na mesma base atingiu R$ 252,7 milhões, aumento de 2,9% no 1T16.
O documento apresenta os resultados financeiros da CCR no 4T15. O tráfego consolidado excluindo a Ponte e MSVia teve queda de 2,8%. O EBITDA ajustado na mesma base apresentou crescimento de 0,4% com margem de 59,8%. O lucro líquido na mesma base atingiu R$249,9 milhões, queda de 19,1% no 4T15.
The document summarizes a presentation given by CCR, a Brazilian infrastructure company, about their current business and future outlook. It provides an overview of various transportation projects CCR is involved in, including highways, urban rail, and airports in Brazil and other countries. Updates are given on key performance metrics and investments made in projects like ViaQuatro, CCR Metro Bahia, CCR NovaDutra, CCR MSVia, and VLT Carioca. The presentation indicates that the business environment for infrastructure is promising in Brazil and that CCR has a track record of successful investments and expansion into new projects.
"Does Foreign Direct Investment Negatively Affect Preservation of Culture in the Global South? Case Studies in Thailand and Cambodia."
Do elements of globalization, such as Foreign Direct Investment (FDI), negatively affect the ability of countries in the Global South to preserve their culture? This research aims to answer this question by employing a cross-sectional comparative case study analysis utilizing methods of difference. Thailand and Cambodia are compared as they are in the same region and have a similar culture. The metric of difference between Thailand and Cambodia is their ability to preserve their culture. This ability is operationalized by their respective attitudes towards FDI; Thailand imposes stringent regulations and limitations on FDI while Cambodia does not hesitate to accept most FDI and imposes fewer limitations. The evidence from this study suggests that FDI from globally influential countries with high gross domestic products (GDPs) (e.g. China, U.S.) challenges the ability of countries with lower GDPs (e.g. Cambodia) to protect their culture. Furthermore, the ability, or lack thereof, of the receiving countries to protect their culture is amplified by the existence and implementation of restrictive FDI policies imposed by their governments.
My study abroad in Bali, Indonesia, inspired this research topic as I noticed how globalization is changing the culture of its people. I learned their language and way of life which helped me understand the beauty and importance of cultural preservation. I believe we could all benefit from learning new perspectives as they could help us ideate solutions to contemporary issues and empathize with others.
Vicinity Jobs’ data includes more than three million 2023 OJPs and thousands of skills. Most skills appear in less than 0.02% of job postings, so most postings rely on a small subset of commonly used terms, like teamwork.
Laura Adkins-Hackett, Economist, LMIC, and Sukriti Trehan, Data Scientist, LMIC, presented their research exploring trends in the skills listed in OJPs to develop a deeper understanding of in-demand skills. This research project uses pointwise mutual information and other methods to extract more information about common skills from the relationships between skills, occupations and regions.
BONKMILLON Unleashes Its Bonkers Potential on Solana.pdfcoingabbar
Introducing BONKMILLON - The Most Bonkers Meme Coin Yet
Let's be real for a second – the world of meme coins can feel like a bit of a circus at times. Every other day, there's a new token promising to take you "to the moon" or offering some groundbreaking utility that'll change the game forever. But how many of them actually deliver on that hype?
1. Elemental Economics - Introduction to mining.pdfNeal Brewster
After this first you should: Understand the nature of mining; have an awareness of the industry’s boundaries, corporate structure and size; appreciation the complex motivations and objectives of the industries’ various participants; know how mineral reserves are defined and estimated, and how they evolve over time.
^%$Zone1:+971)581248768’][* Legit & Safe #Abortion #Pills #For #Sale In #Duba...mayaclinic18
Whatsapp (+971581248768) Buy Abortion Pills In Dubai/ Qatar/Kuwait/Doha/Abu Dhabi/Alain/RAK City/Satwa/Al Ain/Abortion Pills For Sale In Qatar, Doha. Abu az Zuluf. Abu Thaylah. Ad Dawhah al Jadidah. Al Arish, Al Bida ash Sharqiyah, Al Ghanim, Al Ghuwariyah, Qatari, Abu Dhabi, Dubai.. WHATSAPP +971)581248768 Abortion Pills / Cytotec Tablets Available in Dubai, Sharjah, Abudhabi, Ajman, Alain, Fujeira, Ras Al Khaima, Umm Al Quwain., UAE, buy cytotec in Dubai– Where I can buy abortion pills in Dubai,+971582071918where I can buy abortion pills in Abudhabi +971)581248768 , where I can buy abortion pills in Sharjah,+97158207191 8where I can buy abortion pills in Ajman, +971)581248768 where I can buy abortion pills in Umm al Quwain +971)581248768 , where I can buy abortion pills in Fujairah +971)581248768 , where I can buy abortion pills in Ras al Khaimah +971)581248768 , where I can buy abortion pills in Alain+971)581248768 , where I can buy abortion pills in UAE +971)581248768 we are providing cytotec 200mg abortion pill in dubai, uae.Medication abortion offers an alternative to Surgical Abortion for women in the early weeks of pregnancy. Zone1:+971)581248768’][* Legit & Safe #Abortion #Pills #For #Sale In #Dubai Abu Dhabi Sharjah Deira Ajman Fujairah Ras Al Khaimah%^^%$Zone1:+971)581248768’][* Legit & Safe #Abortion #Pills #For #Sale In #Dubai Abu Dhabi Sharjah Deira Ajman Fujairah Ras Al Khaimah%^^%$Zone1:+971)581248768’][* Legit & Safe #Abortion #Pills #For #Sale In #Dubai Abu Dhabi Sharjah Deira Ajman Fujairah Ras Al Khaimah%^^%$Zone1:+971)581248768’][* Legit & Safe #Abortion #Pills #For #Sale In #Dubai Abu Dhabi Sharjah Deira Ajman Fujairah Ras Al Khaimah%^^%$Zone1:+971)581248768’][* Legit & Safe #Abortion #Pills #For #Sale In #Dubai Abu Dhabi Sharjah Deira Ajman Fujairah Ras Al Khaimah%^^%$Zone1:+971)581248768’][* Legit & Safe #Abortion #Pills #For #Sale In #Dubai Abu Dhabi Sharjah Deira Ajman Fujairah Ras Al Khaimah%^^%$Zone1:+971)581248768’][* Legit & Safe #Abortion #Pills #For #Sale In #Dubai Abu Dhabi Sharjah Deira Ajman Fujairah Ras Al Khaimah%^^%$Zone1:+971)581248768’][* Legit & Safe #Abortion #Pills #For #Sale In #Dubai Abu Dhabi Sharjah Deira Ajman Fujairah Ras Al Khaimah%^^%$Zone1:+971)581248768’][* Legit & Safe #Abortion #Pills #For #Sale In #Dubai Abu Dhabi Sharjah Deira Ajman Fujairah Ras Al Khaimah%^^%$Zone1:+971)581248768’][* Legit & Safe #Abortion #Pills #For #Sale In #Dubai Abu Dhabi Sharjah Deira Ajman Fujairah Ras Al Khaimah%^^%$Zone1:+971)581248768’][* Legit & Safe #Abortion #Pills #For #Sale In #Dubai Abu Dhabi Sharjah Deira Ajman Fujairah Ras Al Khaimah%^^%$Zone1:+971)581248768’][* Legit & Safe #Abortion #Pills #For #Sale In #Dubai Abu Dhabi Sharjah Deira Ajman Fujairah Ras Al Khaimah%^^%$Zone1:+971)581248768’][* Legit & Safe #Abortion #Pills #For #Sale In #Dubai Abu Dhabi Sharjah Deira Ajman Fujairah Ras Al Khaimah%^^%$Zone1:+971)581248768’][* Legit & Safe #Abortion #Pills #For #Sale In #Dubai Abu Dhabi Sharjah Deira Ajman
Abhay Bhutada, the Managing Director of Poonawalla Fincorp Limited, is an accomplished leader with over 15 years of experience in commercial and retail lending. A Qualified Chartered Accountant, he has been pivotal in leveraging technology to enhance financial services. Starting his career at Bank of India, he later founded TAB Capital Limited and co-founded Poonawalla Finance Private Limited, emphasizing digital lending. Under his leadership, Poonawalla Fincorp achieved a 'AAA' credit rating, integrating acquisitions and emphasizing corporate governance. Actively involved in industry forums and CSR initiatives, Abhay has been recognized with awards like "Young Entrepreneur of India 2017" and "40 under 40 Most Influential Leader for 2020-21." Personally, he values mindfulness, enjoys gardening, yoga, and sees every day as an opportunity for growth and improvement.
Financial Assets: Debit vs Equity Securities.pptxWrito-Finance
financial assets represent claim for future benefit or cash. Financial assets are formed by establishing contracts between participants. These financial assets are used for collection of huge amounts of money for business purposes.
Two major Types: Debt Securities and Equity Securities.
Debt Securities are Also known as fixed-income securities or instruments. The type of assets is formed by establishing contracts between investor and issuer of the asset.
• The first type of Debit securities is BONDS. Bonds are issued by corporations and government (both local and national government).
• The second important type of Debit security is NOTES. Apart from similarities associated with notes and bonds, notes have shorter term maturity.
• The 3rd important type of Debit security is TRESURY BILLS. These securities have short-term ranging from three months, six months, and one year. Issuer of such securities are governments.
• Above discussed debit securities are mostly issued by governments and corporations. CERTIFICATE OF DEPOSITS CDs are issued by Banks and Financial Institutions. Risk factor associated with CDs gets reduced when issued by reputable institutions or Banks.
Following are the risk attached with debt securities: Credit risk, interest rate risk and currency risk
There are no fixed maturity dates in such securities, and asset’s value is determined by company’s performance. There are two major types of equity securities: common stock and preferred stock.
Common Stock: These are simple equity securities and bear no complexities which the preferred stock bears. Holders of such securities or instrument have the voting rights when it comes to select the company’s board of director or the business decisions to be made.
Preferred Stock: Preferred stocks are sometime referred to as hybrid securities, because it contains elements of both debit security and equity security. Preferred stock confers ownership rights to security holder that is why it is equity instrument
<a href="https://www.writofinance.com/equity-securities-features-types-risk/" >Equity securities </a> as a whole is used for capital funding for companies. Companies have multiple expenses to cover. Potential growth of company is required in competitive market. So, these securities are used for capital generation, and then uses it for company’s growth.
Concluding remarks
Both are employed in business. Businesses are often established through debit securities, then what is the need for equity securities. Companies have to cover multiple expenses and expansion of business. They can also use equity instruments for repayment of debits. So, there are multiple uses for securities. As an investor, you need tools for analysis. Investment decisions are made by carefully analyzing the market. For better analysis of the stock market, investors often employ financial analysis of companies.
Solution Manual For Financial Accounting, 8th Canadian Edition 2024, by Libby...Donc Test
Solution Manual For Financial Accounting, 8th Canadian Edition 2024, by Libby, Hodge, Verified Chapters 1 - 13, Complete Newest Version Solution Manual For Financial Accounting, 8th Canadian Edition by Libby, Hodge, Verified Chapters 1 - 13, Complete Newest Version Solution Manual For Financial Accounting 8th Canadian Edition Pdf Chapters Download Stuvia Solution Manual For Financial Accounting 8th Canadian Edition Ebook Download Stuvia Solution Manual For Financial Accounting 8th Canadian Edition Pdf Solution Manual For Financial Accounting 8th Canadian Edition Pdf Download Stuvia Financial Accounting 8th Canadian Edition Pdf Chapters Download Stuvia Financial Accounting 8th Canadian Edition Ebook Download Stuvia Financial Accounting 8th Canadian Edition Pdf Financial Accounting 8th Canadian Edition Pdf Download Stuvia
2. 2
Disclaimer
This presentation may contain certain forward-looking projections and trends that neither
represent realized financial results nor historical information.
These forward-looking projections and trends are subject to risk and uncertainty, and
future results may differ materially from the projections. Many of these risks and
uncertainties are related to factors that are beyond CCR’s ability to control or to estimate,
such as market conditions, currency swings, the behavior of other market participants, the
actions of regulatory agencies, the ability of the company to continue to obtain financing,
changes in the political and social context in which CCR operates or economic trends or
conditions, including changes in the rate of inflation and changes in consumer confidence
on a global, national or regional scale.
Readers are advised not to fully trust these projections and trends. CCR is not obliged to
publish any revision of these projections and trends that should reflect new events or
circumstances after the realization of this presentation.
3. TRAFFIC:
Proforma consolidated traffic1,excluding Ponte and MSVia, fell by 2.8% in 4Q15.
TOLLS COLLECTED BY ELECTRONIC MEANS:
The number of STP users increased by 9.2% over December 2014, reaching 5,269,000 active tags.
ADJUSTED EBITDA:
Same-basis2 adjusted proforma EBITDA increased by 0.4%, with an margin of 59.8% (-3.6 p.p.).
NET INCOME:
Same-basis2 net income totaled R$249.9 million, a 19.1% reduction in 4Q15.
DIVIDENDS:
CCR’s management proposed to the Board of Directors the distribution of dividends of ~ R$0.28/share,
to be approved at the 2016 Annual Shareholders’ Meeting.
3
4Q15 Highlights
1 Including the proportional traffic of Renovias.
2 Same-basis amounts exclude: (i) new businesses, either non-operating or under assisted operation, during at least one of the comparison periods: Metrô Bahia and
MSVia; (ii) Ponte, whose agreement ended on May 31, 2015; (iii) non-recurring items from the acquisition of TAS in 4Q15 and the write-off of the balance of Retentions
related to payments to former shareholders of SPVias, in CPC, in compliance with contingent items of the sale and purchase agreement of that concessionaire in 4Q14;
and (iv) it excludes Controlar, ViaRio and VLT.
4. 1- Net revenue excludes construction revenue.
2- Same-basis amounts exclude: (i) new businesses, either non-operating or under assisted operation, during at least one of the comparison periods: Metrô Bahia and
MSVia; (ii) Ponte, whose agreement ended on May 31, 2015; (iii) non-recurring items from the acquisition of TAS in 4Q15 and the write-off of the balance of Retentions
related to payments to former shareholders of SPVias, in CPC, in compliance with contingent items of the sale and purchase agreement of that concessionaire in 4Q14; and
(iv) in profit and pro-forma comparisons, it excludes Controlar, ViaRio and VLT.
3- Calculated by adding net revenue, construction revenue, costs of services and administrative expenses
4- The adjusted EBIT and EBITDA margins were calculated by dividing EBIT and EBITDA by net revenue, excluding construction revenue, as required by IFRS.
5- Calculated excluding non-cash expenses: depreciation and amortization, the provision for maintenance and the recognition of prepaid concession expenses.
4
Financial Highlights – 4Q15
Net Revenues1 1,526.5 1,691.1 10.8% 1,743.4 1,957.6 12.3%
Adjusted Net Revenues on the same basis2 1,473.9 1,561.1 5.9% 1,689.6 1,799.5 6.5%
Adjusted EBIT3 746.8 682.2 -8.7% 841.8 755.6 -10.2%
Adjusted EBIT Mg.4
48.9% 40.3% -8.6 p.p. 48.3% 38.6% -9.7 p.p.
EBIT on the same basis2 670.3 656.9 -2.0% 768.3 728.4 -5.2%
EBIT Mg. on the same basis2
45.5% 42.1% -3.4 p.p. 45.5% 40.5% -5.0 p.p.
Adjusted EBITDA5 1,026.1 984.5 -4.1% 1,153.4 1,108.0 -3.9%
Adjusted EBITDA Mg.4 67.2% 58.2% -9.0 p.p. 66.2% 56.6% -9.6 p.p.
Adjusted EBITDA on the same basis2 941.5 955.4 1.5% 1,071.8 1,076.4 0.4%
Adjusted EBITDA Mg. on the same basis2
63.9% 61.2% -2.7 p.p. 63.4% 59.8% -3.6 p.p.
Net Income 383.9 244.8 -36.2% 383.9 244.8 -36.2%
Net Income on the same basis2 308.9 249.9 -19.1% 308.9 249.9 -19.1%
4Q14 4Q15 Chg %Financial Indicators (R$ MM) 4Q14 4Q15 Chg %
IFRS Proforma
5. AutoBAn NovaDutra RodoNorte ViaLagos ViaOeste Renovias RodoAnel SPVias
-2.2
-10.7
1.9
-3.1 -1.5 -2.5 -2.0 -0.9
1.3 2.7
7.2
1.6 3.5
1.1
10.3
3.7
Traffic Toll Revenues
4Q10 4Q11 4Q12 4Q13 4Q14 4Q15
263,925
237,103
247,459 255,153
276,784 274,866
5
Traffic – Quarter Change (Proforma*)
Consolidated – Equivalent Vehicle
Revenue and traffic 4Q15 X 4Q14 (%)
* Information including Renovias which is contemplated in the proforma method.
Excluding Ponte
and MSVia
251,614 (-2.8%)
7. 4Q14 Depreciation
and
Amortization
Third-party
Services
Granting
Power and
Advanced
Expenses
Personnel
Costs
Construction
Costs
Maintenance
Provision
Other
Costs
4Q15 New
Projects
and Ponte
TAS
Acquisition
4Q15
Same
Basis
1,357
1,660
1,130
31 35 4 16
97 (8)
129 (521)
(9)
7
IFRS Costs Evolution (4Q15 X 4Q14)
Total Costs (R$ MM)
Construction
of Service
Roads and
Duplication
Direct Costs
TAS, BH
Airport and
NovaDutra
Wage
Increase
Performed
Work
(New Projects)
Same-basis
Cash Cost: R$
608 MM (+9.9%)
Reduction in the
Provision:
RodoNorte, AutoBAn
and ViaOeste
SPVias at 4Q14,
Inspection Budget and
Advertising
Campaigns
17% 8%
17% 22%
16%
(13)% 347%
4%
Same-basis
Cash Cost: R$
523 MM
8. 4Q14
Proforma
EBITDA
4Q15
Proforma
EBITDA
New
Projects
and Ponte
Non-recurrents 4Q15
Proforma
EBITDA
Same
Basis
1,153
1,108 9 1,076(41)
8
Proforma EBITDA*
66.2%
of Mg.
56.6%
of Mg.
59.8%
of Mg.
* Same-basis amounts exclude: (i) new businesses, either non-operating or under assisted operation, during at least one of the comparison periods: Metrô Bahia and
MSVia; (ii) Ponte, whose agreement ended on May 31, 2015; (iii) non-recurring items from the acquisition of TAS in 4Q15 and the write-off of the balance of Retentions
related to payments to former shareholders of SPVias, in CPC, in compliance with contingent items of the sale and purchase agreement of that concessionaire in 4Q14;
and (iv) it excludes Controlar, ViaRio and VLT.
*
4Q14
Same basis
R$ MM 1,072
4Q15
Same basis
R$ MM 1,076
(+0,4%)
R$ MM
9. 4Q14 Net
Financial Result
Income from
Hedge Operation
Monetaryvariation
on loans, financing
and debentures
MonetaryVariation
on Liabilities related
to the Granting
Power
ExchangeRate
Variation on Loans,
Financing and
Debentures
Present Value
Adjustment of
Maintenance
Provision and
Liabilitiesrelated to
the Granting Power
Interest on Loans,
Financing and
Debentures
Investment Income
and OtherIncome
Fair Value of
Hedge Operation
Others 4Q15 Net
Financial Result
(283.0)
(8.6) (416.4)
(12.7)
(55.7)
(19.3) 72,1
(1.4)
(45.7) 16.9
(78.8)
9
IFRS Financial Results
• Chg. of average CDI 4Q15 X 4Q14 = +3.0 p.p.
• Gross Debt = R$ 14.1 B (+23.0%)
47%
R$ MM
10. 4Q14
Net
Income
4Q15
Net
Income
New
Projects
and Ponte
Non-recurrent
(Income)
4Q15
Net Income
Same
Basis
384
245 (1) 6 250
10
Net Income
R$ MM
Same basis
R$ 309 MM
* Same-basis amounts exclude: (i) new businesses, either non-operating or under assisted operation, during at least one of the comparison periods: Metrô Bahia
and MSVia; (ii) Ponte, whose agreement ended on May 31, 2015; (iii) non-recurring items from the acquisition of TAS in 4Q15 and the write-off of the balance of
Retentions related to payments to former shareholders of SPVias, in CPC, in compliance with contingent items of the sale and purchase agreement of that
concessionaire in 4Q14; and (iv) it excludes Controlar, ViaRio and VLT.
*
Same basis
R$ 250 MM
(-19%)
11. CDI
82.1%
TJLP
12.4%
IPCA
3.5%
USD
2.0%
CDI
55.8%
IPCA
18.7%
USD
13.2%
TJLP
12.4%
Gross hedged debt by indexer
11
Debt in December 31, 2015
Amortization Schedule (R$ MM)
Indebtedness and leverage position
• Total Gross Debt: R$ 14.3 Bn
(R$15.8 Bn proforma)
• Net Debt / EBITDA: 3.2x
(3.0x proforma)
Hedged
Not hedged
Gross debt by indexer
2016 2017 2018 2019 From
2020
4,804
1,982
905
-
450
1,203
240
CDI USD Others
1,4771,383
1,891
3,543
5,999
2016 2017 2018 2019 From
2020
4,804
1,982
905
-
450
1,203
240
CDI USD Others
1,4771,383
1,891
3,543
5,999
12. 12
Debt Structure and Amortization
42% has already been
addressed
Amortization 2016 - 2017
* Expiration already equated through issues or contracts signed with BNDES.
Emissions since Oct/2015
• Nov/15: signature of the long-term loan agreement between
VLT and BNDES totaling R$747 million, with payment of R$650
million;
• Dec/15: signature of the long-term loan agreement
between Metrô Bahia and BNDES totaling R$2.0 billion,
with payment of R$1.0 billion;
• Dec/15: approval by the BNDES of a long-term loan
agreement for MSVia, totaling R$2.3 billion;
• Dec/15: signature of a bridge-loan agreement between BH
Airport and BNDES, totaling R$405 million, with payment of
R$50 million;
• Dec /15: R$400 million at CCR;
• Jan/16: R$1.2 billion at CPC; and
• Jan/16: R$110 million at CCR.
Amortization (R$ MM) 2016 2017
SPVias 1,277 35
CPC* 846 0
RodoAnel Oeste 797 835
CCR* 640 692
MSVia* 557 0
AutoBAn 547 540
Metrô Bahia* 535 610
ViaOeste 301 291
Barcas 198 0
TOTAL 5,698 3,002
TOTAL AMORTIZATION 5,999 3,543
13. 13
4Q15 Funding
Concessionaire Date Value (R$ MM) Debt Average Cost Maturity
NovaDutra Oct/15 120.0 Loan 4131 LIBOR 3M + 1.69% p.a. Oct/17
ViaOeste Oct/15 116.4 Loan 4131 LIBOR 3M + 2.50% p.a. Oct/17
CCR Dec/15 400.0 Bond 124.10% of CDI Dec/18
SAMM Oct/15 54.0 Promissory Note 107.80% of CDI Apr/16
Barcas Oct/15 191.0 Promissory Note 113.00% of CDI Apr/16
ViaRio Oct/15 400.0 Bond CDI + 3.50% p.a. Apr/16
ViaRio Nov/15 130.0 CCB CDI + 3.91% p.a. Apr/16
VLT Nov/15 620.9 BNDES TJLP + 3.44% p.a. Nov/35
VLT Nov/15 29.0 BNDES 6.14% p.a. Nov/35
Metrô Bahia Oct/15 500.0 Bond CDI + 2.20% p.a. Oct/19
Metrô Bahia Dec/15 1050.9 BNDES TJLP + 3.18% p.a. Oct/42
Total 3,612.2
Concessionaire Date Value (R$ MM) Debt Average Cost Maturity
CCR USA Nov-15 25.0 Credit Facility LIBOR 6M + 3.45% p.a Nov-17
CCR España Nov-15 30.0 Credit Facility LIBOR 6M + 2.30 p.a Nov-17
Total 55.0
14. 7,620 7,859 8,081
9,562 9,826
10,413 10,734
12,423
7,609
11,522
9,820
2.0 1.9 2.0 2.0
2.3 2.4 2.5 2.5
3.0
2.7
3.2
-2,5
-1,5
-0,5
0,5
1,5
2,5
3,5
4.000
6.000
8.000
10.000
12.000
14.000
16.000
18.000
20.000
4Q13 1Q14 2Q14 3Q14 4Q14 1Q15 2Q15 3Q15 4Q15 3Q15 4Q15
Net Debt (R$ MM) Net Debt/EBITDA (x)
14
Debt
Net Debt / EBITDA LTM
IFRS10 and 11Proforma Data
R$ MM
The leverage ratio reflects the need to invest in new business, …
... that had no cash flow generation at year-end.
15. 15
Realized Investments and Maintenance
1- The investments made by the Company, which will be reimbursed by the granting authority as monetary consideration or contribution, compose the financial assets.
2- For 100% of the project, at 4Q15 the total investment was R$220.8 million, of which R$29.6 million is related to the portion of the Concessionaire and R$191.2
million to the Granting Authority.
3- Includes CCR, TAS, CPC, SPCP and eliminations.
4Q15 4Q15 4Q15 4Q15
AutoBAn 25.8 8.5 34.3 5.4 0.0
NovaDutra 37.5 5.2 42.6 13.6 0.0
ViaOeste 31.3 7.7 39.1 -0.4 0.0
RodoNorte (100%) 67.5 1.2 68.7 3.1 0.0
ViaLagos 1.7 0.4 2.1 0.0 0.0
SPVias 4.2 3.1 7.3 10.3 0.0
ViaQuatro (60%) 4.3 2.6 6.9 0.0 1.0
Renovias (40%) 0.3 0.6 0.9 3.4 0.0
RodoAnel (100%) 1.8 1.3 3.1 3.1 0.0
SAMM 12.1 4.3 16.4 0.0 0.0
ViaRio2
(33.33%) 29.6 0.0 29.6 0.0 0.0
Quito 12.5 0.4 12.8 0.0 0.0
San José 11.8 0.2 12.0 0.0 0.0
Curaçao 9.4 0.0 9.4 0.0 0.0
Barcas 0.5 0.4 0.9 0.0 0.0
VLT (24.88%) 22.4 0.7 23.0 0.0 21.8
Metrô Bahia 250.5 1.2 251.7 0.0 200.5
BH Airport 84.7 23.9 108.5 0.0 0.0
MSVia 105.9 24.4 130.3 0.0 0.0
STP (34.24%) 3.7 24.6 28.3 0.0 0.0
Other3
-3.4 11.6 8.2 0.0 0.0
Consolidated 713.9 122.3 836.2 38.3 223.3
R$ MM
Intangible Assets
Performed
maintenance
Improvements
Equipments and
Others
Total Maintenance Cost
4Q15
Proforma Financial
Asset1
17. 17
Wrap-up
2014 2015 2016¹
GDP +0.1% -4.1% -3.4%
Exchange (R$/US$) 3.66 3.90 4.36
Selic 11.75% 14.25% 14.25%
Industrial Production -3.2% -8.3% -4.4%
Unemployment 4.3% 6.9% ?
CCR Traffic² +2.5% -2.7% ?
CCR EBITDA³ +7.3% +4.8% ?
¹ Focus Bulletin of 02/19/2016.
² Same basis: excluding Ponte and MSVia in 2015.
³ Same basis: excluding new business and non-recurring described in the 4Q14 and 4Q15 releases.
Despite the challenging macro scenario in 2015 ...
18. 18
Wrap-up
... The company continued to invest and increase the scope of business.
MSVia: beginning of toll collection on 09/14/2015 (37 days before expected)
Metrô Bahia: beggining of the commercial operation on 01/02/2016. Line 1
completed, with 8 stations and 12 km, operational since 02/11/2016
Successful financing - R$3.8 billion in 4Q15
BNDES: R$5.5 billion addressed (R$1.7 billion already disbursed)
R$3.6 billion in investments and maintenance in 2015
R$1.05 billion of dividends paid to shareholders in 2015
Acquisitions: (i) 70% of TAS; (ii) acquisition of additional interest in Quito Airport
and in the operator of referred airport and; (iii) increase in the interest held in
ViaQuatro
VLT and ViaRio: startup expected for April and May 2016, respectively