Download to read offline


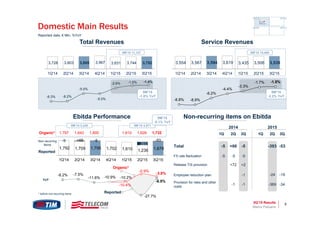
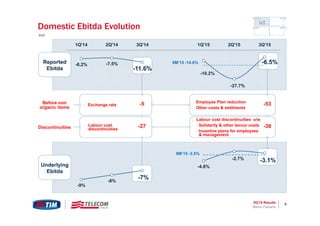
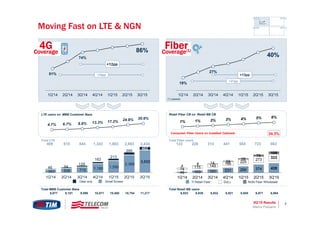
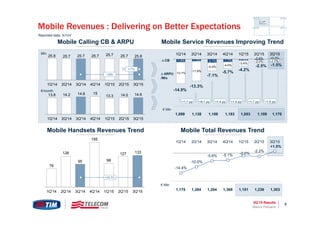
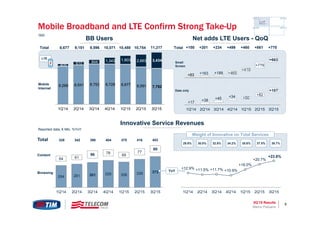
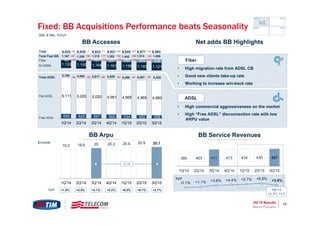

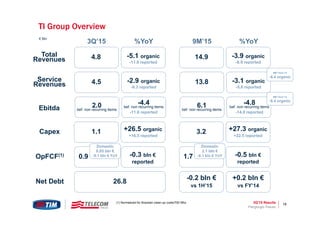


This document contains the agenda and presentation slides for Telecom Italia Group's 3Q 2015 results presentation. The presentation discusses recent highlights such as domestic performance and regulatory changes. It provides an overview of 3Q 2015 results including declines in total revenues and service revenues but improvements in mobile revenues. Charts and data are presented on key metrics like fixed broadband users, fiber coverage, mobile subscribers and ARPU, and EBITDA performance.