Download to read offline

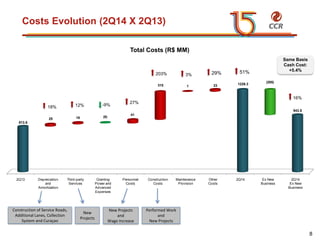
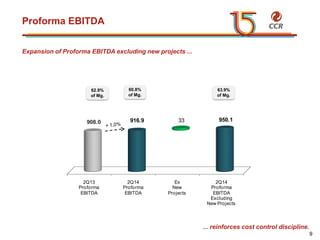
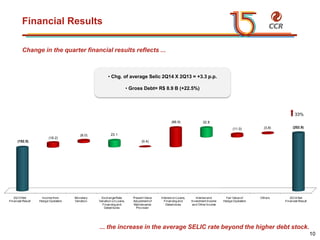
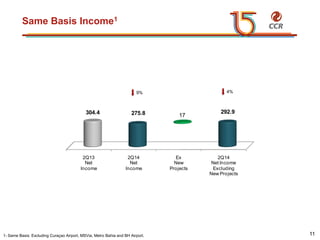
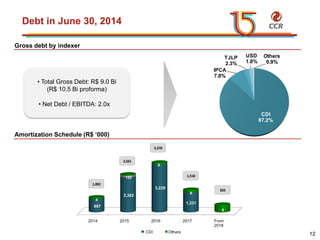
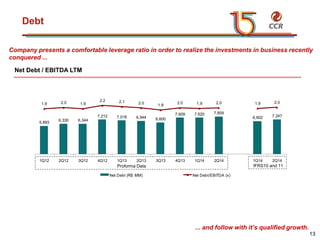
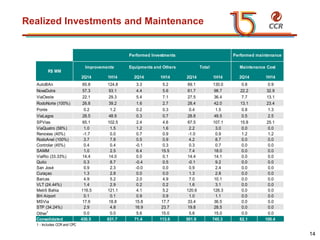
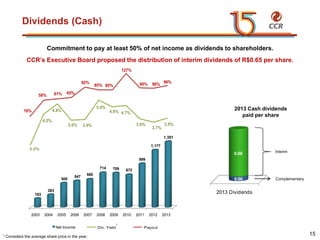

- CCR's consolidated traffic grew 3.9% in 2Q14, while toll revenues increased 5.7%. Adjusted proforma EBITDA increased 5.2% in 2Q14. - Total costs increased 5.4% in 2Q14 versus 2Q13, driven by a higher average SELIC rate and increased debt levels. Net income decreased 9.4% due to financial expenses. - CCR maintained a comfortable leverage ratio of 2.0x net debt to EBITDA. The company continues investing in maintenance and improvements across its portfolio.