Download to read offline

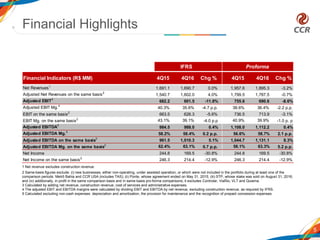
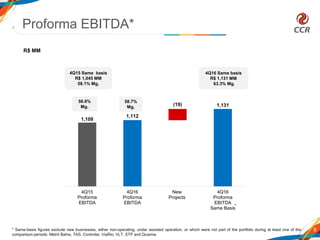
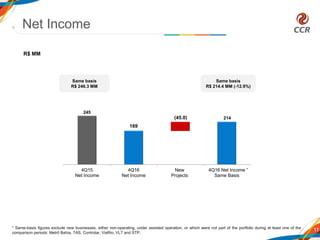
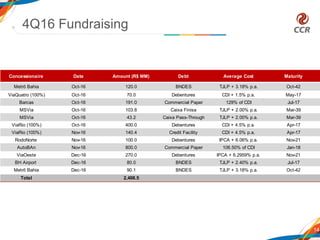


- Traffic fell 7.0% in 4Q16 compared to 4Q15. Adjusted EBITDA increased 0.4% with a margin of 58.4% (+0.2 p.p.). - Net income totaled R$169.5 million, down 30.8%. Same-basis net income was R$214.4 million, down 12.9%. - In February 2017, the Company announced the completion of a primary share offering that raised R$4.07 billion through the issue of 254 million new shares.


