Download as PDF, PPTX


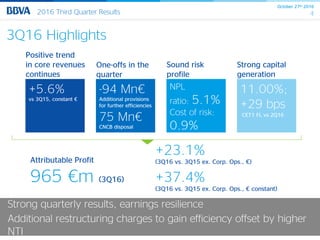
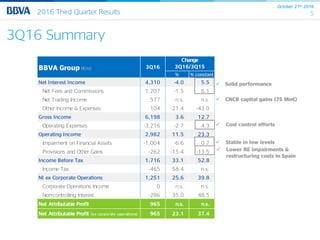
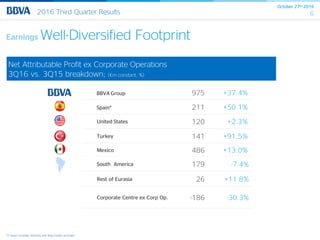
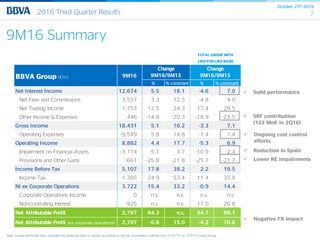
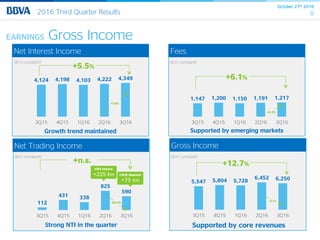
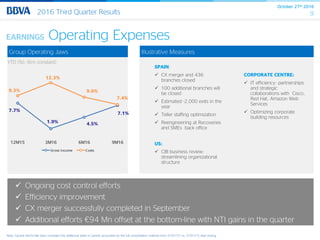
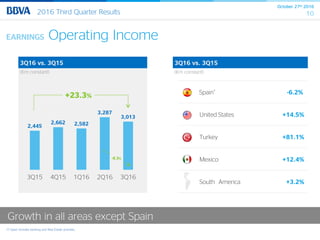
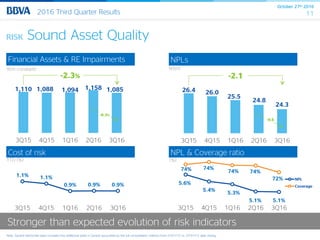
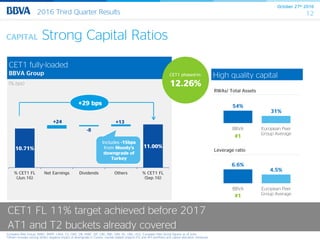


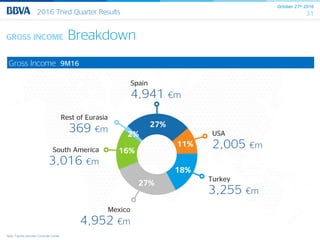
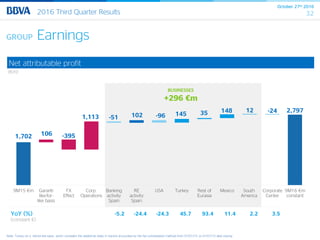
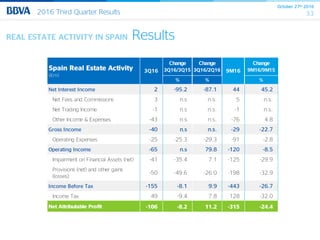

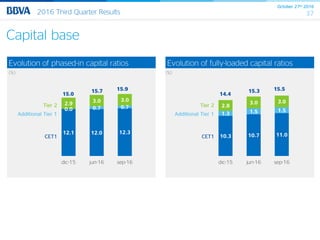


BBVA reported results for the third quarter of 2016. Key highlights included: - Attributable profit of €965 million, an increase of 23.1% compared to the third quarter of 2015 excluding corporate operations. - Gross income increased 12.7% driven by growth in net interest income, fees and commissions, and trading income. - Operating expenses grew 4.3% as the bank continued cost control efforts. - Sound asset quality with the NPL ratio stable at 5.1% and cost of risk at 0.9%. - Capital generation was strong with the CET1 ratio reaching 11.00%.


