Download as PDF, PPTX


![9
Income Statement
[ € mn ] 2018 3Q 2019 3Q Change Change %
Revenues 1,917 2,000 83 4.3%
Operating expenses (321) (339) (18) 5.6%
EBITDA 1,596 1,661 65 4.1%
Depreciation & amortisation (506) (536) (30) 5.9%
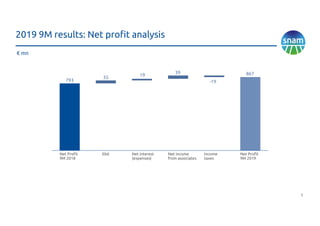
EBIT 1,090 1,125 35 3.2%
Net interest income (expenses) (145) (126) 19 (13.1)%
Net income from associates 131 170 39 29.8%
EBT 1,076 1,169 93 8.6%
Income taxes (283) (302) (19) 6.7%
NET PROFIT 793 867 74 9.3%](https://image.slidesharecdn.com/snam9m2019-191118102030/85/Snam-2019-9-M-Results-9-320.jpg)
![10
Revenues
[ € mn ] 2018 3Q 2019 3Q Change Change %
Regulated revenues 1,864 1,925 61 3.3%
Transport 1,429 1,489 60 4.2%
Storage 377 376 (1) (0.3)%
LNG 14 14 - -
Pass-through revenues 44 46 2 4.5%
Other revenues 53 75 22 41.5%
TOTAL REVENUES 1,917 2,000 83 4.3%](https://image.slidesharecdn.com/snam9m2019-191118102030/85/Snam-2019-9-M-Results-10-320.jpg)
![11
Operating Expenses
[ € mn ] 2018 3Q 2019 3Q Change Change %
Regulated activities 268 252 (16) (6.0)%
Controllable fixed costs 186 180 (6) (3.2)%
Variable costs 8 11 3 37.5%
Other costs 30 15 (15) (50.0)%
Pass-through costs 44 46 2 4.5%
Non regulated activities 53 87 34 64.2%
TOTAL COSTS 321 339 18 5.6%](https://image.slidesharecdn.com/snam9m2019-191118102030/85/Snam-2019-9-M-Results-11-320.jpg)
![12
Balance Sheet
[ € mn ] 2018 2019 3Q Change Change %
Net invested capital 17,533 18,198 665 3.8%
Fixed capital 18,856 19,237 381 2.0%
Tangible fixed assets 16,516 16,763 247 1.5%
Intangible fixed assets 907 919 12 1.3%
Equity-accounted and other investments 1,750 1,823 73 4.2%
Financial receivables held for operating
activities
11 1 (10) (90.9)%
Net payables for investments (328) (269) 59 (18.0)%
Net working capital (1,259) (985) 274 (21.8)%
Receivables 1,487 1,267 (220) (14.8)%
Liabilities (2,746) (2,252) 494 (18.0)%
Provisions for employee benefits (64) (54) 10 (15.6)%
Net financial debt 11,548 11,871 323 2.8%
Shareholders' equity 5,985 6,327 342 5.7%](https://image.slidesharecdn.com/snam9m2019-191118102030/85/Snam-2019-9-M-Results-12-320.jpg)

Snam reported positive results for the first nine months of 2019, with earnings before interest and taxes (EBIT) increasing 3.2% compared to the same period in 2018. Regulated revenues excluding pass-through items grew 4.1% due to higher tariffs. Net income increased 9.3% to 867 million euros. Snam also continued progressing on international expansion and optimization of its financial structure. Full-year 2019 guidance was confirmed.


