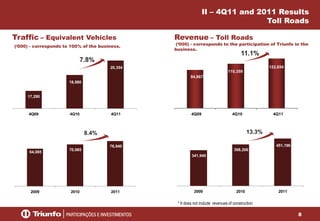
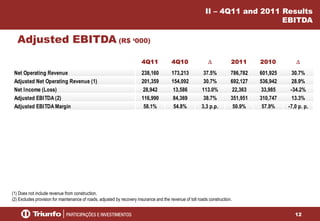
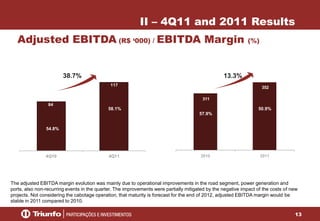
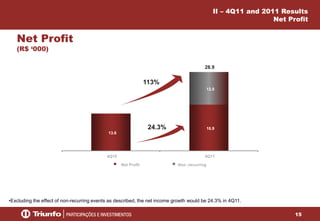
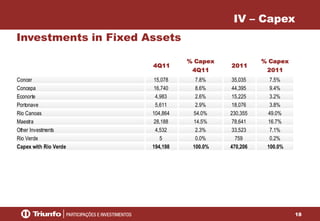
Triunfo Participações e Investimentos S.A. reported its 4Q11 and full year 2011 earnings results. Key highlights included net revenue growth of 37.5% in 4Q11 and 30.7% for 2011. Traffic volume increased 7.8% in 4Q11 and 8.4% for the full year. Adjusted EBITDA grew 38.7% in 4Q11 to R$117 million and increased 13.3% for 2011 to R$352 million. Net income for 4Q11 was R$28.9 million. Capex totaled R$194.2 million in 4Q11 and R$470.2 million for the full year, primarily directed towards the Rio