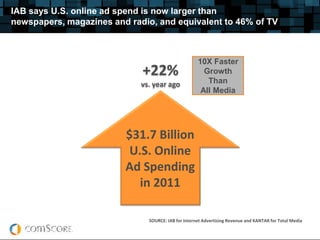
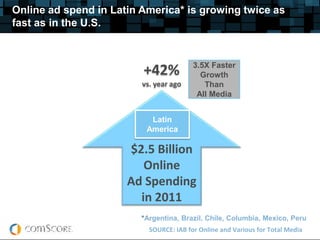
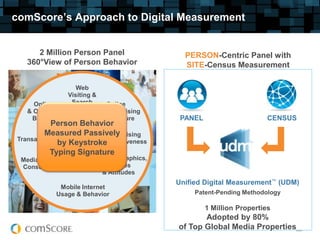
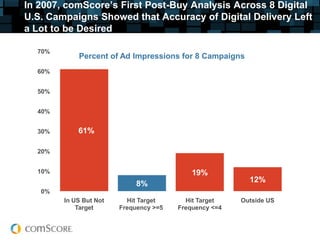
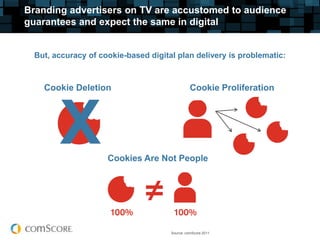
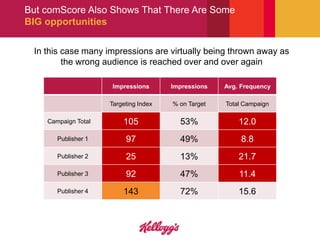
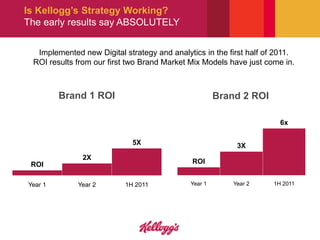
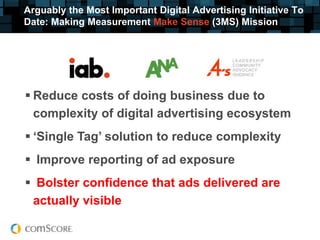
Changing How the World
Sees Digital Advertising
IAB Conecta 2012
Gian Fulgoni Executive Chairman and Co-founder, comScor
1   Branding Advertising’s Digital Challenge


2 Kellogg’s Solution

3   Viewing the Future
IAB says U.S. online ad spend is now larger than
newspapers, magazines and radio, and equivalent to 46% of TV


                                                     10X Faster
                             +22%                      Growth
                             vs. year ago               Than
                                                      All Media


                         $31.7 Billion
                          U.S. Online
                         Ad Spending
                            in 2011

                               SOURCE: IAB for Internet Advertising Revenue and KANTAR for Total Mediaedia
                                  Measurement
Online ad spend in Latin America* is growing twice as
fast as in the U.S.


                                          3.5X Faster
                         +42%               Growth
                         vs. year ago        Than
                                           All Media


                           Latin
                          America

                      $2.5 Billion
                         Online
                      Ad Spending
                        in 2011
                         *Argentina, Brazil, Chile, Columbia, Mexico, Peru
                           SOURCE: IAB for Online and Various for Total Media dia
                             Measurement 2011
But, Branding Advertising is Relatively Weak Online


         Only One Third of All Online Ad
             Spending is Branding

        Direct Response (Mainly Search)
                 Still Dominates

              In Traditional Media
        Branding Advertising Dominates
Branding’s Online Challenge:
Is the Target Audience Guaranteed?
comScore’s Approach to Digital Measurement


     2 Million Person Panel                     PERSON-Centric Panel with
  360°View of Person Behavior                   SITE-Census Measurement

                    Web
                 Visiting &
    Online        Search       Online
  & Offline      Behavior      Advertising
   Buying                      Exposure        PANEL                      CENSUS
           Person Behavior
         Measured Passively
                         Advertising
Transactions
             by KeystrokeEffectiveness
          Typing Signature
 Media & Video                Demographics,
 Consumption                  Lifestyles
                  PANEL       & Attitudes
                                              Unified Digital Measurement™ (UDM)
               Mobile Internet
              Usage & Behavior                     Patent-Pending Methodology

                                                       1 Million Properties
                                                     Adopted by 80%
                                              of Top Global Media Properties    V1011
In 2007, comScore’s First Post-Buy Analysis Across 8 Digital
U.S. Campaigns Showed that Accuracy of Digital Delivery Left
a Lot to be Desired

  70%
            Percent of Ad Impressions for 8 Campaigns
  60%


  50%


  40%


  30%       61%

  20%


  10%                                       19%
                                                          12%
                             8%
   0%
        In US But Not     Hit Target      Hit Target    Outside US
            Target      Frequency >=5   Frequency <=4
Branding advertisers on TV are accustomed to audience
guarantees and expect the same in digital


  But, accuracy of cookie-based digital plan delivery is problematic:


    Cookie Deletion                             Cookie Proliferation


        X            Cookies Are Not People


                                      Source: comScore 2011
Because of Multiple Users, Cookies Can’t Accurately Identify
Who is Using a Computer at any Given Point in Time


    Over 64% of home users share a computer with other users


                      3+ users       1 user
                           30% of the
                      32%            36%
                     time, someone other
                       than the Facebook
                      logged-in person is
                        actually using the
                             2 users
                            computer
                            32%
Cookie Deletion is a Global Reality
…and a Global Challenge

           Accurately counting reach with cookies is not possible,
 yet is currently the method used in most ad servers and analytics systems


                                           Ad Server Cookies


                                  Percent of       Average # of cookies
              Country             computers          per computer for
                                   deleting          same campaign


       Australia                     37%                       5.7
       Brazil                        40%                       6.6
       U.K.                          35%                       5.9
       U.S.                          35%                       5.4
comScore quantified incidence of sub-optimal ad delivery at
the individual person level…


       Reach, Frequency and Demographics


 … to better understand sources of waste and
 identify opportunities to extract more value
 from digital advertising dollars
CE™: Massive Global Market Experience
2,600+ Studies for 120 advertisers / agencies in 28 countries


   North America              Europe                               Asia Pacific


Allstate


                                        Not an exhaustive list. Includes advertisers currently working with comScore
                                        vCE who have agreed to be named publicly.
Some Things We’ve Learned About Digital Media Plan Delivery


 The negative impact of cookie deletion
 – Cookie deletion inflates ad frequency and deflates ad reach
   by as much as a factor of 2.5X
 Targeting accuracy using cookies:
 – 70% for 1 demo (e.g. women)
 – 48% for 2 demos (e.g. women age 18-34)
 – 11% for 3 demos (e.g. women age 18-34 with kids)
 – 36% for behavioral targeting (e.g. people visiting travel sites)
Kellogg’s Solution
The KPI Framework: Establishing a model for Advertising
   Effectiveness – applied initially to Online Media


     PRE-MARKET QUALITY                       • Branded Recognition
Does my creative have the right to succeed?   • Brand Buy Next


                                              • % Impressions to Target/Targeting Index
      AUDIENCE DELIVERY                       • Frequency of Exposure
    Did we efficiently reach our Target?
                                              • CPM


                                              •   Brand Awareness
 IN-MARKET EFFECTIVENESS                      •   Purchase Interest
        Are we moving the needle?             •   Message Association
                                              •   Direct Response
Looking at a few of Kellogg’s larger campaigns


     Data provided by comScore Campaign Essentials is at an
        individual publisher, individual campaign level

                      Impressions       Impressions       Avg. Frequency

                      Targeting Index   % on Target       Total Campaign

     Campaign Total

       Publisher 1

       Publisher 2

       Publisher 3
                                         Aaron is there
                                          data for this
       Publisher 4                           chart?

       Publisher 5
comScore shows that there have been some clear
top performances

 In total, this campaign effectively delivered to target and efficiently
                       balanced the exposures

                       Impressions      Impressions   Avg. Frequency


                      Targeting Index   % on Target   Total Campaign


     Campaign Total       216             58%              3.2

        Publisher 1       163             44%              4.0

        Publisher 2       225             60%              3.1

        Publisher 3       140             37%              3.5
But comScore Also Shows That There Are Some
BIG opportunities

 In this case many impressions are virtually being thrown away as
         the wrong audience is reached over and over again

                     Impressions       Impressions   Avg. Frequency

                     Targeting Index   % on Target   Total Campaign

    Campaign Total       105             53%             12.0
       Publisher 1        97             49%              8.8
       Publisher 2        25             13%             21.7
       Publisher 3        92             47%             11.4
       Publisher 4       143             72%             15.6
Is Kellogg’s Strategy Working?
The early results say ABSOLUTELY


  Implemented new Digital strategy and analytics in the first half of 2011.
 ROI results from our first two Brand Market Mix Models have just come in.


         Brand 1 ROI                                  Brand 2 ROI

                                                                       6x

                             5X                            3X
               2X
 ROI                                          ROI


Year 1       Year 2        1H 2011           Year 1       Year 2     1H 2011
The Future
Arguably the Most Important Digital Advertising Initiative To
Date: Making Measurement Make Sense (3MS) Mission


 Reduce costs of doing business due to
  complexity of digital advertising ecosystem
 ‘Single Tag’ solution to reduce complexity
 Improve reporting of ad exposure
 Bolster confidence that ads delivered are
 actually visible
comScore quantified incidence of sub-optimal ad delivery
across all key ad delivery dimensions…


 … to better understand sources of waste and
 identify opportunities to extract more value
 from digital advertising dollars
vCE US Charter Study:
12 Major Branded Advertisers Came Together to Lead & Learn

18 campaigns
2 billion impressions
400,000 sites


                          Allstate
vCE Charter Study replicated in Europe with similar results

15 campaigns
640 million impressions
213,000 sites
vCE Charter Study:
In-view Rates Need to Be Improved


     U.S.                            EU
       69%                           67%
      AVERAGE                       AVERAGE


       Campaign In-view ad rates ranged from:
       U.S. 55% to 93% EU 64% to 72%
vCE Charter Study:
Opportunity for improvement at many of the largest sites

                               98%
                 69%
                                            In-View ad rates
                                            across Top 500
    7%                                      US sites
  MINIMUM       AVERAGE      MAXIMUM

                               100%
                 63%
                                            In-View ad rates
                                            across top 100
  0.2%                                      EU sites
 MINIMIUM       AVERAGE       MAXIMUM
Large sites scored better than long-tail sites


               Percentage of Ads Served In-View


    77%            74%               70%
                                                  61%
    66%            63%               61%
                                                  55%


                              US    EU
Digital Ad Economics:
The Good Guys Aren’t Necessarily Winning


             Low correlation of In-View Rates & CPM


                                                      R²=0.0373


An equally as weak correlation was also observed between CPM
        and ability to hit a primary demographic target
vCE Charter Study:
Ads Sometimes Fall Outside of Desired Geography


      U.S.                                EU
4% of ads were served             7% of ads were served
 outside geography.                outside geography.
Up to 15% of ads on a             Up to 27% of ads on a
   given campaign                    given campaign


       About half of geographic waste was not
       only out of target but also out of language
vGRP can provide more accurate analysis of campaign
      effectiveness in Marketing Mix Models


        GRP: Negative                         vGRP: Positive
         Correlation                            Correlation
100                                80   100                          80

 90                                      90
                                   70                                70
 80                                      80
                                   60                                60
 70                                      70                  vGRP
                           GRP     50                                50
 60                                      60                  Sales
                           Sales
 50                                40    50                          40

 40                                      40
                                   30                                30
 30                                      30
                                   20                                20
 20                                      20
                                   10                                10
 10                                      10

  0                                0      0                          0

        Month 1      Month 2                  Month 1   Month 2
The KPI Framework: Establishing a model for Advertising
   Effectiveness – applied initially to Online Media


     PRE-MARKET QUALITY                       • Branded Recognition
Does my creative have the right to succeed?   • Brand Buy Next


                                              •   % Impressions to Target/Targeting Index
      AUDIENCE DELIVERY                       •   Frequency of Exposure
    Did we efficiently reach our Target?      •   % Impressions in View
                                              •   CPM


                                              •   Brand Awareness
 IN-MARKET EFFECTIVENESS                      •   Purchase Interest
        Are we moving the needle?             •   Message Association
                                              •   Direct Response
Where Kellogg’s is Going: In-Market Optimization at a
Campaign Level Based on Cost and Effectiveness

      • Opportunity to optimize - Budgets follow performance
      • Multiple publishers, each with high reach potential
      • Wide variance in performance observed real-time

                        Brand X - Q3/Q4
       Media       Avg      Impressions   Impressions     Lift in
                                                                     CPM
      Partner   Frequency     in Target     in View     Awareness


        1         3.5        24.5%          83%           5.74      $2.44

        2         3.0        16.9%          91%           0.55      $9.08

        3         8.4        23.5%          71%            0        $8.62
There is good news for advertisers and publishers

 Analogous to TV audience guarantees
 Eliminating unseen online inventory supply
  results in:
    More effective / efficient campaigns and less
     waste for advertisers
    More accurate metrics for market mix models
    Better proof of digital ad effectiveness
 Increased transparency/accountability
  means increased confidence in digital ….
  leading to more branding ad spending
  moving online
Thank You!


© comScore, Inc.   Proprietary.   35

Presentación de Gian Fulgoni en IAB Conecta 2012

  • 1.
    Changing How theWorld Sees Digital Advertising IAB Conecta 2012 Gian Fulgoni Executive Chairman and Co-founder, comScor
  • 2.
    1 Branding Advertising’s Digital Challenge 2 Kellogg’s Solution 3 Viewing the Future
  • 3.
    IAB says U.S.online ad spend is now larger than newspapers, magazines and radio, and equivalent to 46% of TV 10X Faster +22% Growth vs. year ago Than All Media $31.7 Billion U.S. Online Ad Spending in 2011 SOURCE: IAB for Internet Advertising Revenue and KANTAR for Total Mediaedia Measurement
  • 4.
    Online ad spendin Latin America* is growing twice as fast as in the U.S. 3.5X Faster +42% Growth vs. year ago Than All Media Latin America $2.5 Billion Online Ad Spending in 2011 *Argentina, Brazil, Chile, Columbia, Mexico, Peru SOURCE: IAB for Online and Various for Total Media dia Measurement 2011
  • 5.
    But, Branding Advertisingis Relatively Weak Online Only One Third of All Online Ad Spending is Branding Direct Response (Mainly Search) Still Dominates In Traditional Media Branding Advertising Dominates
  • 6.
    Branding’s Online Challenge: Isthe Target Audience Guaranteed?
  • 7.
    comScore’s Approach toDigital Measurement 2 Million Person Panel PERSON-Centric Panel with 360°View of Person Behavior SITE-Census Measurement Web Visiting & Online Search Online & Offline Behavior Advertising Buying Exposure PANEL CENSUS Person Behavior Measured Passively Advertising Transactions by KeystrokeEffectiveness Typing Signature Media & Video Demographics, Consumption Lifestyles PANEL & Attitudes Unified Digital Measurement™ (UDM) Mobile Internet Usage & Behavior Patent-Pending Methodology 1 Million Properties Adopted by 80% of Top Global Media Properties V1011
  • 8.
    In 2007, comScore’sFirst Post-Buy Analysis Across 8 Digital U.S. Campaigns Showed that Accuracy of Digital Delivery Left a Lot to be Desired 70% Percent of Ad Impressions for 8 Campaigns 60% 50% 40% 30% 61% 20% 10% 19% 12% 8% 0% In US But Not Hit Target Hit Target Outside US Target Frequency >=5 Frequency <=4
  • 9.
    Branding advertisers onTV are accustomed to audience guarantees and expect the same in digital But, accuracy of cookie-based digital plan delivery is problematic: Cookie Deletion Cookie Proliferation X Cookies Are Not People Source: comScore 2011
  • 10.
    Because of MultipleUsers, Cookies Can’t Accurately Identify Who is Using a Computer at any Given Point in Time Over 64% of home users share a computer with other users 3+ users 1 user 30% of the 32% 36% time, someone other than the Facebook logged-in person is actually using the 2 users computer 32%
  • 11.
    Cookie Deletion isa Global Reality …and a Global Challenge Accurately counting reach with cookies is not possible, yet is currently the method used in most ad servers and analytics systems Ad Server Cookies Percent of Average # of cookies Country computers per computer for deleting same campaign Australia 37% 5.7 Brazil 40% 6.6 U.K. 35% 5.9 U.S. 35% 5.4
  • 12.
    comScore quantified incidenceof sub-optimal ad delivery at the individual person level… Reach, Frequency and Demographics … to better understand sources of waste and identify opportunities to extract more value from digital advertising dollars
  • 13.
    CE™: Massive GlobalMarket Experience 2,600+ Studies for 120 advertisers / agencies in 28 countries North America Europe Asia Pacific Allstate Not an exhaustive list. Includes advertisers currently working with comScore vCE who have agreed to be named publicly.
  • 14.
    Some Things We’veLearned About Digital Media Plan Delivery  The negative impact of cookie deletion – Cookie deletion inflates ad frequency and deflates ad reach by as much as a factor of 2.5X  Targeting accuracy using cookies: – 70% for 1 demo (e.g. women) – 48% for 2 demos (e.g. women age 18-34) – 11% for 3 demos (e.g. women age 18-34 with kids) – 36% for behavioral targeting (e.g. people visiting travel sites)
  • 15.
  • 16.
    The KPI Framework:Establishing a model for Advertising Effectiveness – applied initially to Online Media PRE-MARKET QUALITY • Branded Recognition Does my creative have the right to succeed? • Brand Buy Next • % Impressions to Target/Targeting Index AUDIENCE DELIVERY • Frequency of Exposure Did we efficiently reach our Target? • CPM • Brand Awareness IN-MARKET EFFECTIVENESS • Purchase Interest Are we moving the needle? • Message Association • Direct Response
  • 17.
    Looking at afew of Kellogg’s larger campaigns Data provided by comScore Campaign Essentials is at an individual publisher, individual campaign level Impressions Impressions Avg. Frequency Targeting Index % on Target Total Campaign Campaign Total Publisher 1 Publisher 2 Publisher 3 Aaron is there data for this Publisher 4 chart? Publisher 5
  • 18.
    comScore shows thatthere have been some clear top performances In total, this campaign effectively delivered to target and efficiently balanced the exposures Impressions Impressions Avg. Frequency Targeting Index % on Target Total Campaign Campaign Total 216 58% 3.2 Publisher 1 163 44% 4.0 Publisher 2 225 60% 3.1 Publisher 3 140 37% 3.5
  • 19.
    But comScore AlsoShows That There Are Some BIG opportunities In this case many impressions are virtually being thrown away as the wrong audience is reached over and over again Impressions Impressions Avg. Frequency Targeting Index % on Target Total Campaign Campaign Total 105 53% 12.0 Publisher 1 97 49% 8.8 Publisher 2 25 13% 21.7 Publisher 3 92 47% 11.4 Publisher 4 143 72% 15.6
  • 20.
    Is Kellogg’s StrategyWorking? The early results say ABSOLUTELY Implemented new Digital strategy and analytics in the first half of 2011. ROI results from our first two Brand Market Mix Models have just come in. Brand 1 ROI Brand 2 ROI 6x 5X 3X 2X ROI ROI Year 1 Year 2 1H 2011 Year 1 Year 2 1H 2011
  • 21.
  • 22.
    Arguably the MostImportant Digital Advertising Initiative To Date: Making Measurement Make Sense (3MS) Mission  Reduce costs of doing business due to complexity of digital advertising ecosystem  ‘Single Tag’ solution to reduce complexity  Improve reporting of ad exposure  Bolster confidence that ads delivered are actually visible
  • 23.
    comScore quantified incidenceof sub-optimal ad delivery across all key ad delivery dimensions… … to better understand sources of waste and identify opportunities to extract more value from digital advertising dollars
  • 24.
    vCE US CharterStudy: 12 Major Branded Advertisers Came Together to Lead & Learn 18 campaigns 2 billion impressions 400,000 sites Allstate
  • 25.
    vCE Charter Studyreplicated in Europe with similar results 15 campaigns 640 million impressions 213,000 sites
  • 26.
    vCE Charter Study: In-viewRates Need to Be Improved U.S. EU 69% 67% AVERAGE AVERAGE Campaign In-view ad rates ranged from: U.S. 55% to 93% EU 64% to 72%
  • 27.
    vCE Charter Study: Opportunityfor improvement at many of the largest sites 98% 69% In-View ad rates across Top 500 7% US sites MINIMUM AVERAGE MAXIMUM 100% 63% In-View ad rates across top 100 0.2% EU sites MINIMIUM AVERAGE MAXIMUM
  • 28.
    Large sites scoredbetter than long-tail sites Percentage of Ads Served In-View 77% 74% 70% 61% 66% 63% 61% 55% US EU
  • 29.
    Digital Ad Economics: TheGood Guys Aren’t Necessarily Winning Low correlation of In-View Rates & CPM R²=0.0373 An equally as weak correlation was also observed between CPM and ability to hit a primary demographic target
  • 30.
    vCE Charter Study: AdsSometimes Fall Outside of Desired Geography U.S. EU 4% of ads were served 7% of ads were served outside geography. outside geography. Up to 15% of ads on a Up to 27% of ads on a given campaign given campaign About half of geographic waste was not only out of target but also out of language
  • 31.
    vGRP can providemore accurate analysis of campaign effectiveness in Marketing Mix Models GRP: Negative vGRP: Positive Correlation Correlation 100 80 100 80 90 90 70 70 80 80 60 60 70 70 vGRP GRP 50 50 60 60 Sales Sales 50 40 50 40 40 40 30 30 30 30 20 20 20 20 10 10 10 10 0 0 0 0 Month 1 Month 2 Month 1 Month 2
  • 32.
    The KPI Framework:Establishing a model for Advertising Effectiveness – applied initially to Online Media PRE-MARKET QUALITY • Branded Recognition Does my creative have the right to succeed? • Brand Buy Next • % Impressions to Target/Targeting Index AUDIENCE DELIVERY • Frequency of Exposure Did we efficiently reach our Target? • % Impressions in View • CPM • Brand Awareness IN-MARKET EFFECTIVENESS • Purchase Interest Are we moving the needle? • Message Association • Direct Response
  • 33.
    Where Kellogg’s isGoing: In-Market Optimization at a Campaign Level Based on Cost and Effectiveness • Opportunity to optimize - Budgets follow performance • Multiple publishers, each with high reach potential • Wide variance in performance observed real-time Brand X - Q3/Q4 Media Avg Impressions Impressions Lift in CPM Partner Frequency in Target in View Awareness 1 3.5 24.5% 83% 5.74 $2.44 2 3.0 16.9% 91% 0.55 $9.08 3 8.4 23.5% 71% 0 $8.62
  • 34.
    There is goodnews for advertisers and publishers  Analogous to TV audience guarantees  Eliminating unseen online inventory supply results in:  More effective / efficient campaigns and less waste for advertisers  More accurate metrics for market mix models  Better proof of digital ad effectiveness  Increased transparency/accountability means increased confidence in digital …. leading to more branding ad spending moving online
  • 35.
    Thank You! © comScore,Inc. Proprietary. 35

Editor's Notes

  • #4 Source: http://www.iab.net/media/file/IAB_Internet_Advertising_Revenue_Report_FY_2011.pdf TV: is both cable and broadcast TV
  • #5 Source: http://www.iab.net/media/file/IAB_Internet_Advertising_Revenue_Report_FY_2011.pdf TV: is both cable and broadcast TV
  • #14 -2,600+ studies since launch of CE-115+ are vCE specific studies-We’ve done studies in 28 countries and have the capability to do so in 44 countries
  • #19 For Frequency – Green is between 3-7, Yellow is below 3 and Red is above 7For % on Target – Green is above 60, Yellos is 30-60 and Red is below 30
  • #25 To get some market reaction, we introduced a charter program of some really large advertisers.We were delighted by the response to the program, and let me take the opportunity to say to them, Thanks you for participatingNow let us talk about what we learned.
  • #29 Difference of in-view rates between Top 50 sites and long tail sites in their category was a full 16-percentage points in the USEuropean Results:Top 50                  66%Top 100                63%Top 500                61%501+                    55% The only minor difference with the US is that we’ve taken the full range of sites rather than just a category We had half the publisher volume we saw in the US, and a lot have very small numbers of impressions which, when visible, skew upwards the long tail visibility average.  The overall data set tells the best story and is most consistent with the original US slide.
  • #34 Combining Insights with costs to answer: HOW CAN I GET THE BIGGEST BANG FOR MY BUCK?