Download to read offline


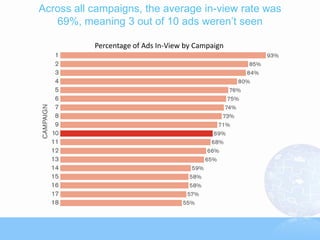

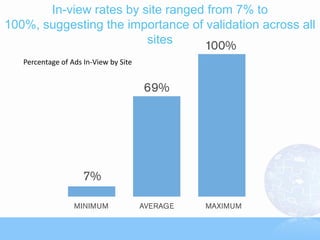
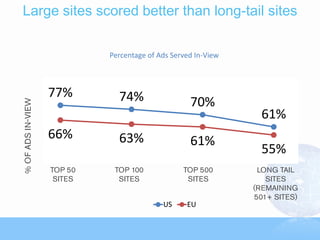
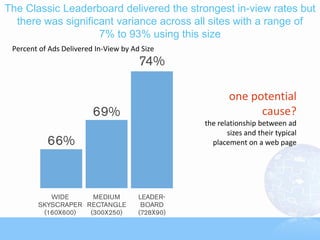
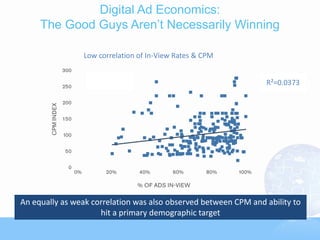
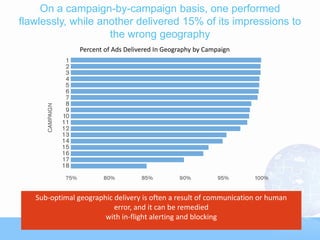
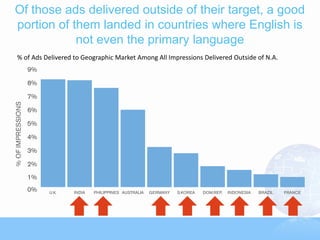


The document summarizes findings from a study that analyzed digital advertising campaigns across multiple advertisers. Some key findings included: - On average, only 69% of ad impressions were viewed, meaning 31% of ads were not seen. In-view rates varied significantly by site. - Geographic targeting was not always accurate, with some ads being delivered to regions outside the intended geography. - Some ads were placed on content deemed unsafe for brands. - Above-the-fold ad placement did not guarantee visibility, with in-view rates ranging from 48-100%. Some below-the-fold ads had high visibility rates too. - There was a weak correlation between ad pricing (CPM) and in-view


