Download to read offline


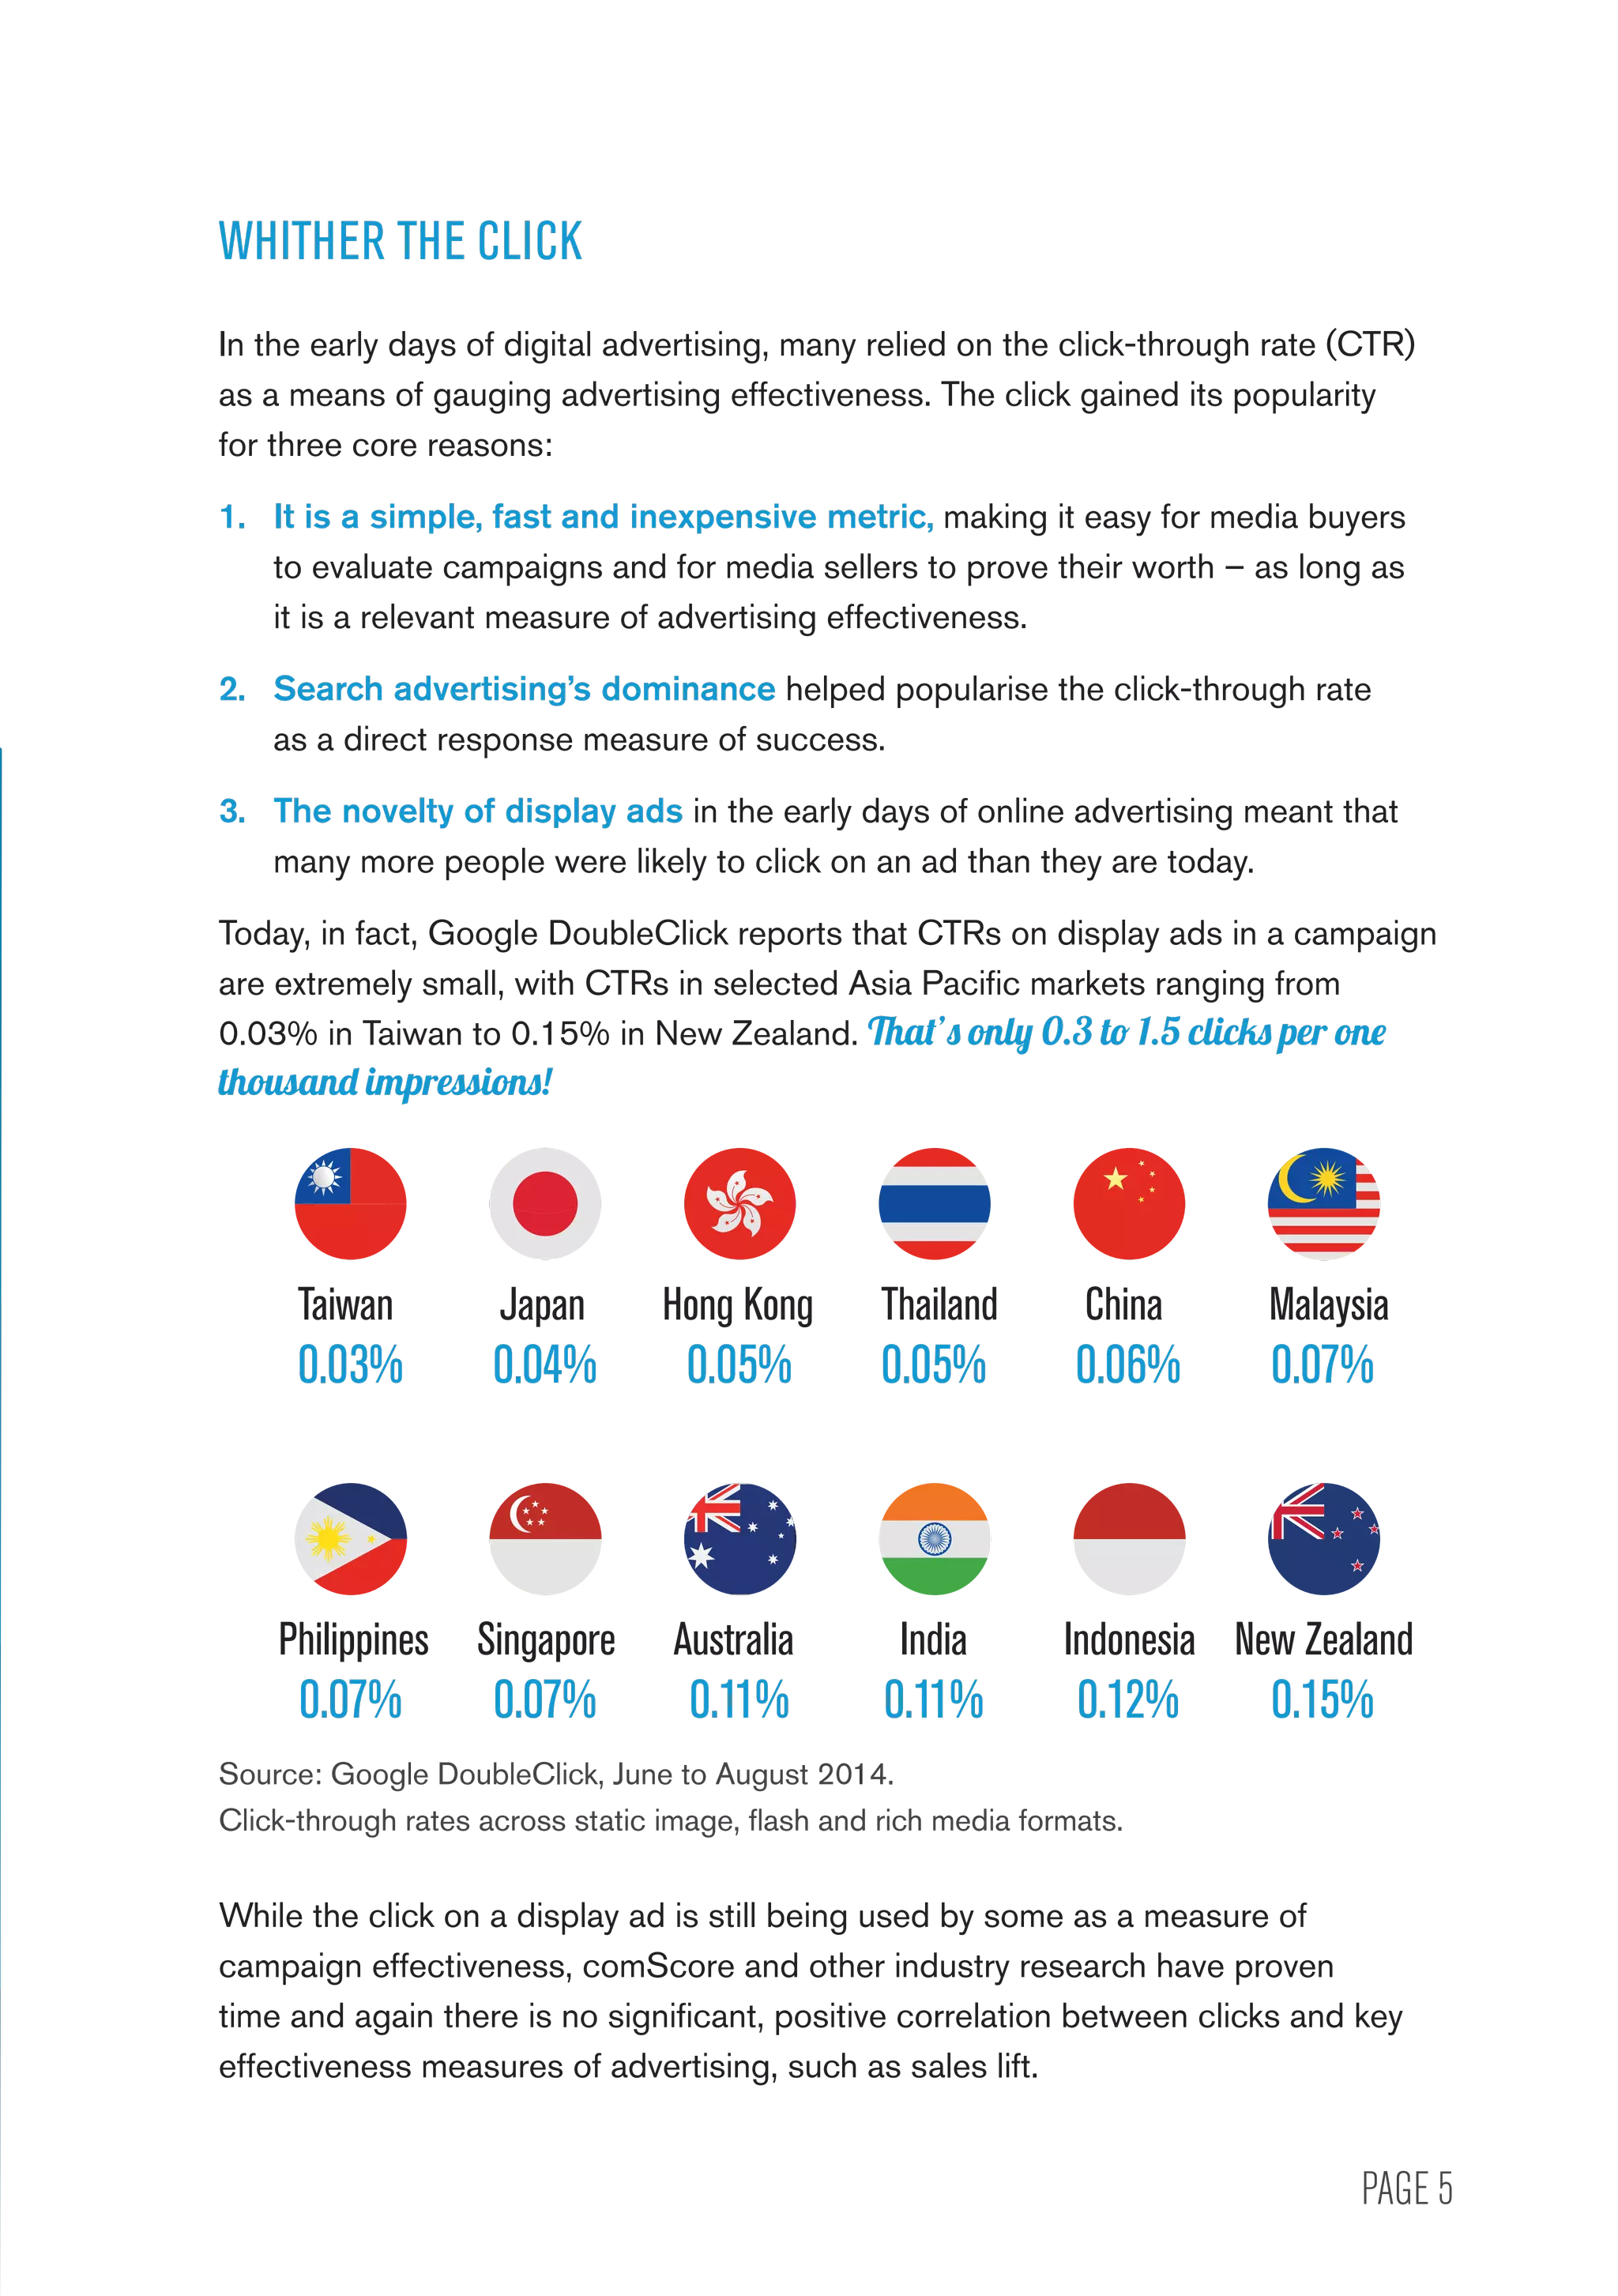
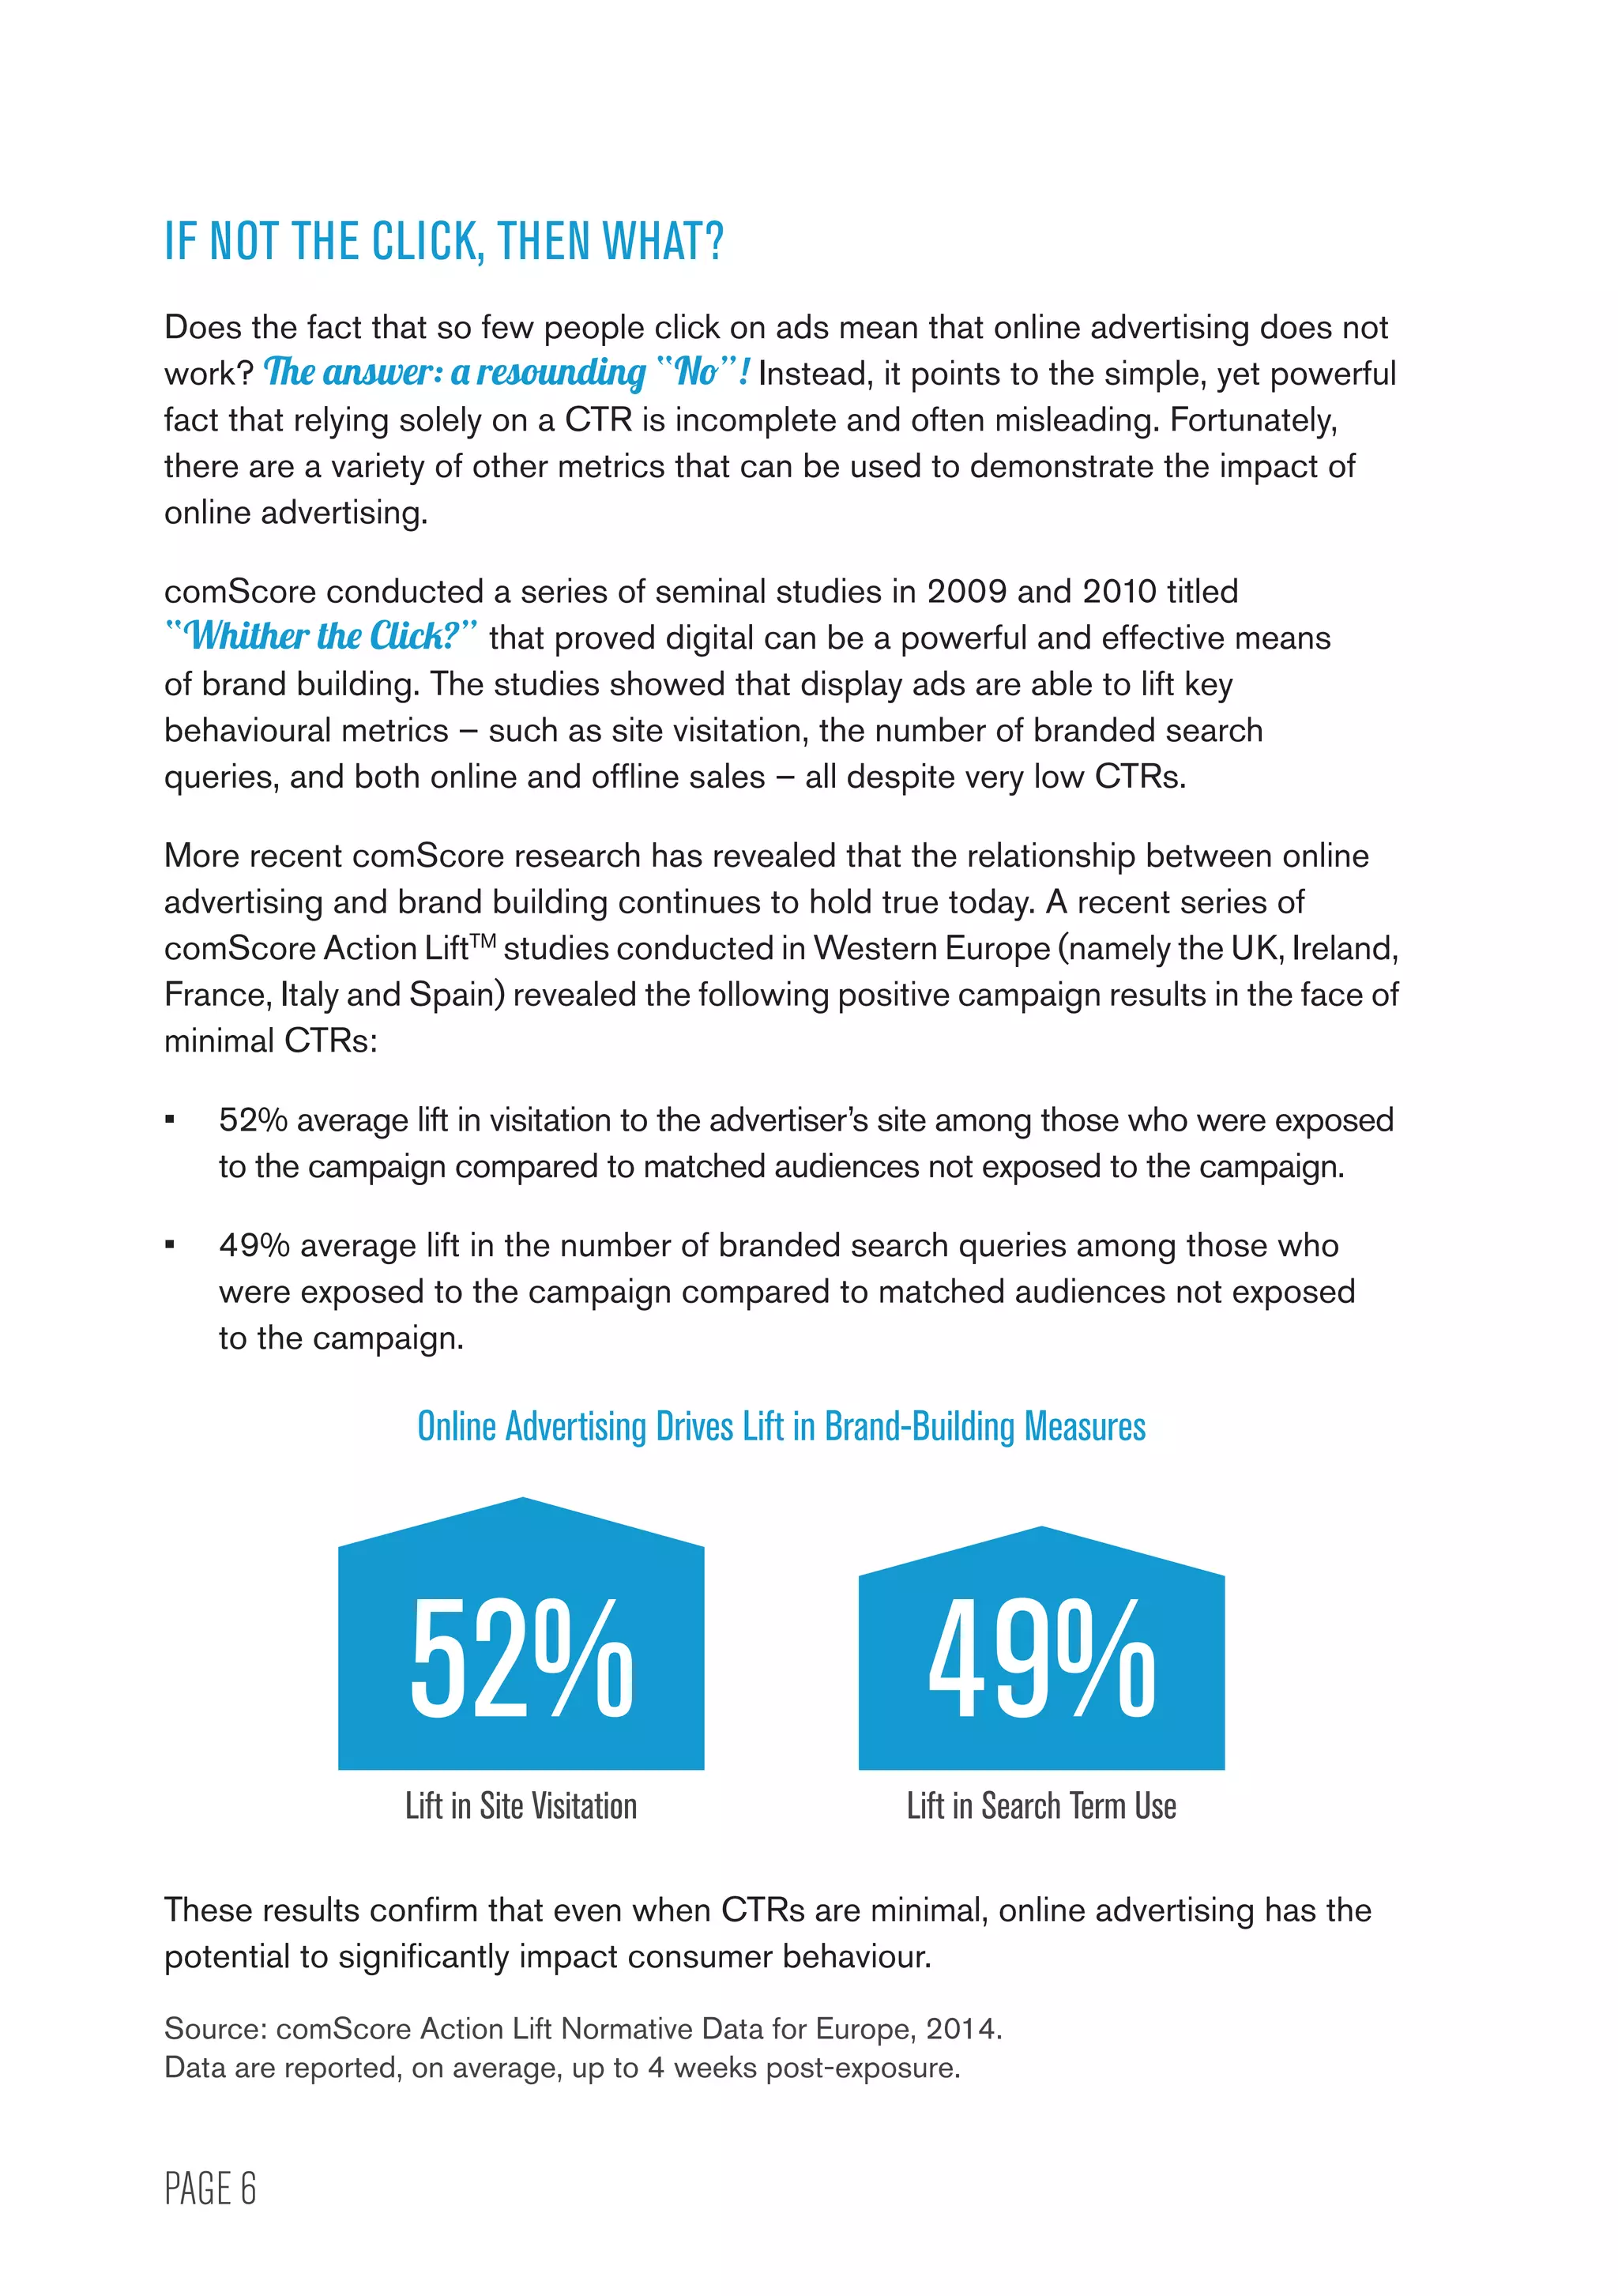


This document provides lessons learned from digital advertising based on comScore's research. It identifies key issues like clicks being an incomplete metric, challenges with cookie-based targeting and measurement, and the need for viewability, brand safety and non-human traffic measurement for transparency. It also discusses how industry benchmarks can help set expectations for campaign delivery given limitations of digital advertising. The document aims to guide more effective planning, evaluation and results for media buyers and sellers.


