Downloaded 45 times
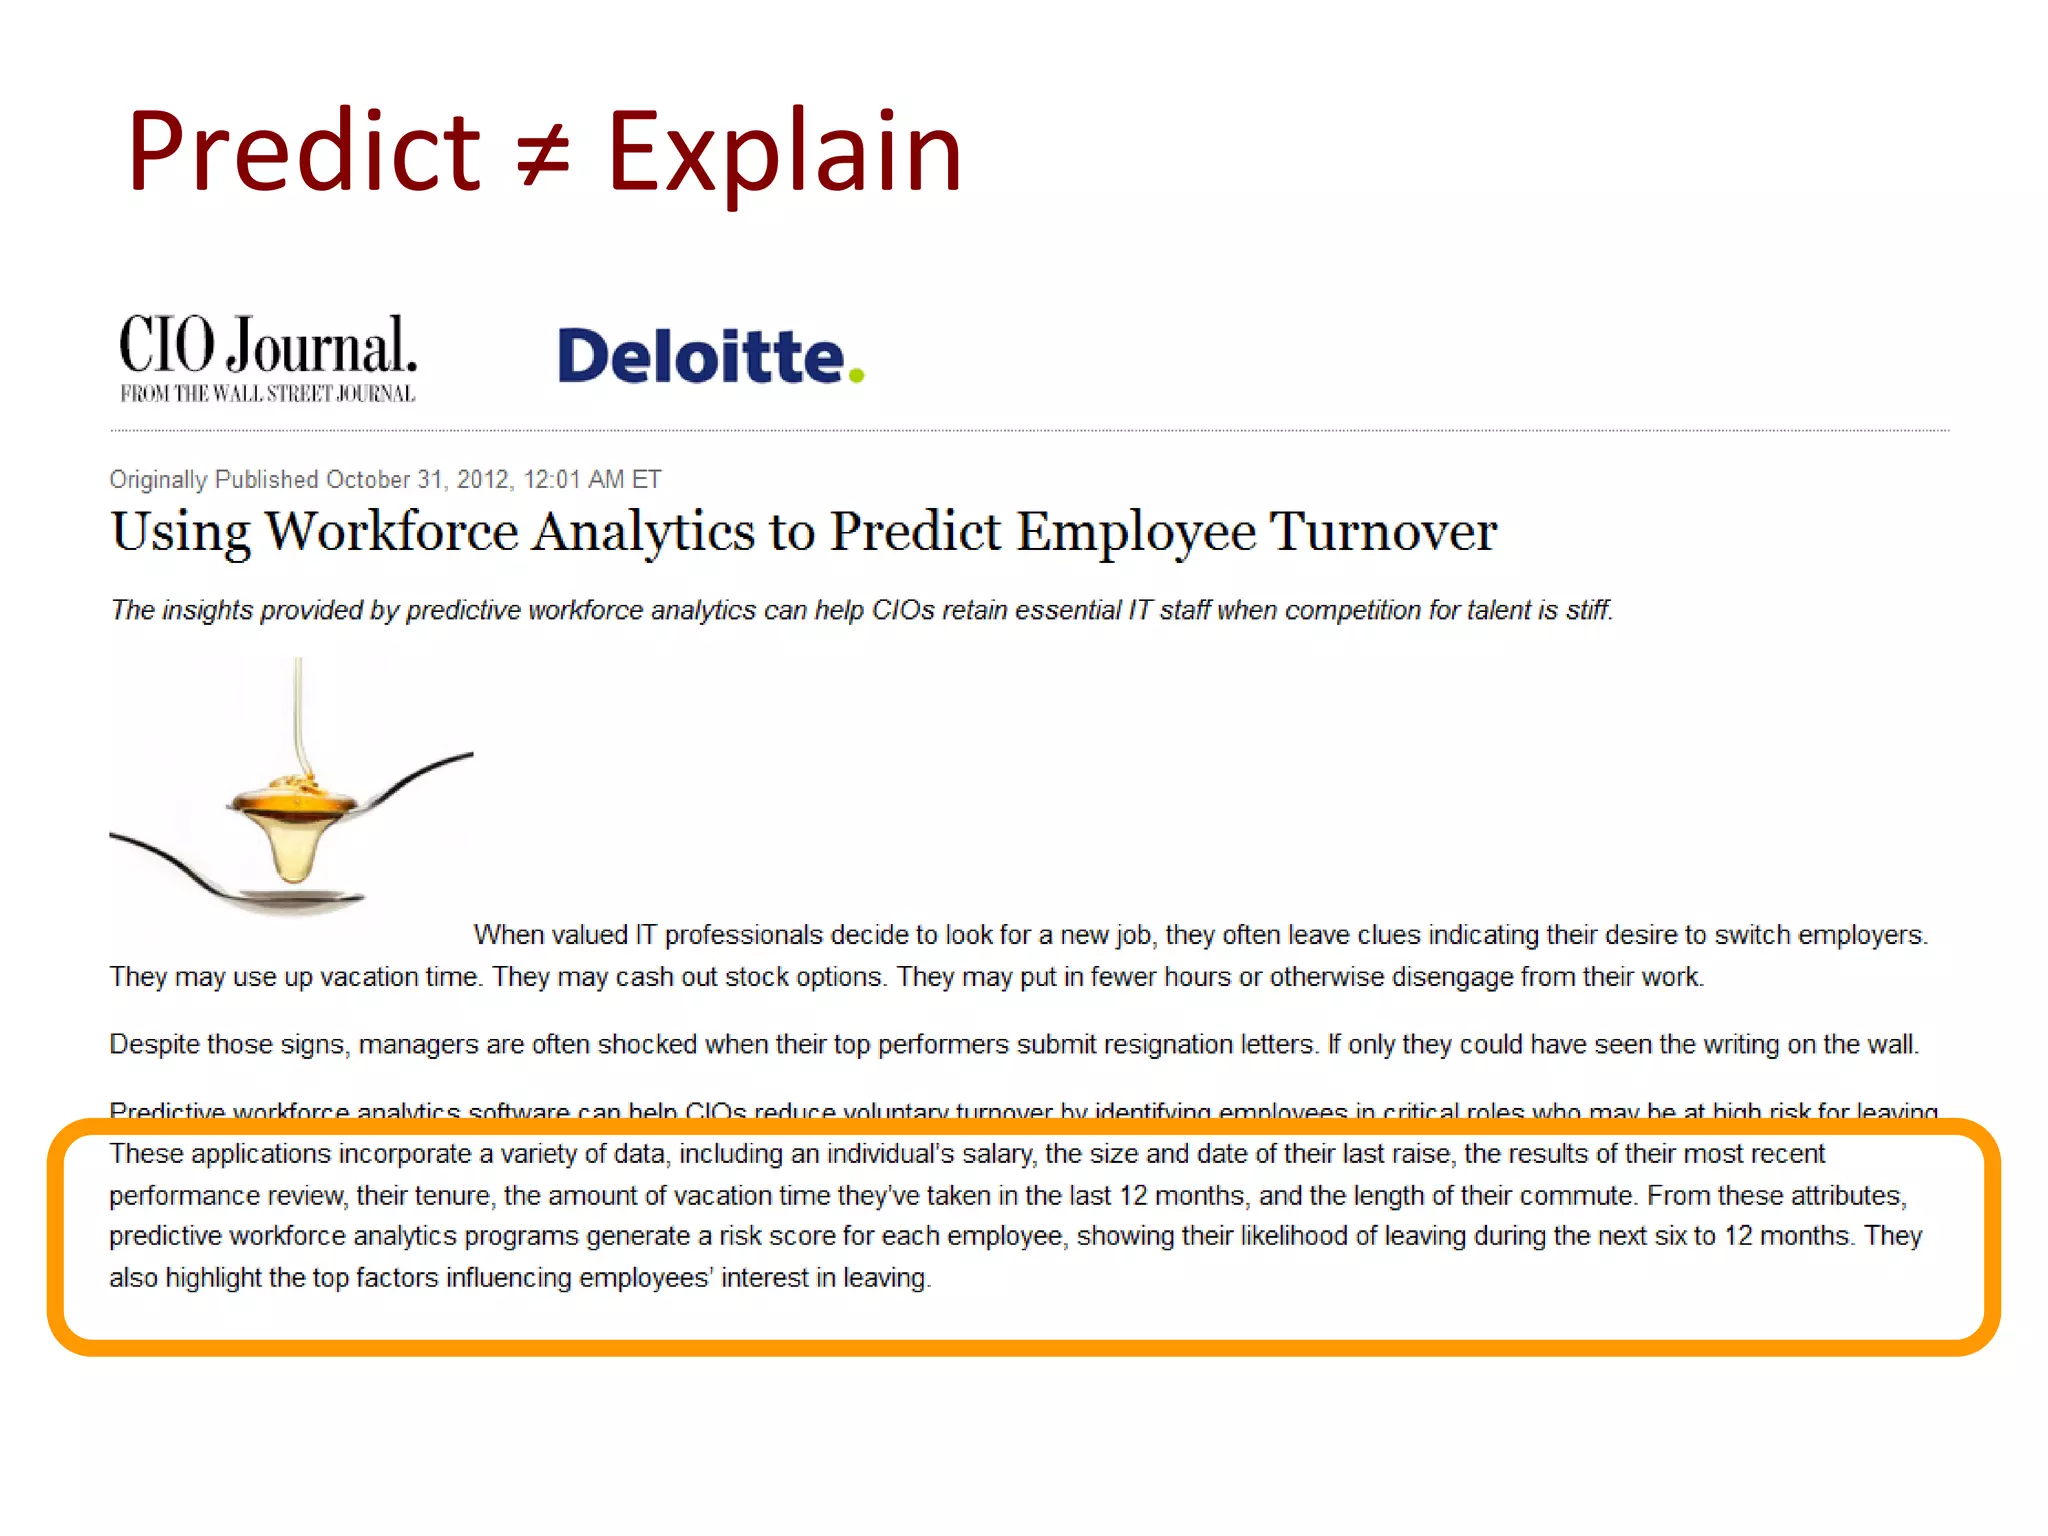
![Predict ≠ Explain
+ ?
“we tried to benefit from an extensive
set of attributes describing each of the
movies in the dataset. Those attributes
certainly carry a significant signal and
can explain some of the user behavior.
However… they could not help at all
for improving the [predictive]
accuracy.”
Bell et al., 2008](https://image.slidesharecdn.com/predictiveanalyticsinistswim2015-150713105306-lva1-app6891/75/Predictive-analytics-in-Information-Systems-Research-TSWIM-2015-keynote-26-2048.jpg)
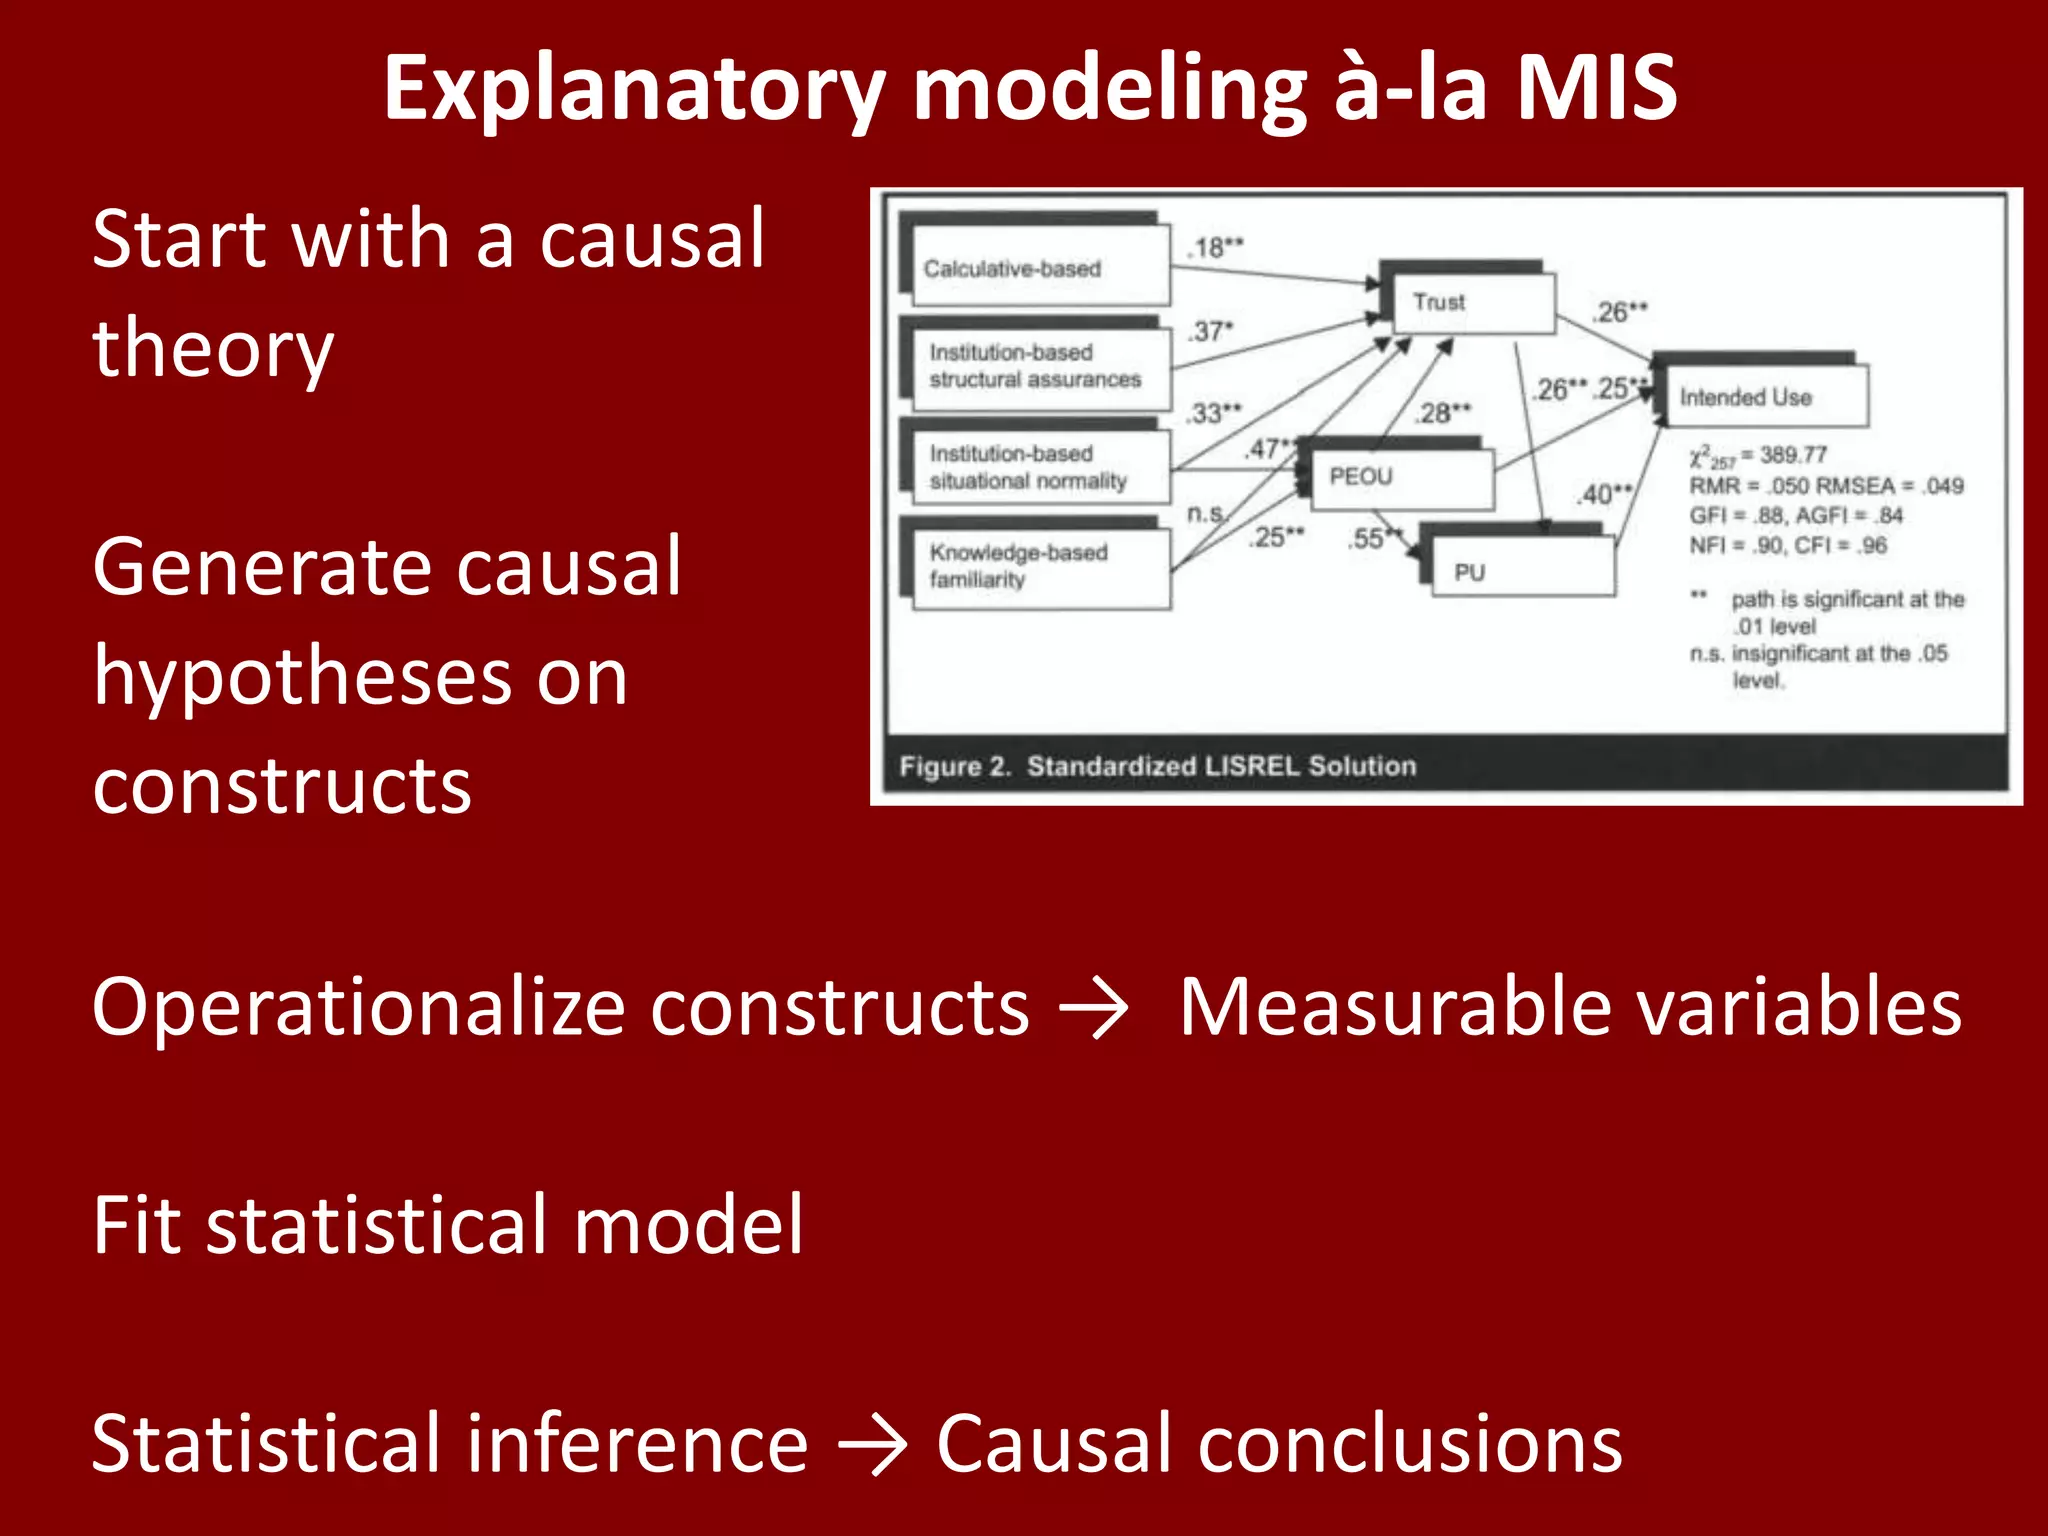
![Current State in Social Sciences
(and MIS)
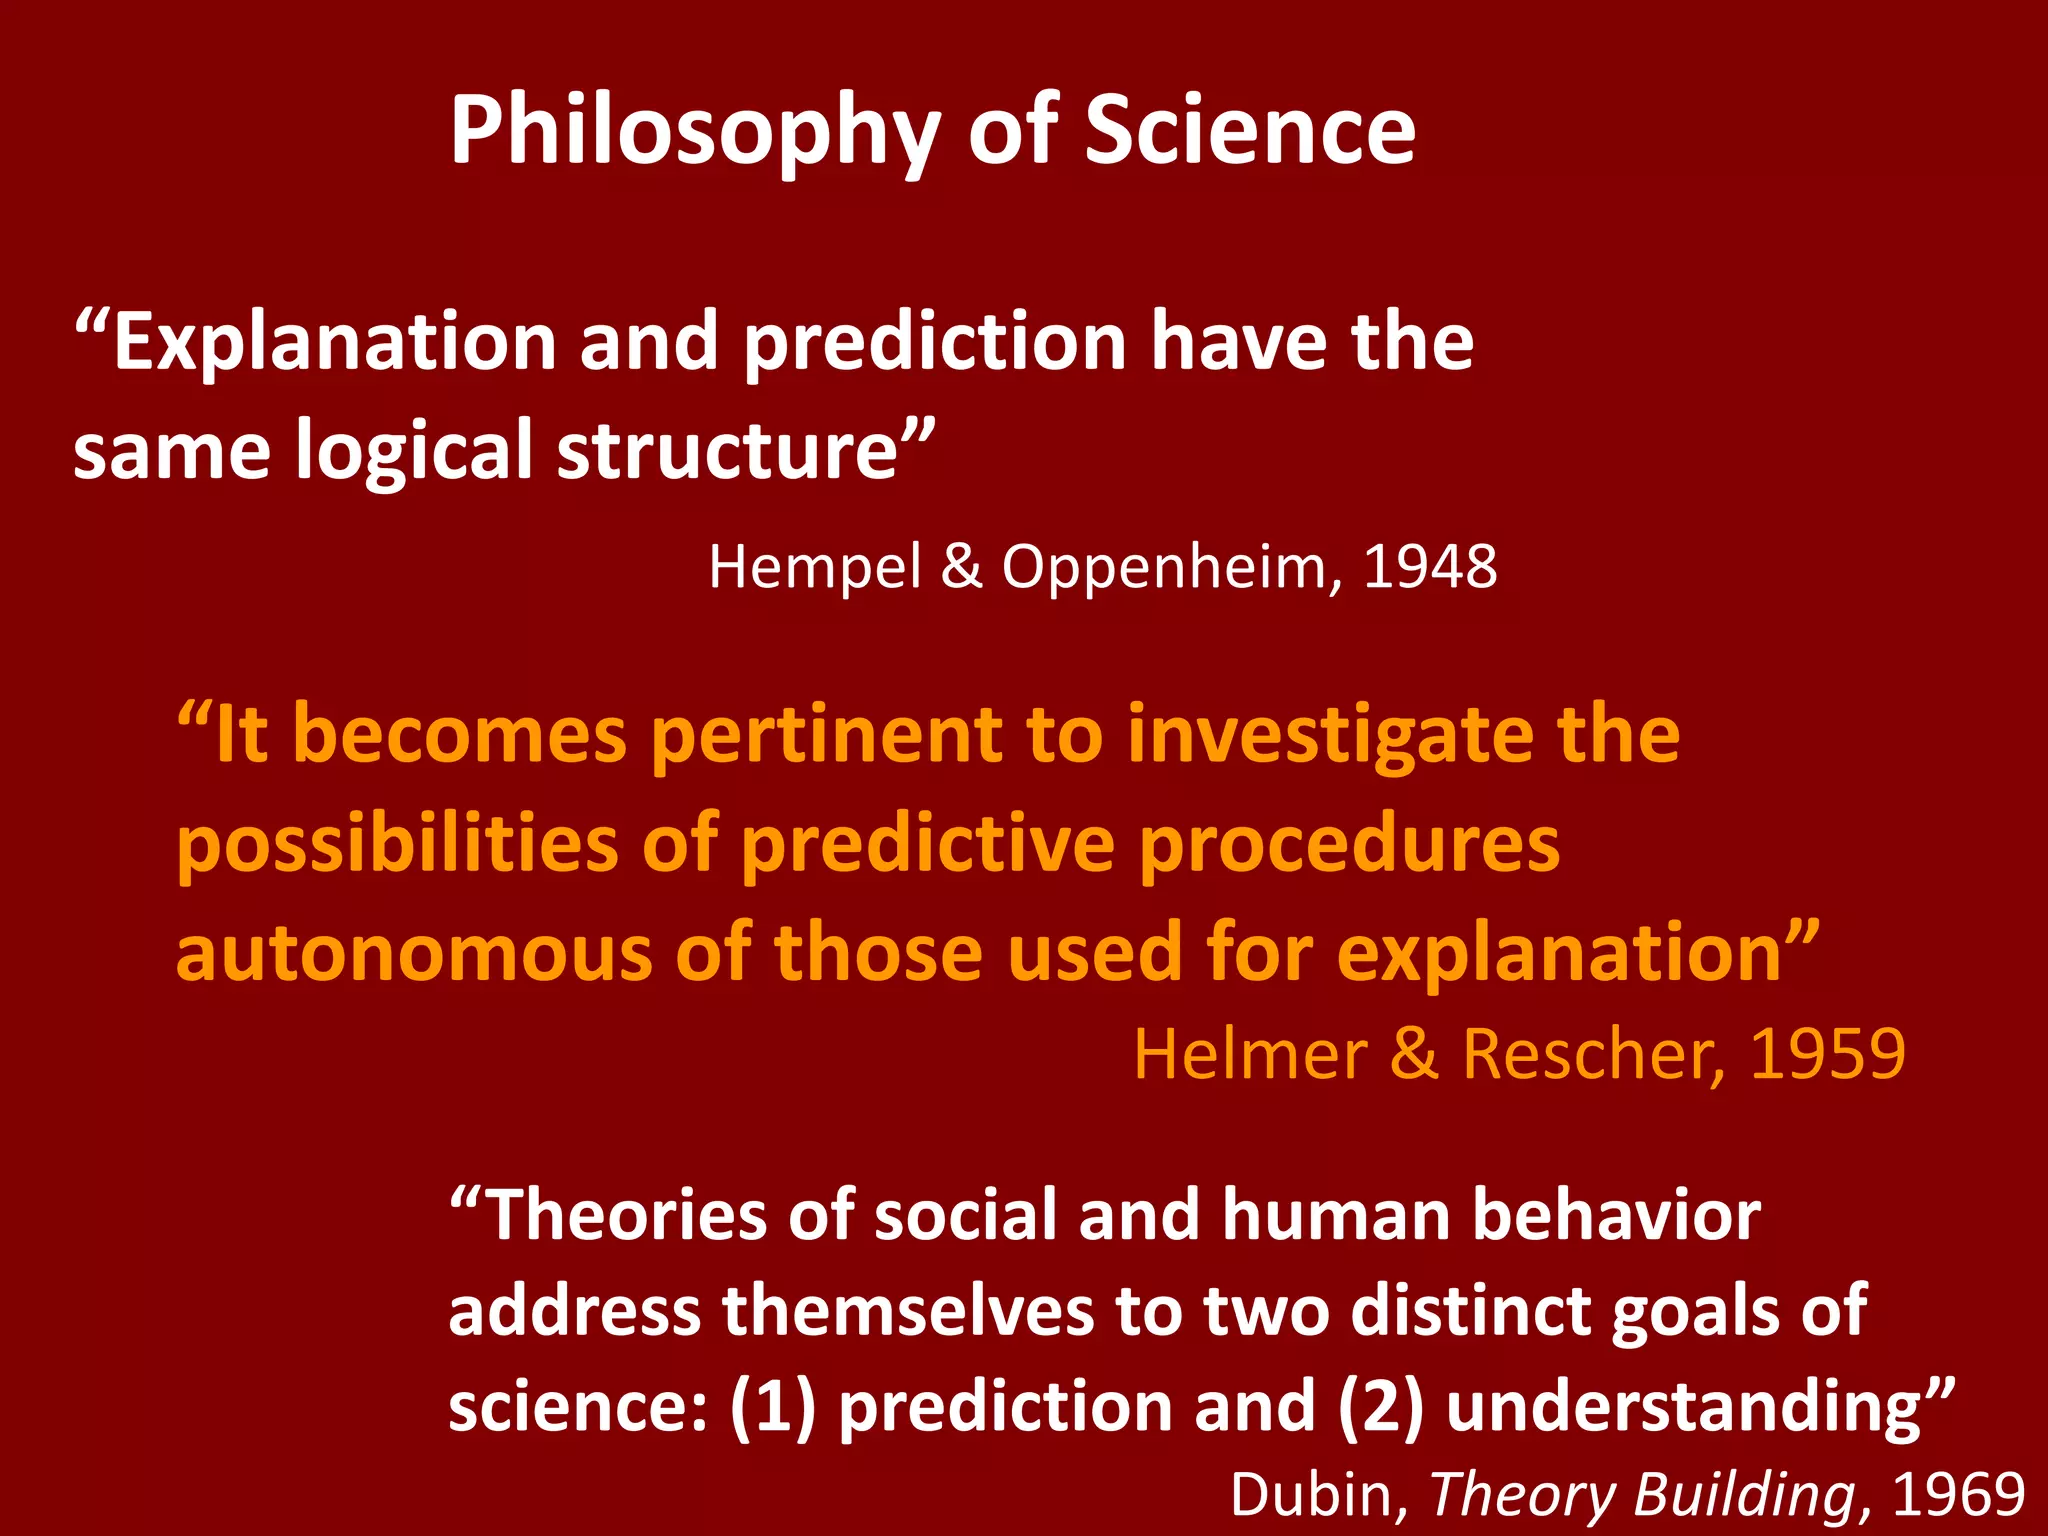
“While the value of scientific prediction… is beyond
question… the inexact sciences [do not] have…the
use of predictive expertise well in hand.”
Helmer & Rescher, 1959
Distinction blurred
Unfamiliarity with predictive
modeling/assessment
Prediction underappreciated](https://image.slidesharecdn.com/predictiveanalyticsinistswim2015-150713105306-lva1-app6891/75/Predictive-analytics-in-Information-Systems-Research-TSWIM-2015-keynote-42-2048.jpg)


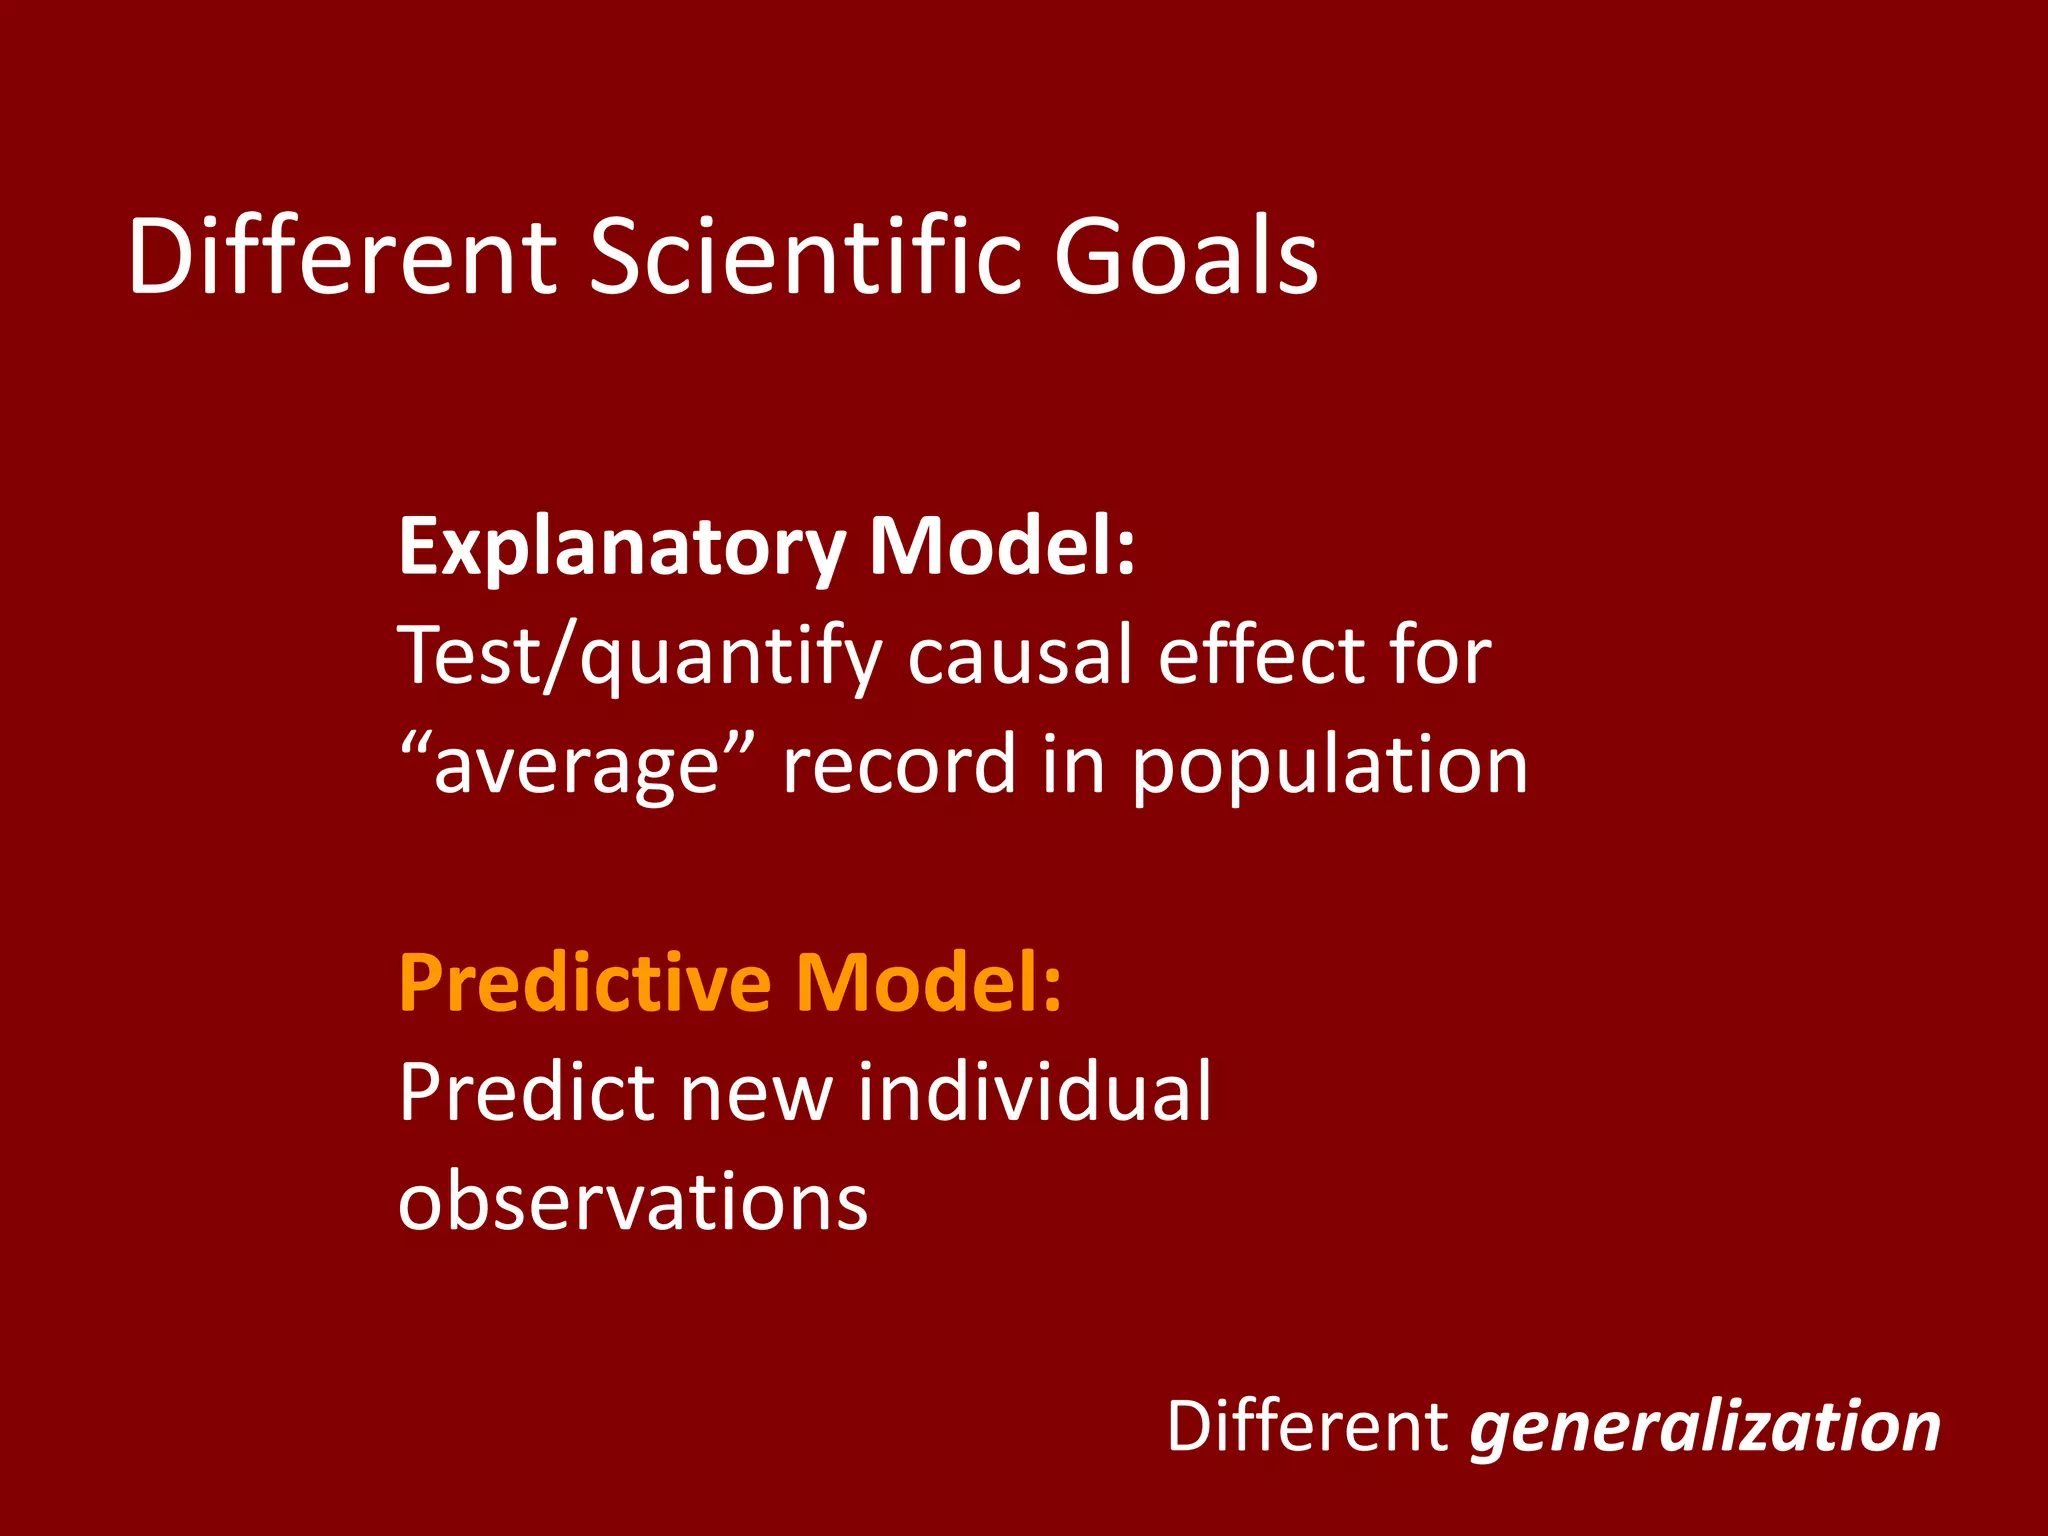
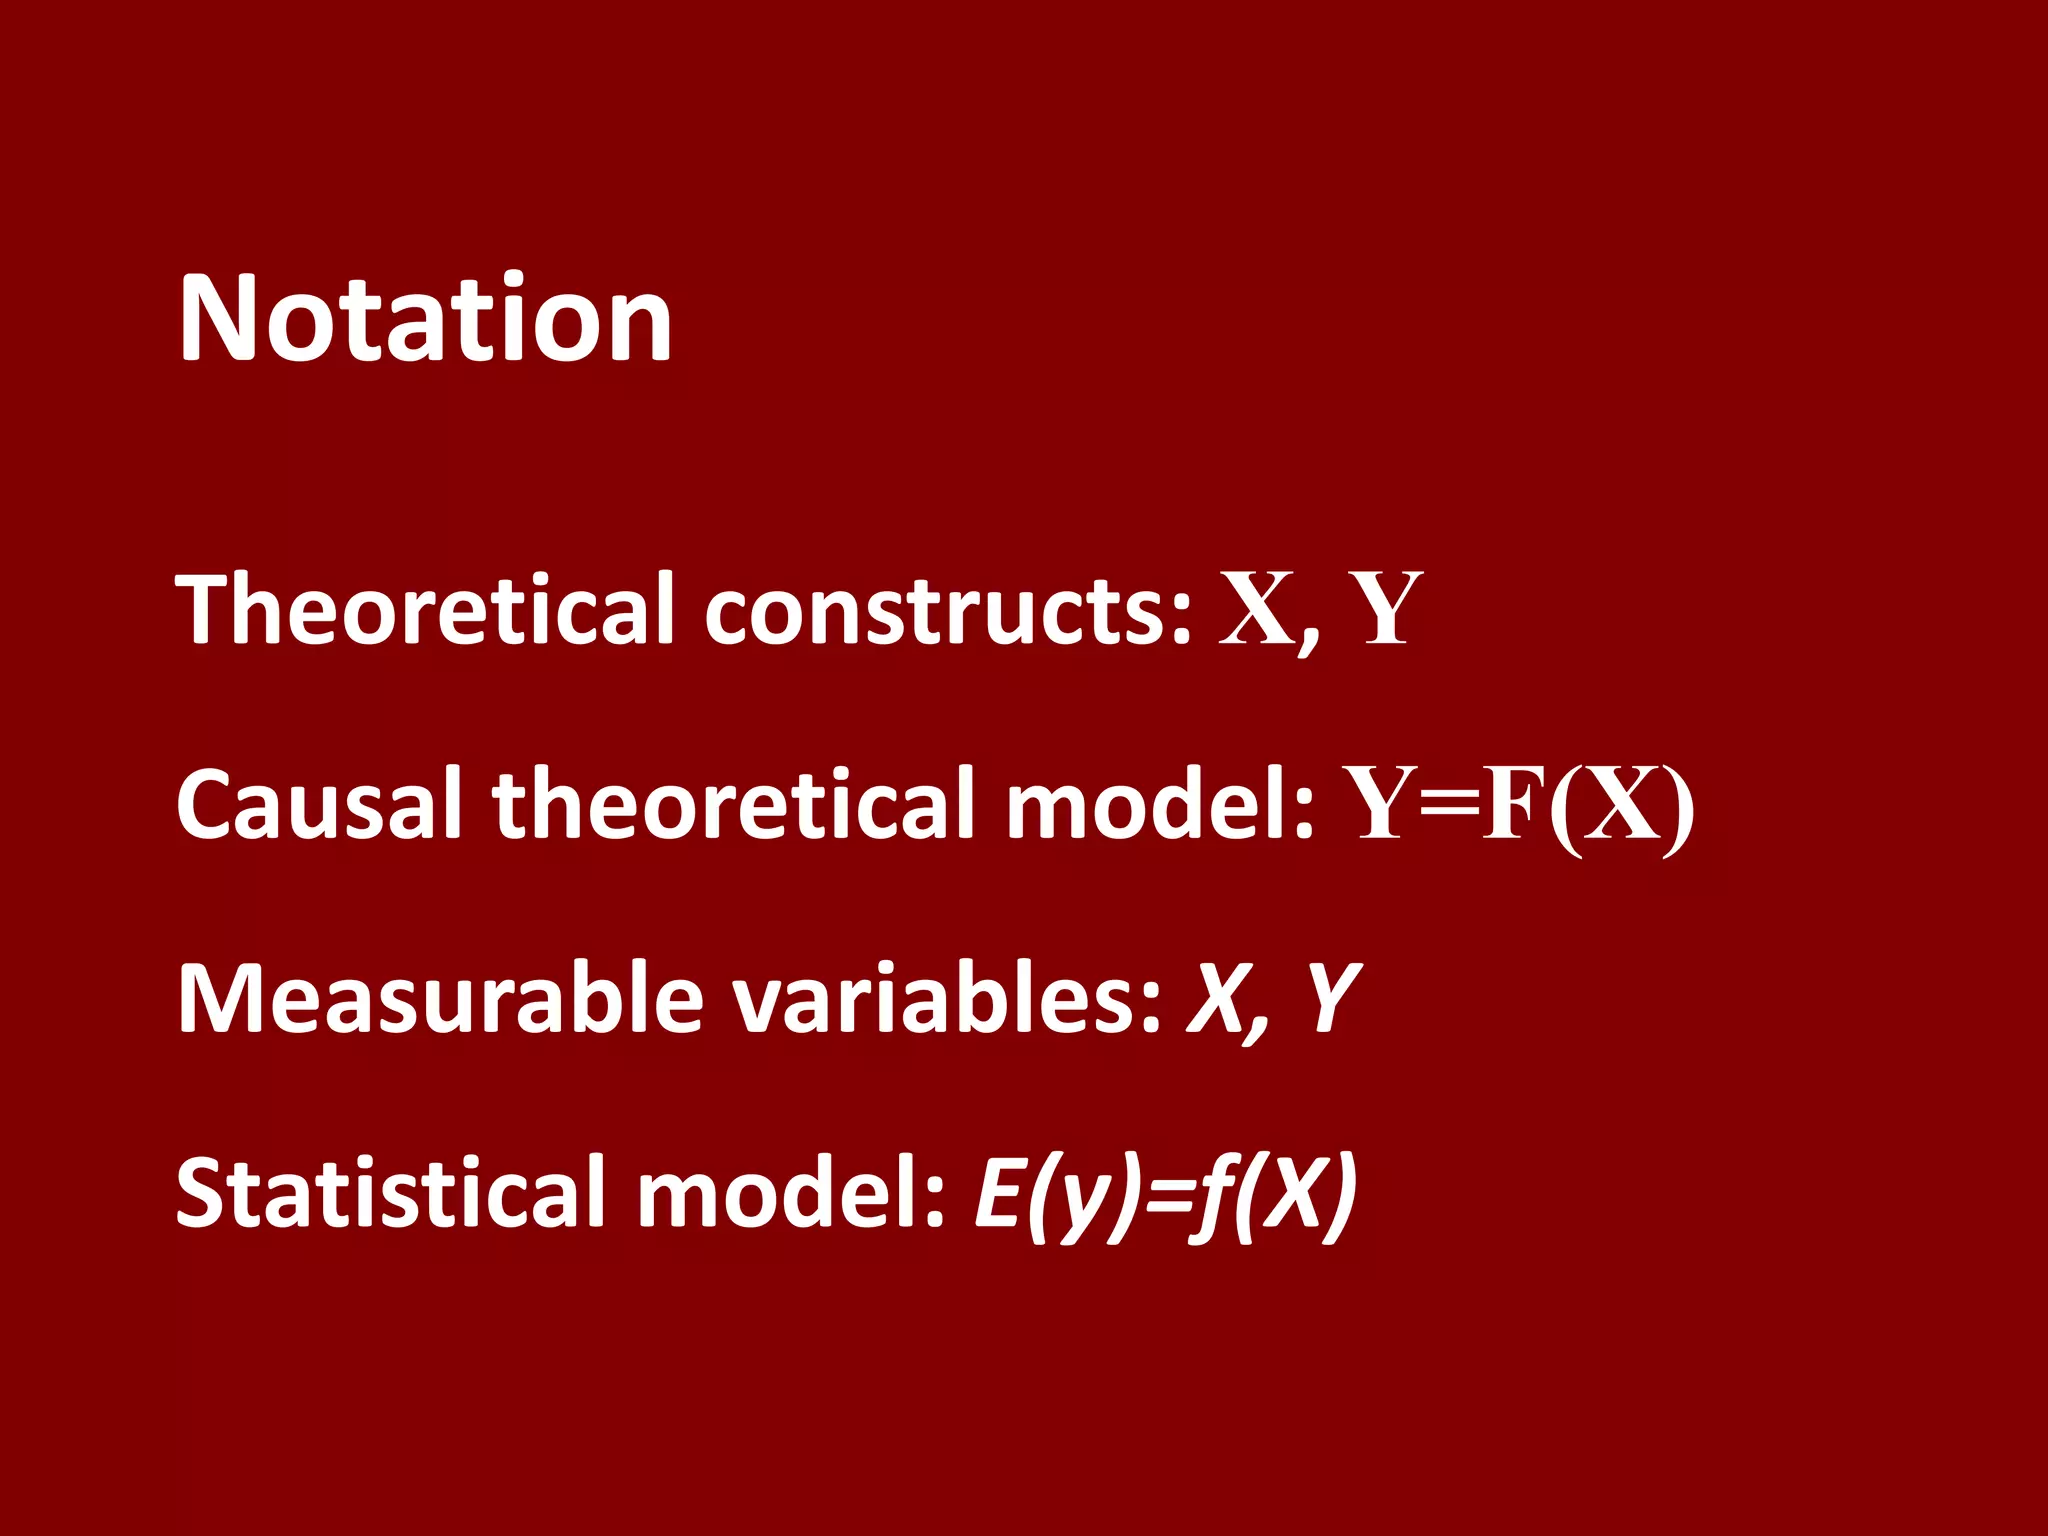
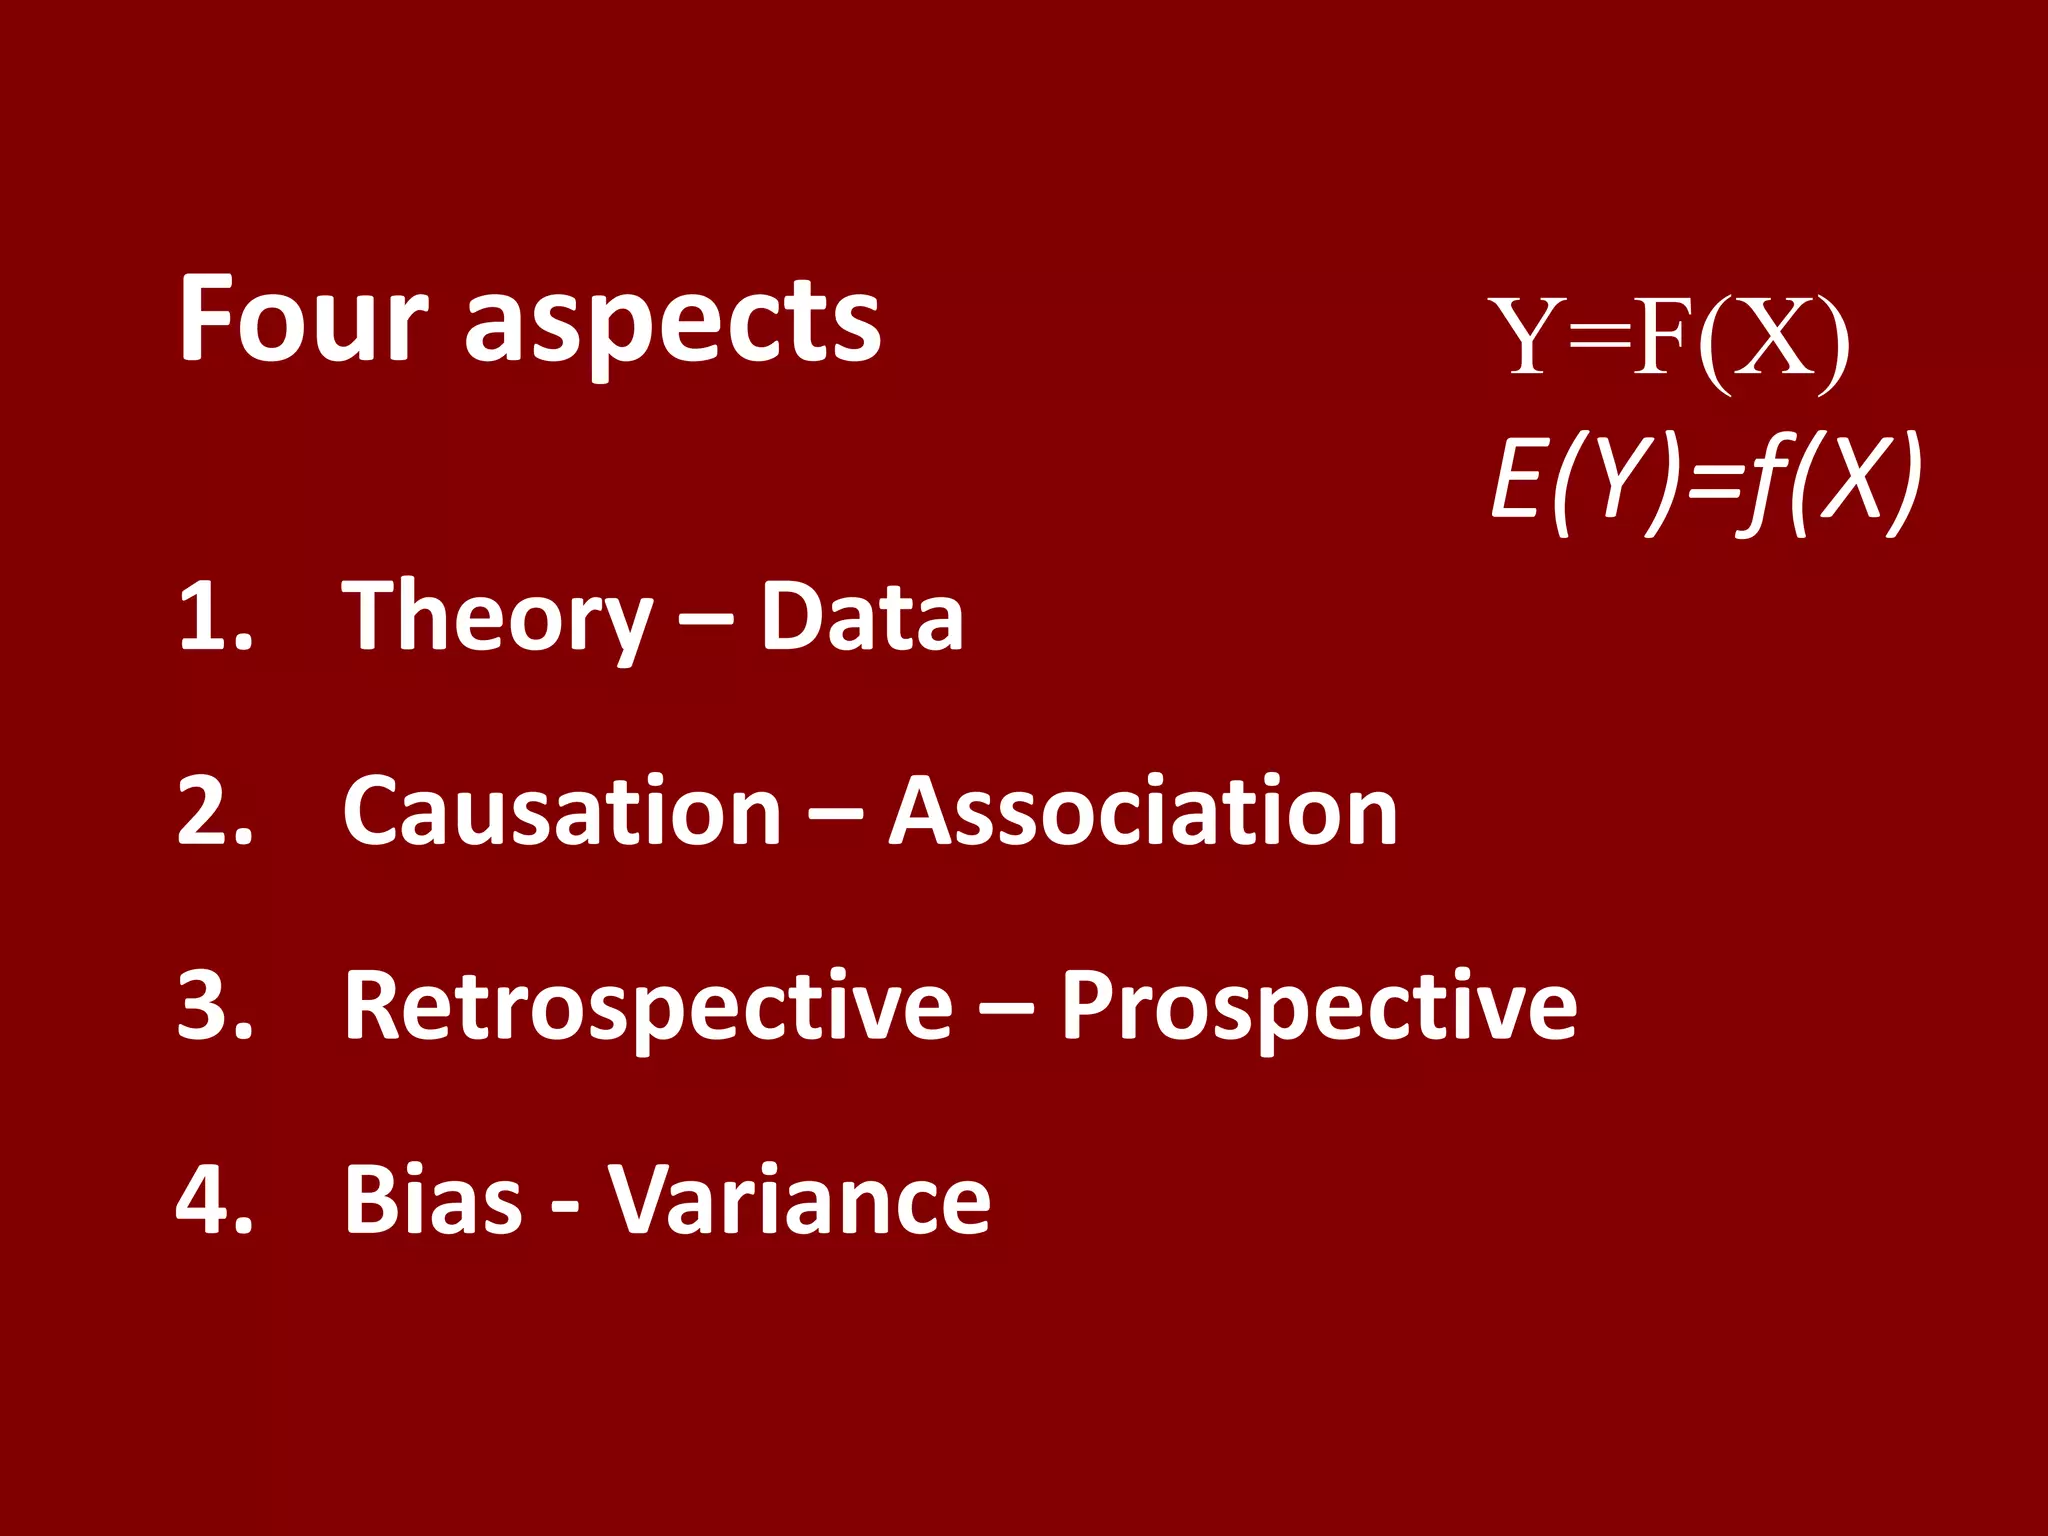
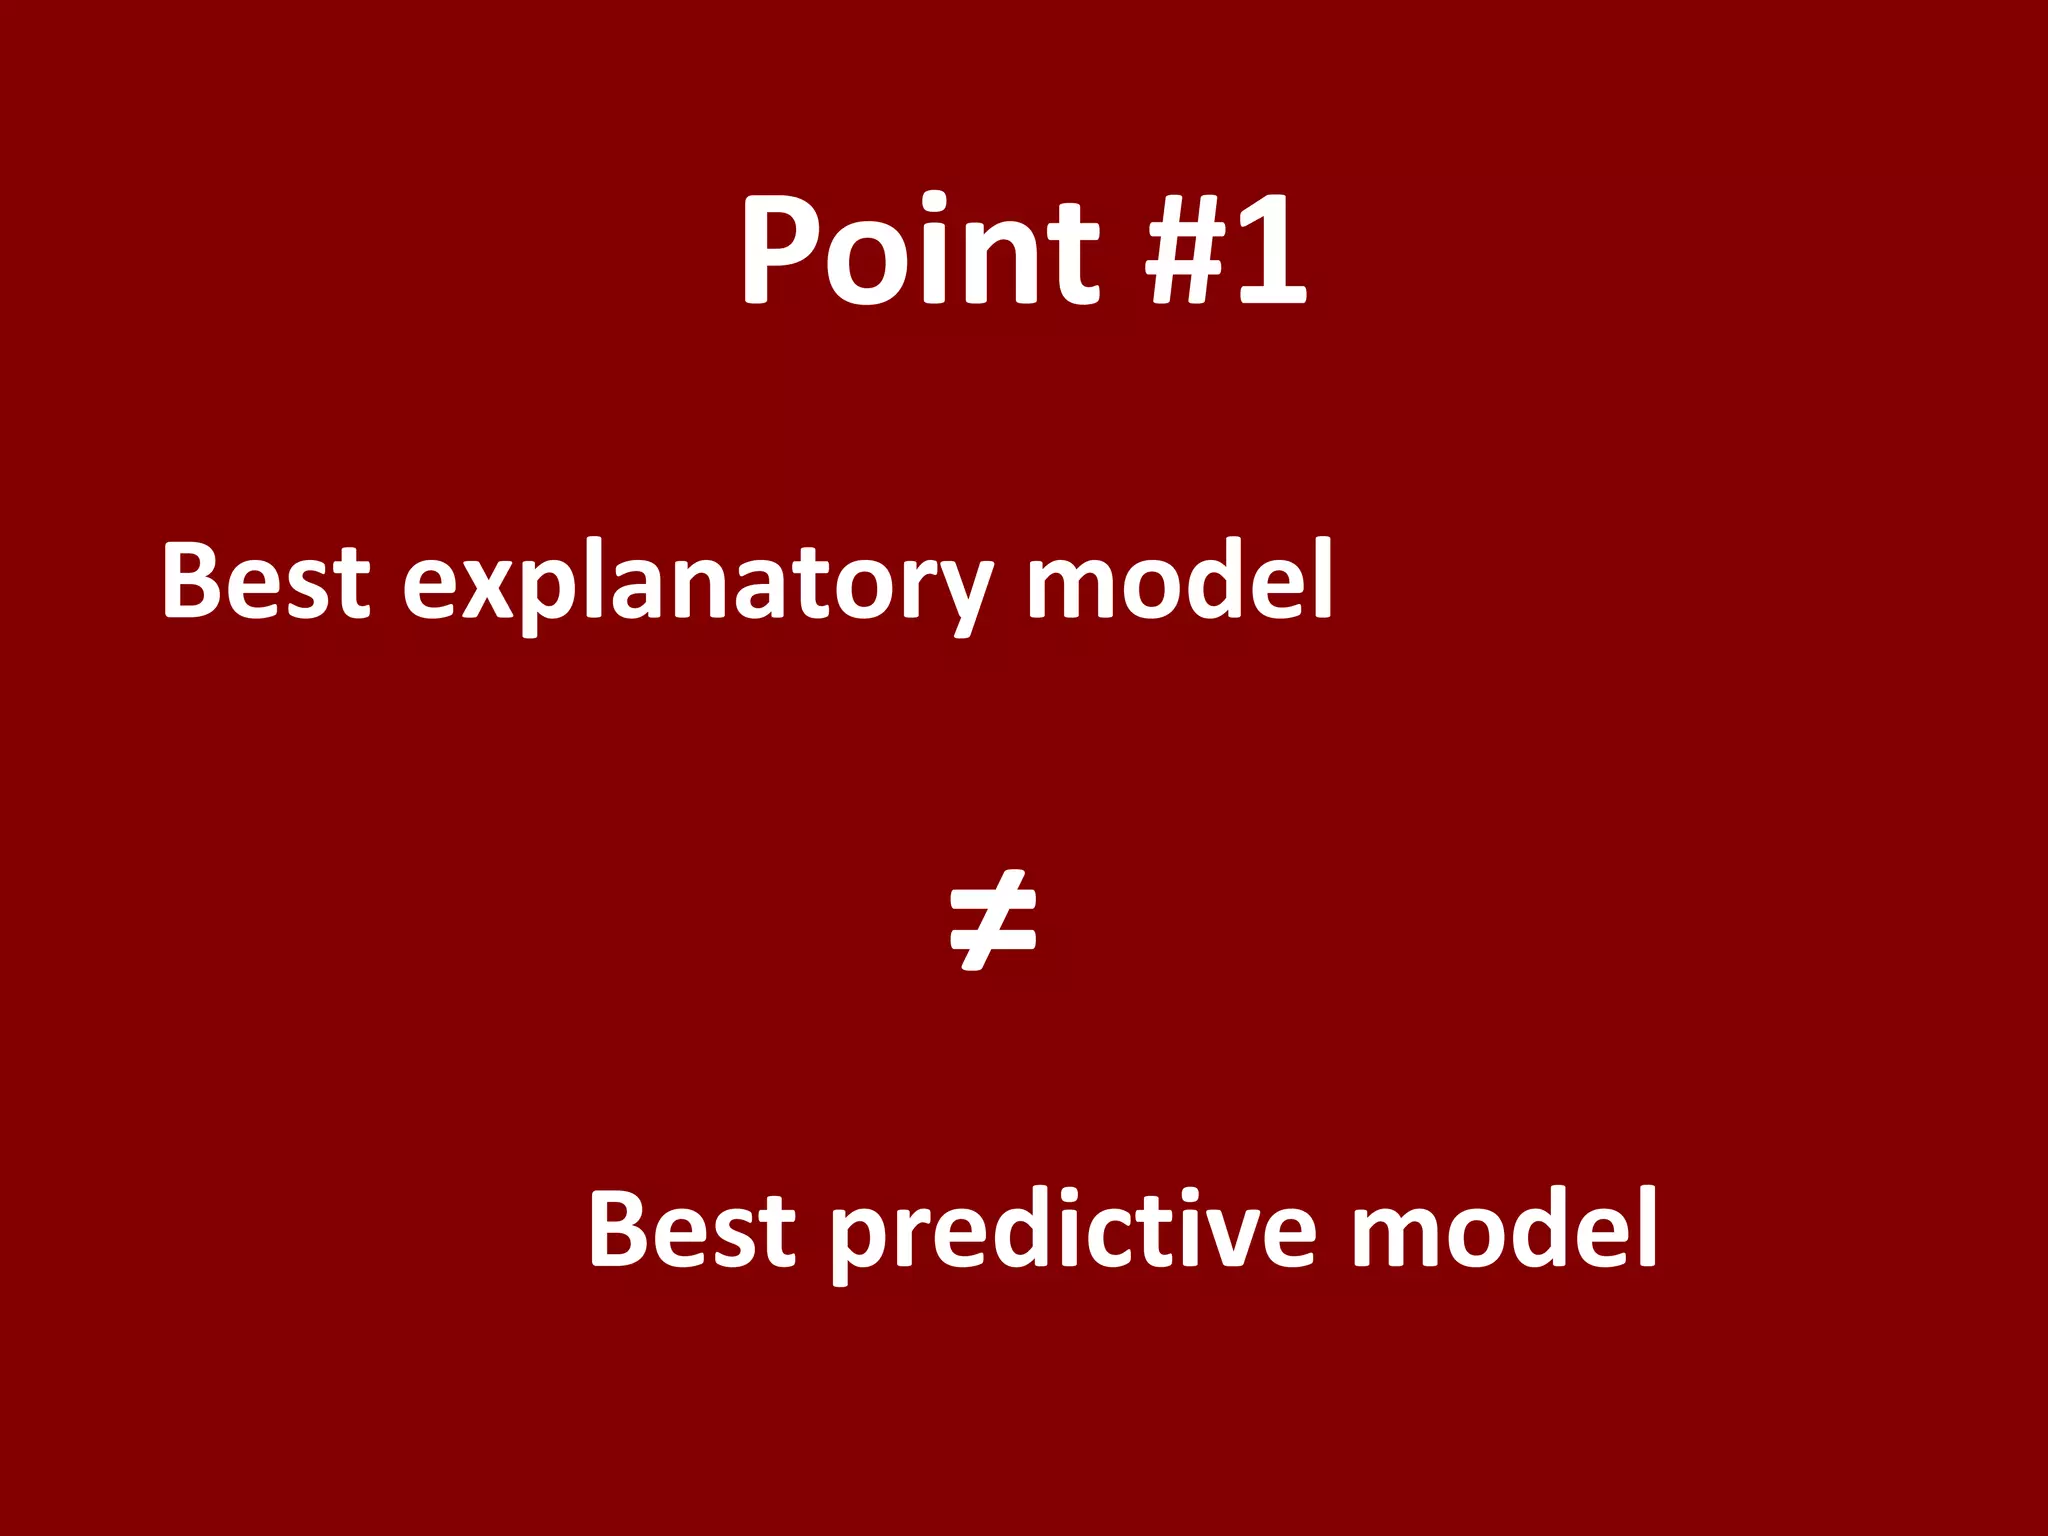
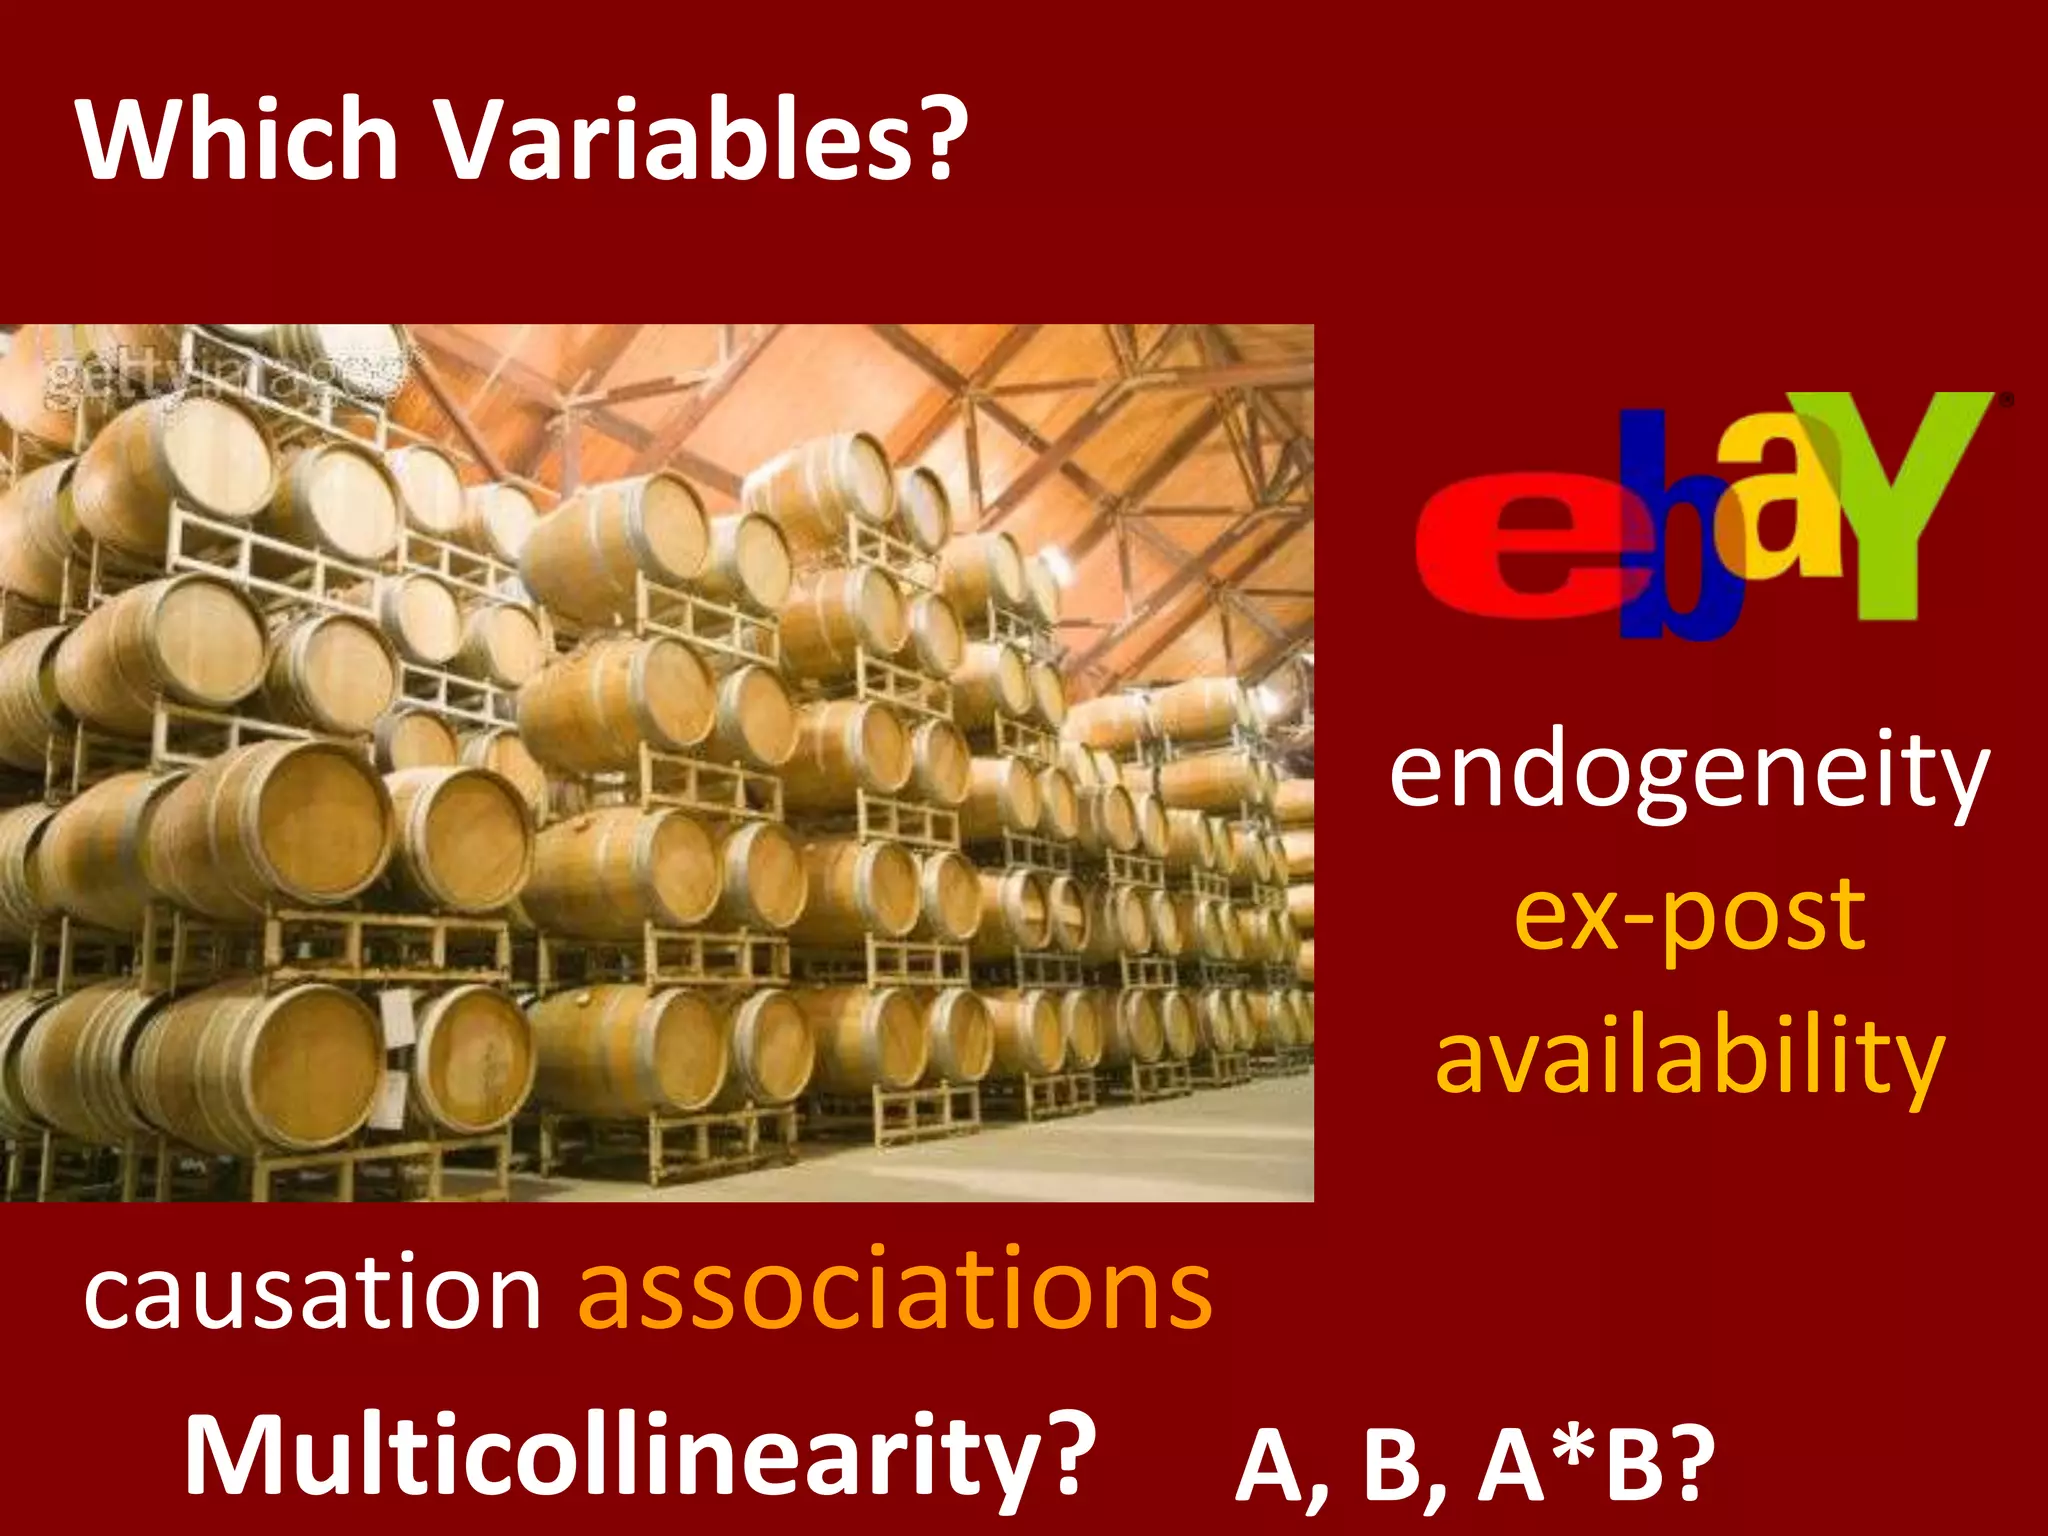
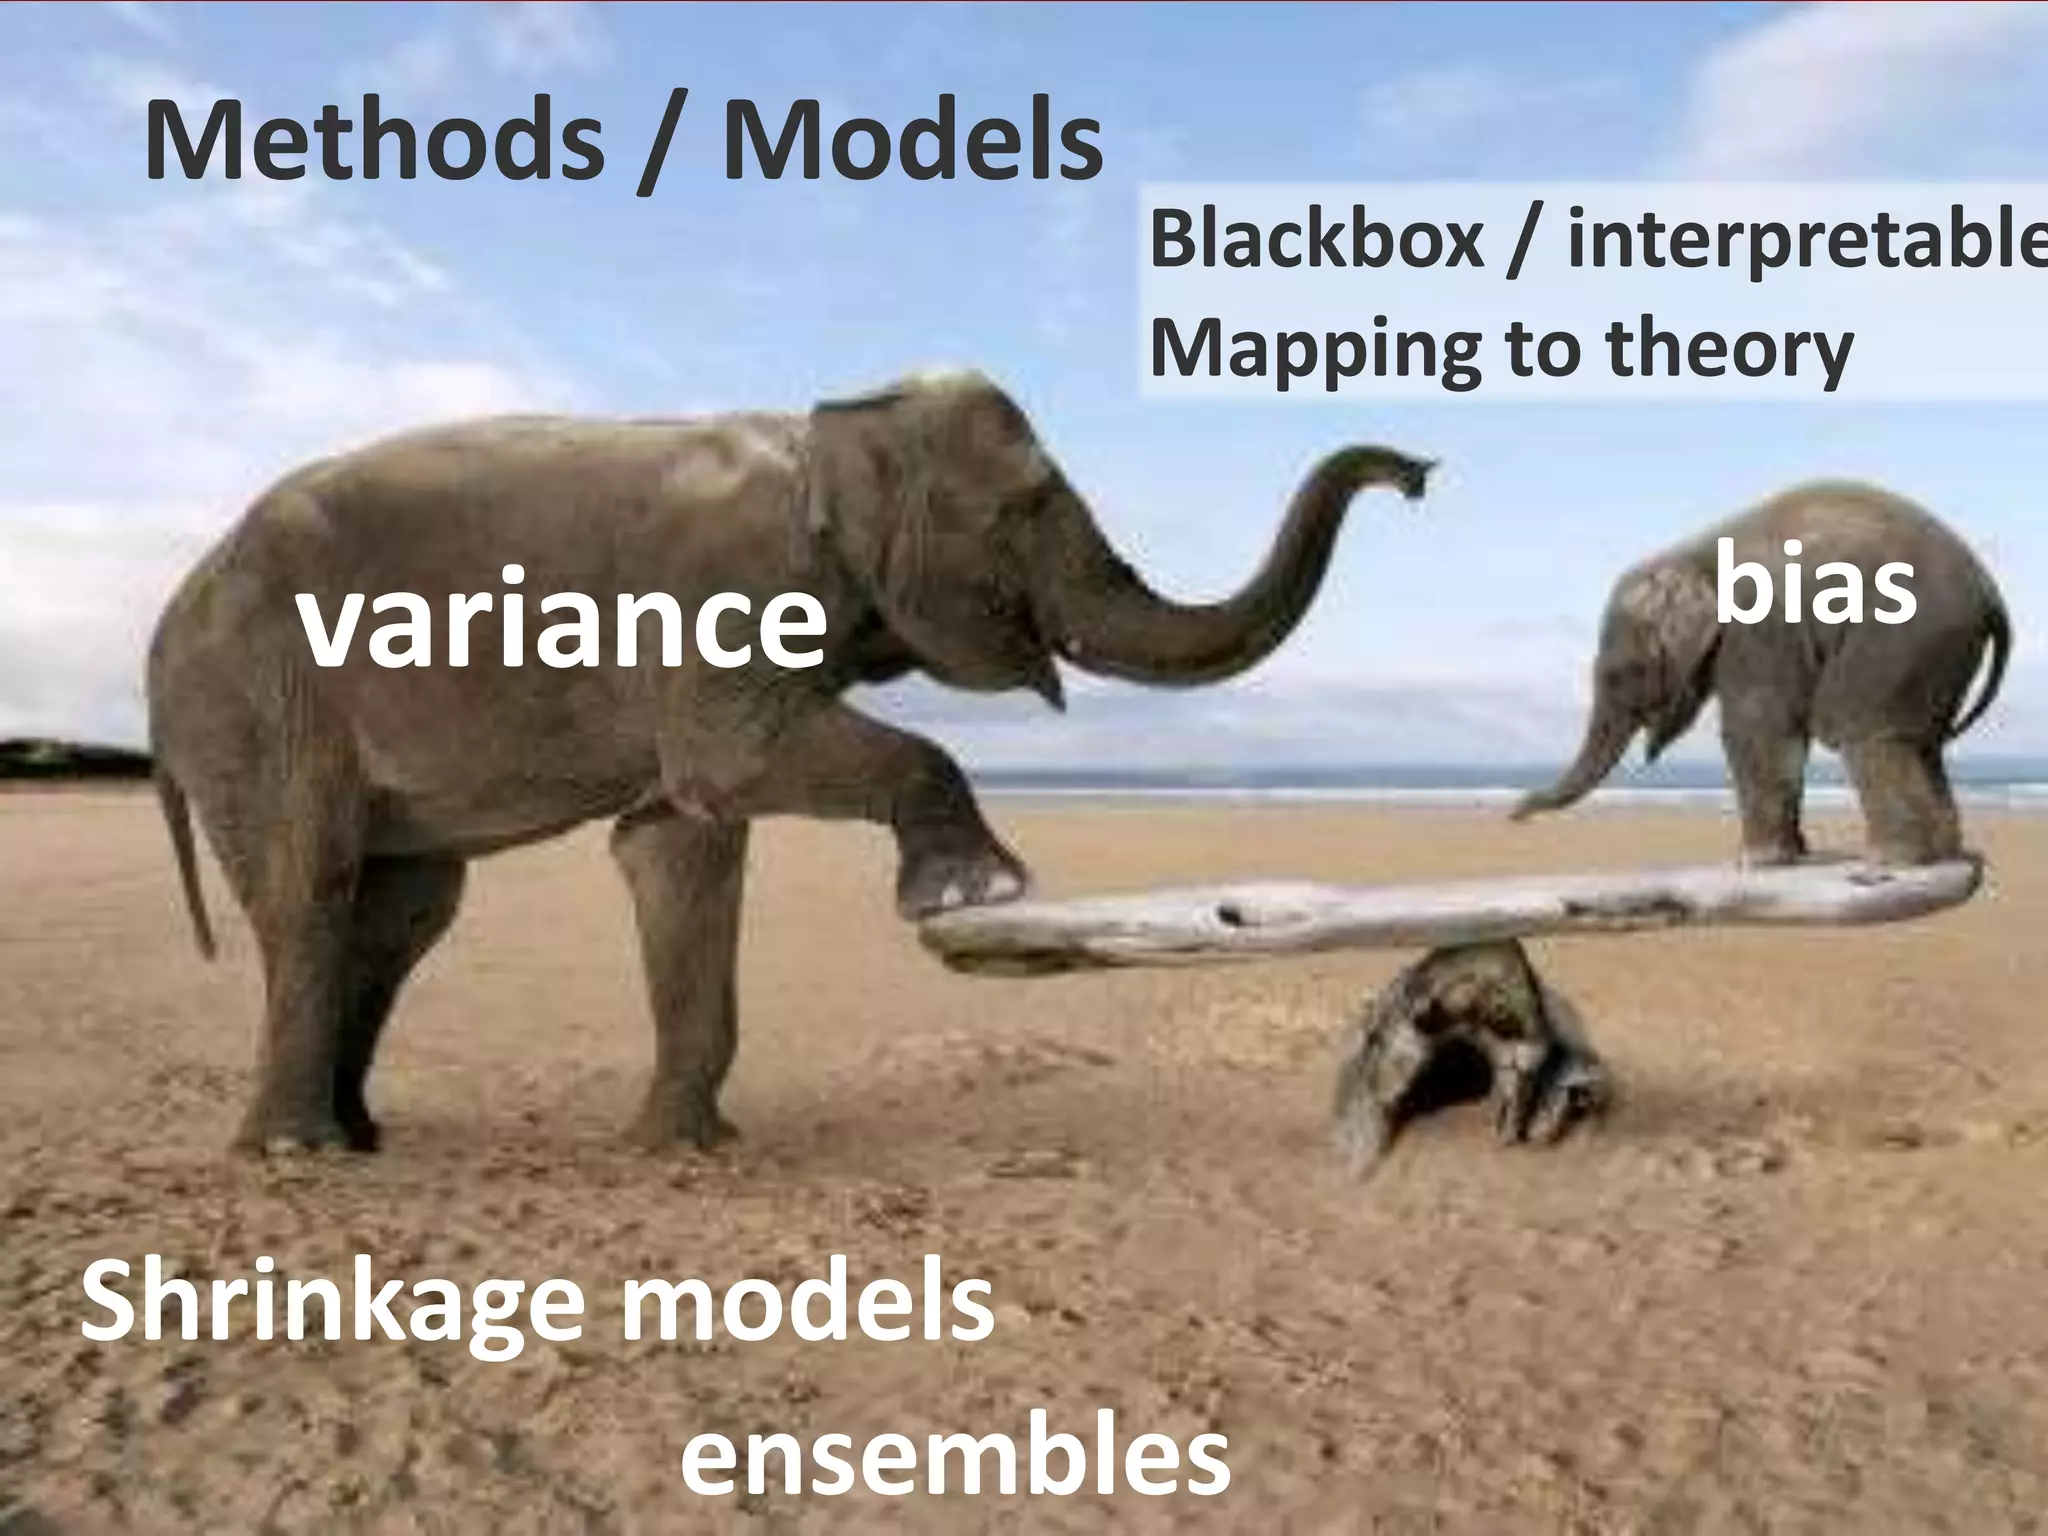
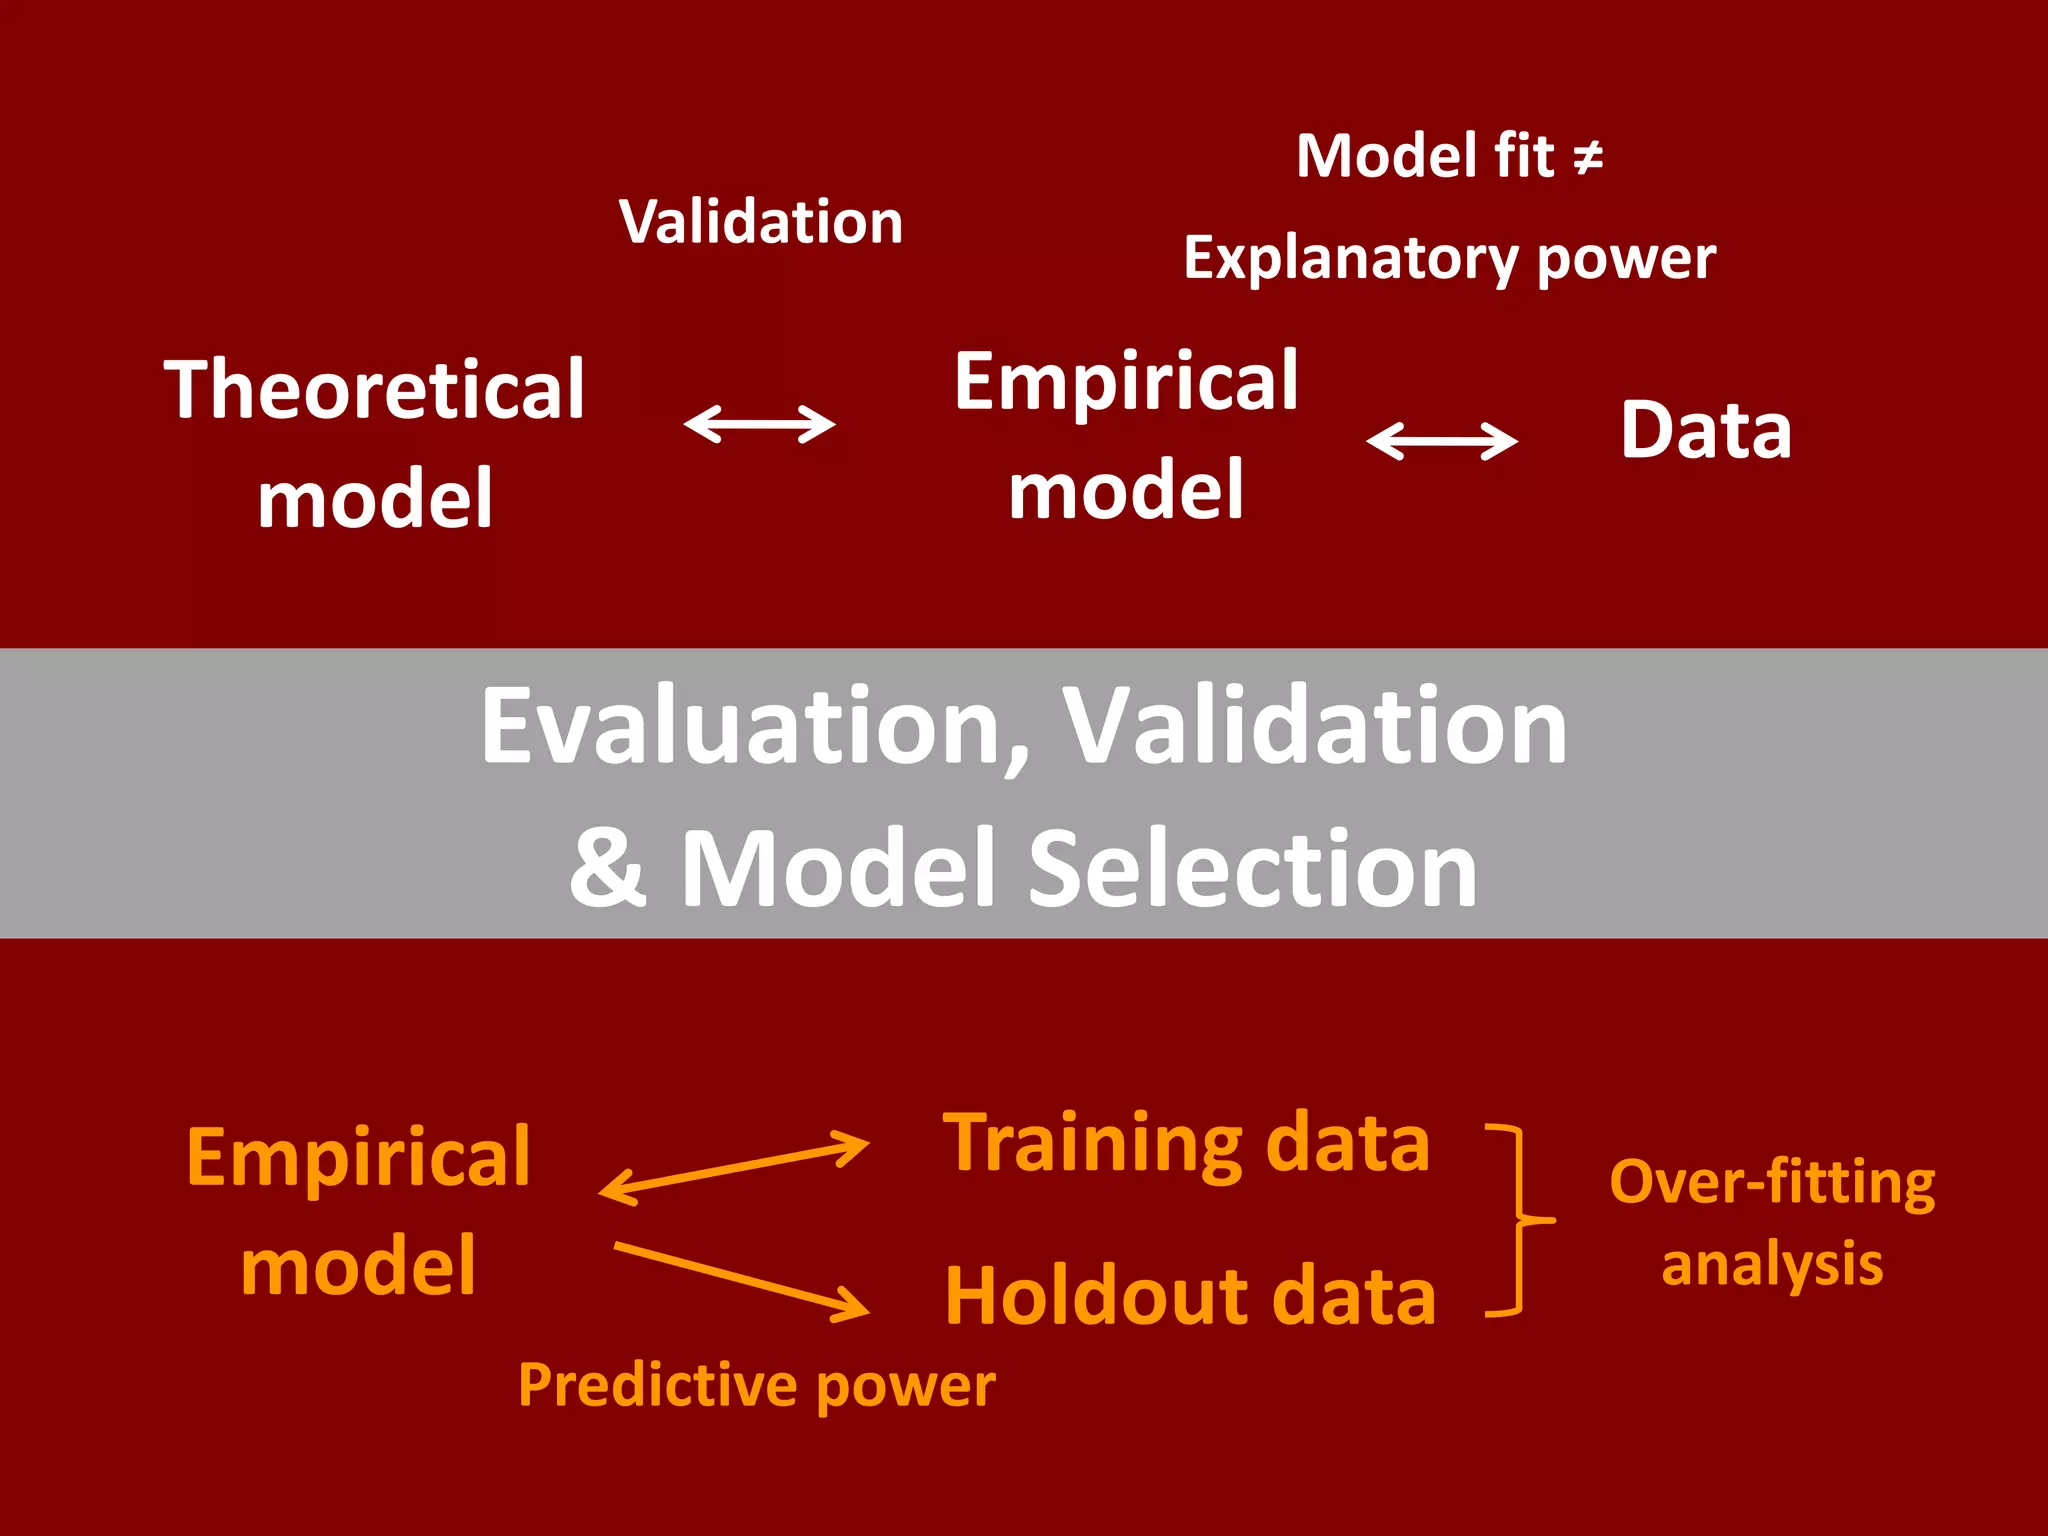
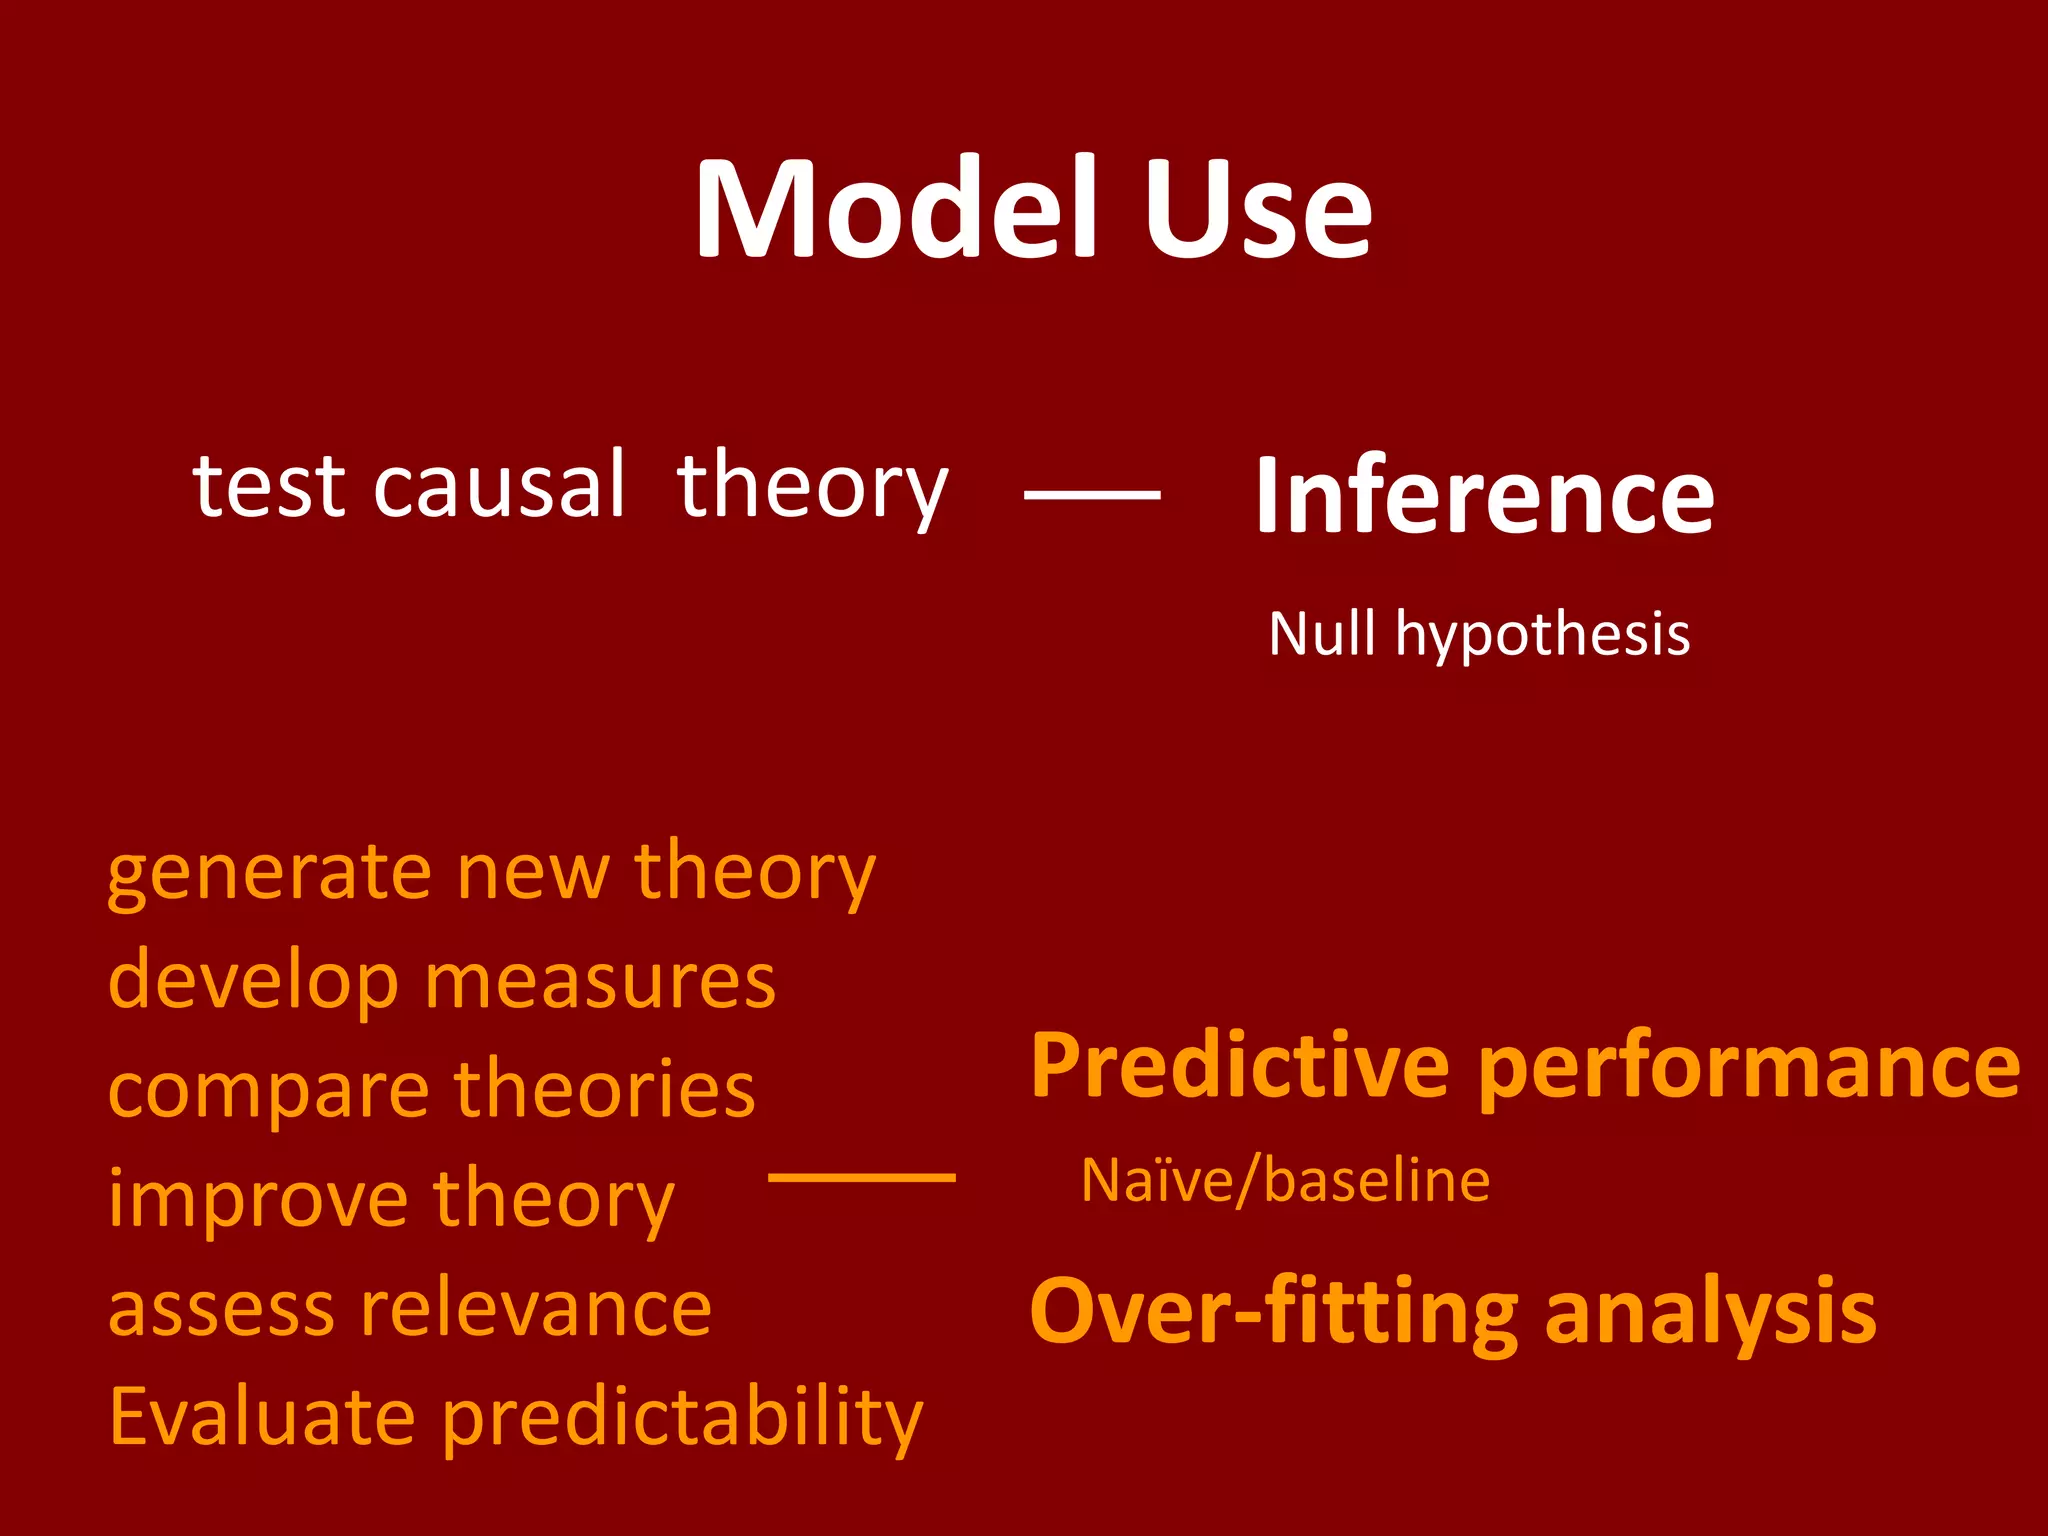
The document discusses the distinction between explanatory and predictive modeling in information systems research, emphasizing their different purposes and methodologies. It highlights that while explanatory models test causal theories, predictive models aim to forecast new observations with empirical methods. The author argues for the importance of understanding these differences to enhance scientific research and its applications in business analytics.


![[DSC Europe 25] Max Talanov - Non digital NNs.pptx](https://cdn.slidesharecdn.com/ss_thumbnails/wif8tr3gtua74qvtopke-non-digital-nns-251205090438-26b0eea6-thumbnail.jpg?width=640&height=640&fit=bounds)


