Download to read offline

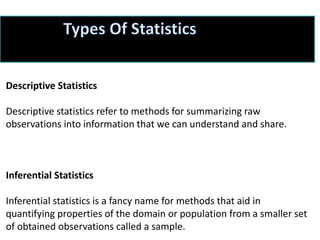

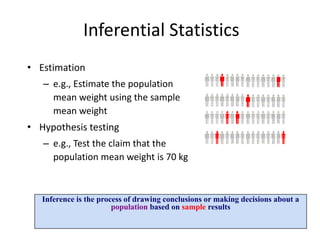

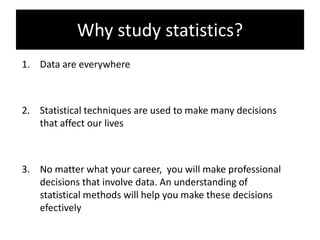
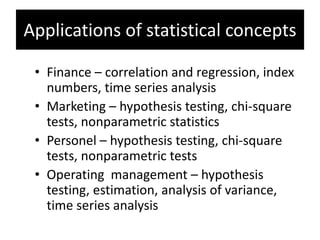
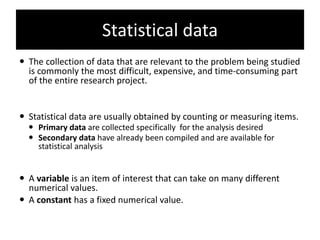


The document discusses descriptive and inferential statistics, highlighting their importance in summarizing data and drawing conclusions about populations from samples. It lists applications of statistical concepts across various fields such as finance, marketing, and management. Additionally, it touches on the challenges of collecting statistical data and defines primary and secondary data, along with variables and constants.


