Downloaded 33 times

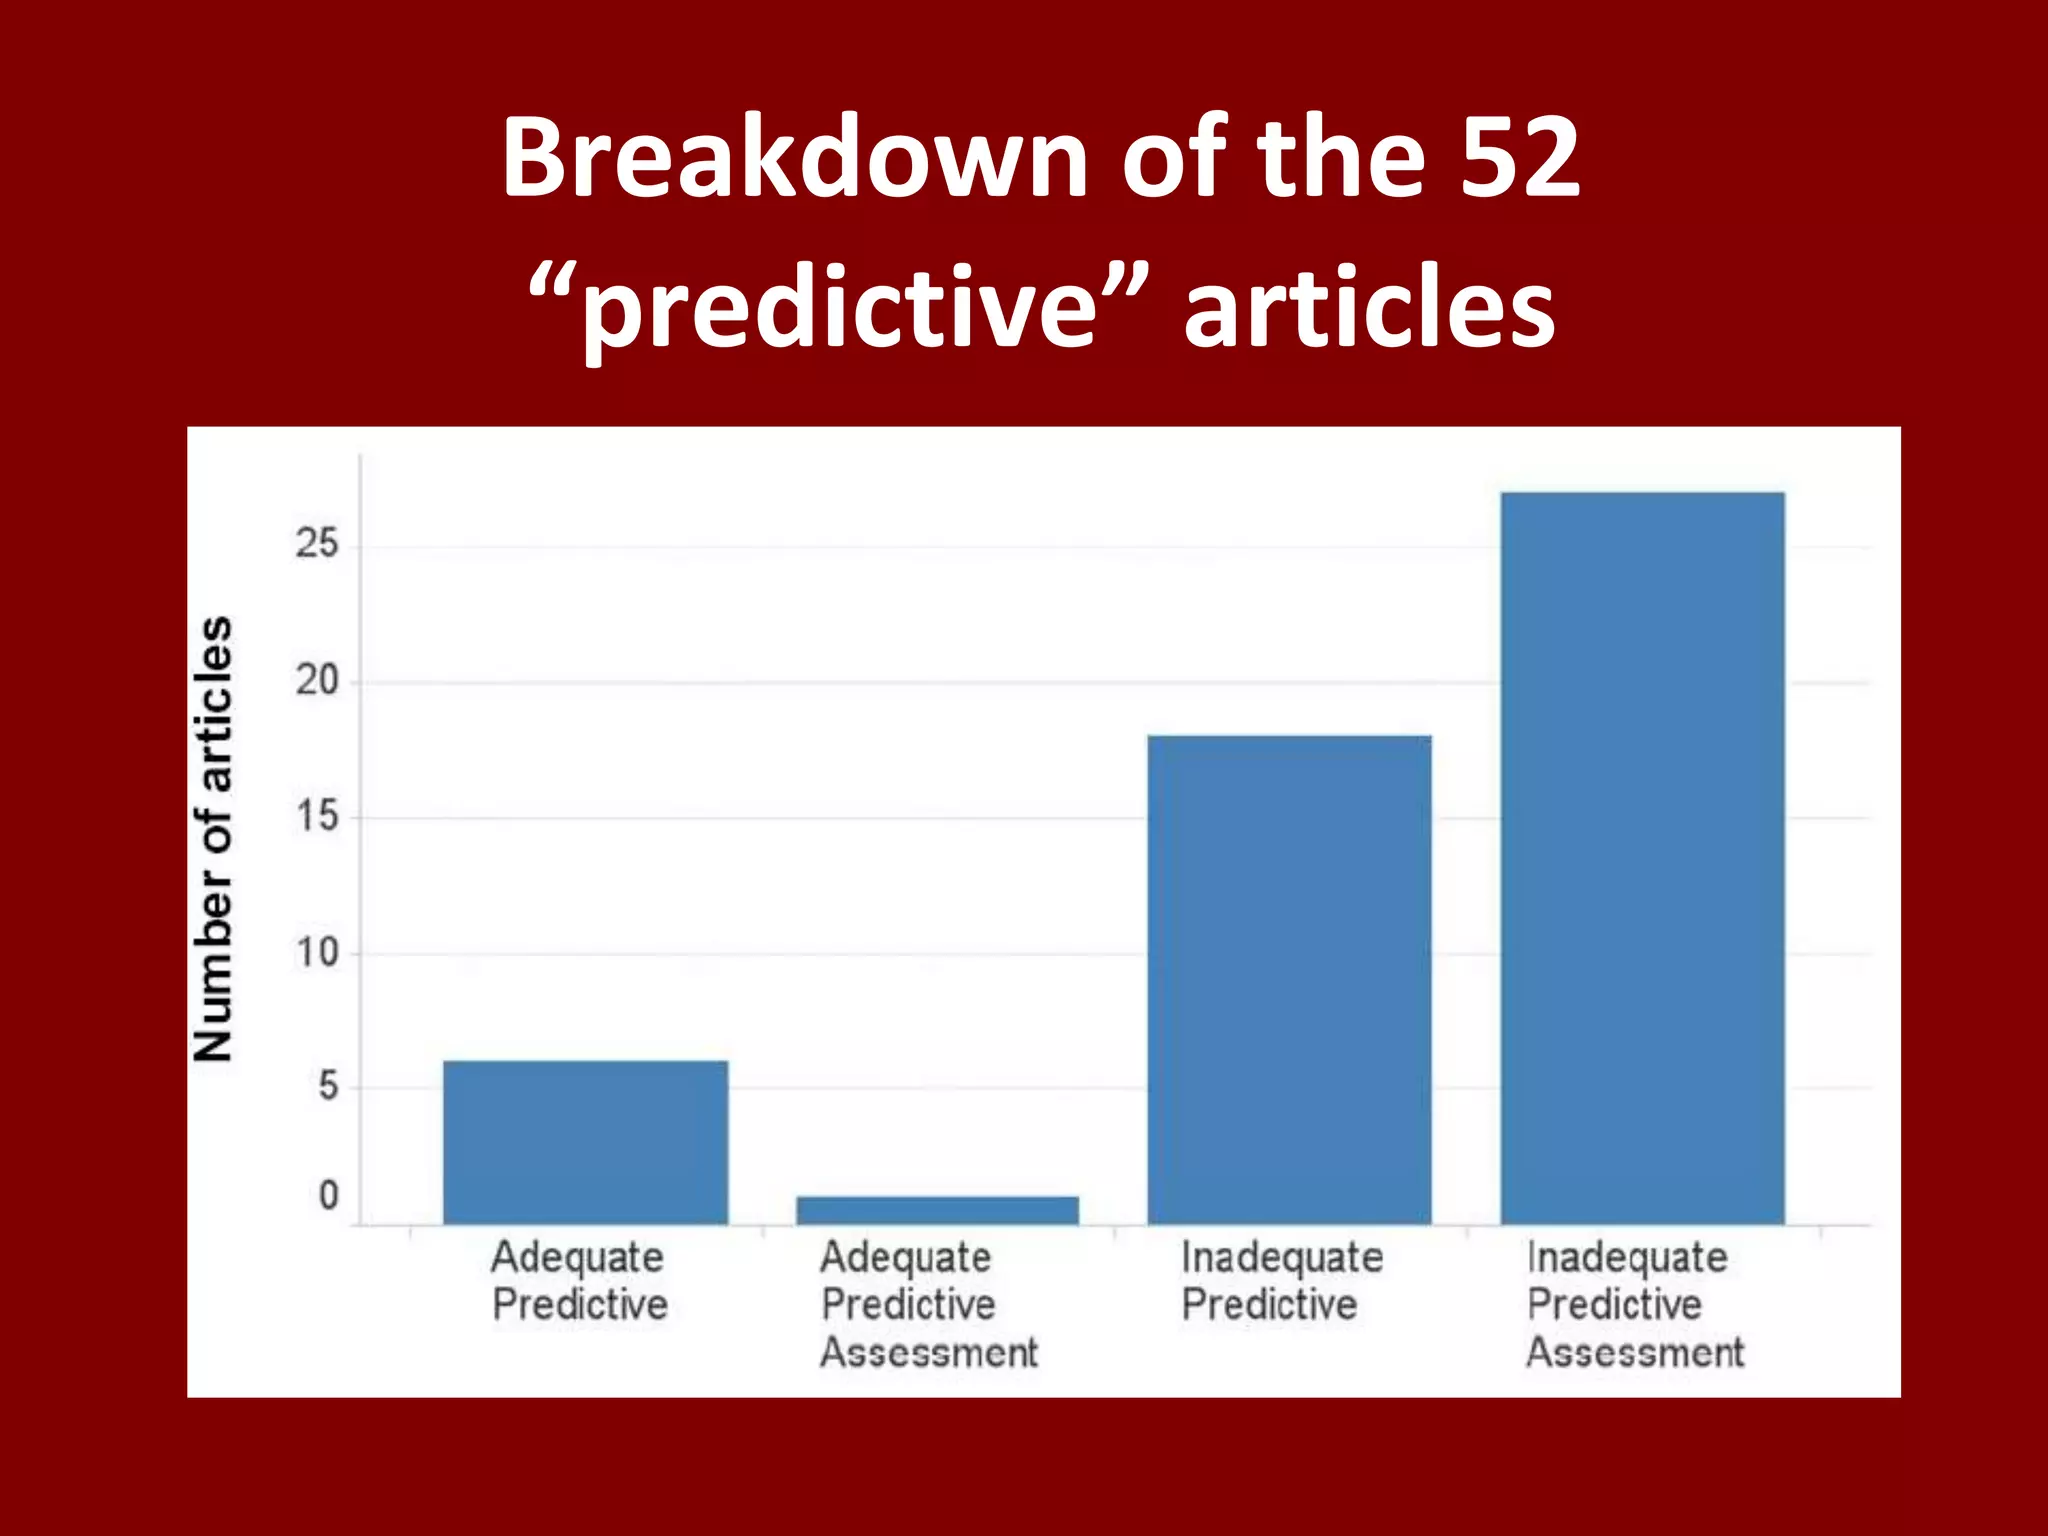
![1072 articles of which52 empirical with predictive claims“Examples of [predictive] theory in IS do not come readily to hand, suggesting that they are not common”Gregor, MISQ 2006](https://image.slidesharecdn.com/toexplainortopredictgeorgetownoct09-091030194041-phpapp02/75/To-Explain-Or-To-Predict-18-2048.jpg)


![Three Current ProblemsPrediction underappreciatedDistinction blurredInappropriate modeling/assessment“While the value of scientific prediction… is beyond question… the inexact sciences [do not] have…the use of predictive expertise well in hand.”Helmer & Rescher, 1959](https://image.slidesharecdn.com/toexplainortopredictgeorgetownoct09-091030194041-phpapp02/75/To-Explain-Or-To-Predict-49-2048.jpg)


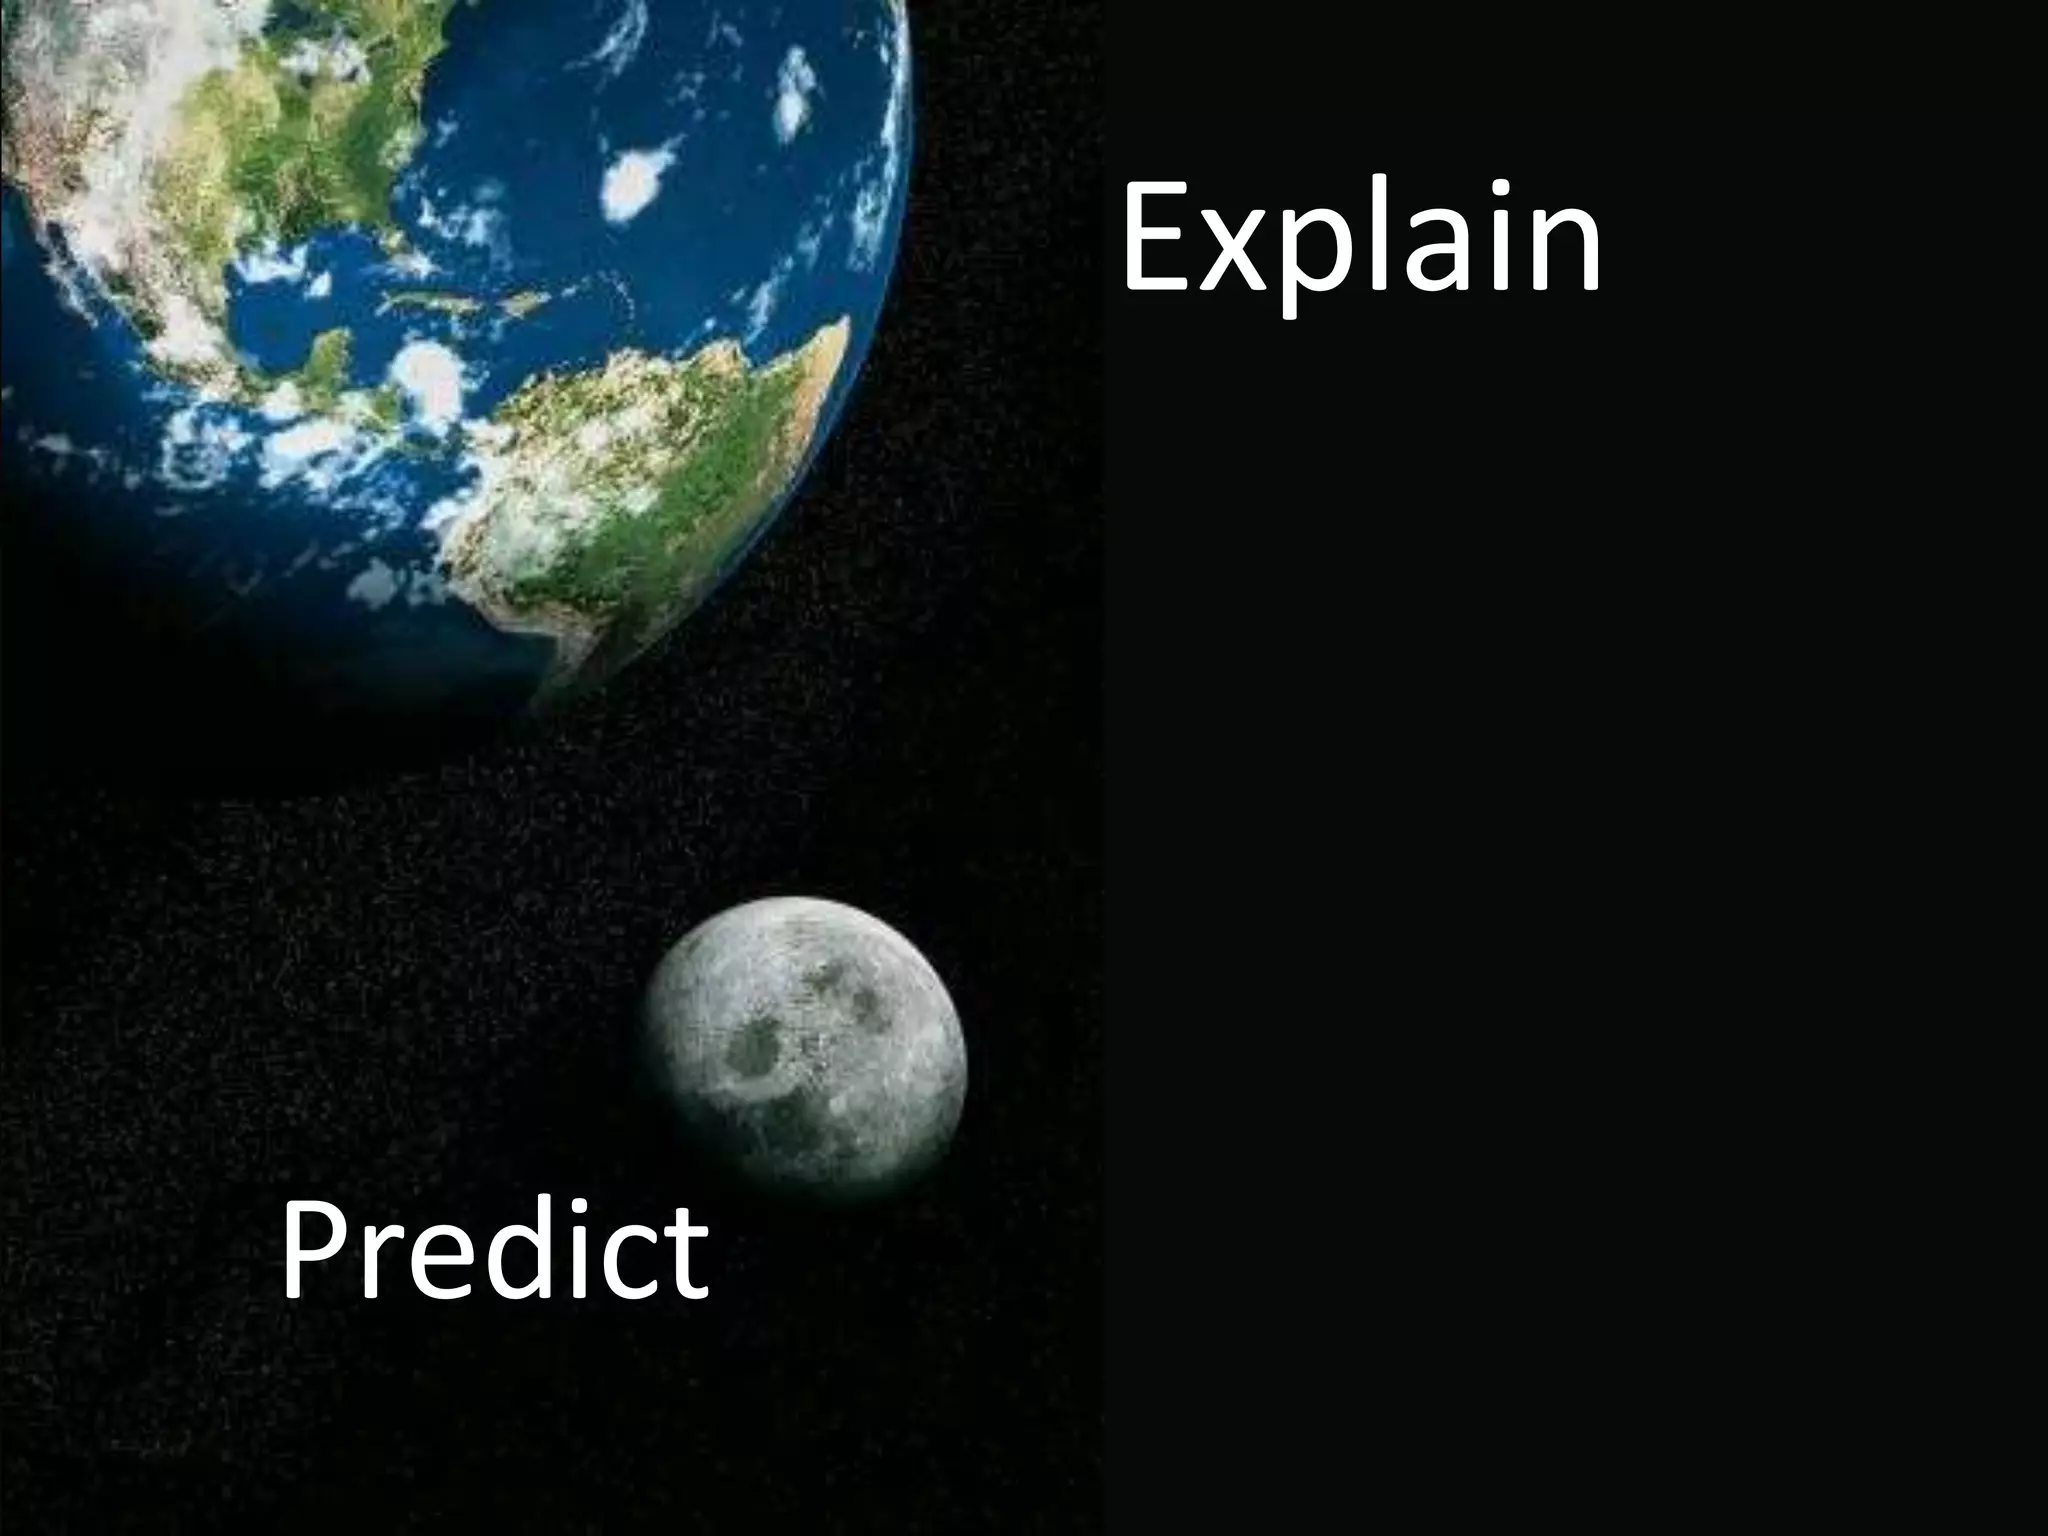
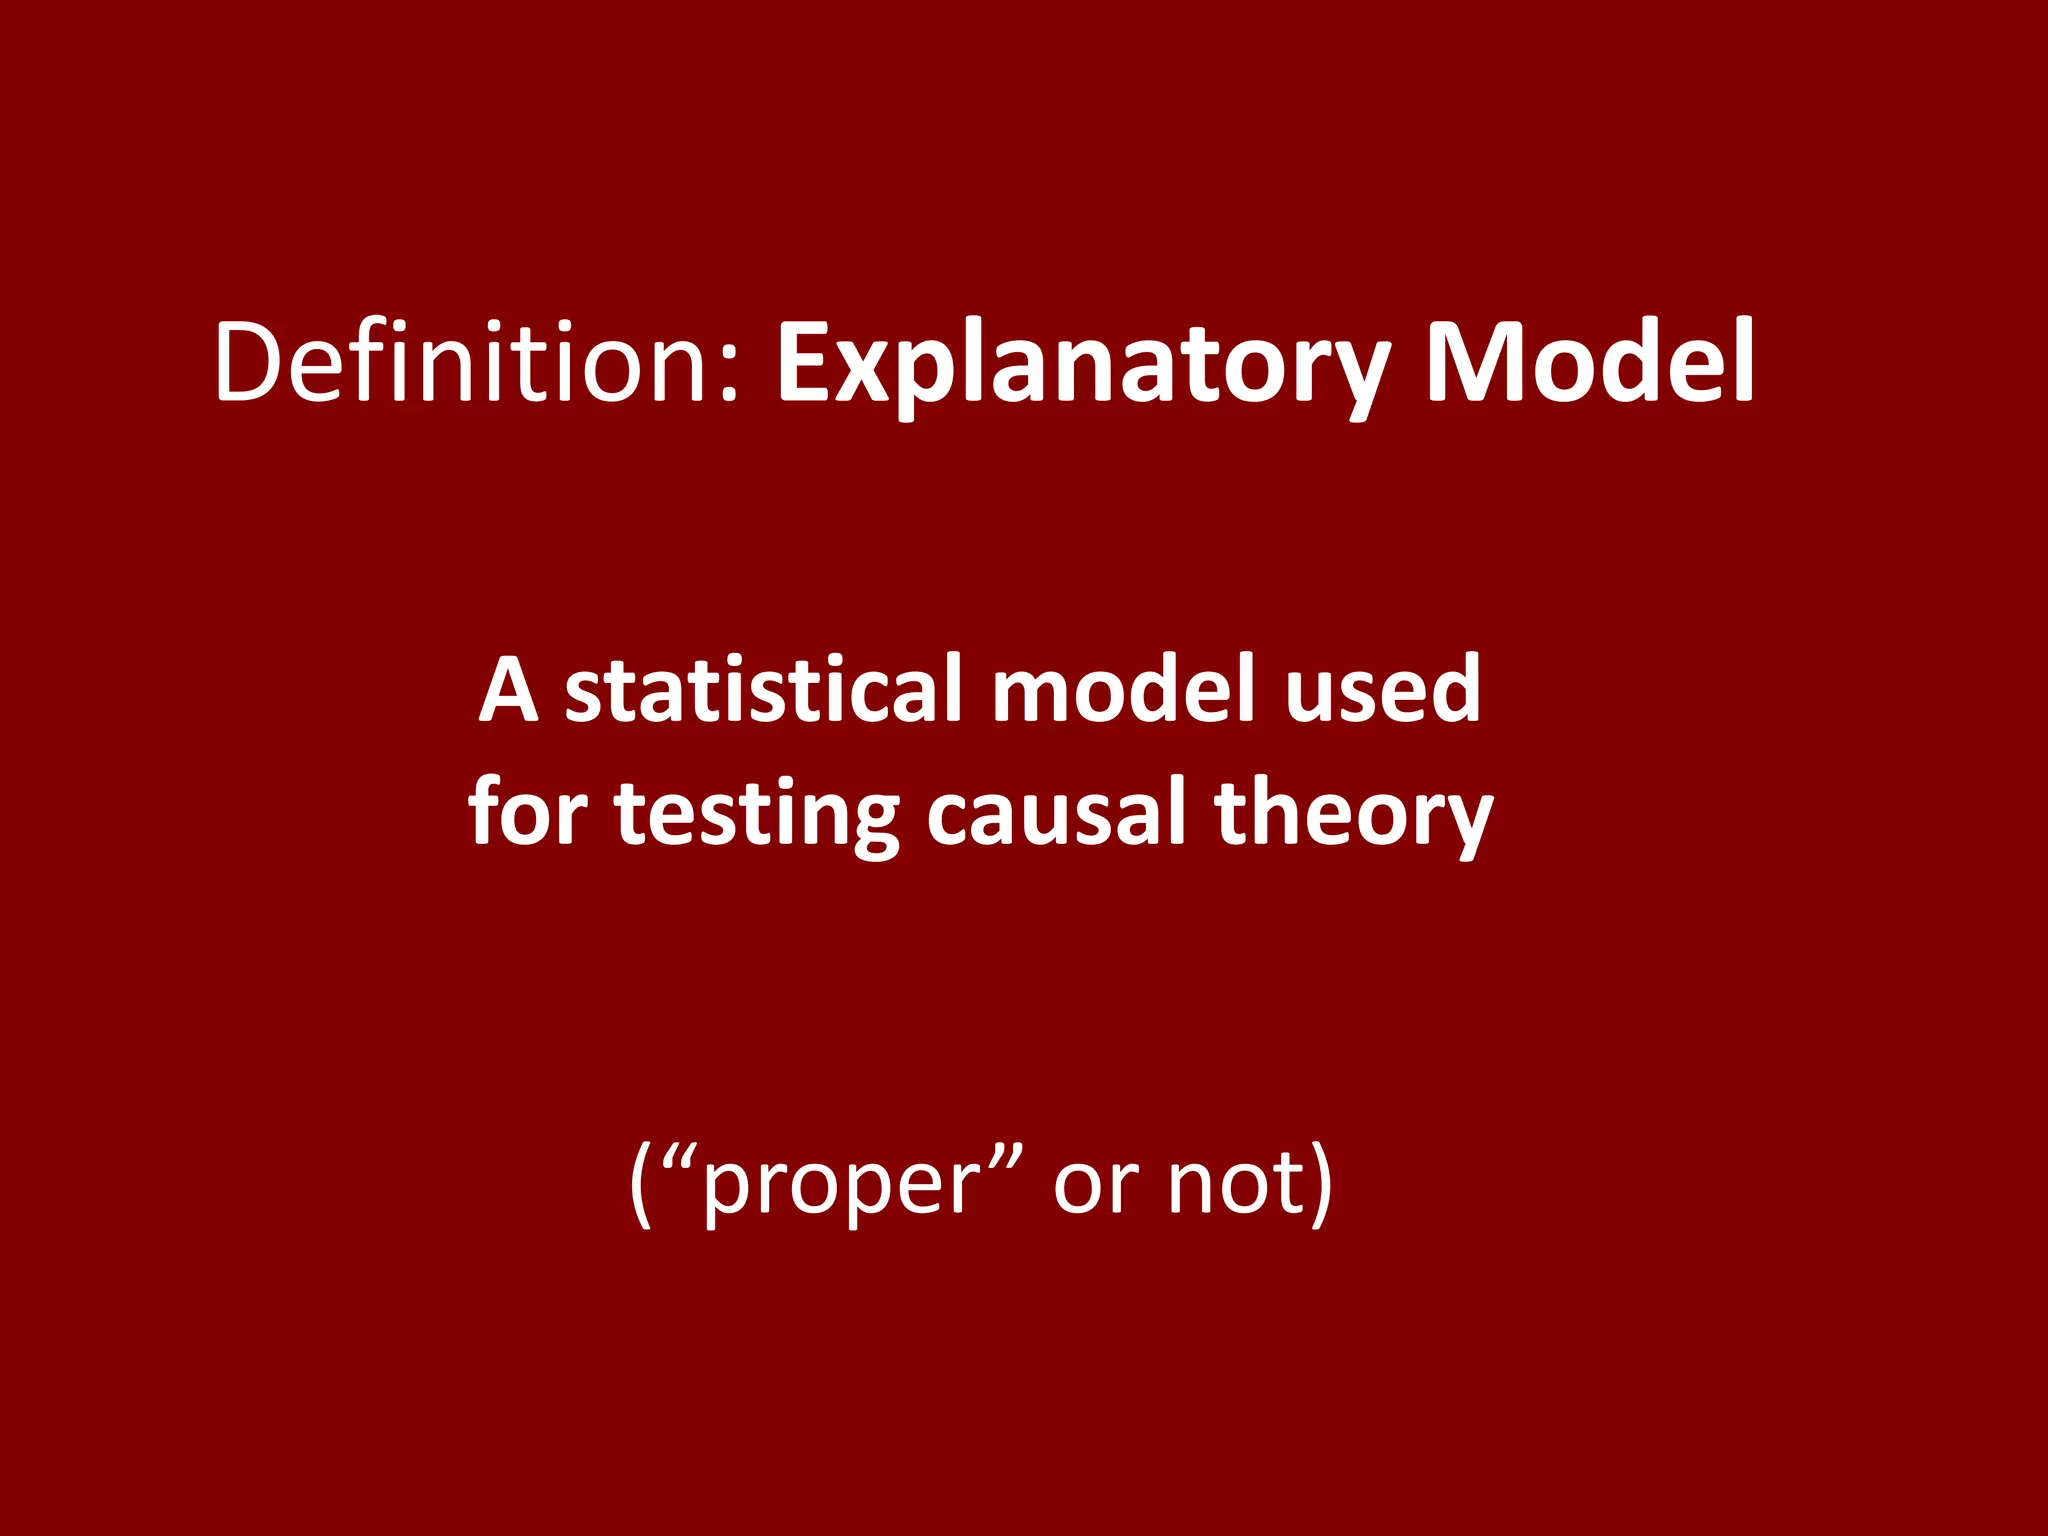
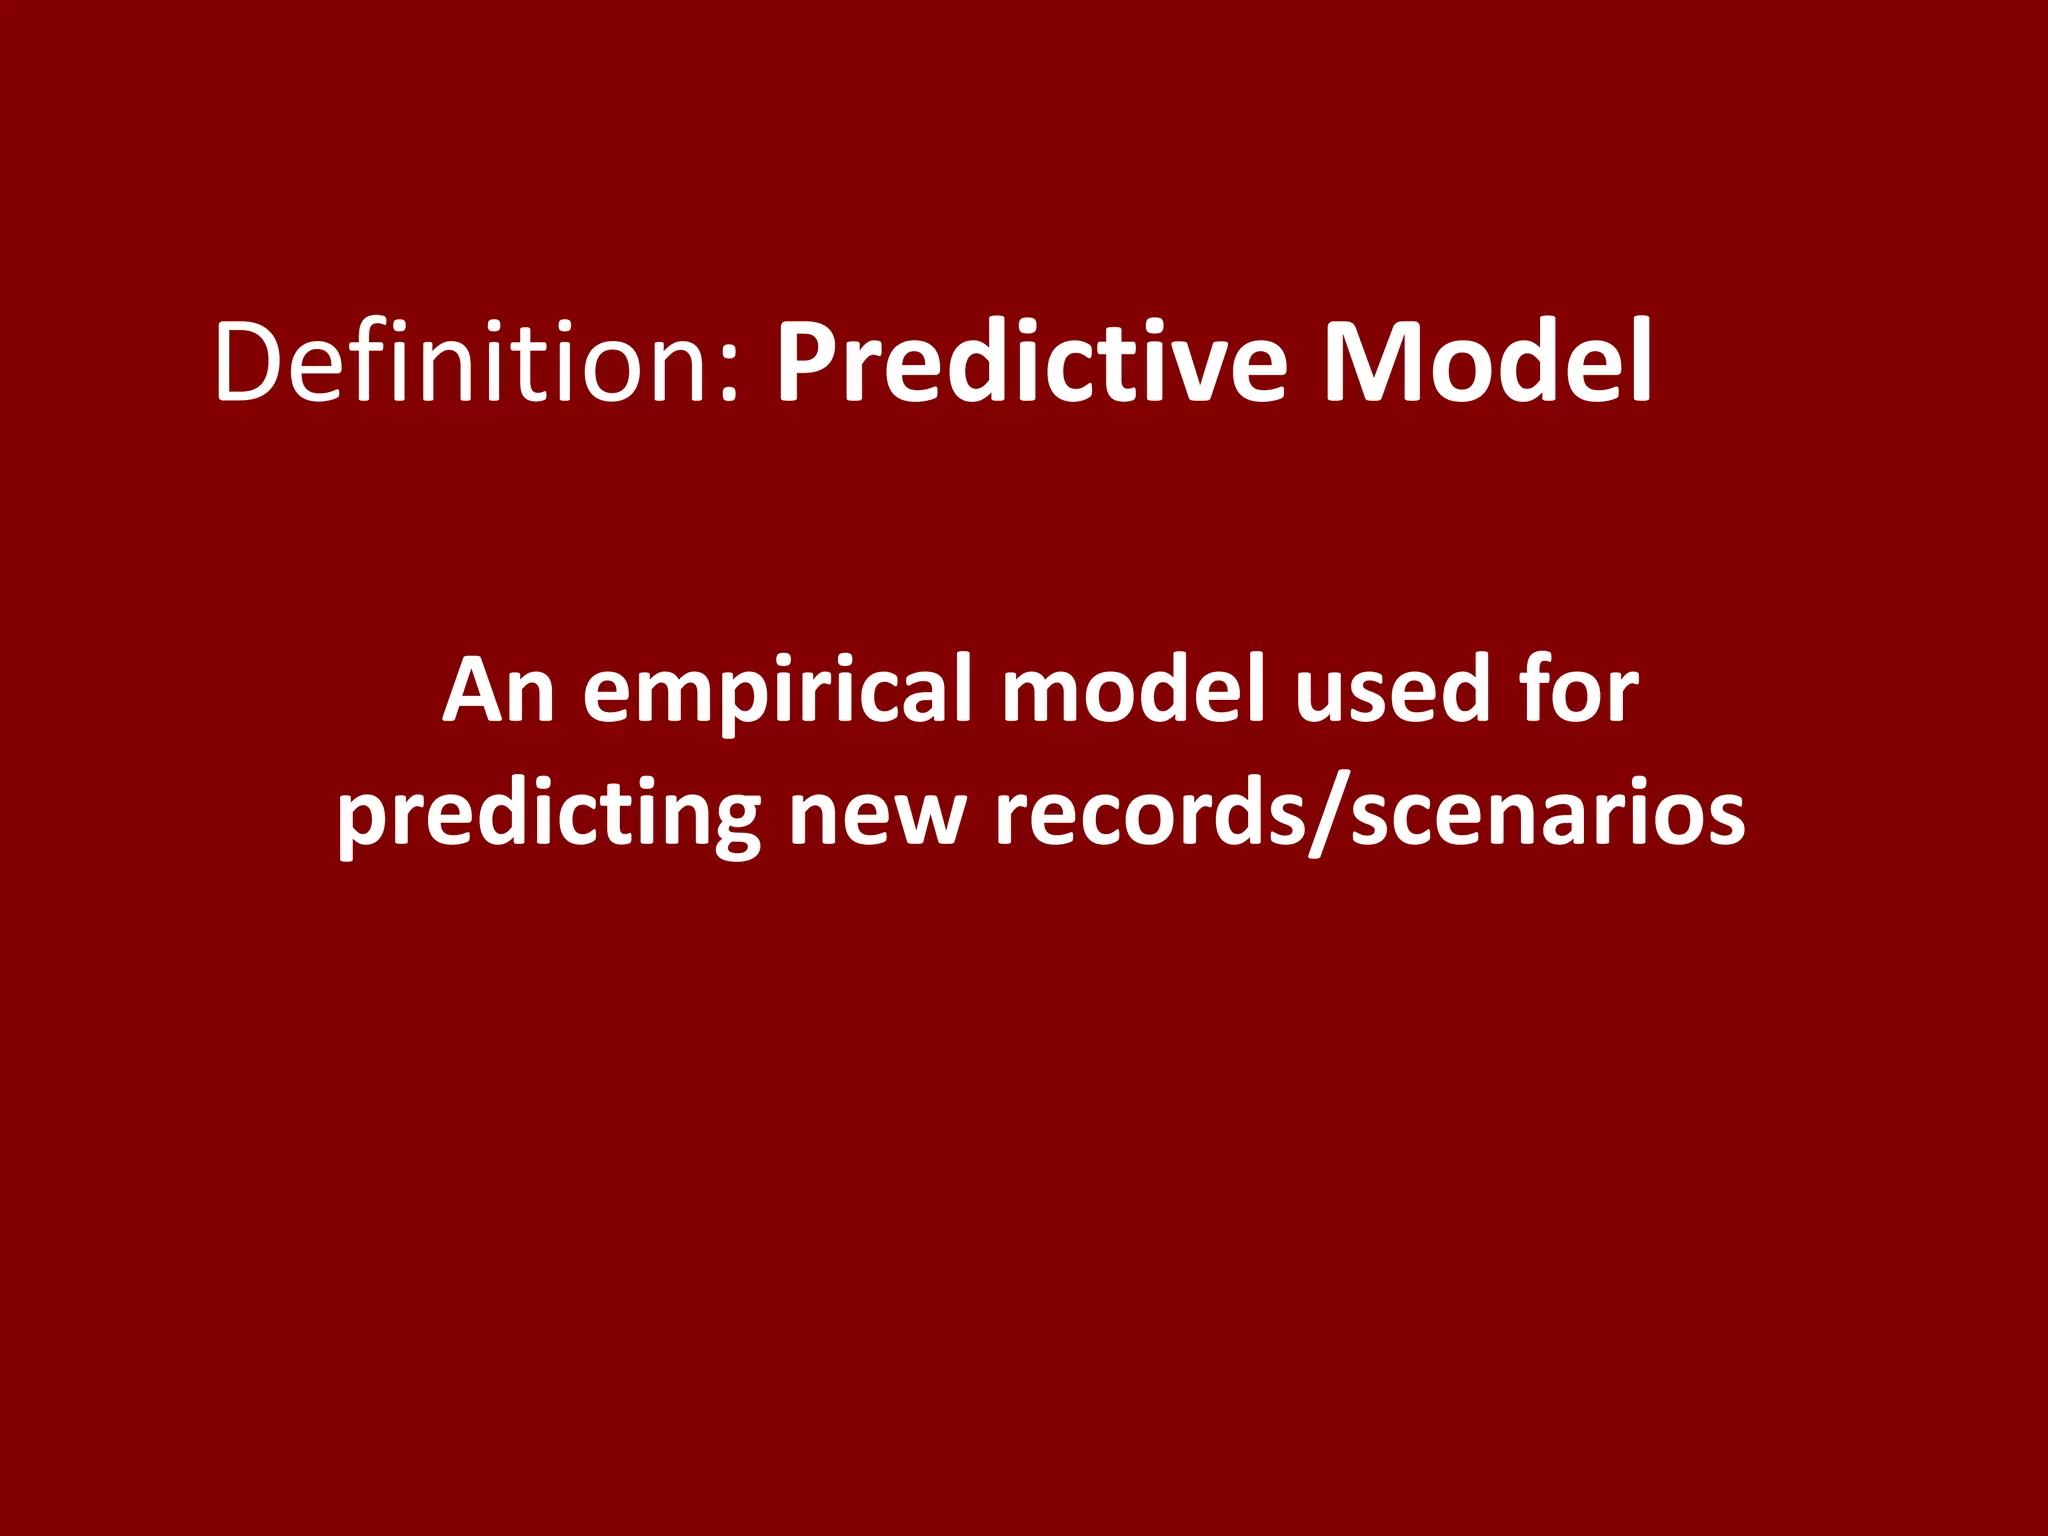
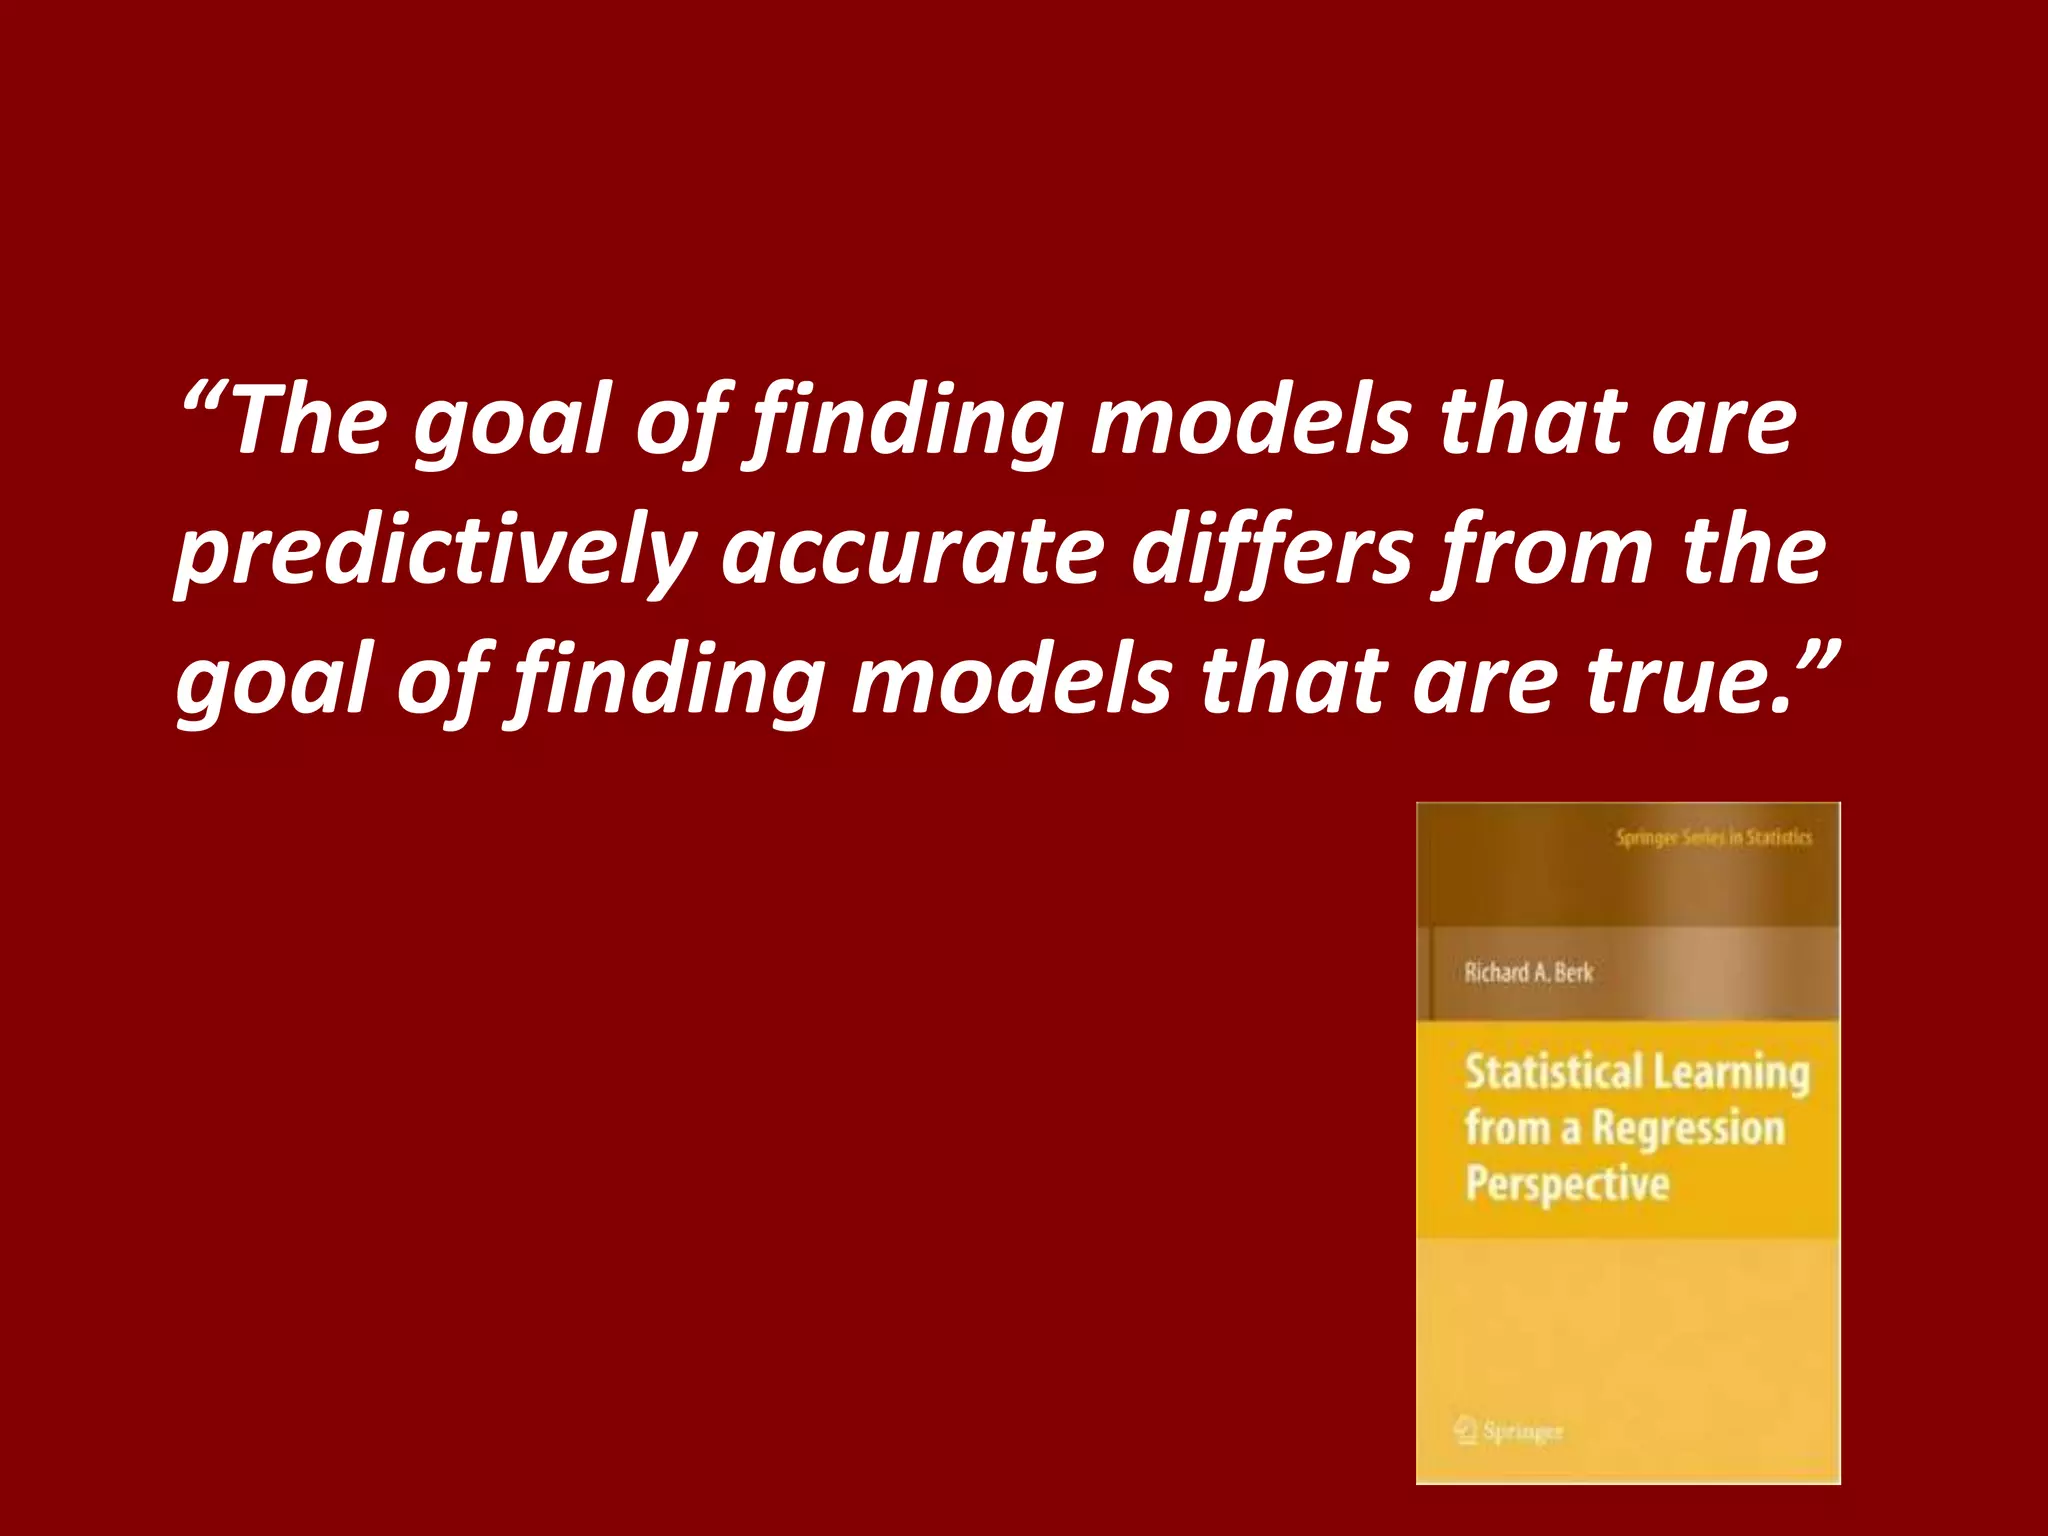
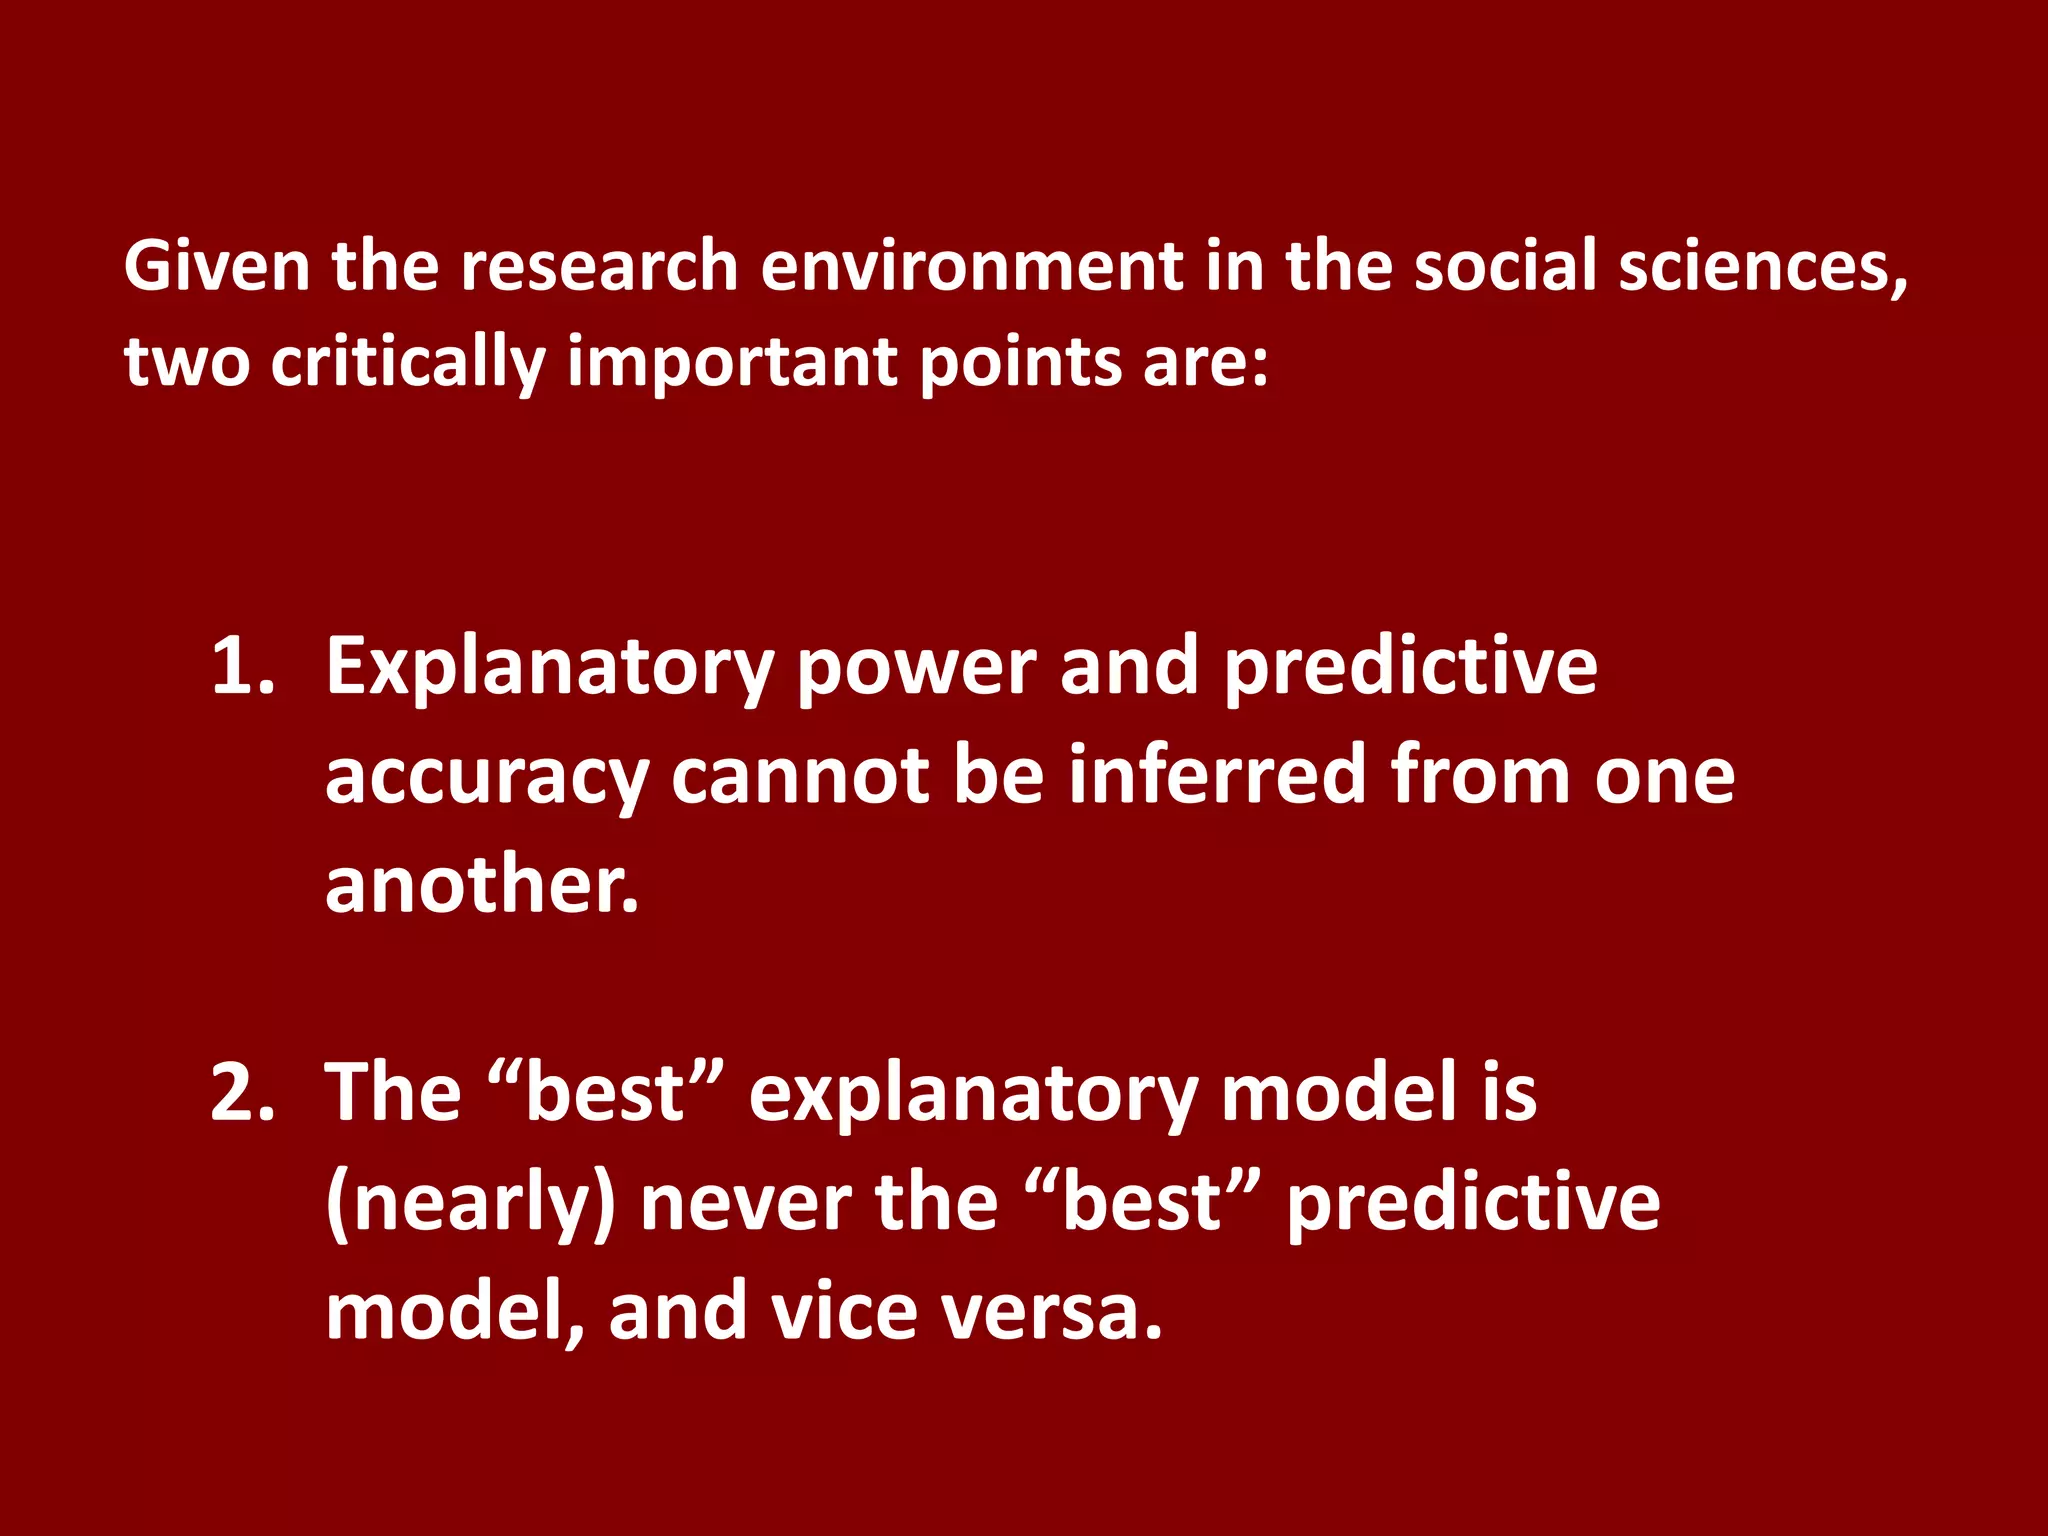
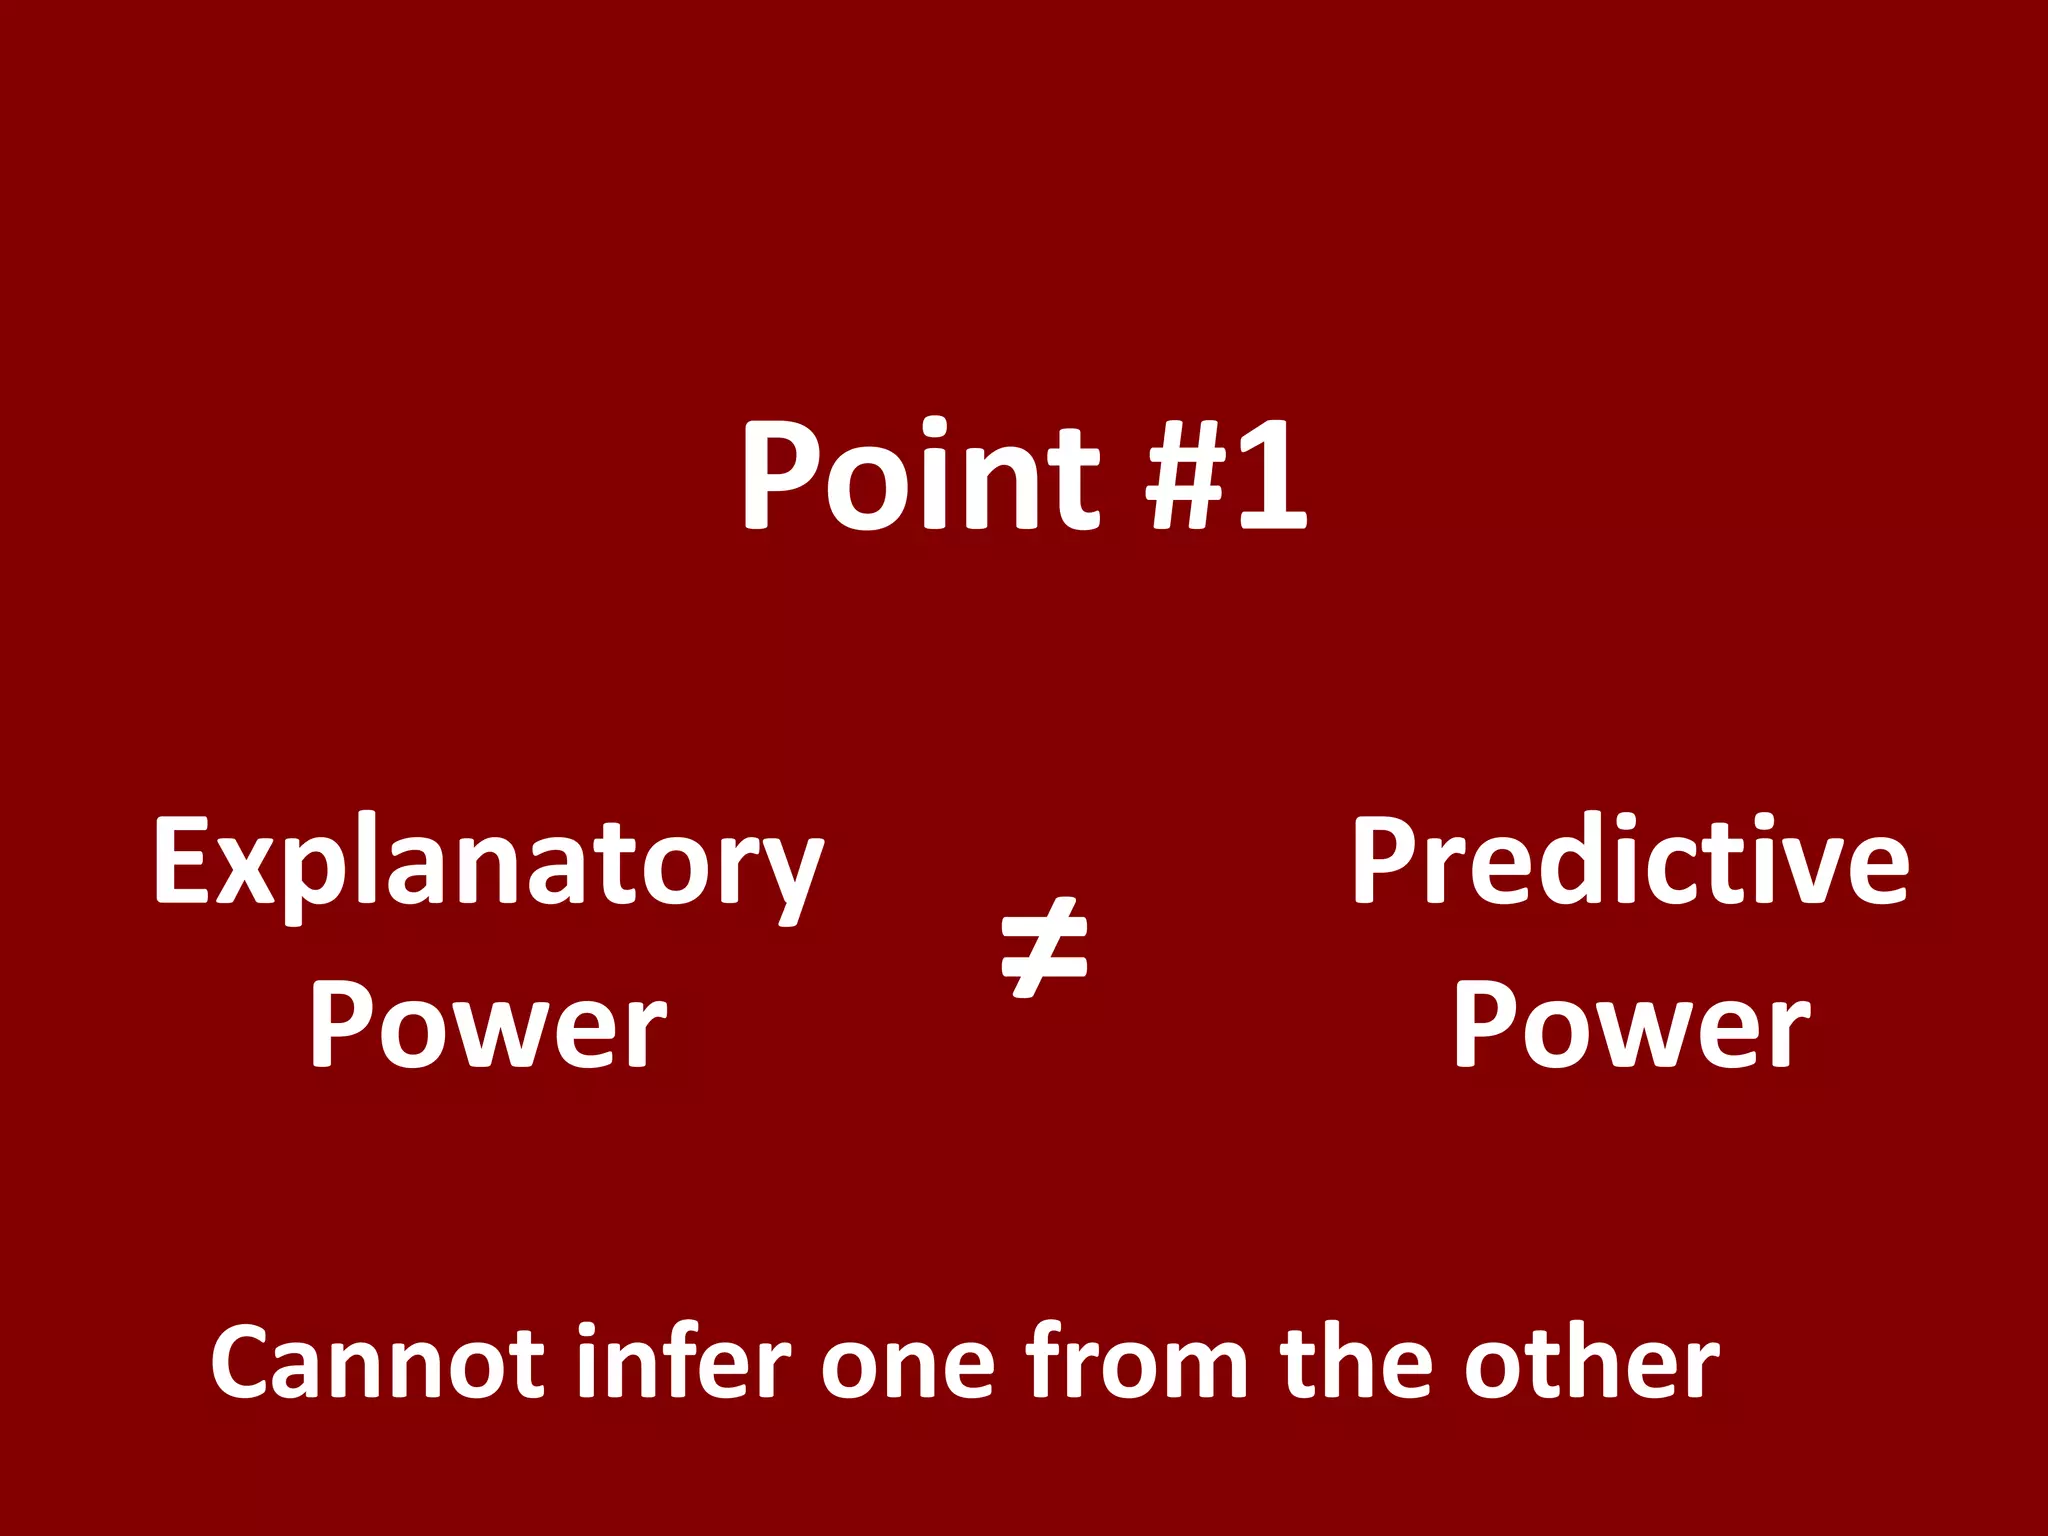
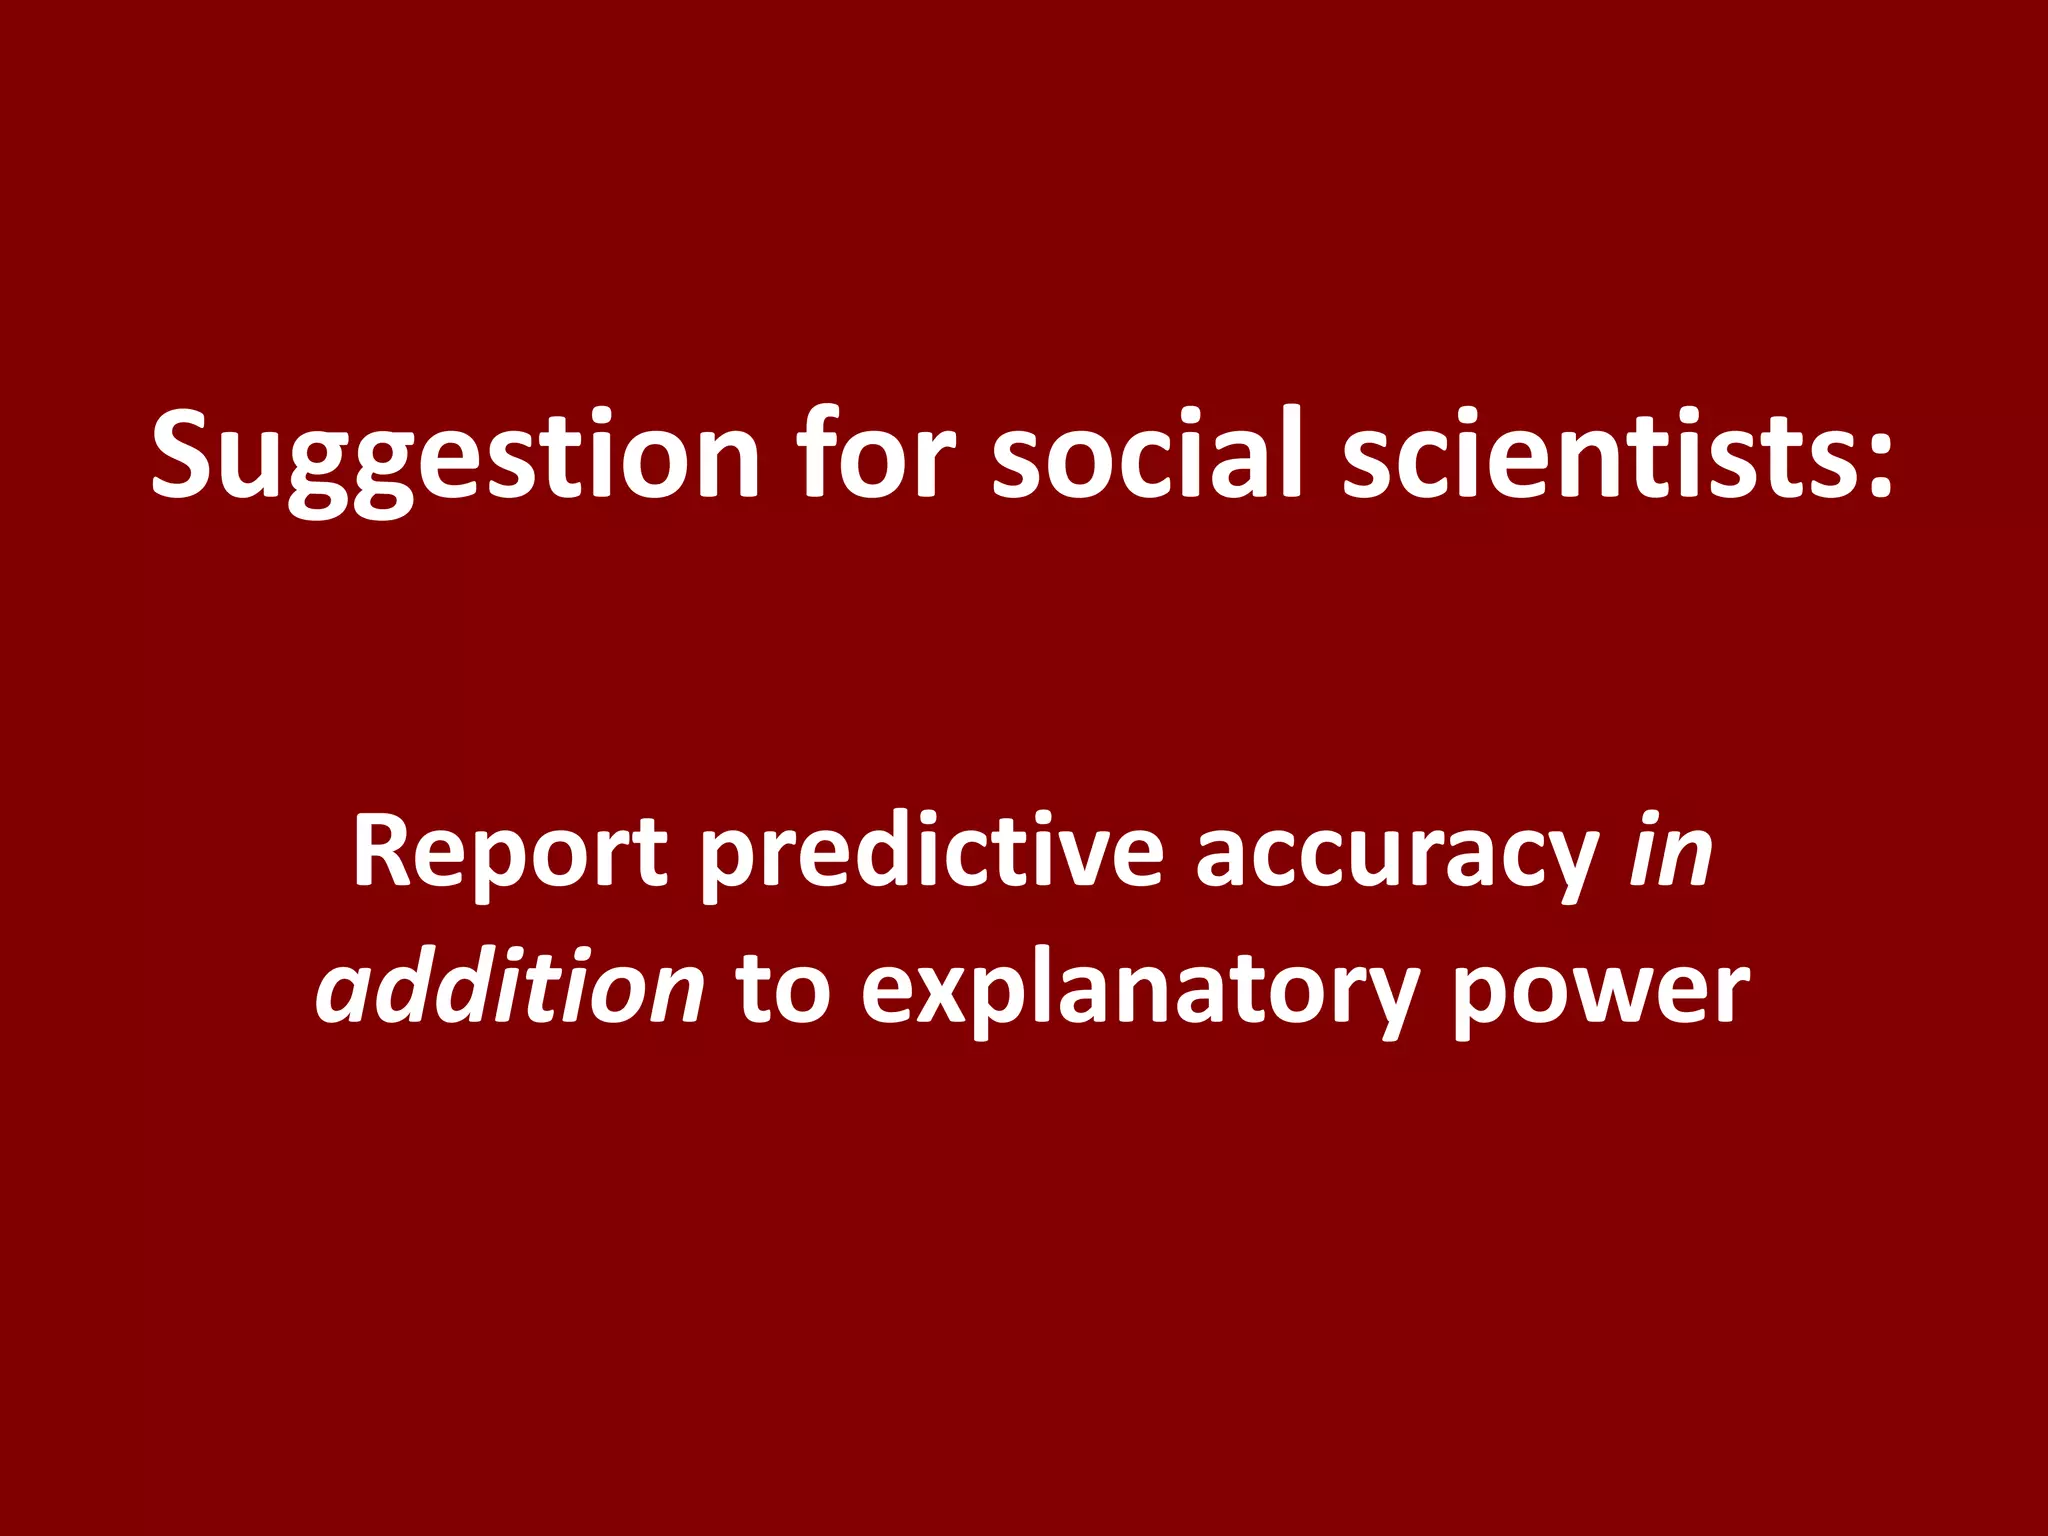
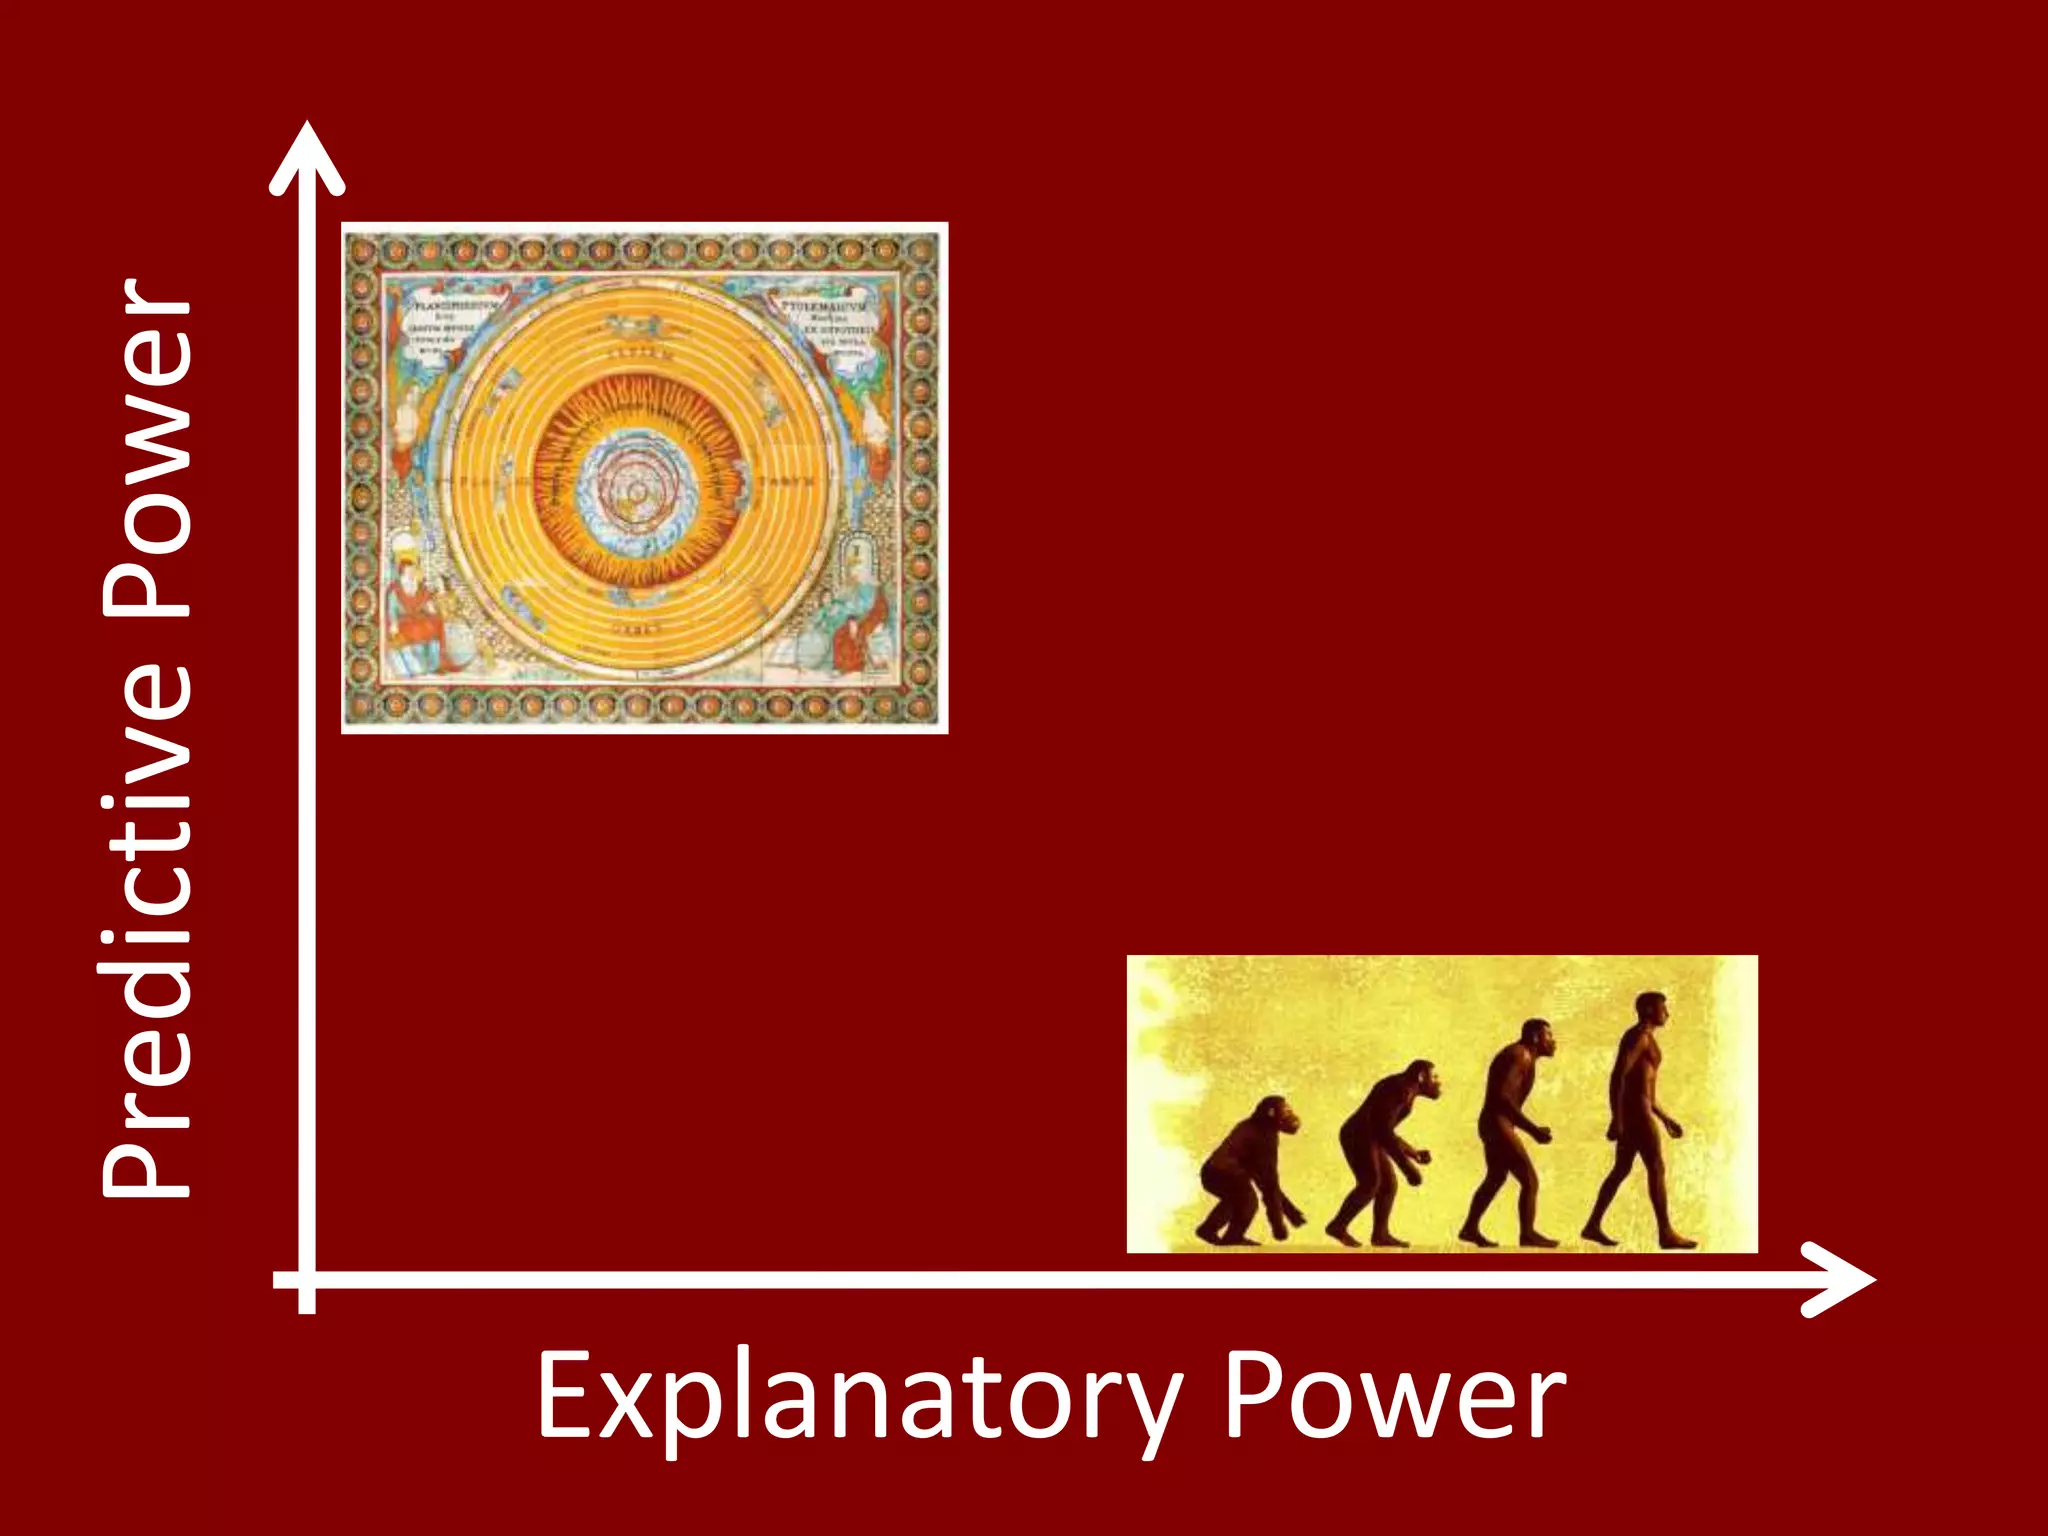
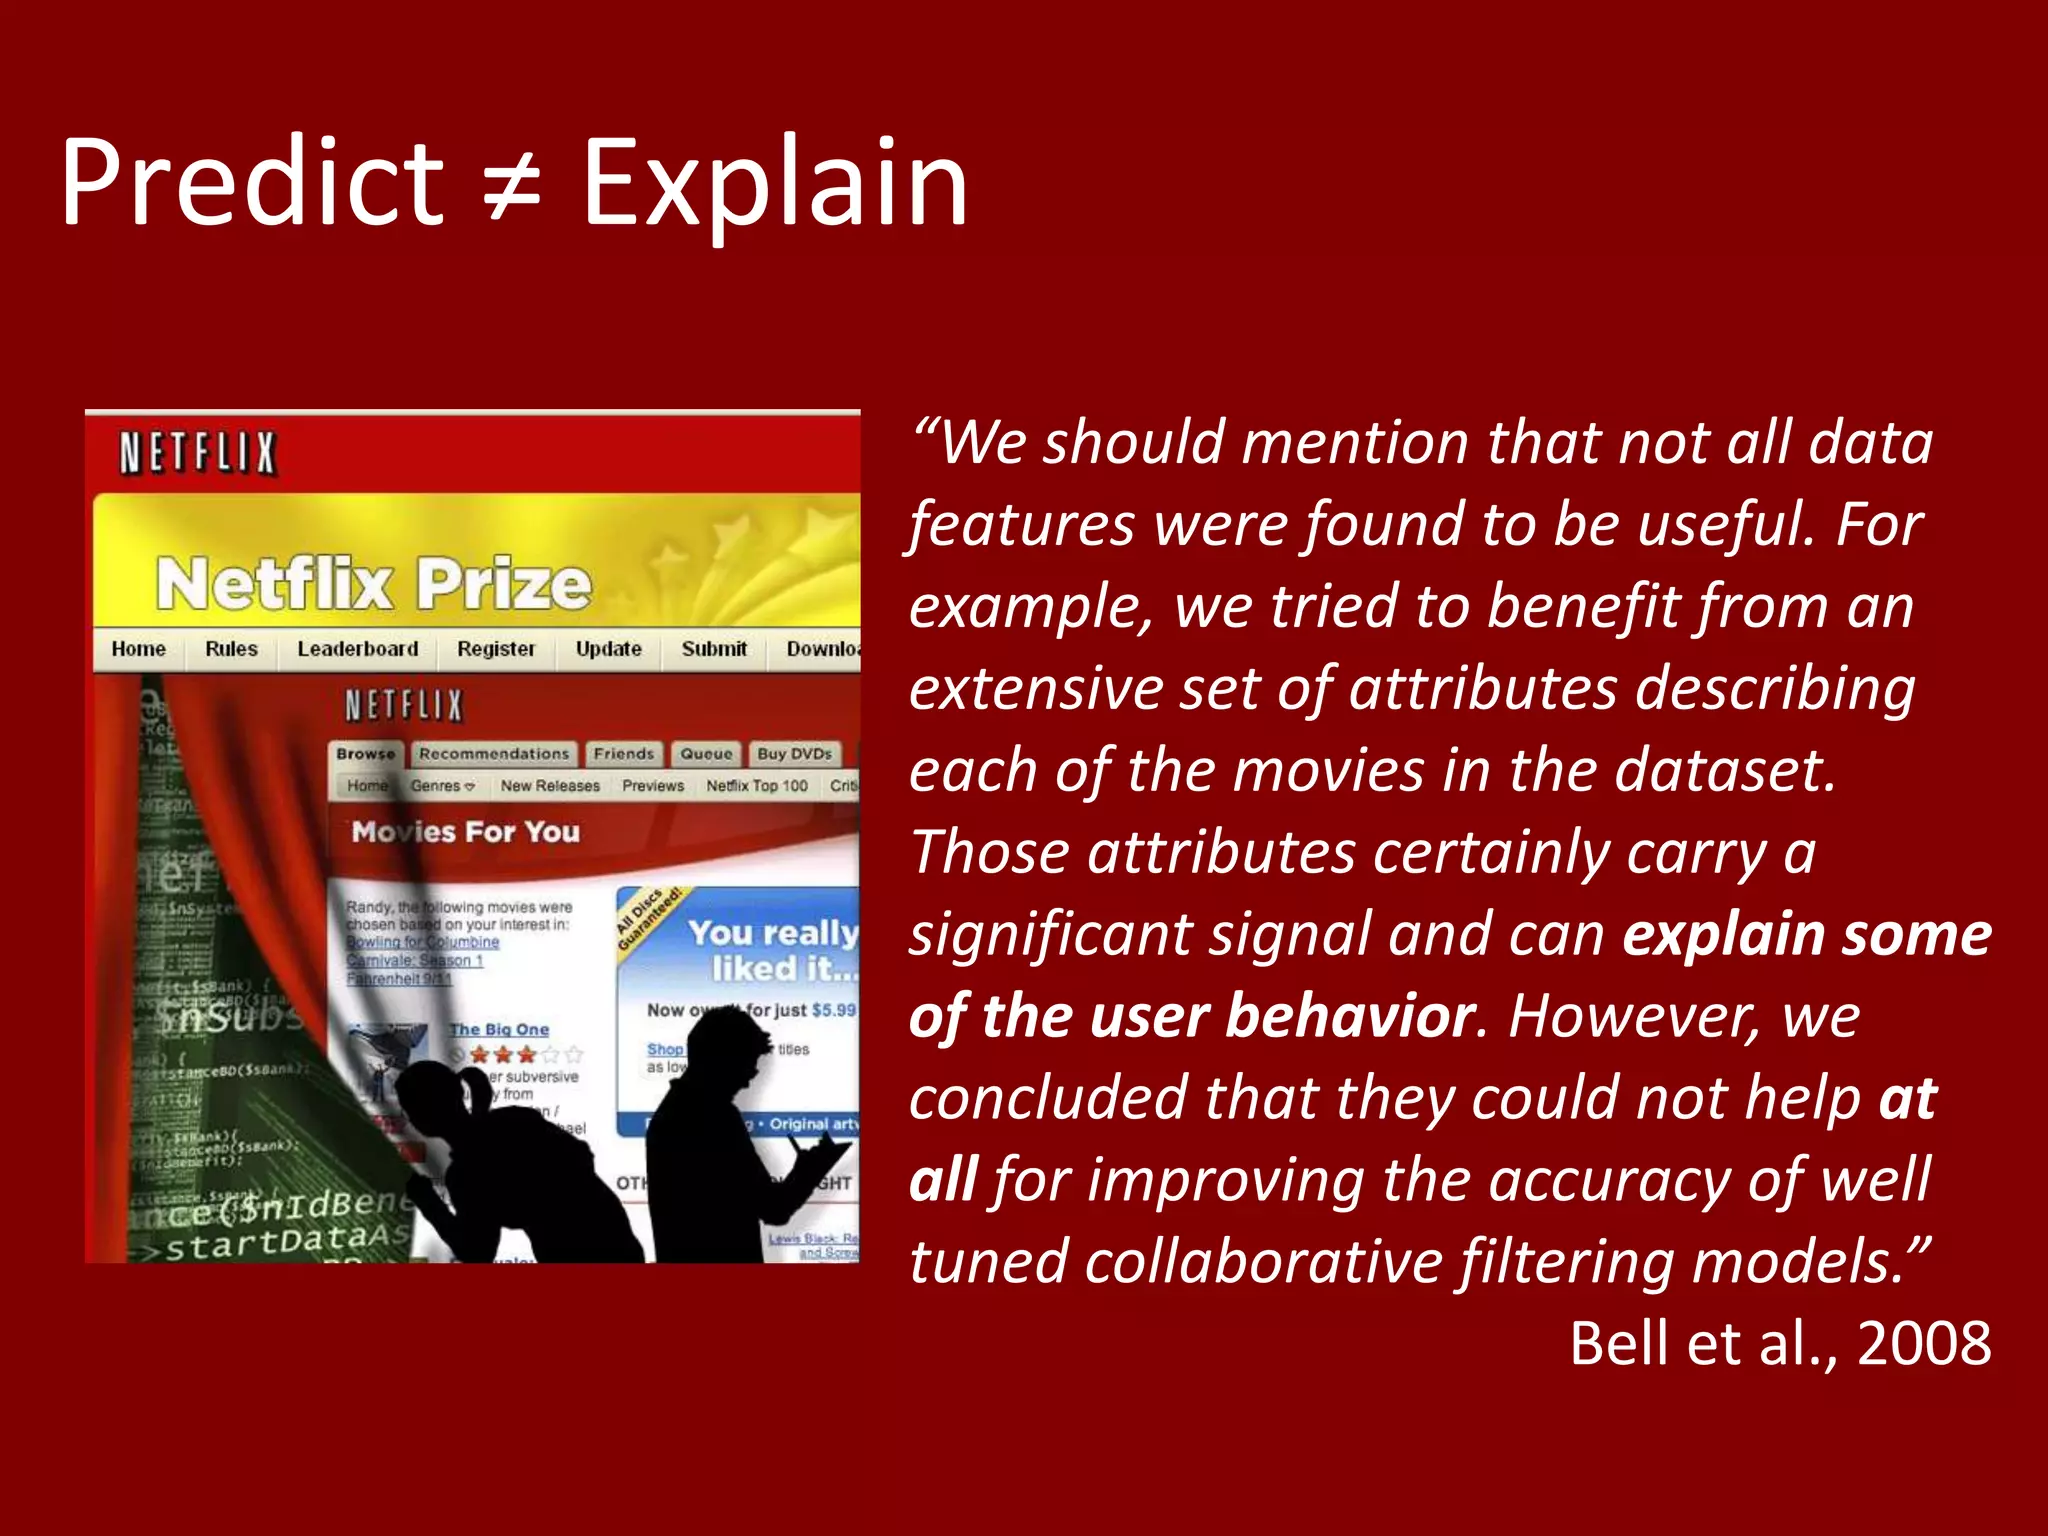
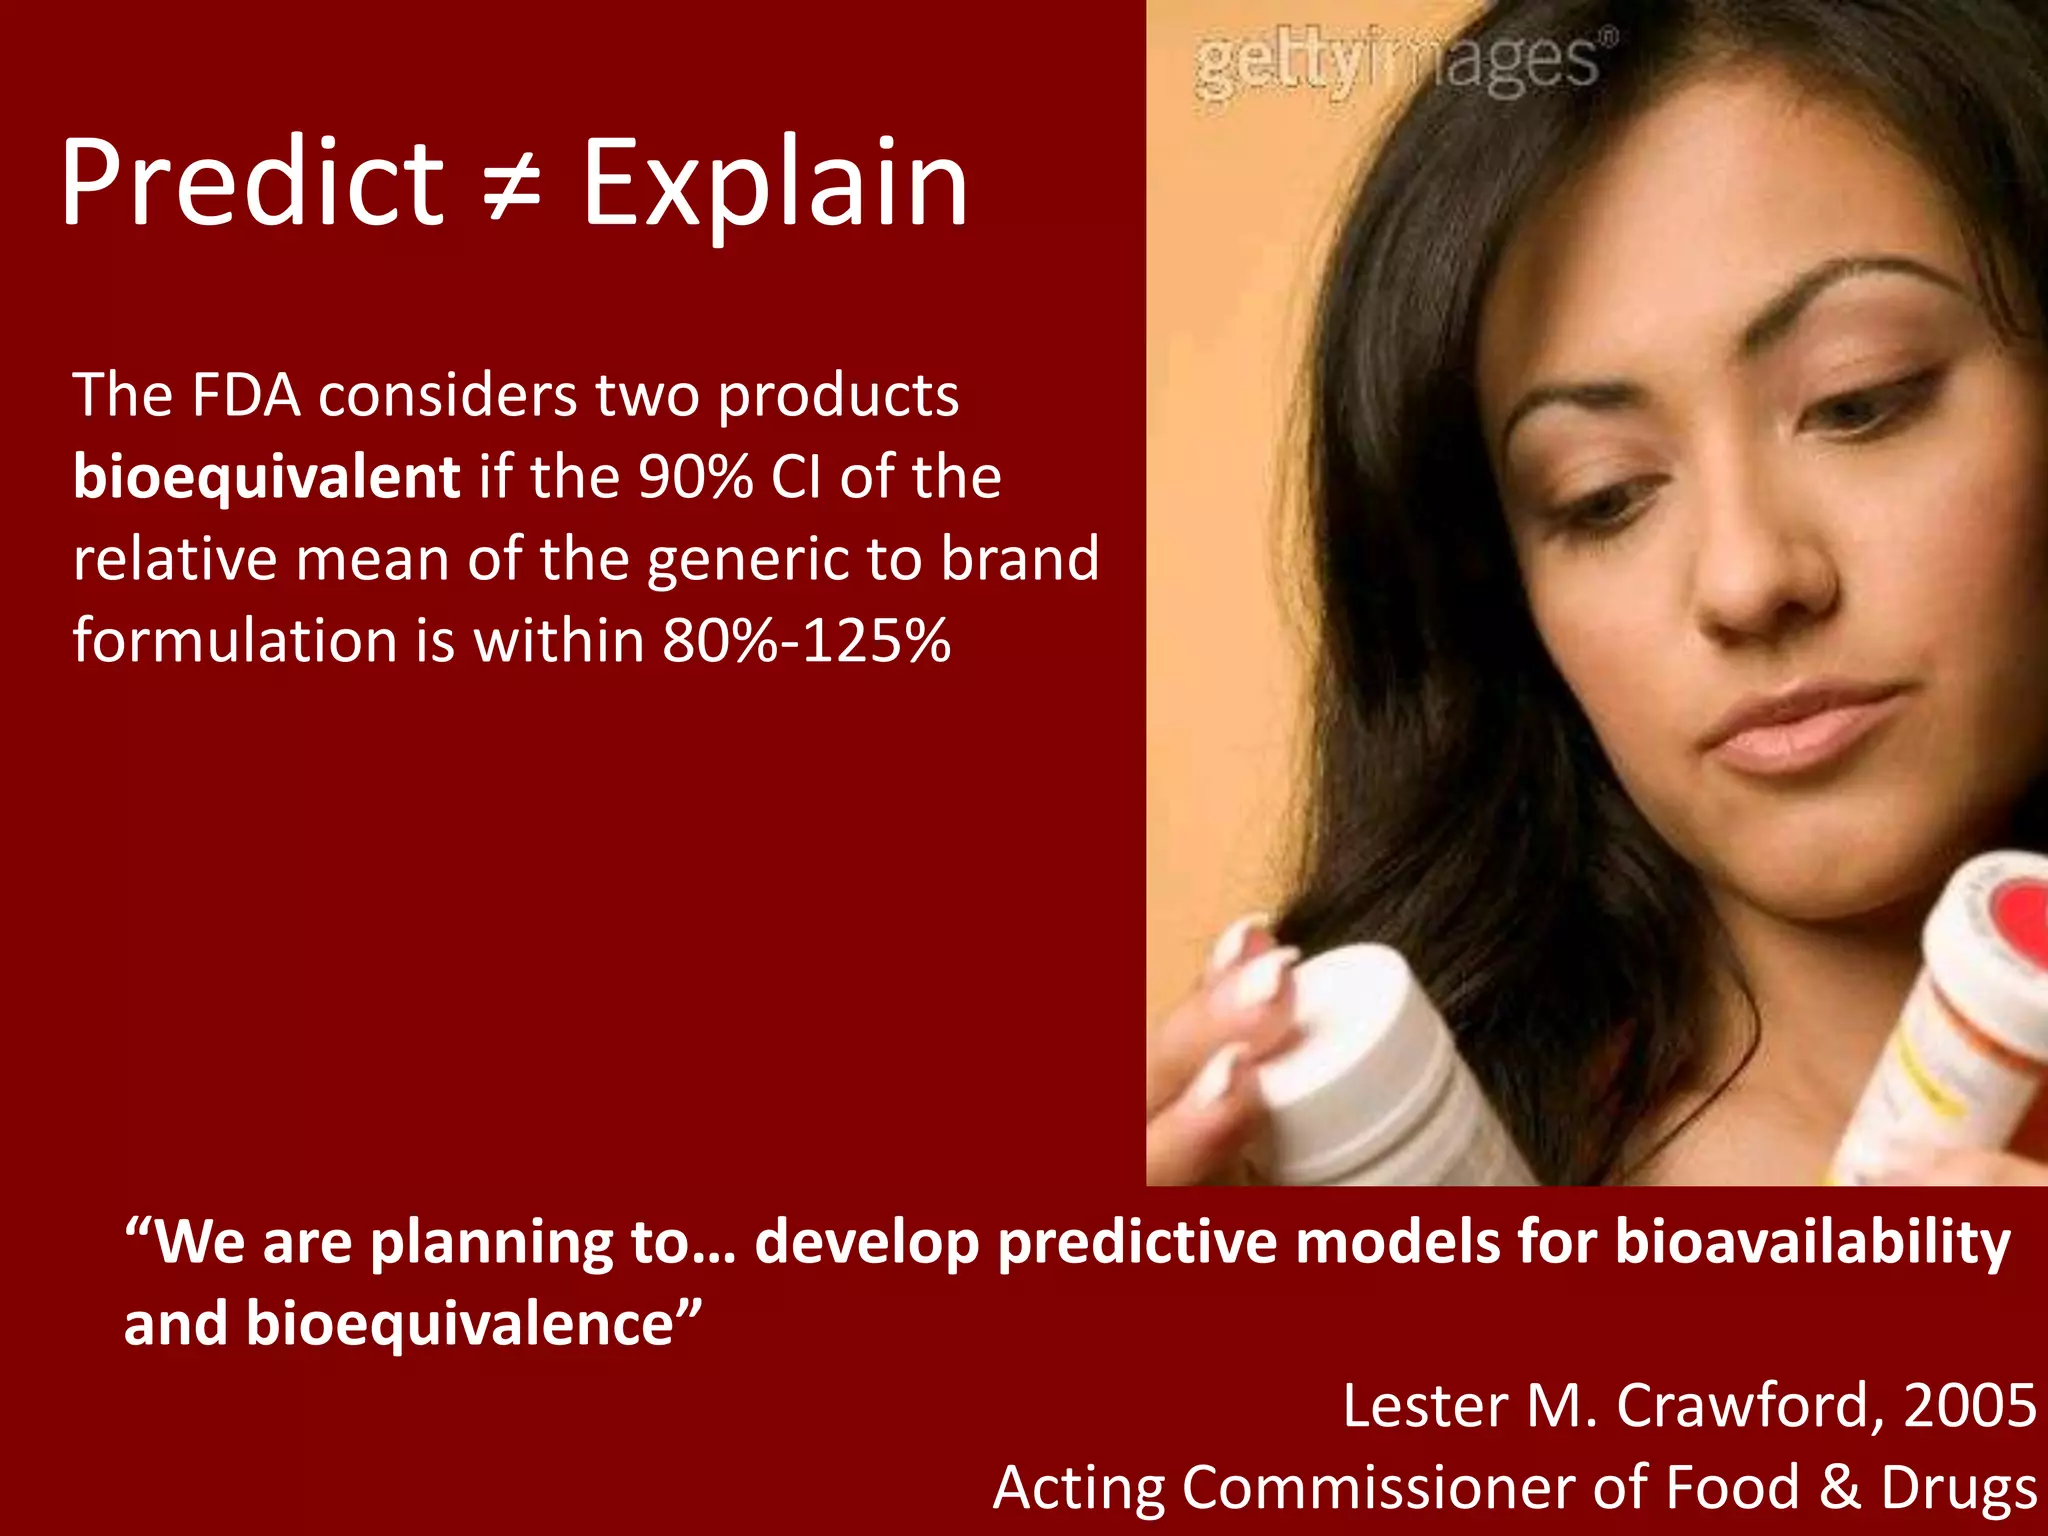
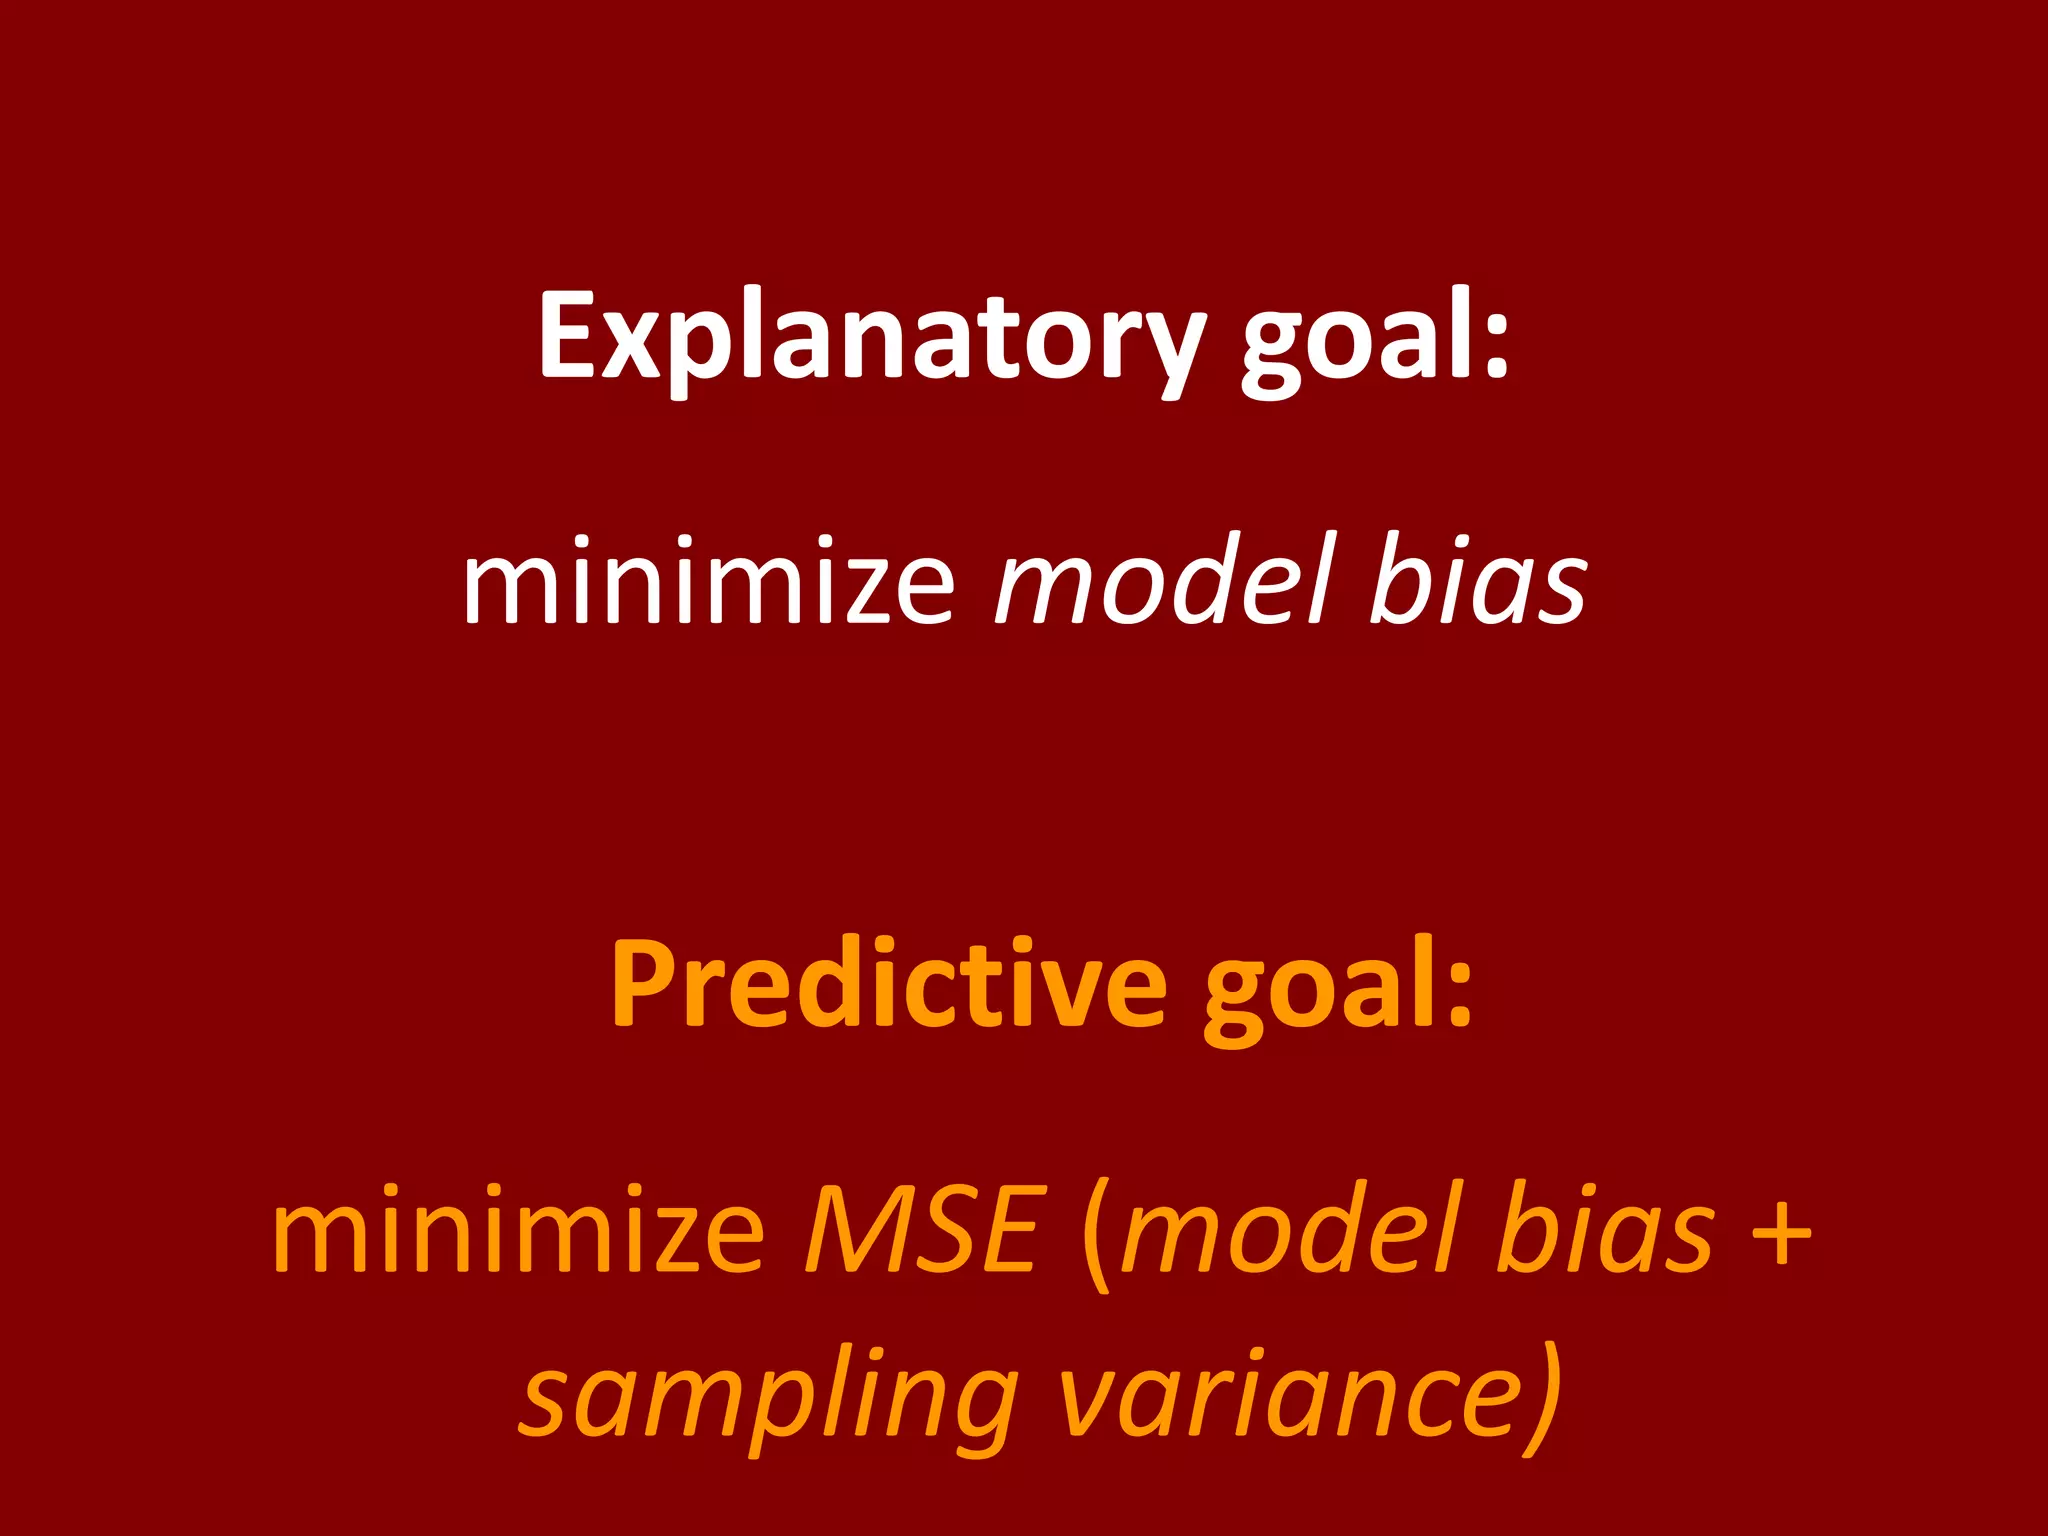
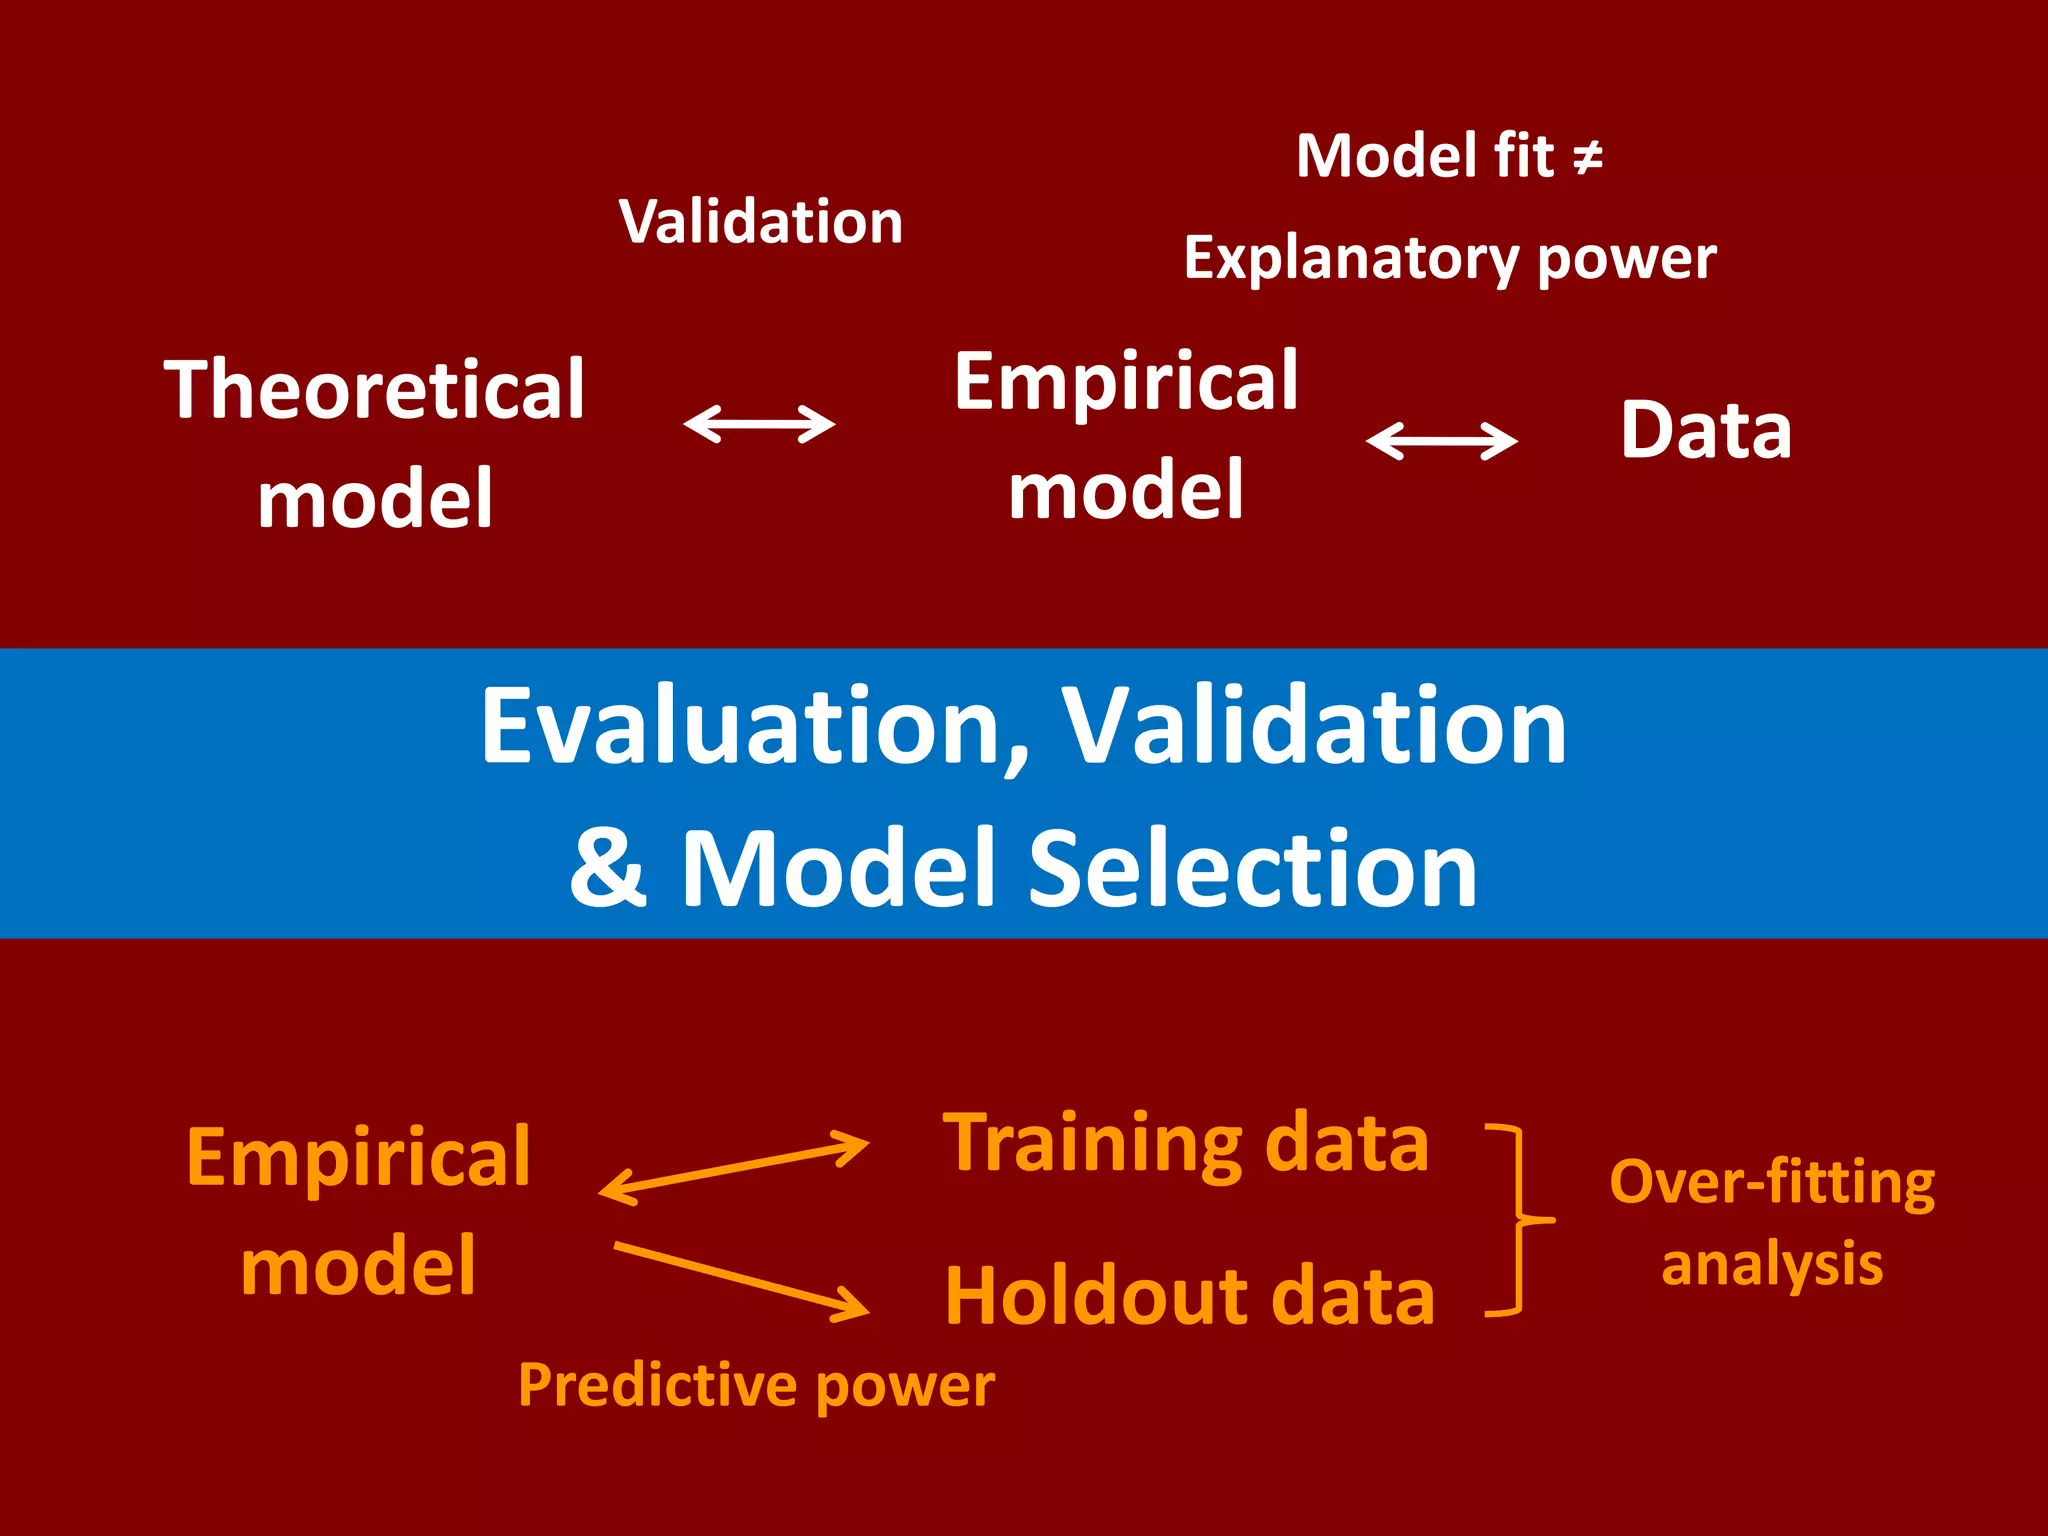
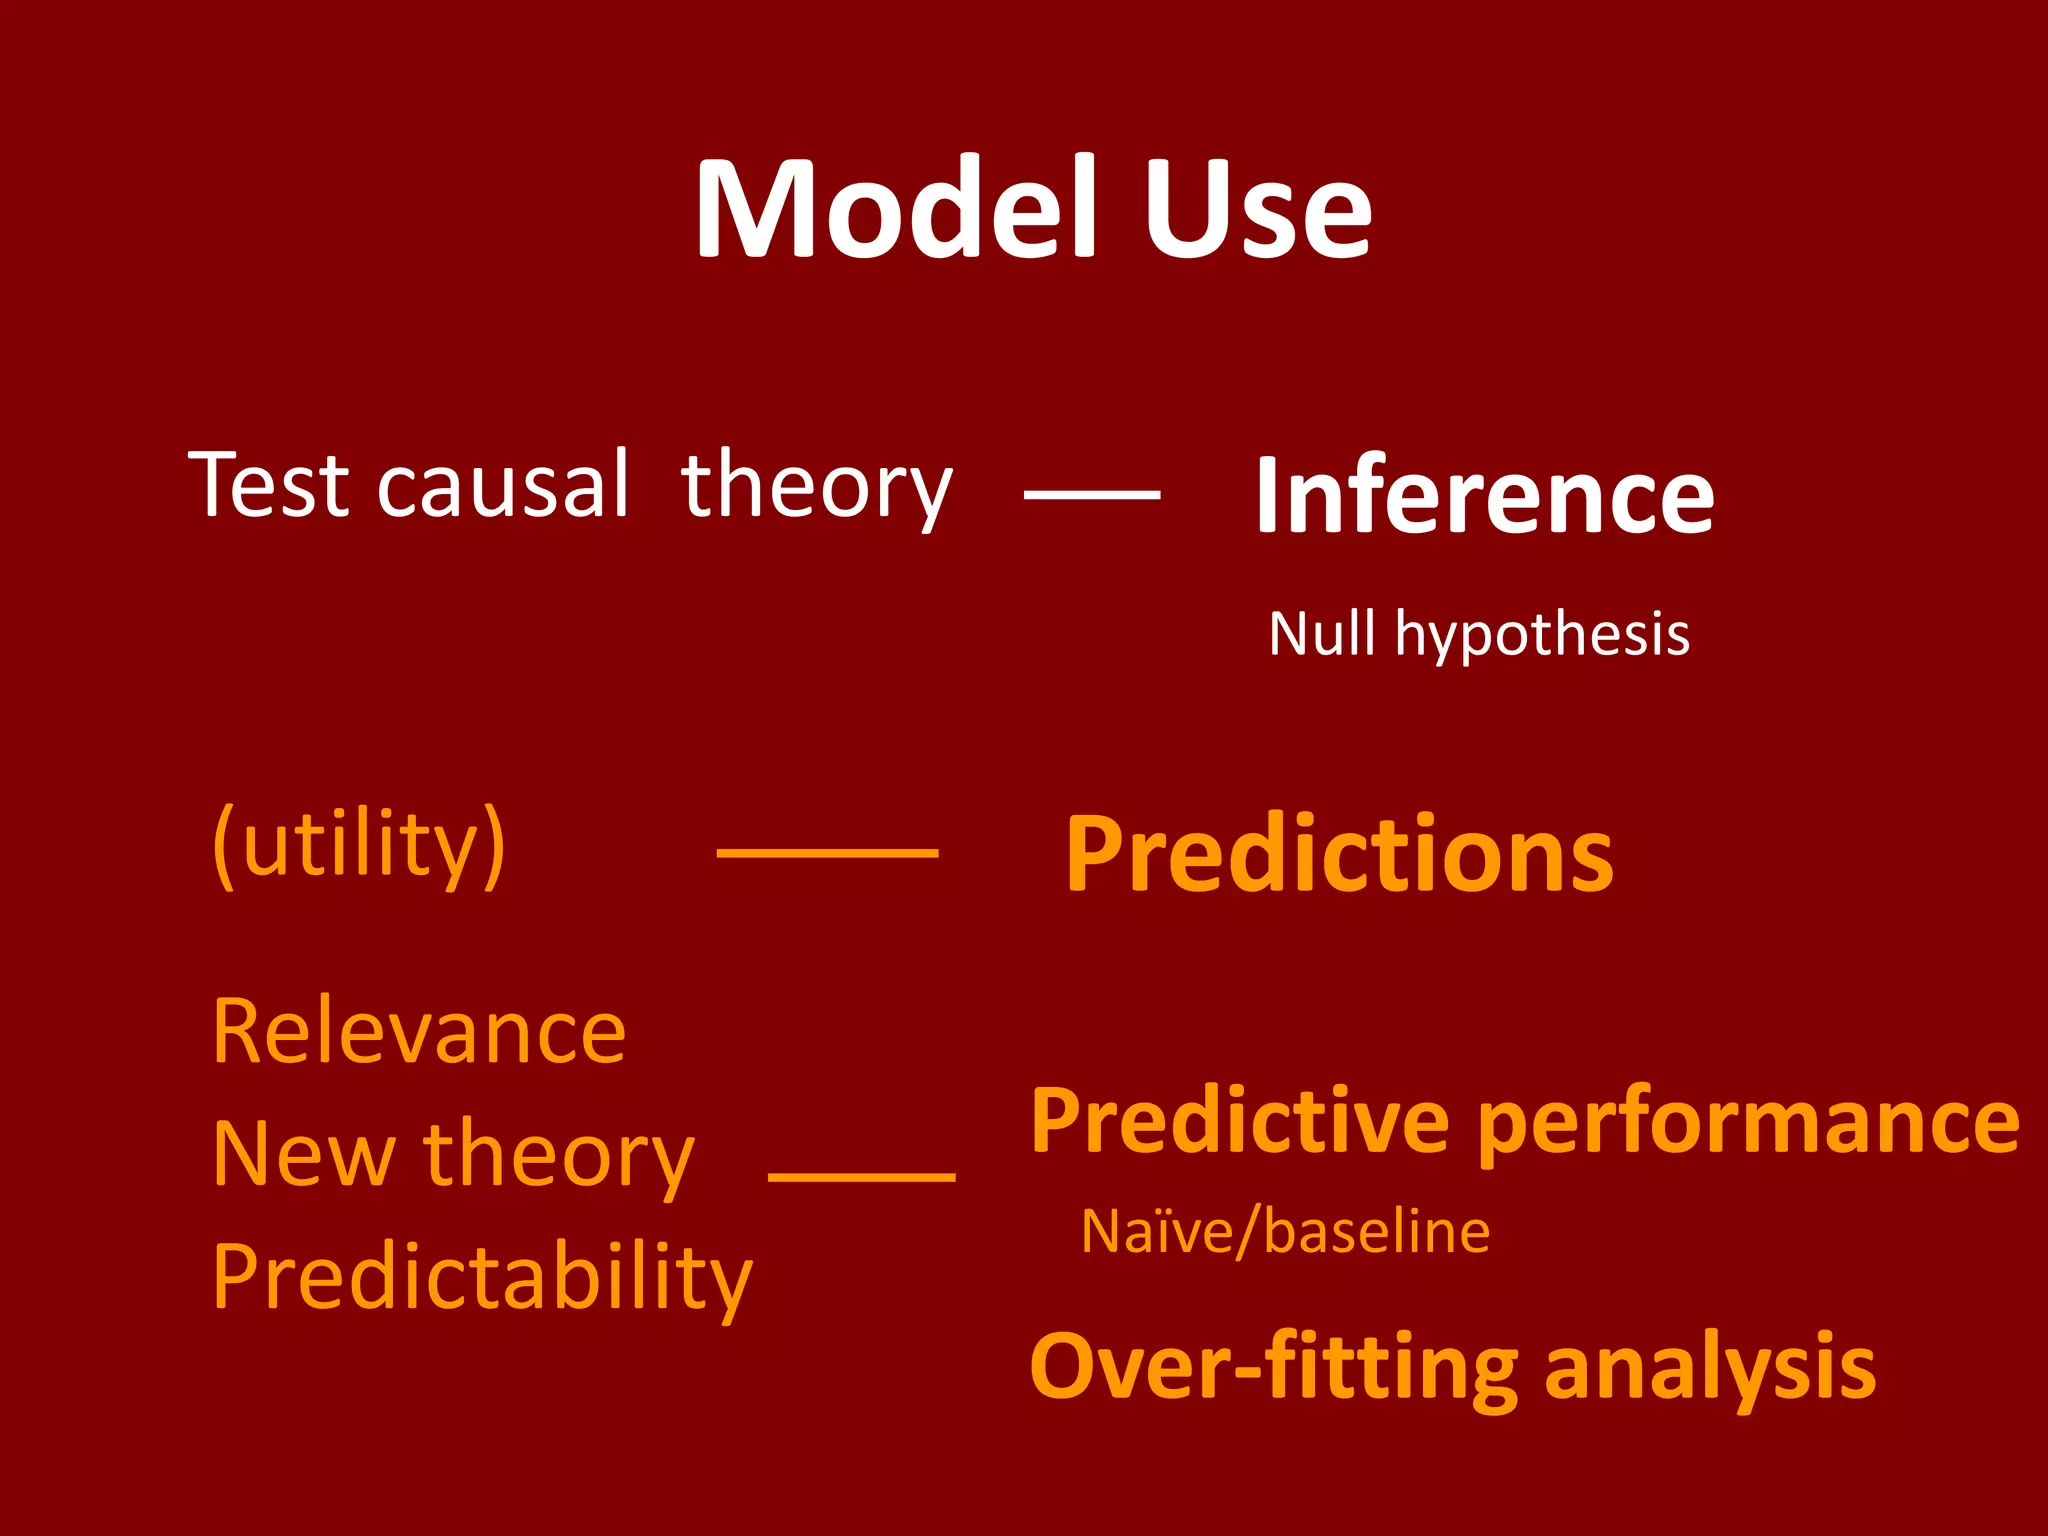
1) The document discusses the differences between explanatory and predictive modeling in scientific research. 2) Explanatory models are used to test causal theories, while predictive models are used to predict new records or scenarios. 3) Explanatory power and predictive accuracy are different and one cannot be inferred from the other. The best explanatory model is often not the best predictive model and vice versa.