Downloaded 113 times

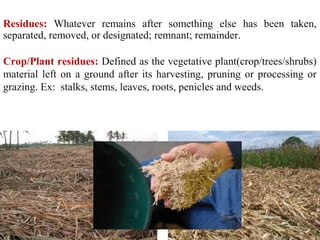
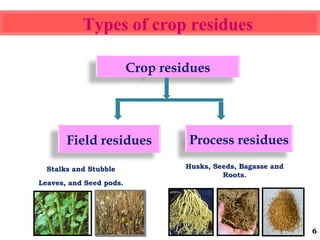
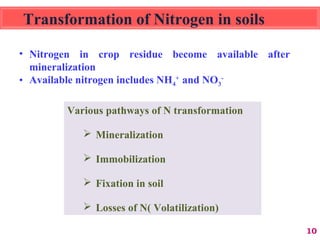
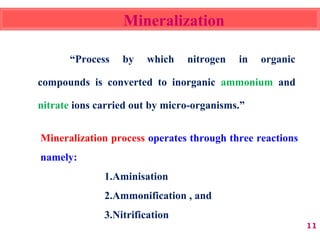
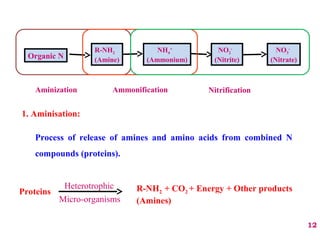
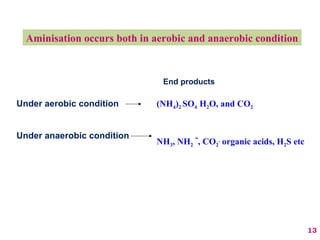
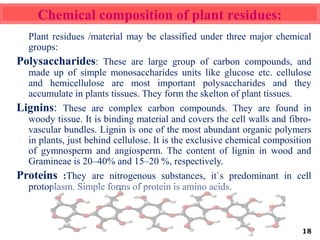
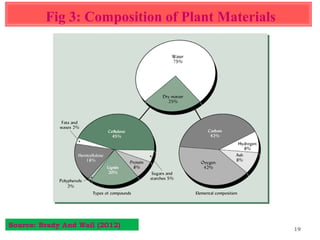
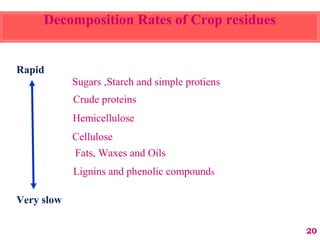
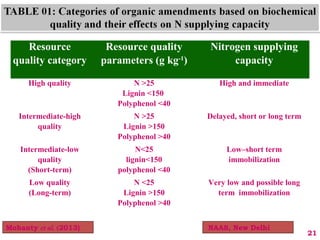
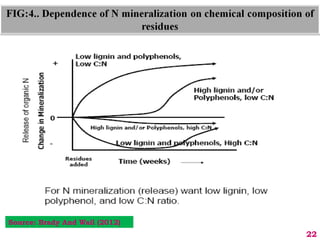

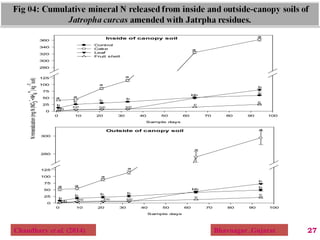
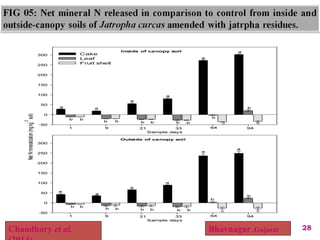
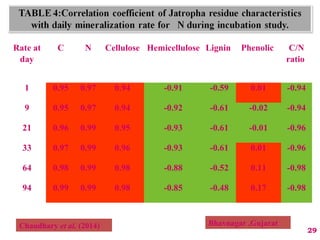
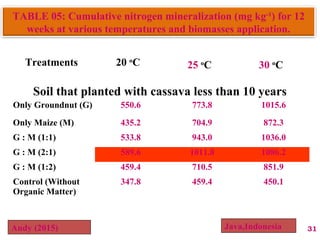
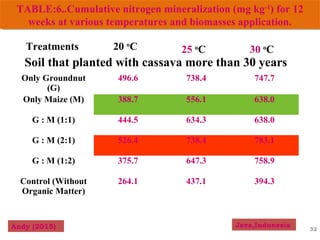
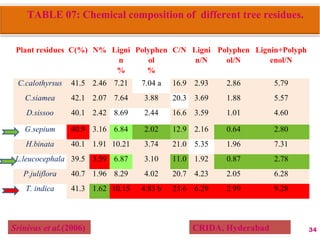
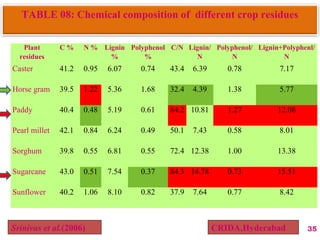
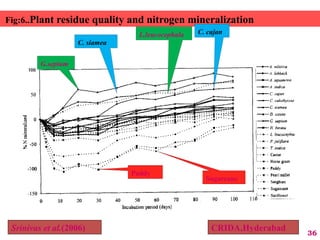
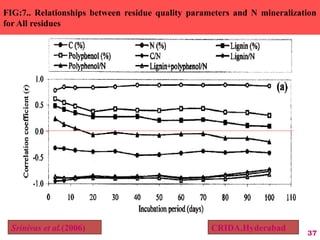
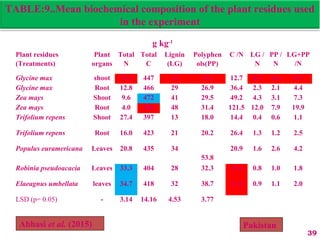
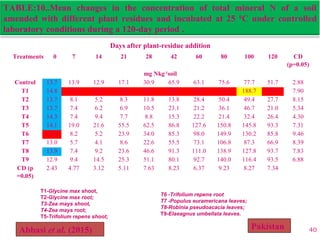
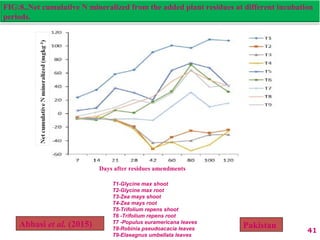
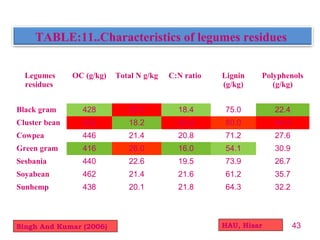
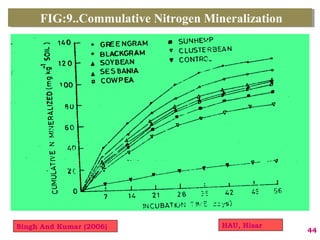
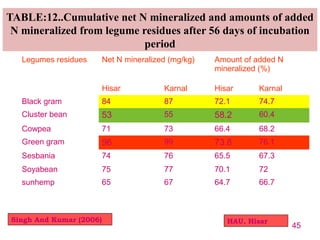
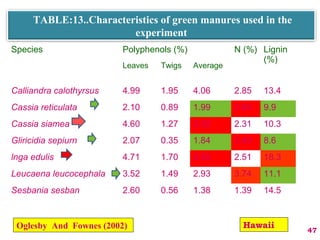
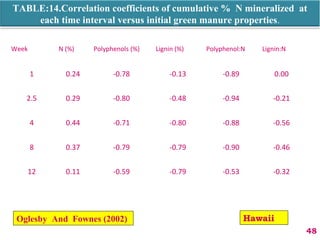
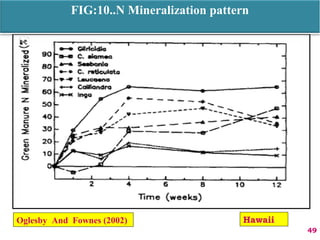
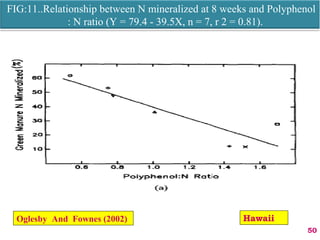
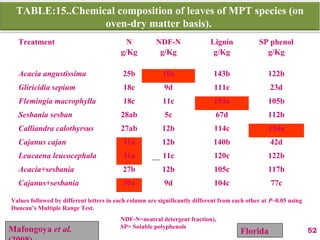
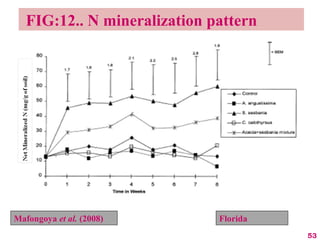
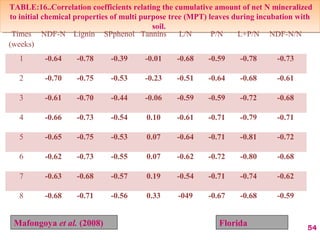
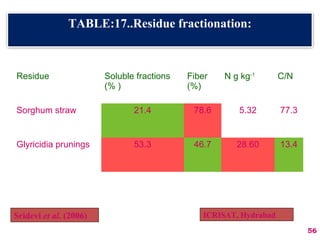
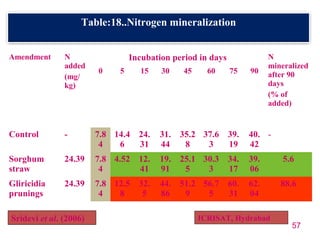
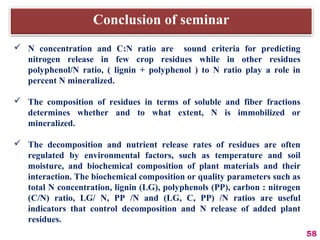


The document discusses the effect of chemical composition of plant residues on nitrogen mineralization in soil. It presents findings from several case studies and research papers. The chemical composition of different plant residues like lignin, polyphenols and C:N ratio affects their decomposition rate and impacts nitrogen mineralization. Plant residues high in nitrogen and low in lignin and polyphenols decompose faster, releasing nitrogen for plant uptake. The studies show crop residues and tree leaves with higher lignin and polyphenol content immobilize soil nitrogen during decomposition.


![[DSC Europe 25] Andrzej Kowalczyk - AI - how to start small and grow in the f...](https://cdn.slidesharecdn.com/ss_thumbnails/oy1zmo94qv6vpcqjvno2-andrzej-kowalczyk-ai-how-to-start-small-and-grow-in-the-future-1-260119121559-cf093b23-thumbnail.jpg?width=640&height=640&fit=bounds)
![[DSC Europe 25] Ivan Lukovic & Marija Djukic - From Data to Value: Why Maturi...](https://cdn.slidesharecdn.com/ss_thumbnails/ahrfps8xr6knowwhacxh-1-ivan-marija-dsc-2025-ld-v1-presentation-260115093812-be21adfc-thumbnail.jpg?width=640&height=640&fit=bounds)


![[DSC Europe 25] Bojan Djuricic - Predictive Design Process.pdf](https://cdn.slidesharecdn.com/ss_thumbnails/5awdrbedqdek3gqu2ezy-4-the-predictive-design-bojan-djuricic-260120105856-6c399e9b-thumbnail.jpg?width=640&height=640&fit=bounds)


