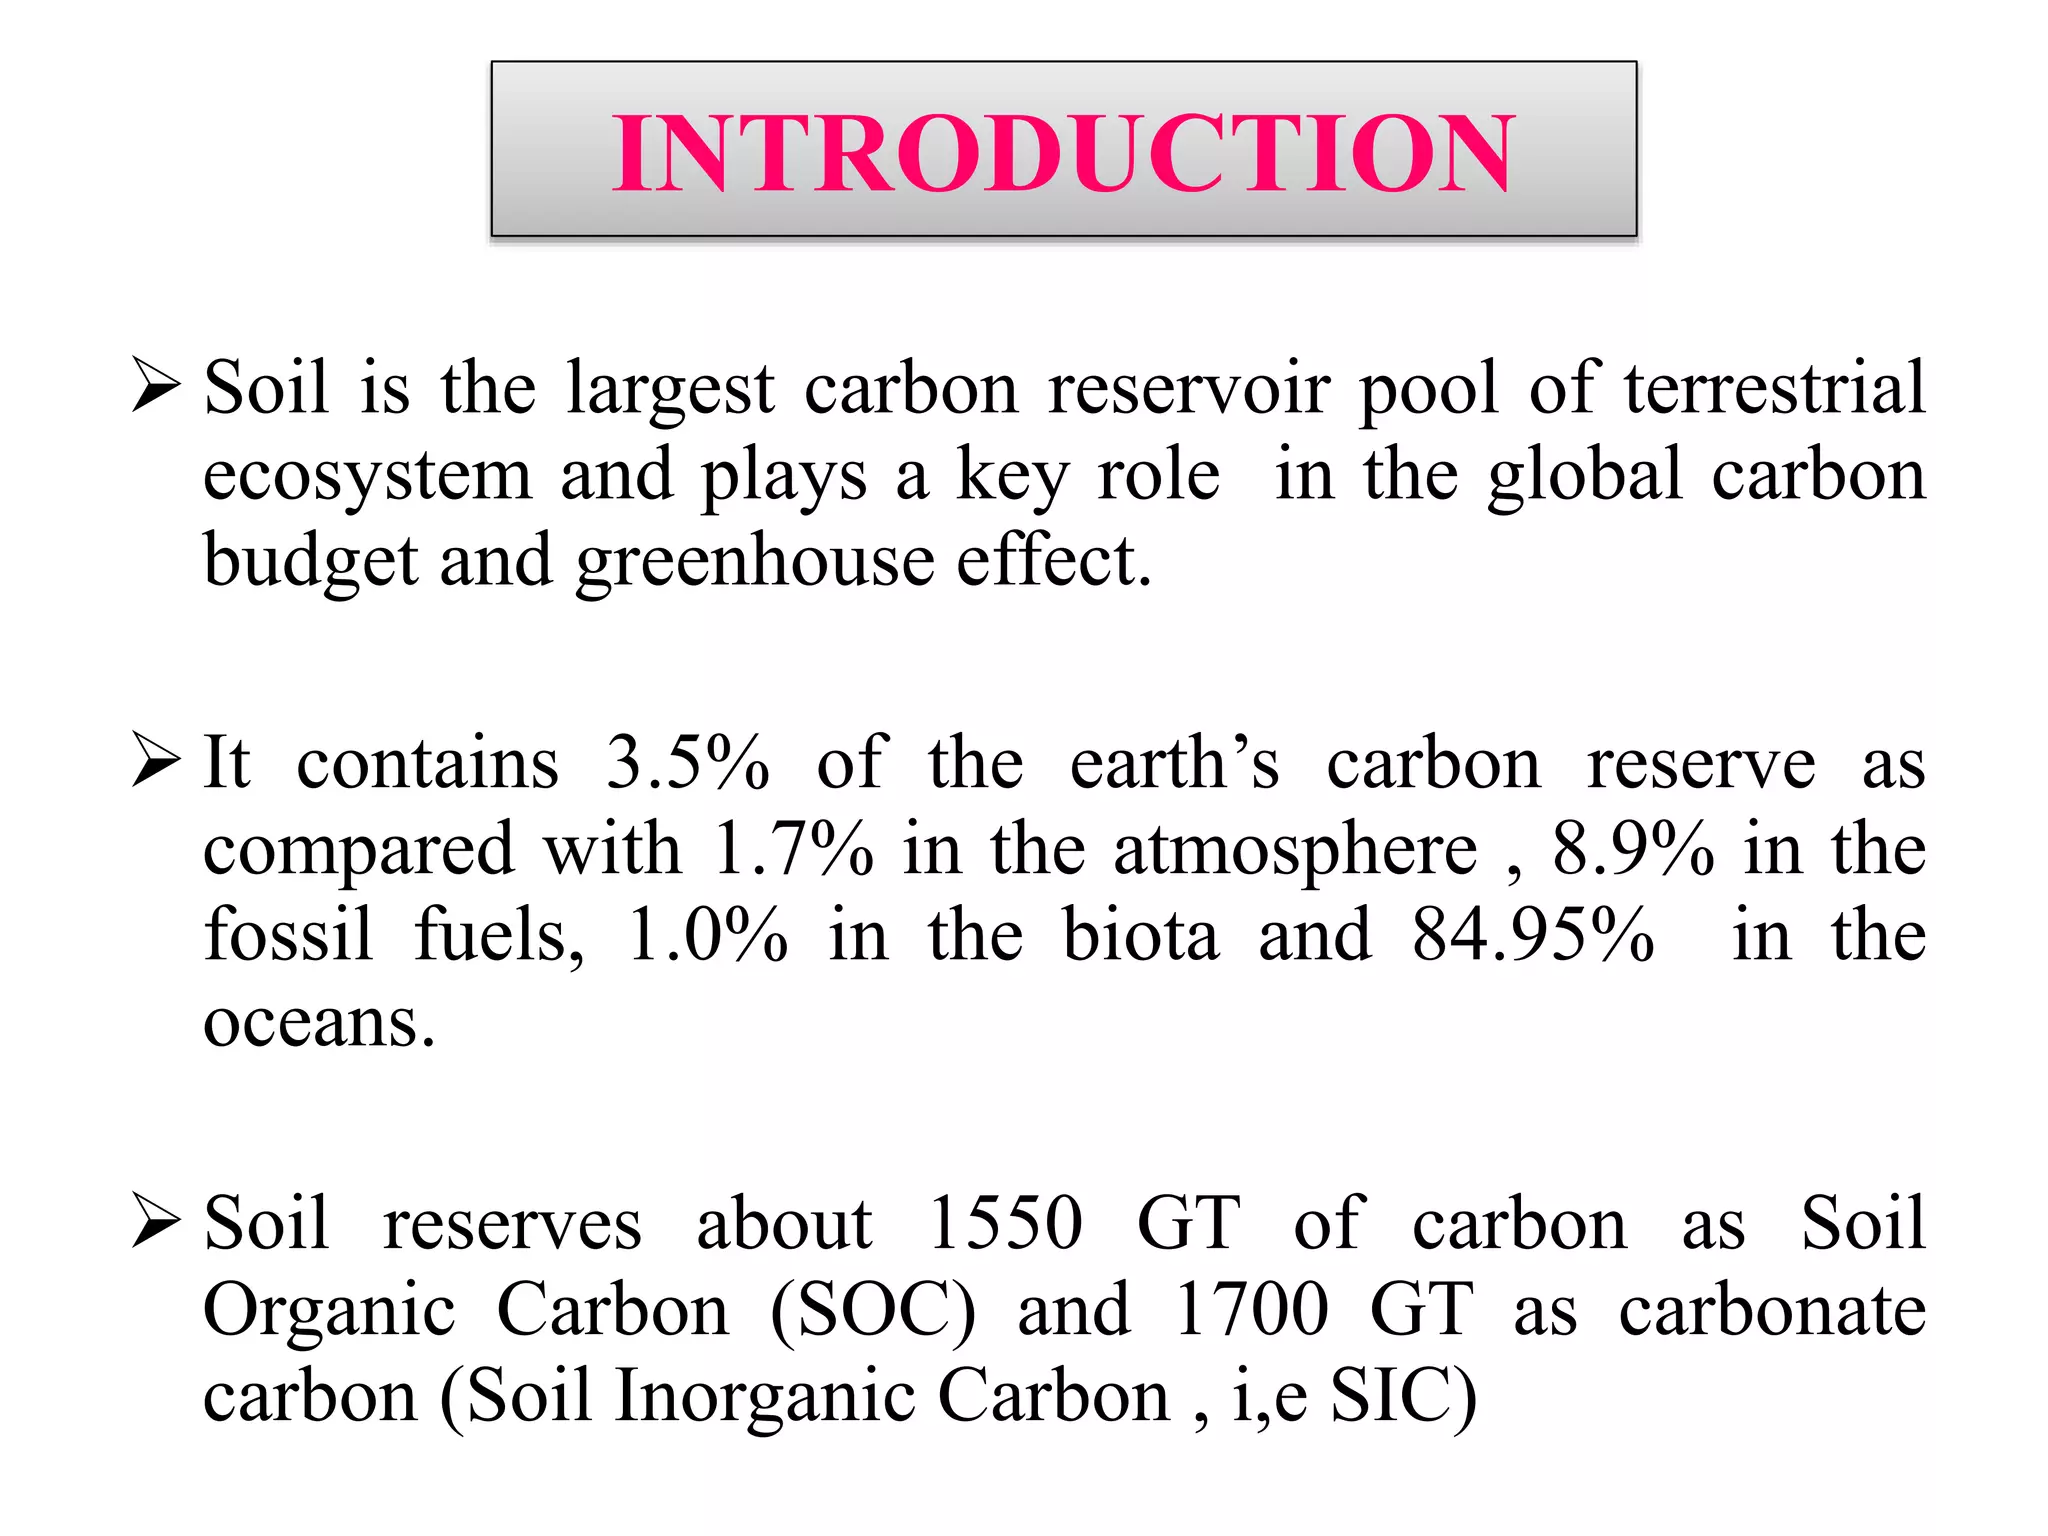
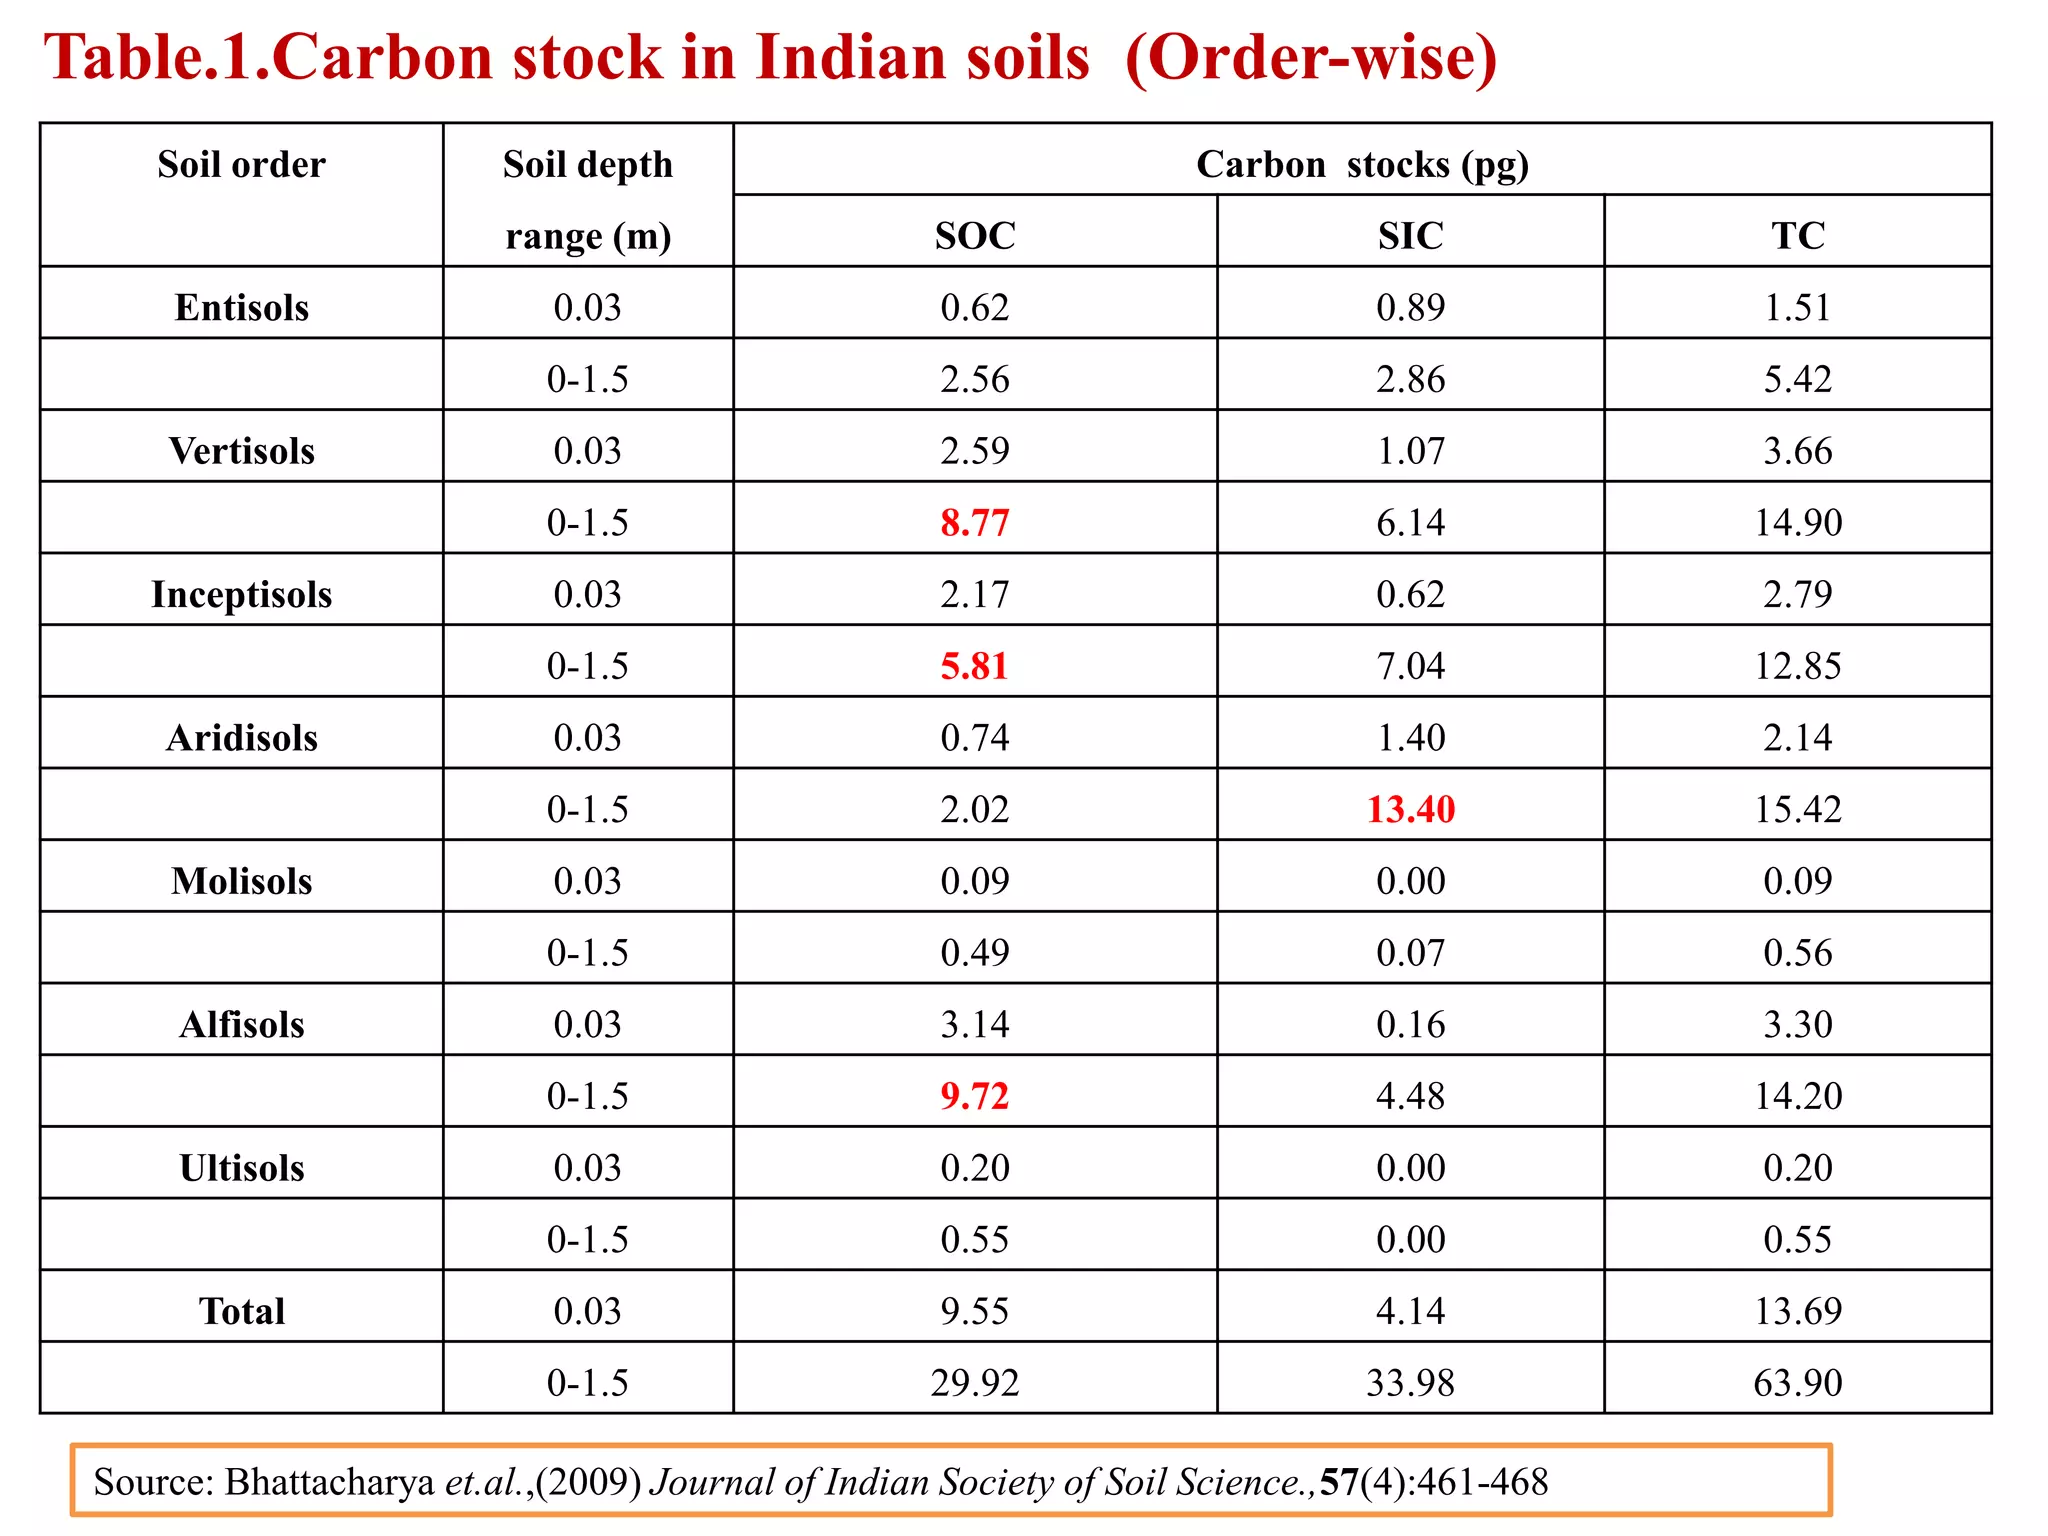
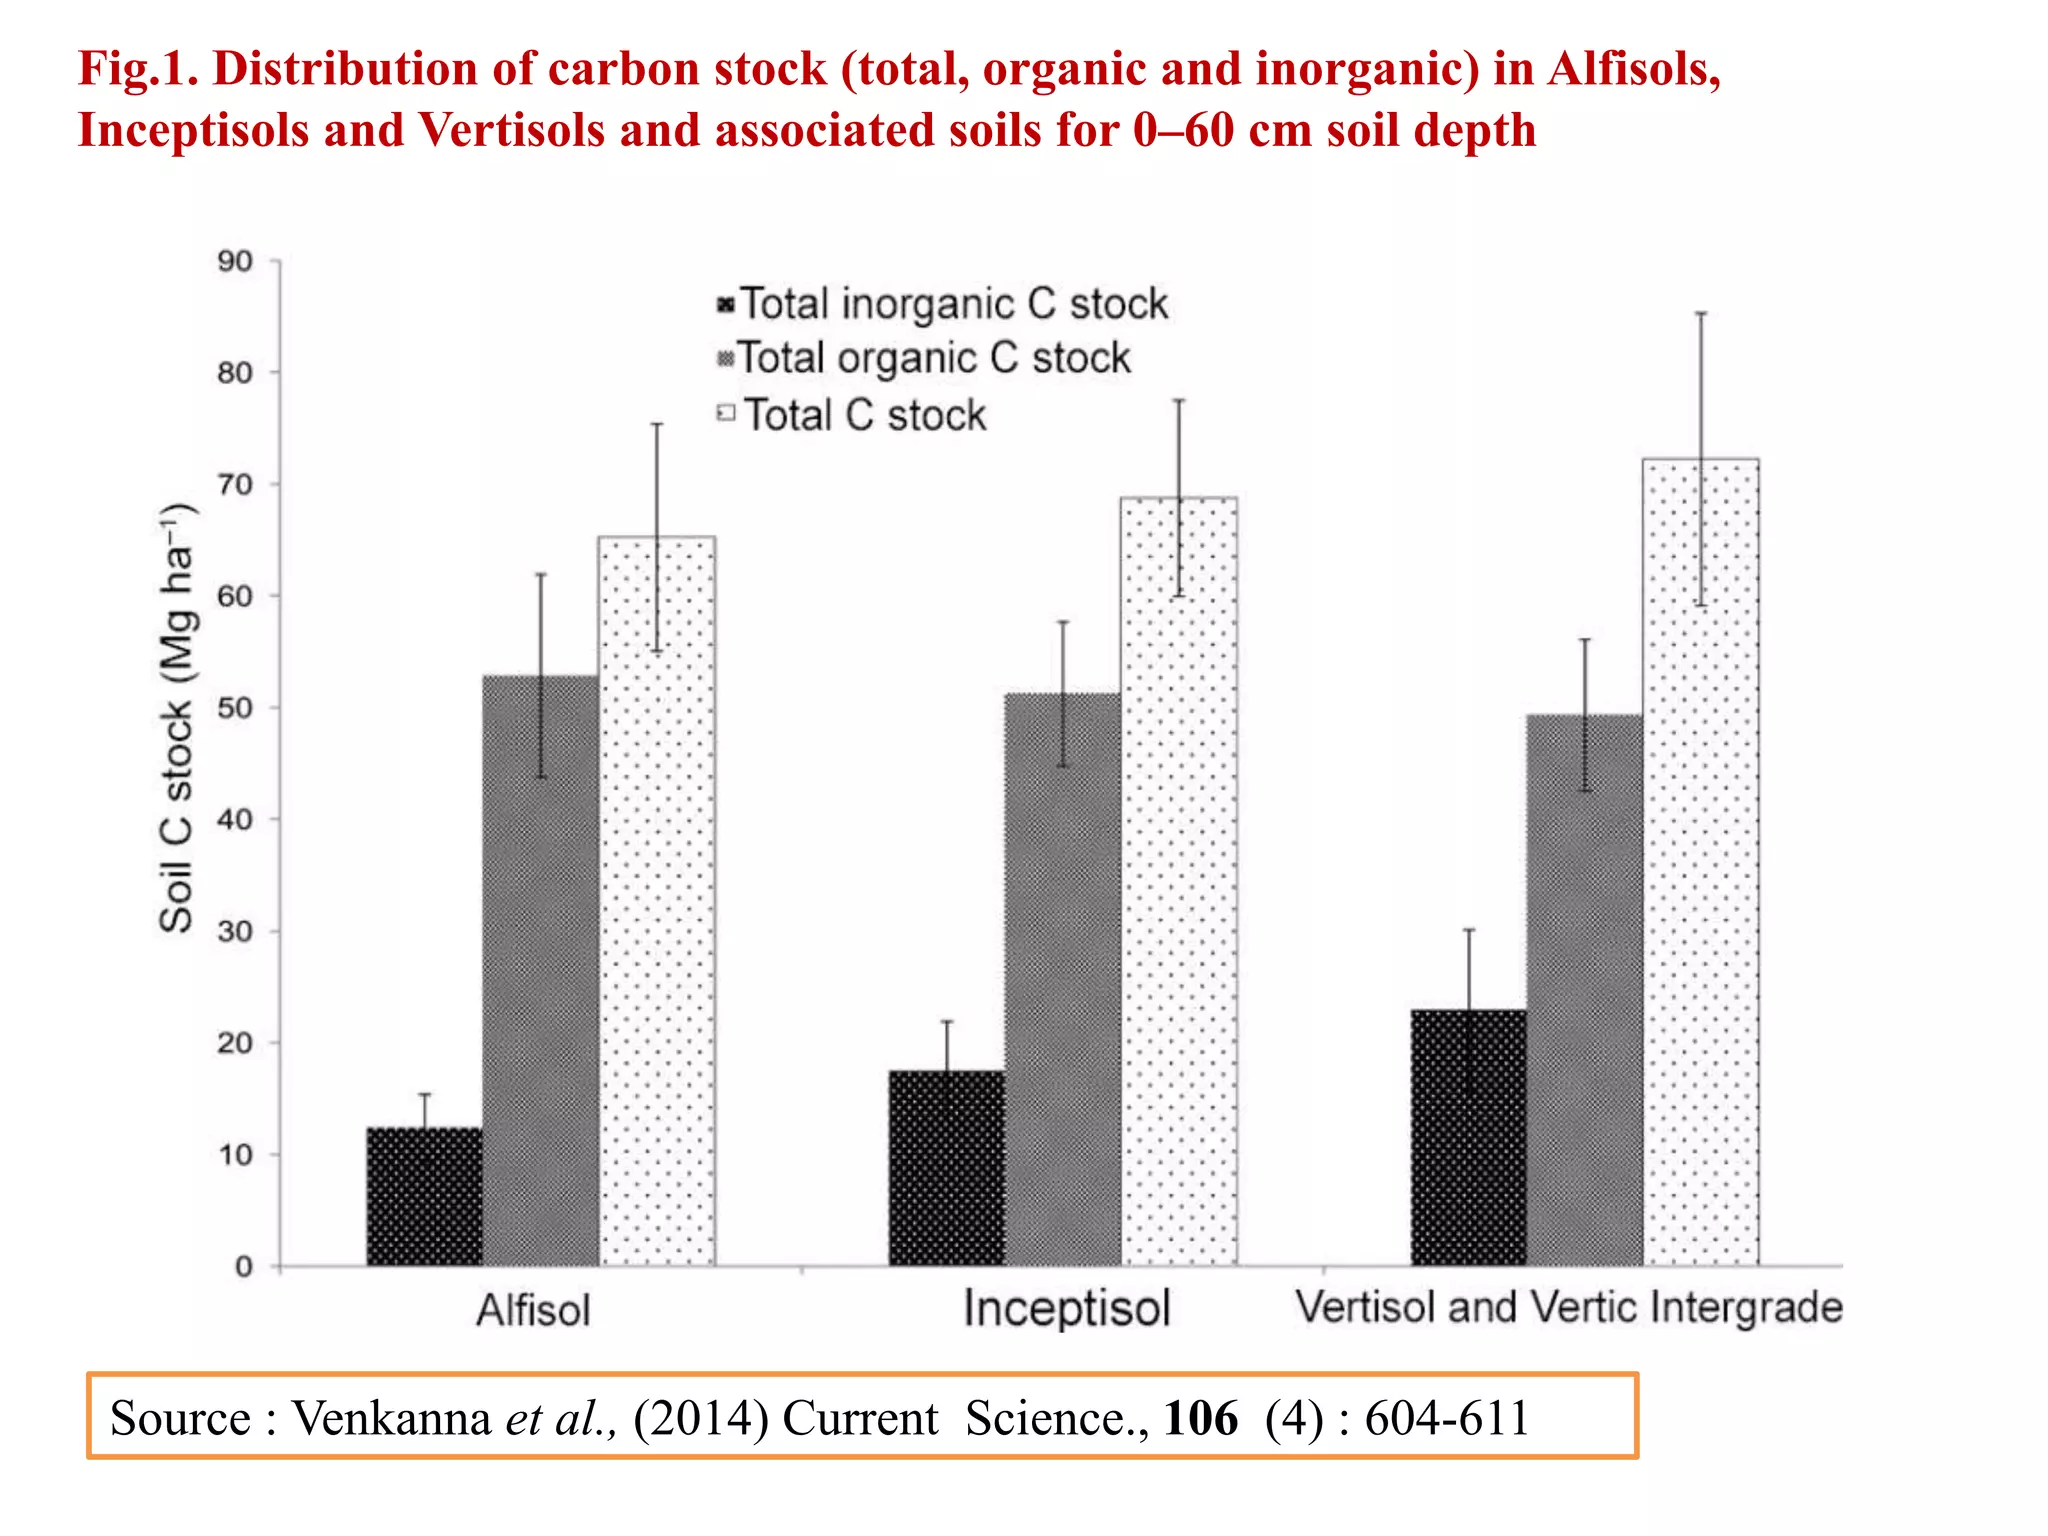
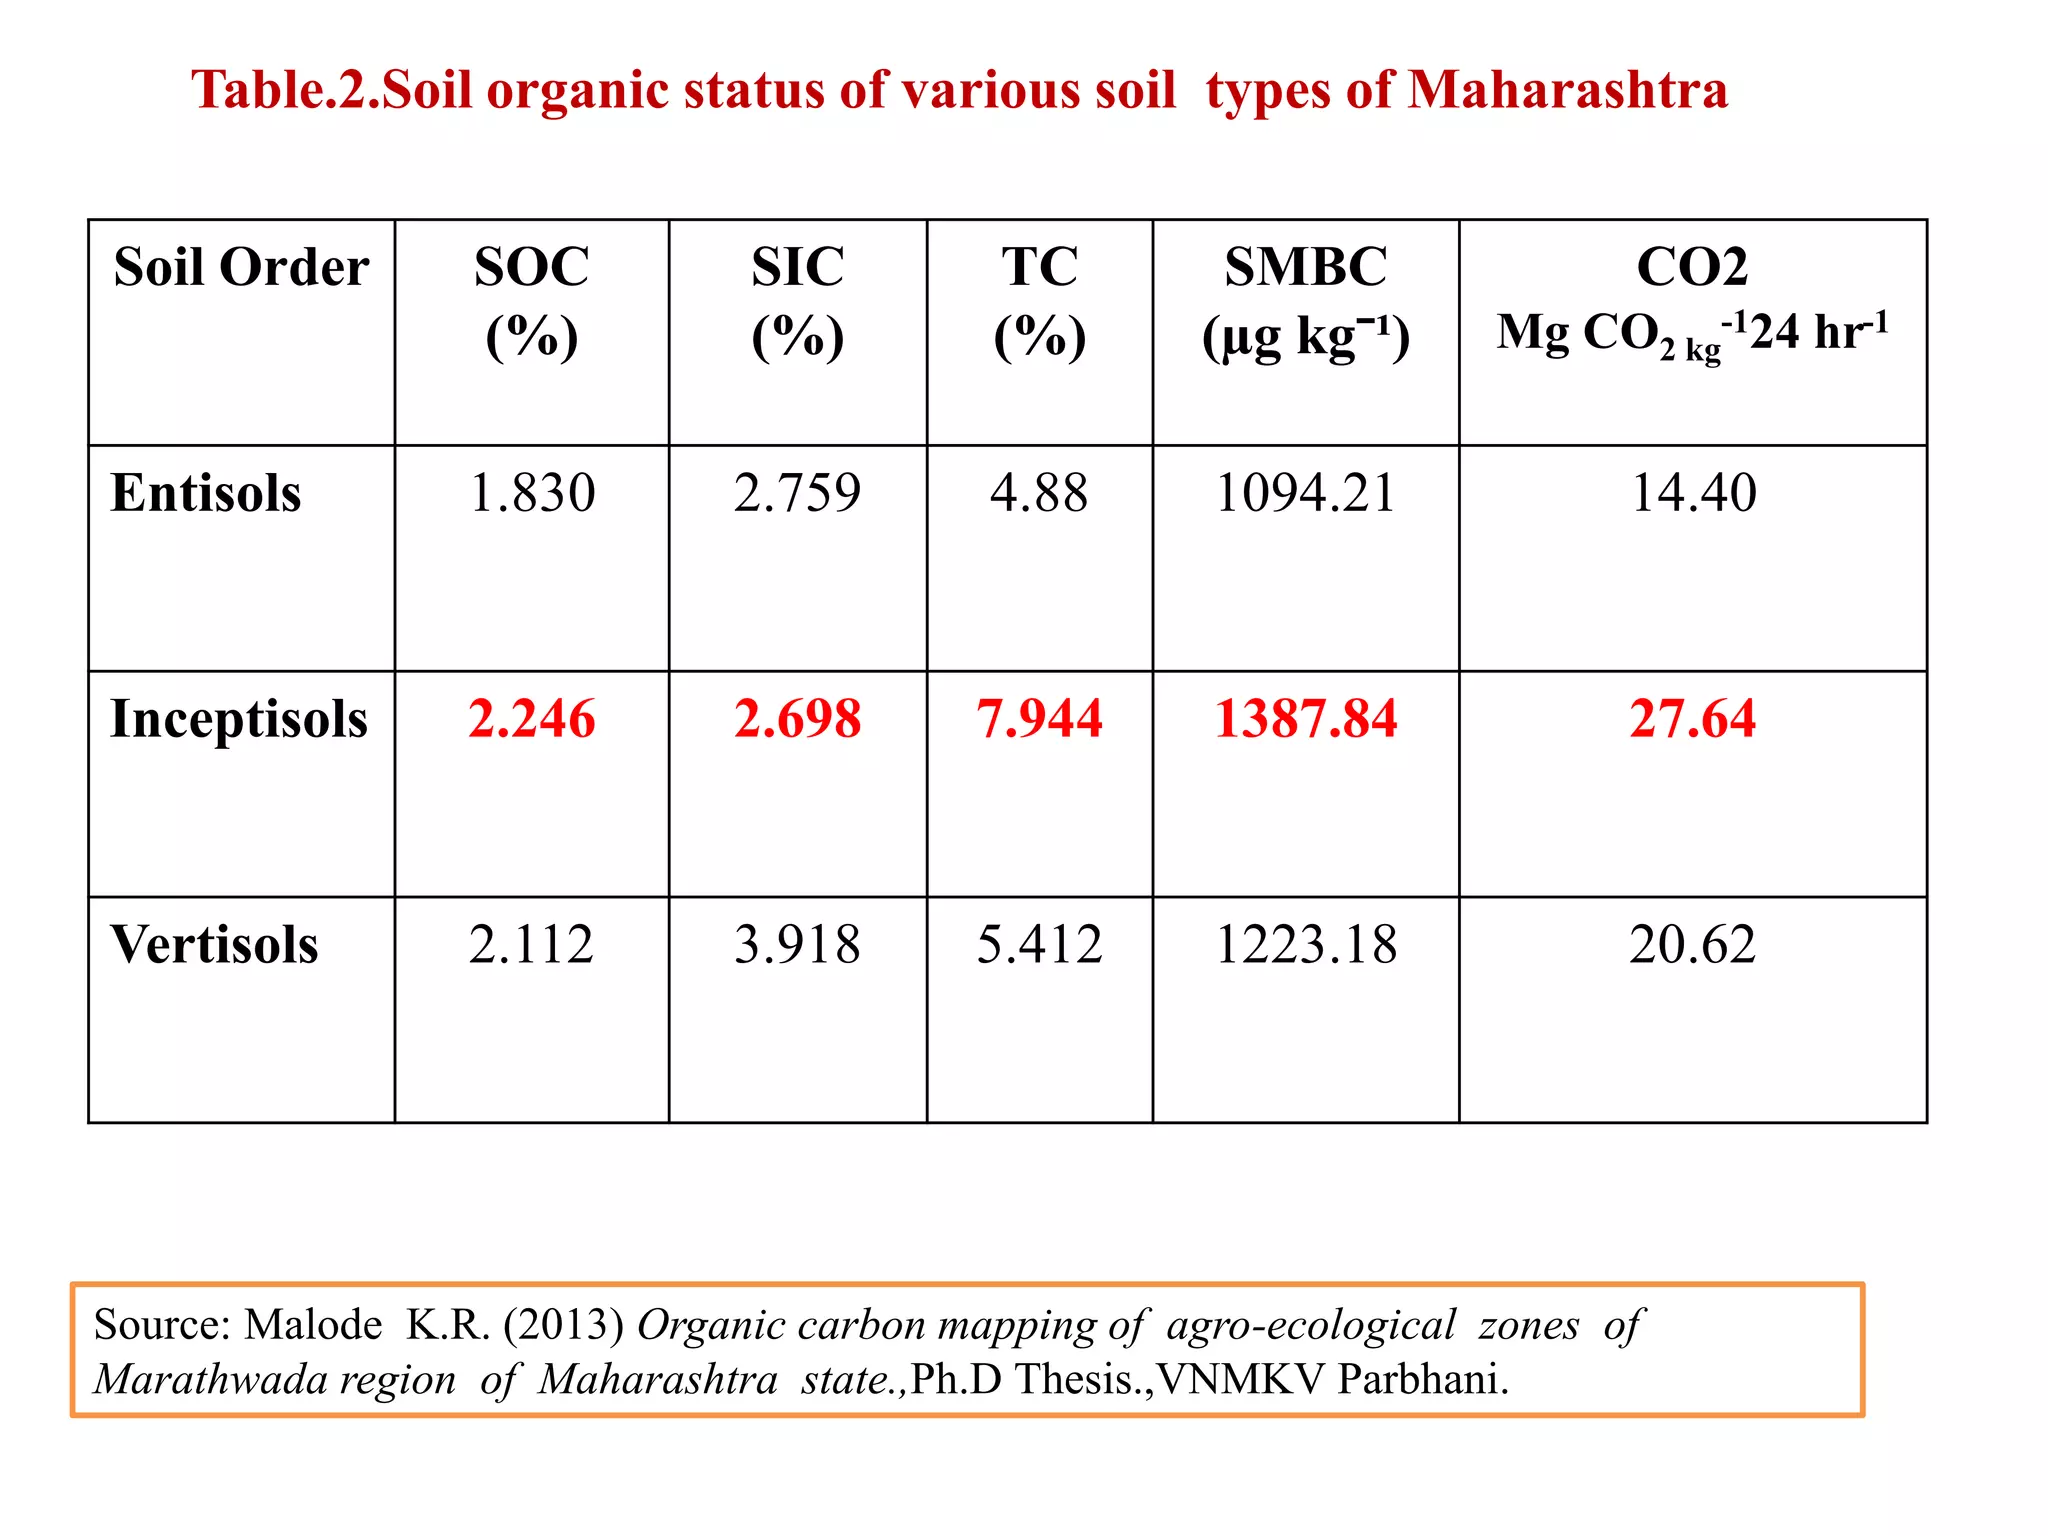
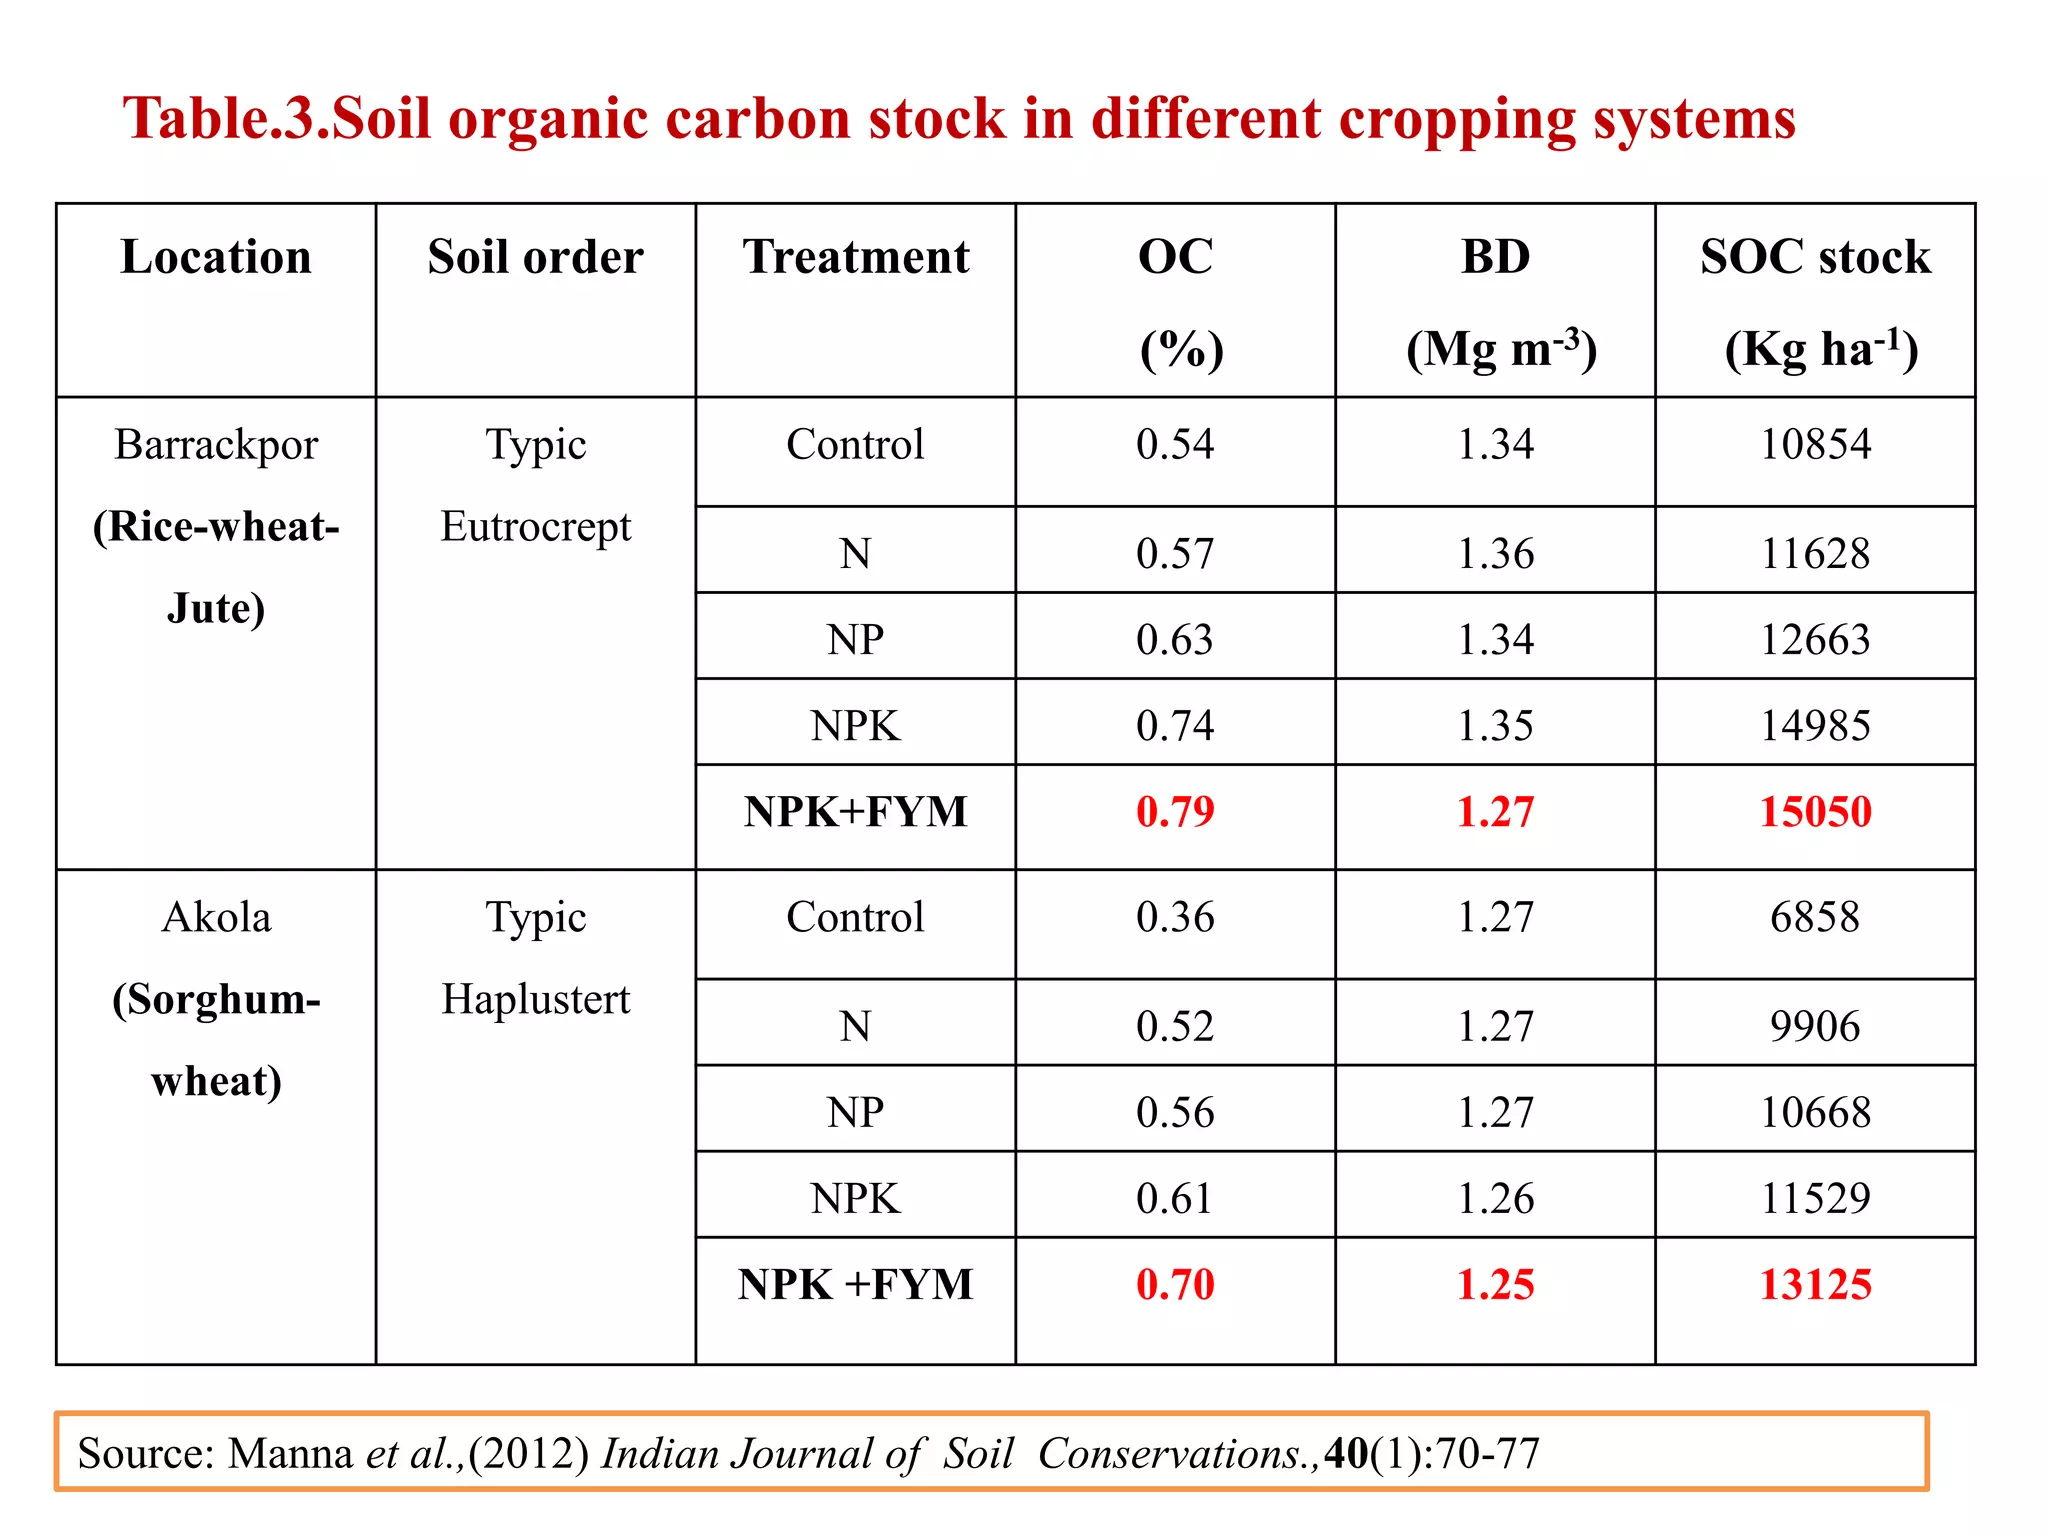
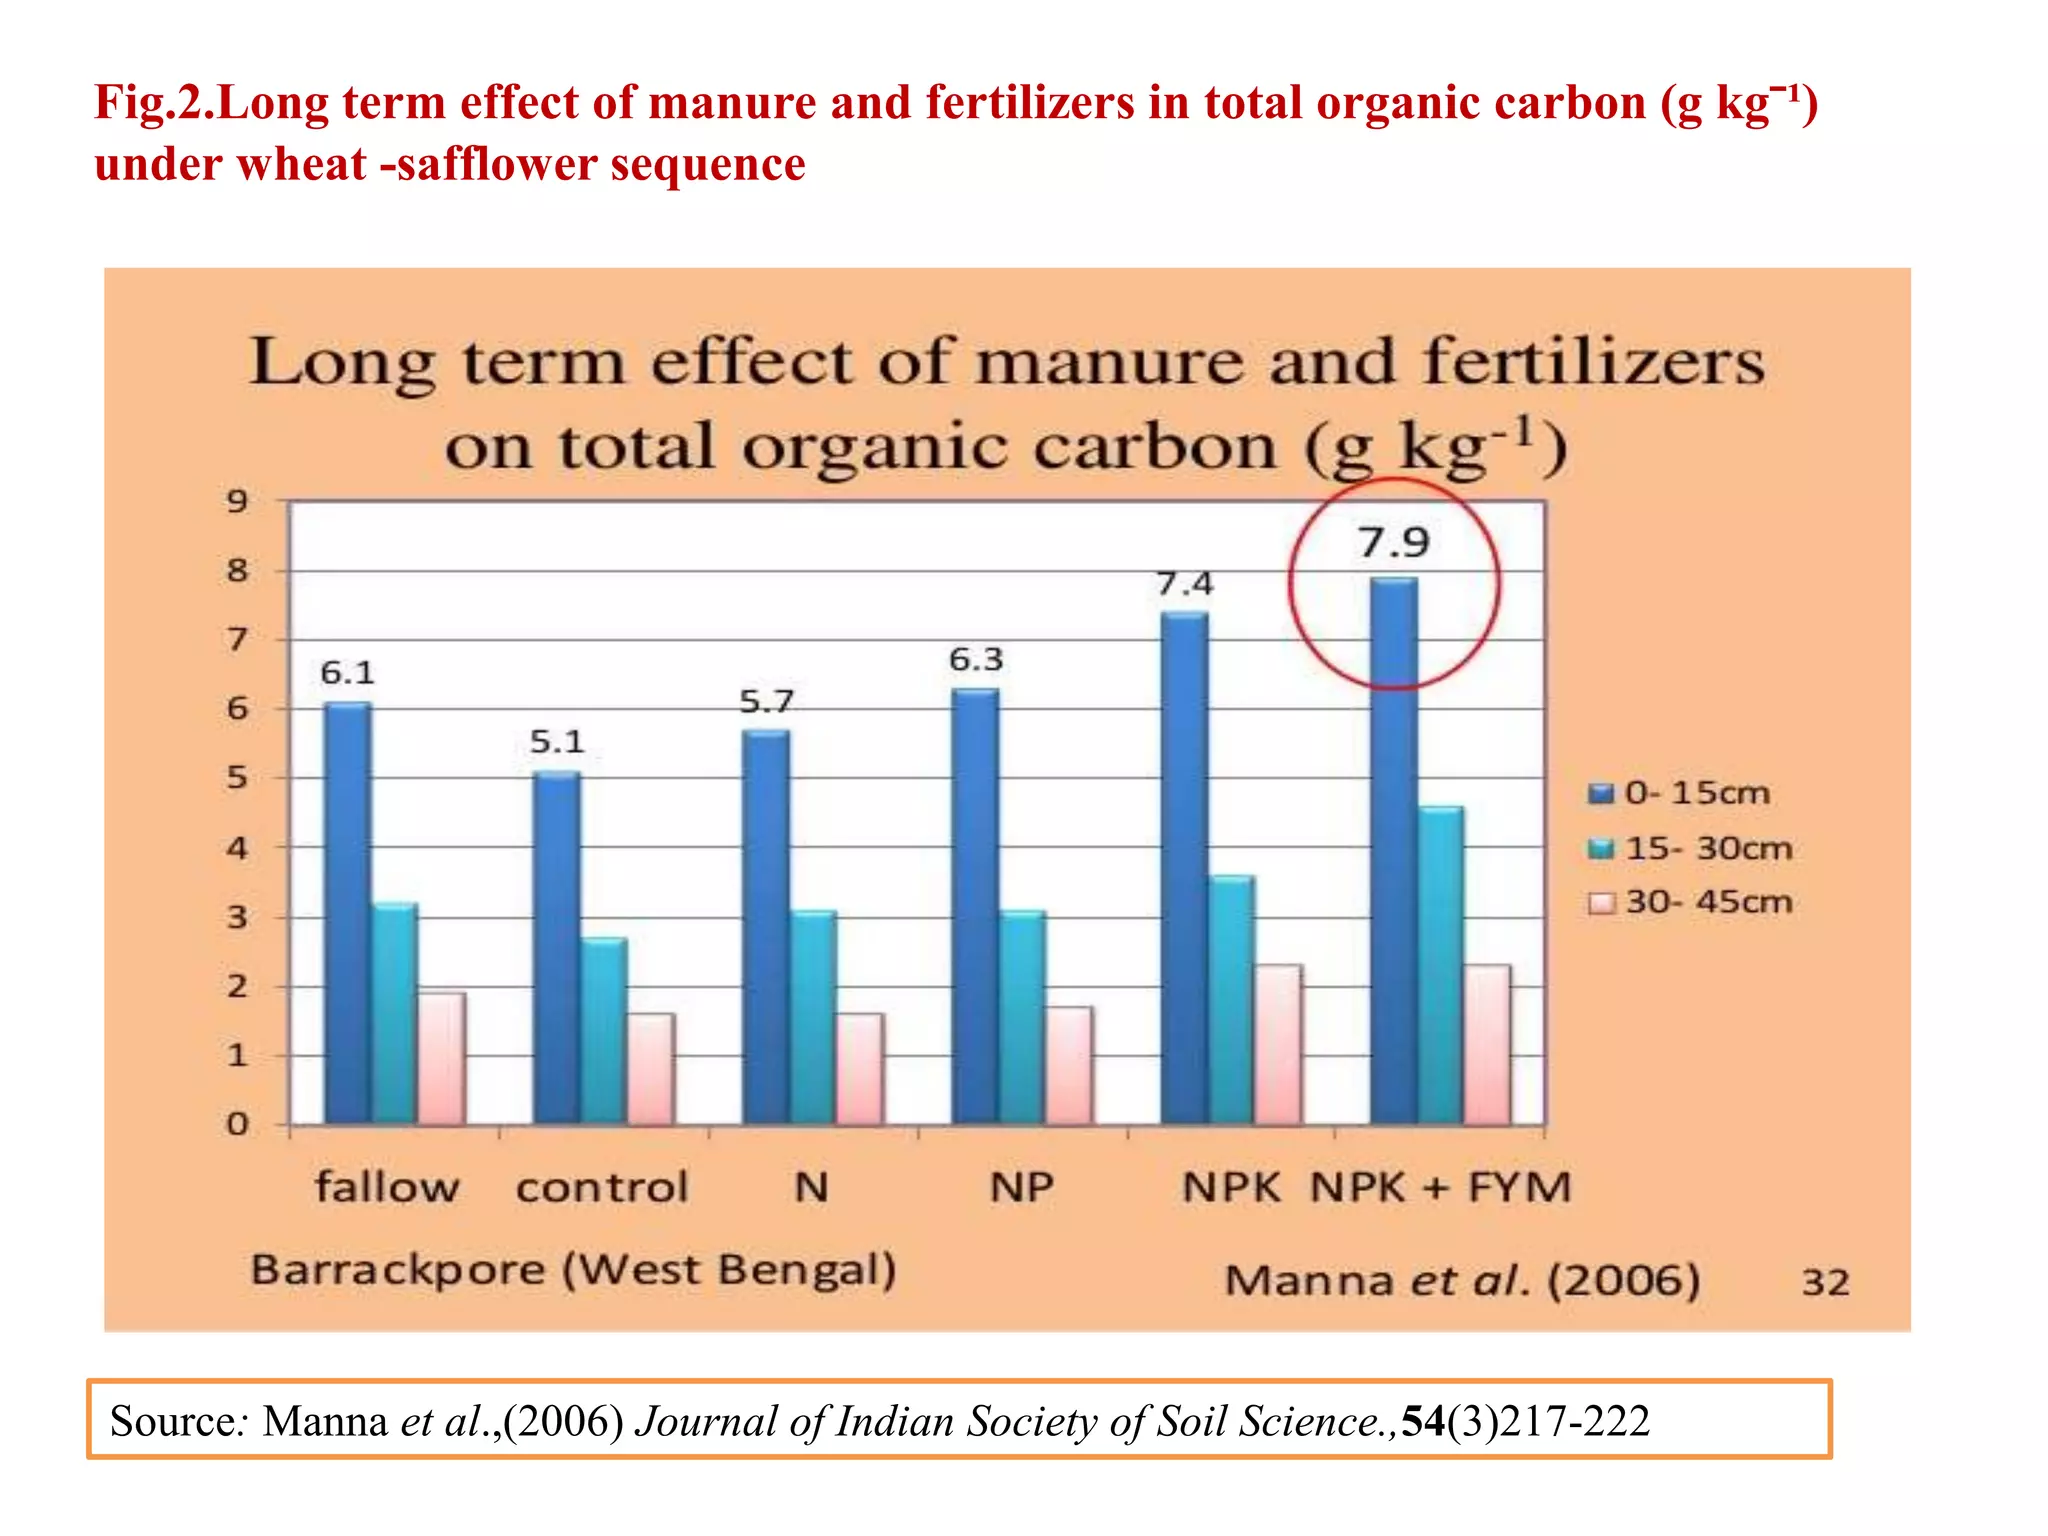
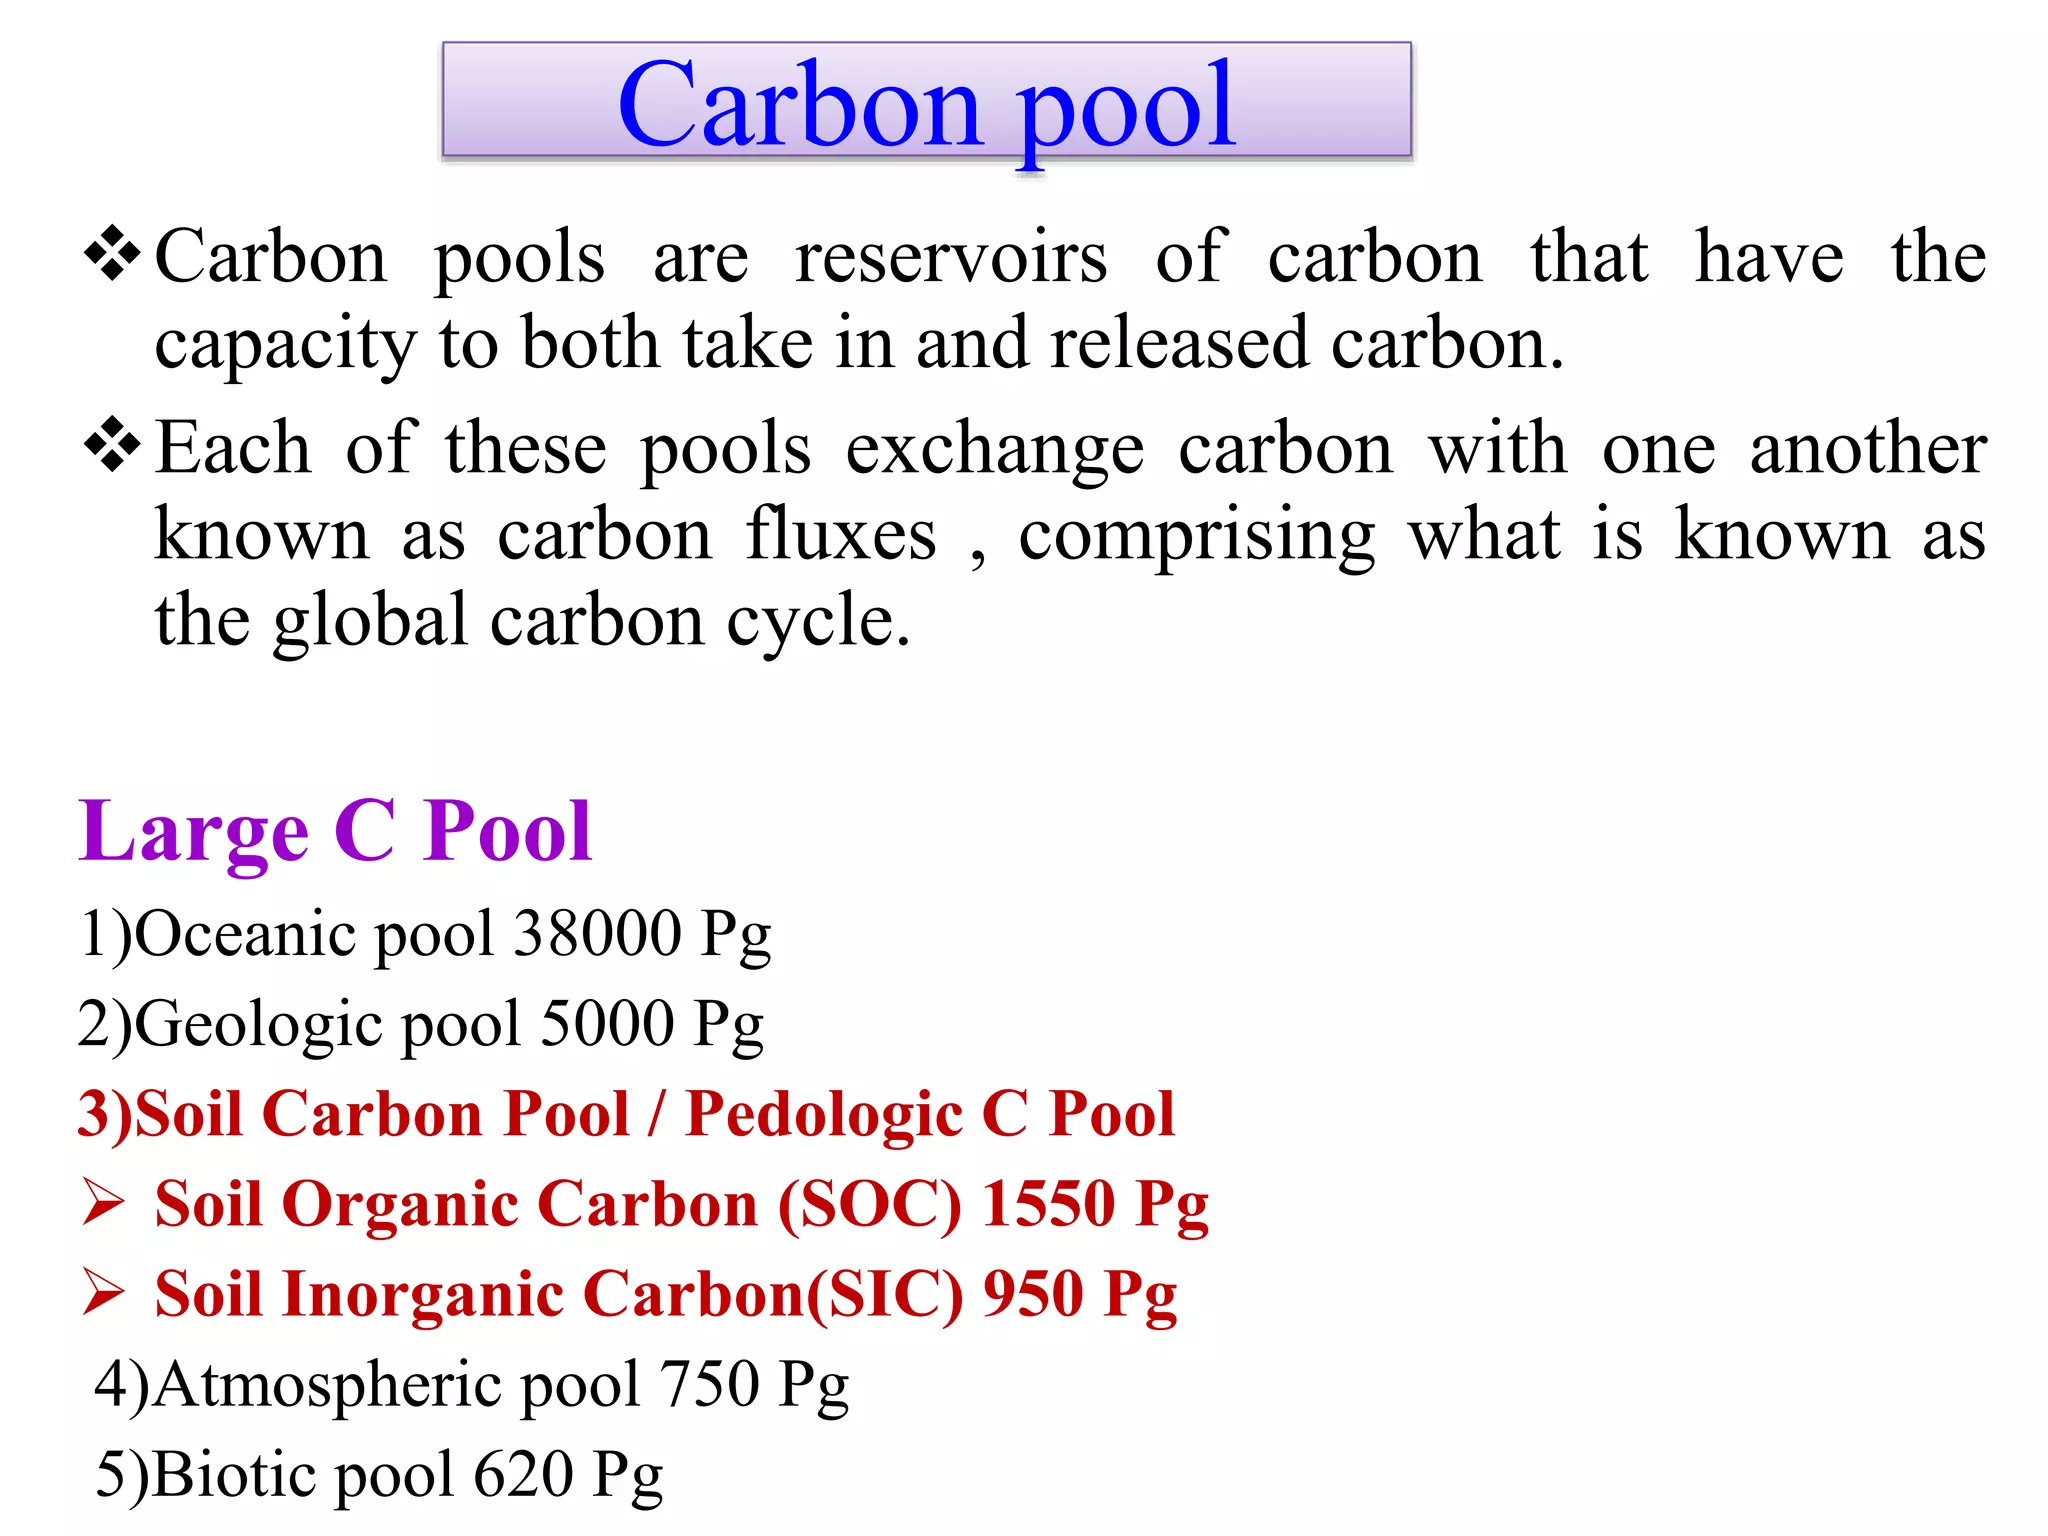
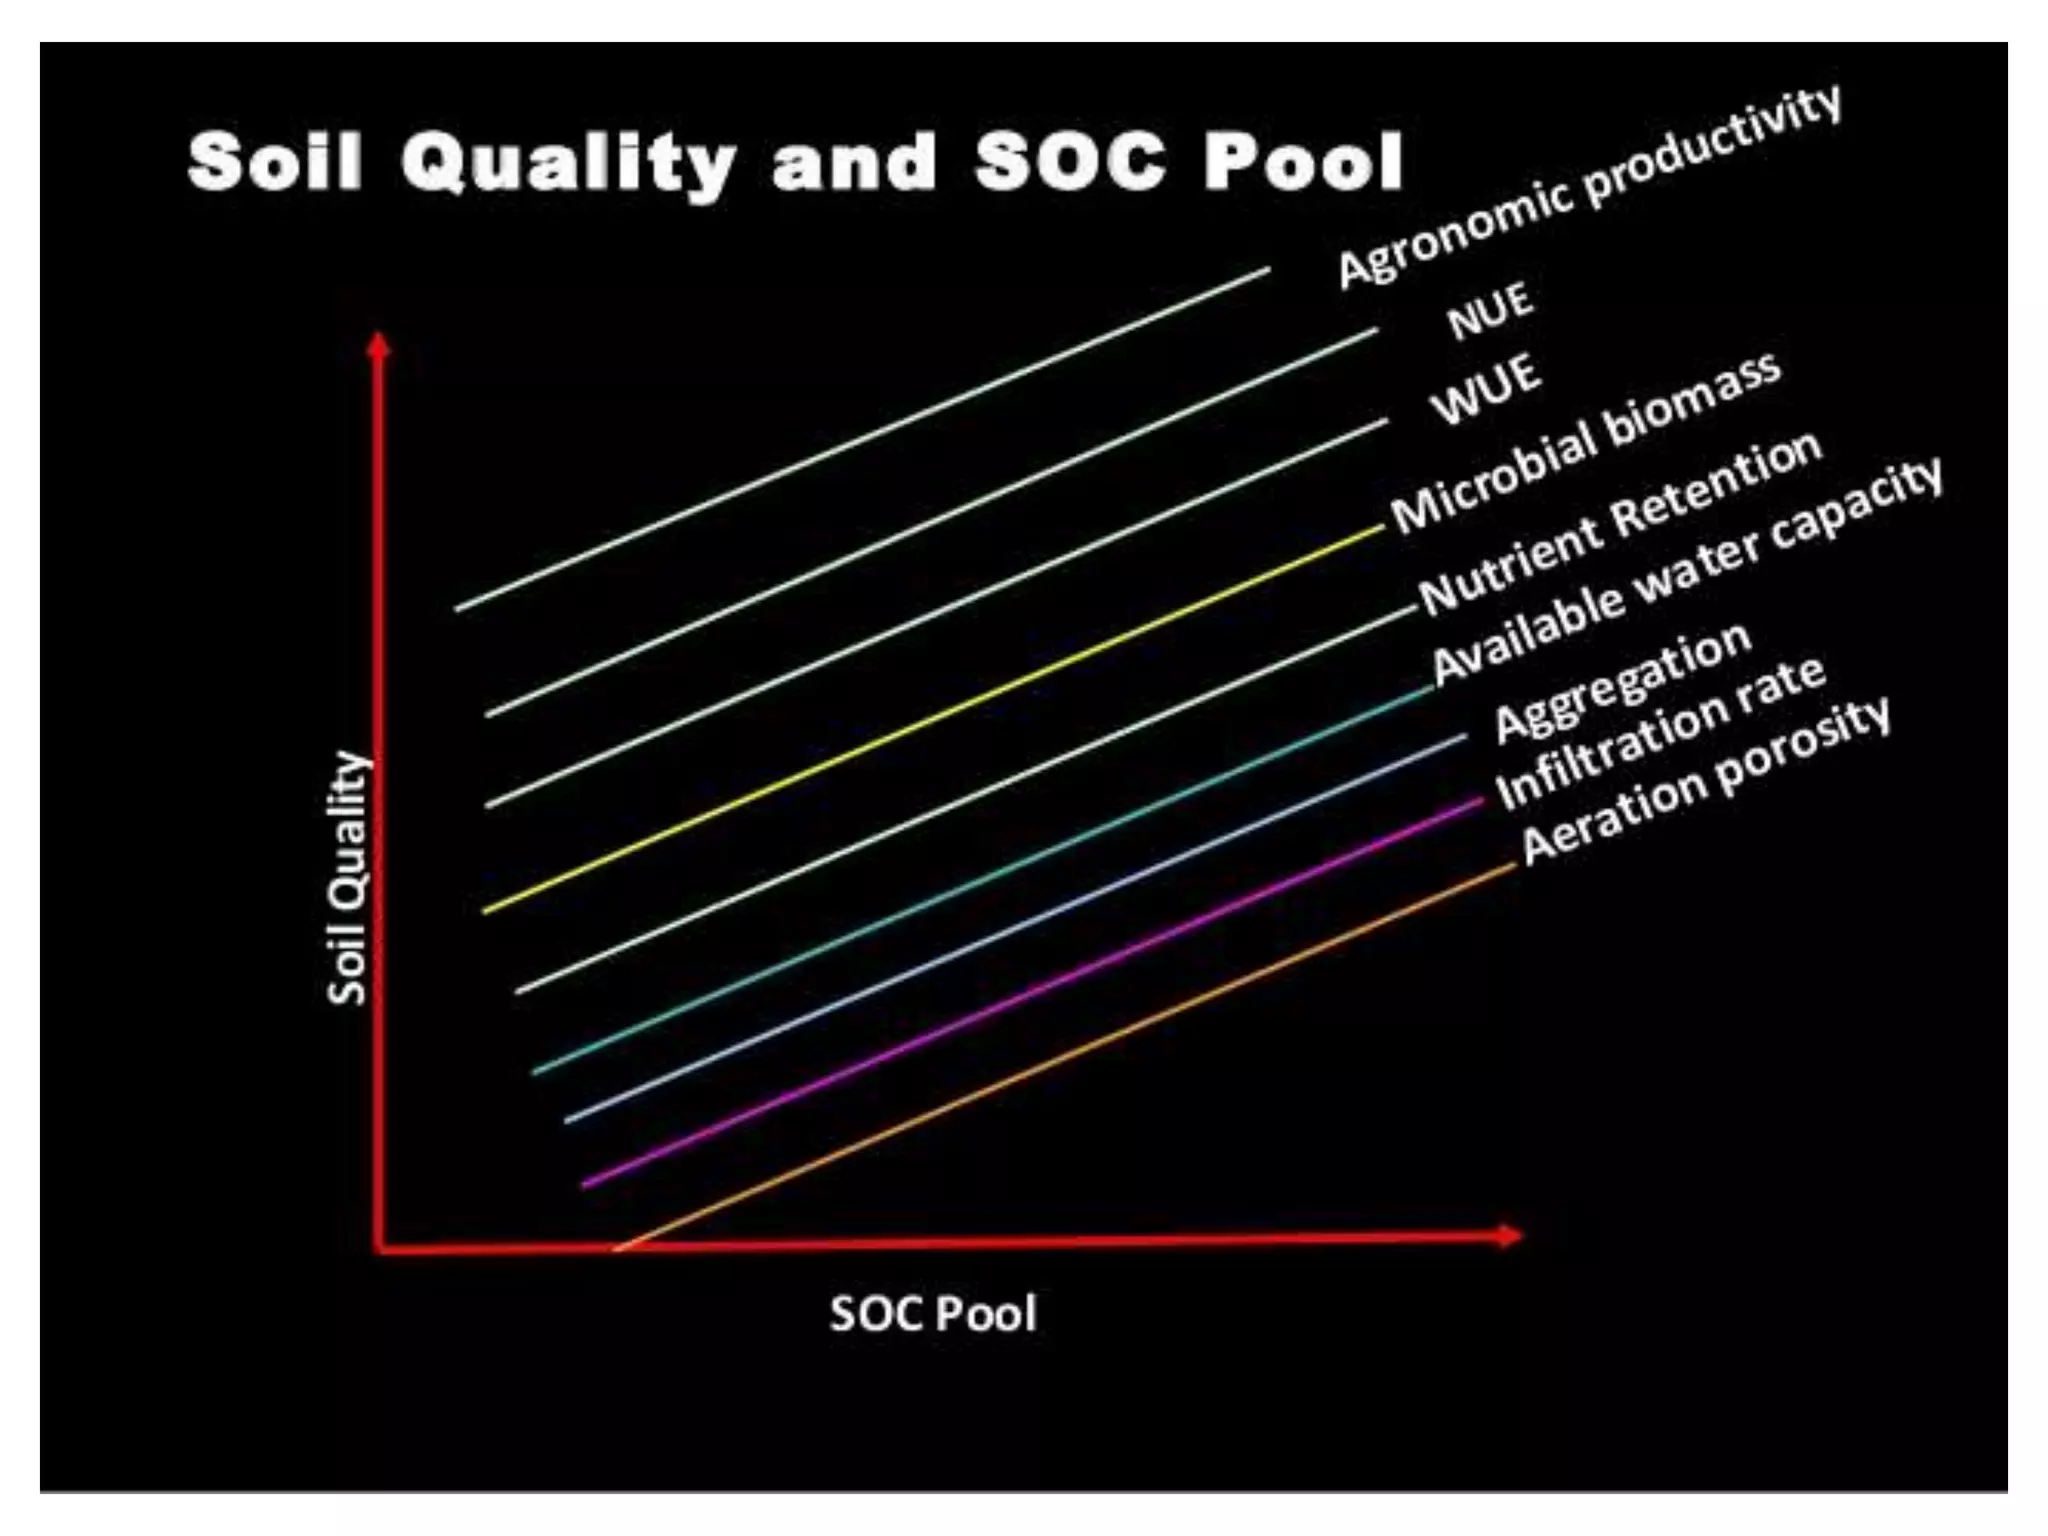
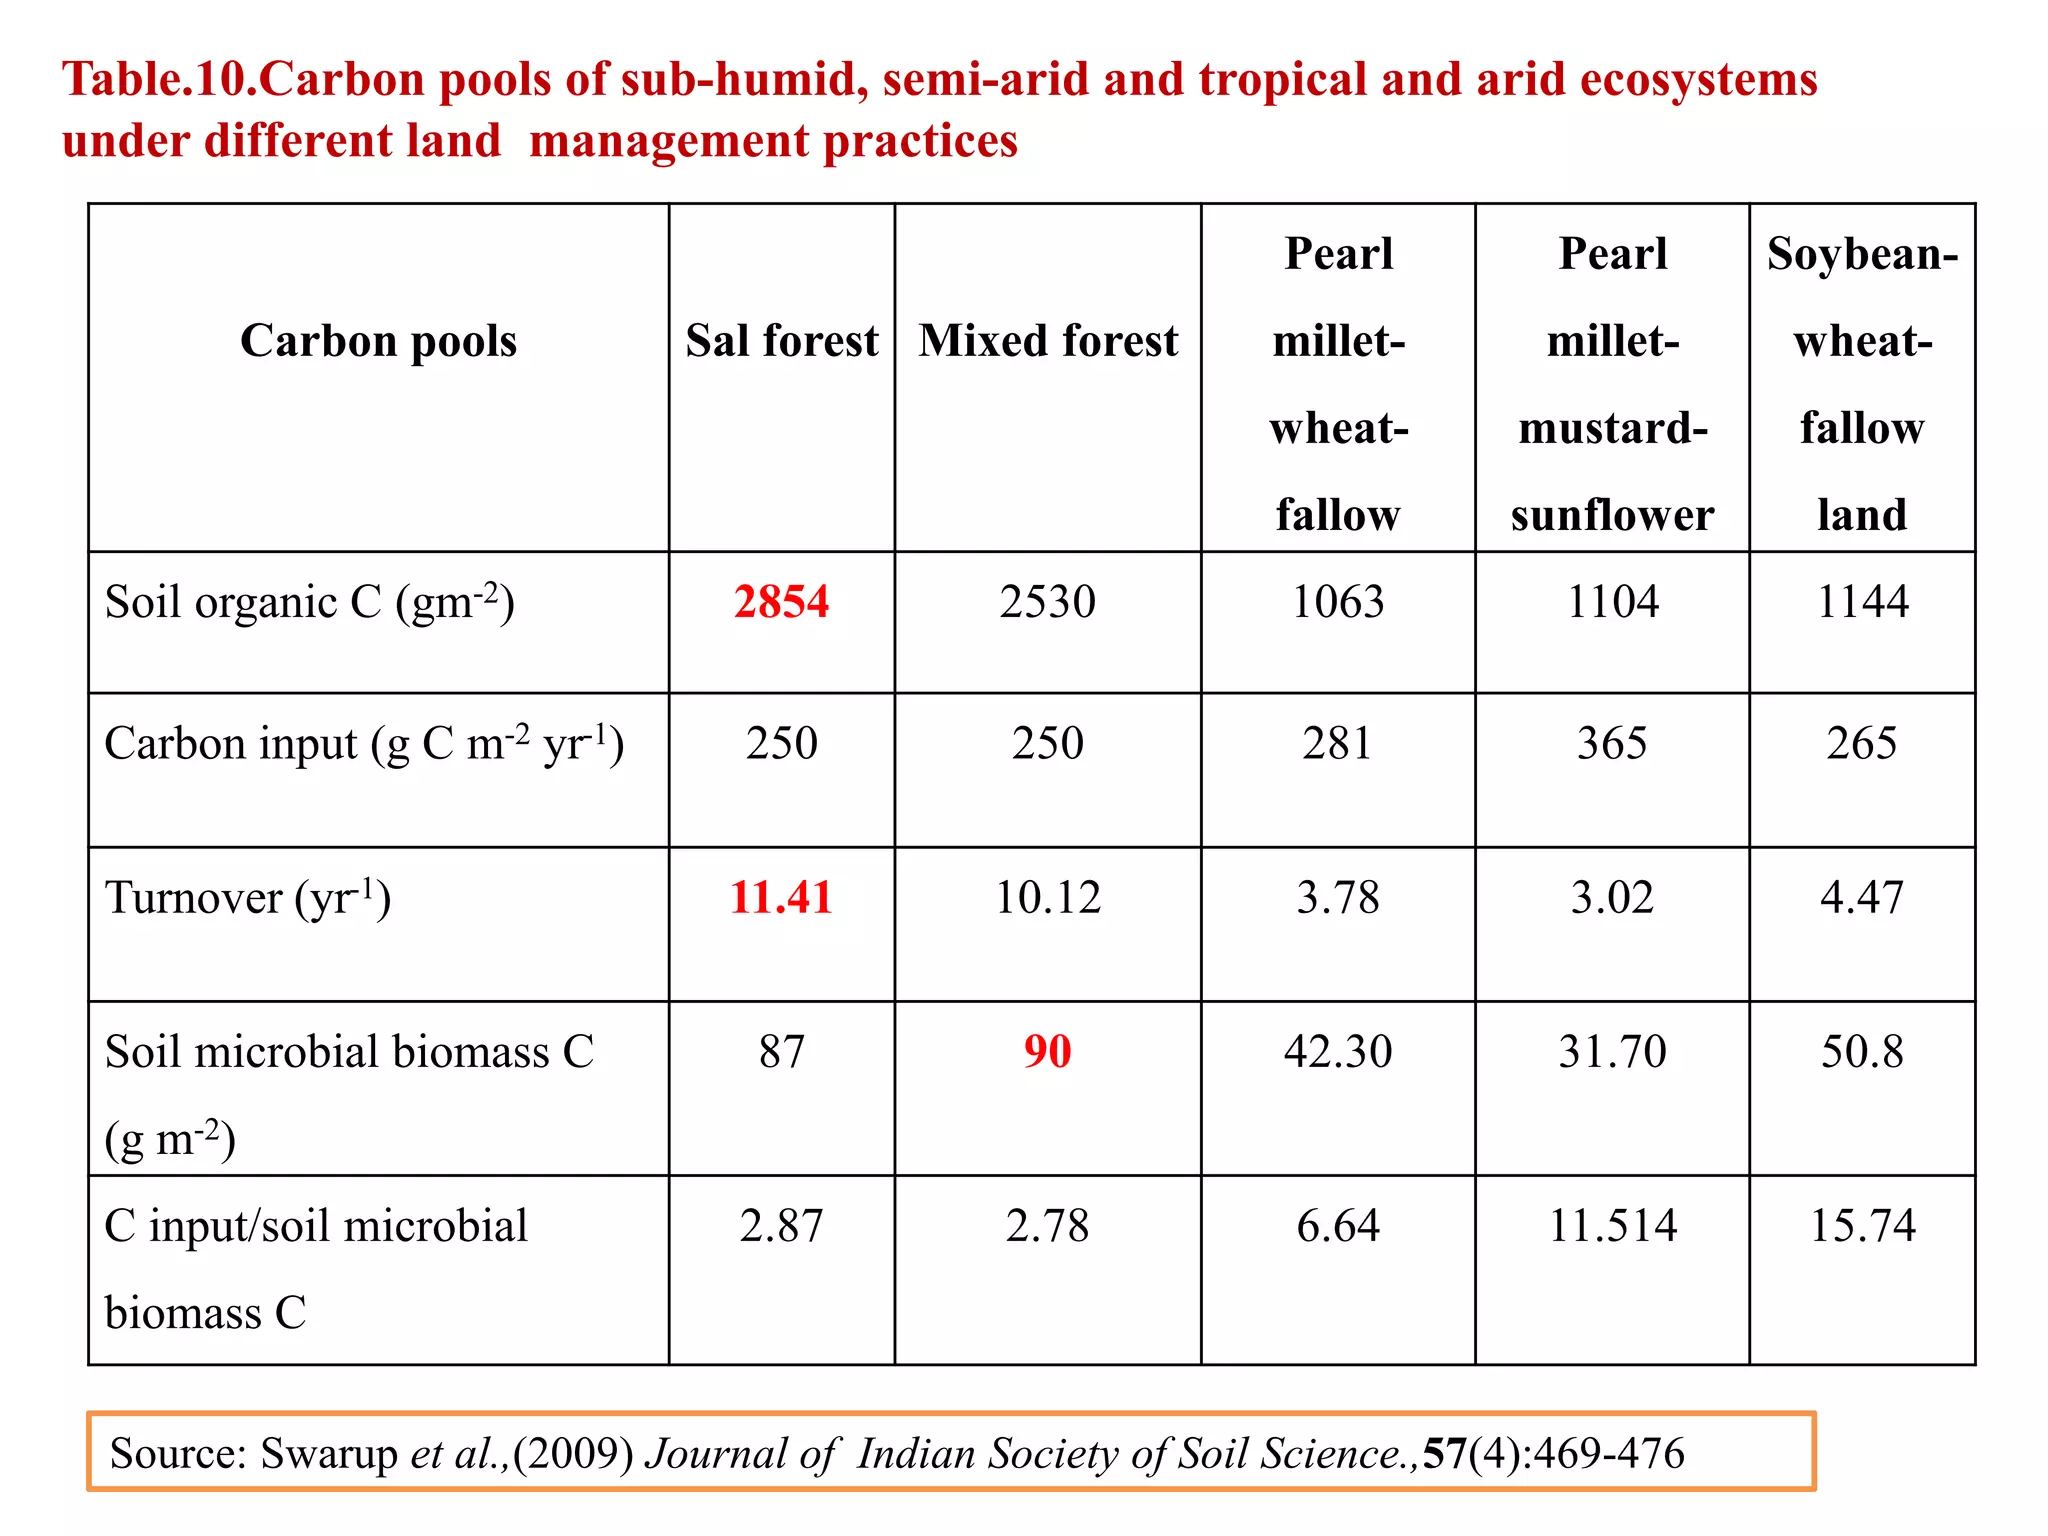
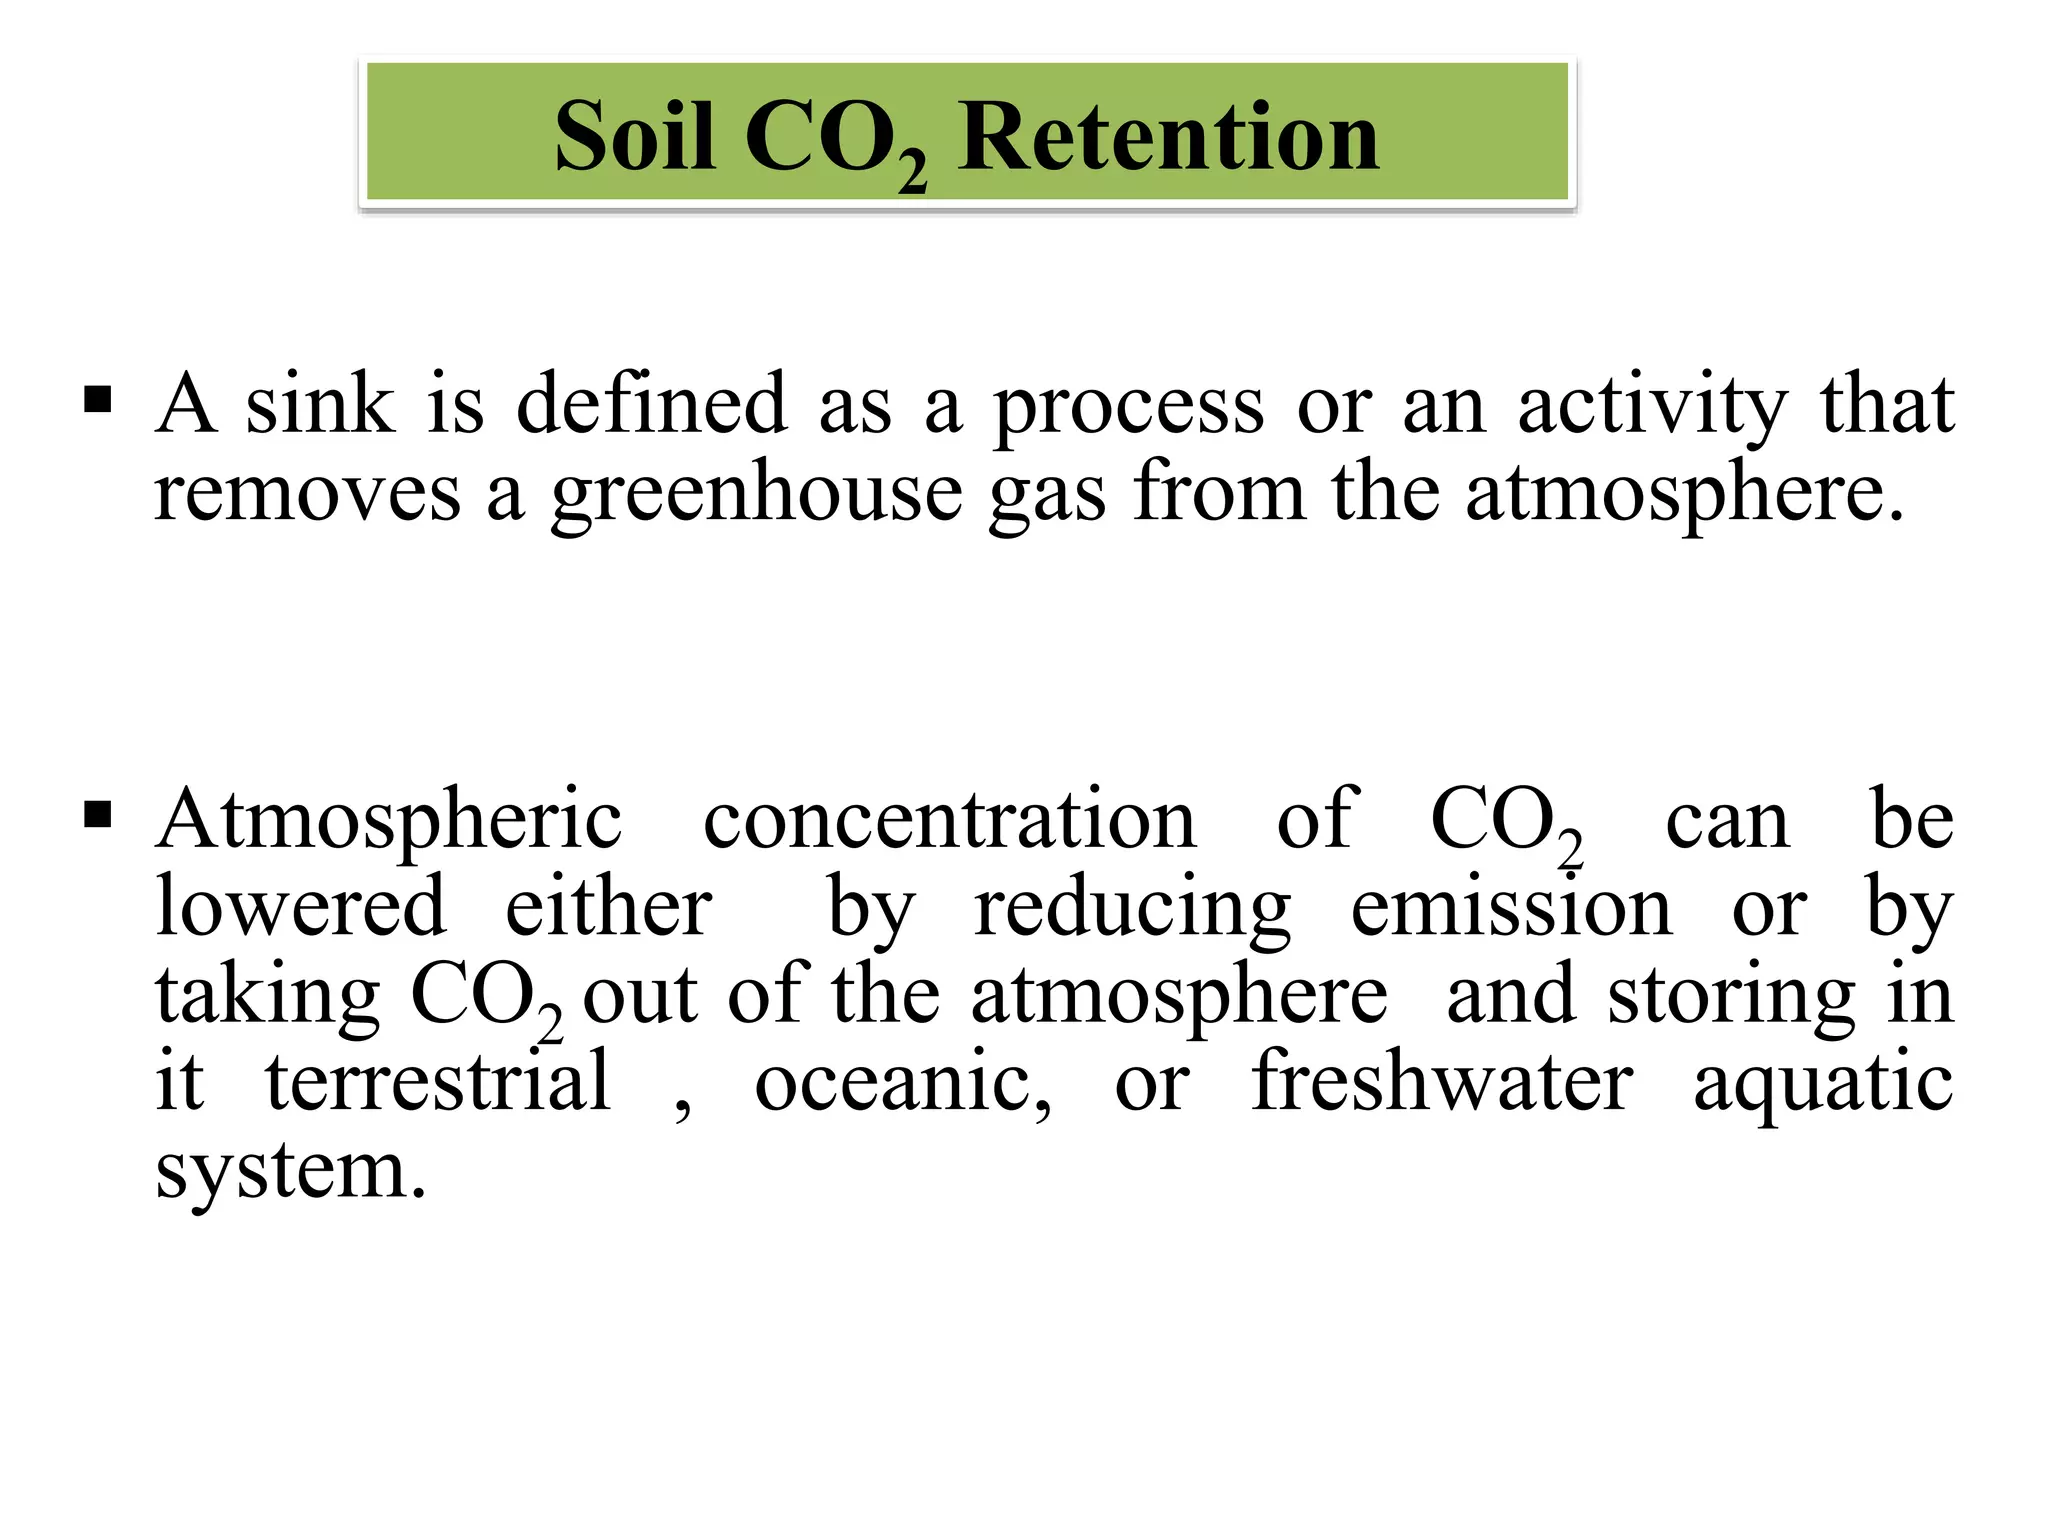
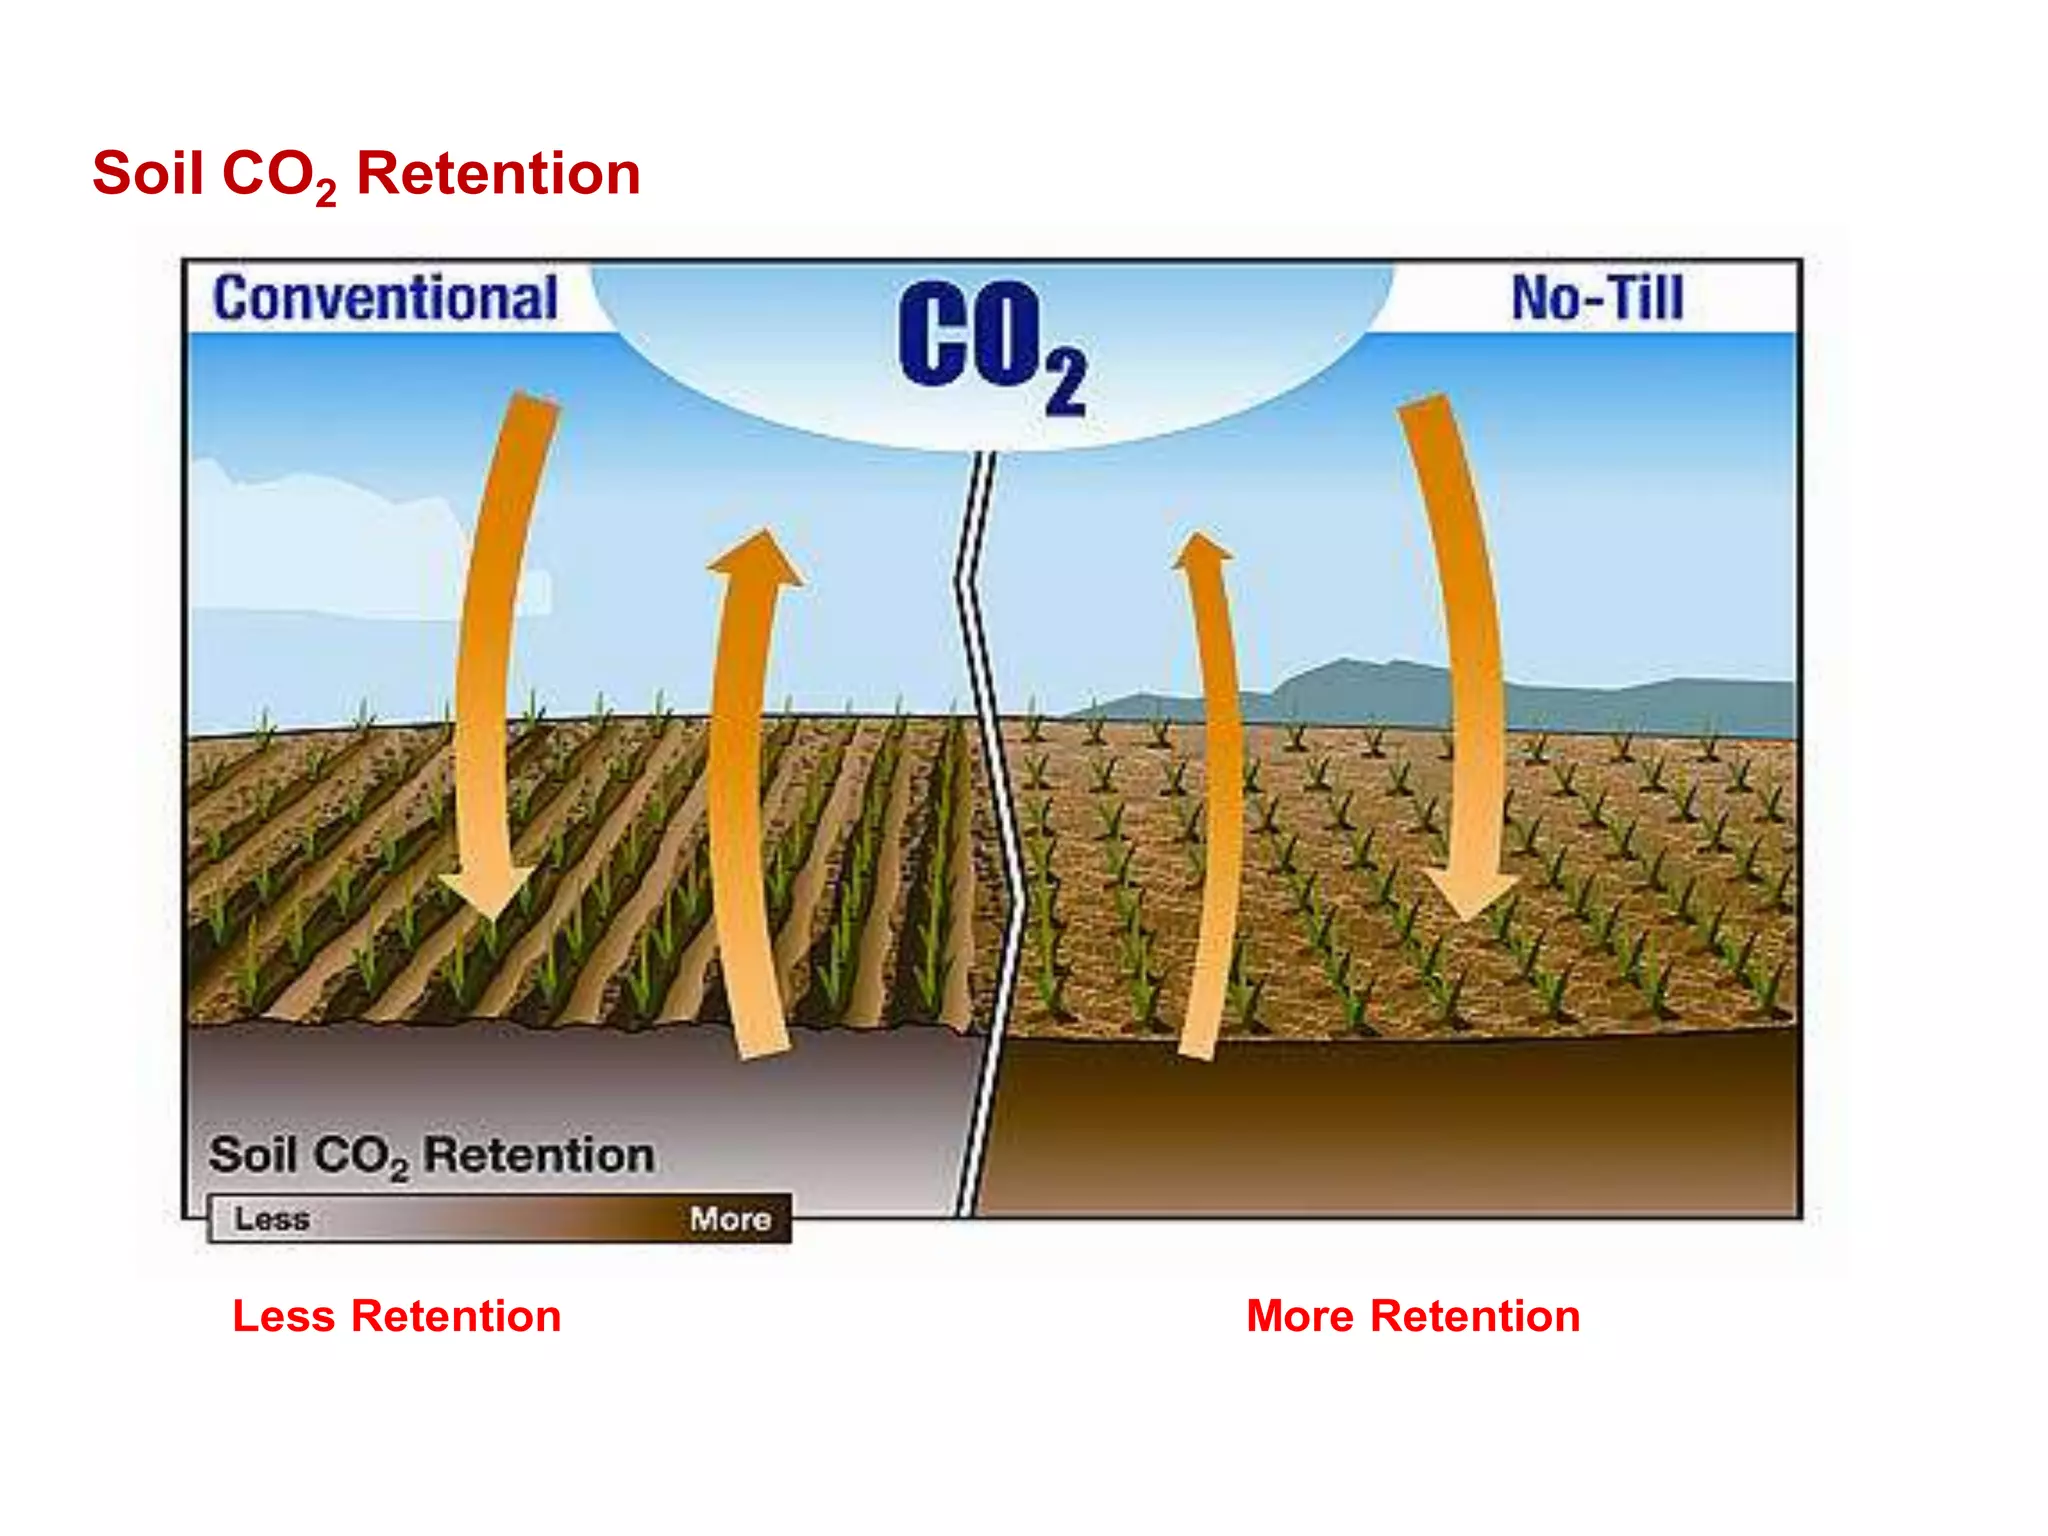
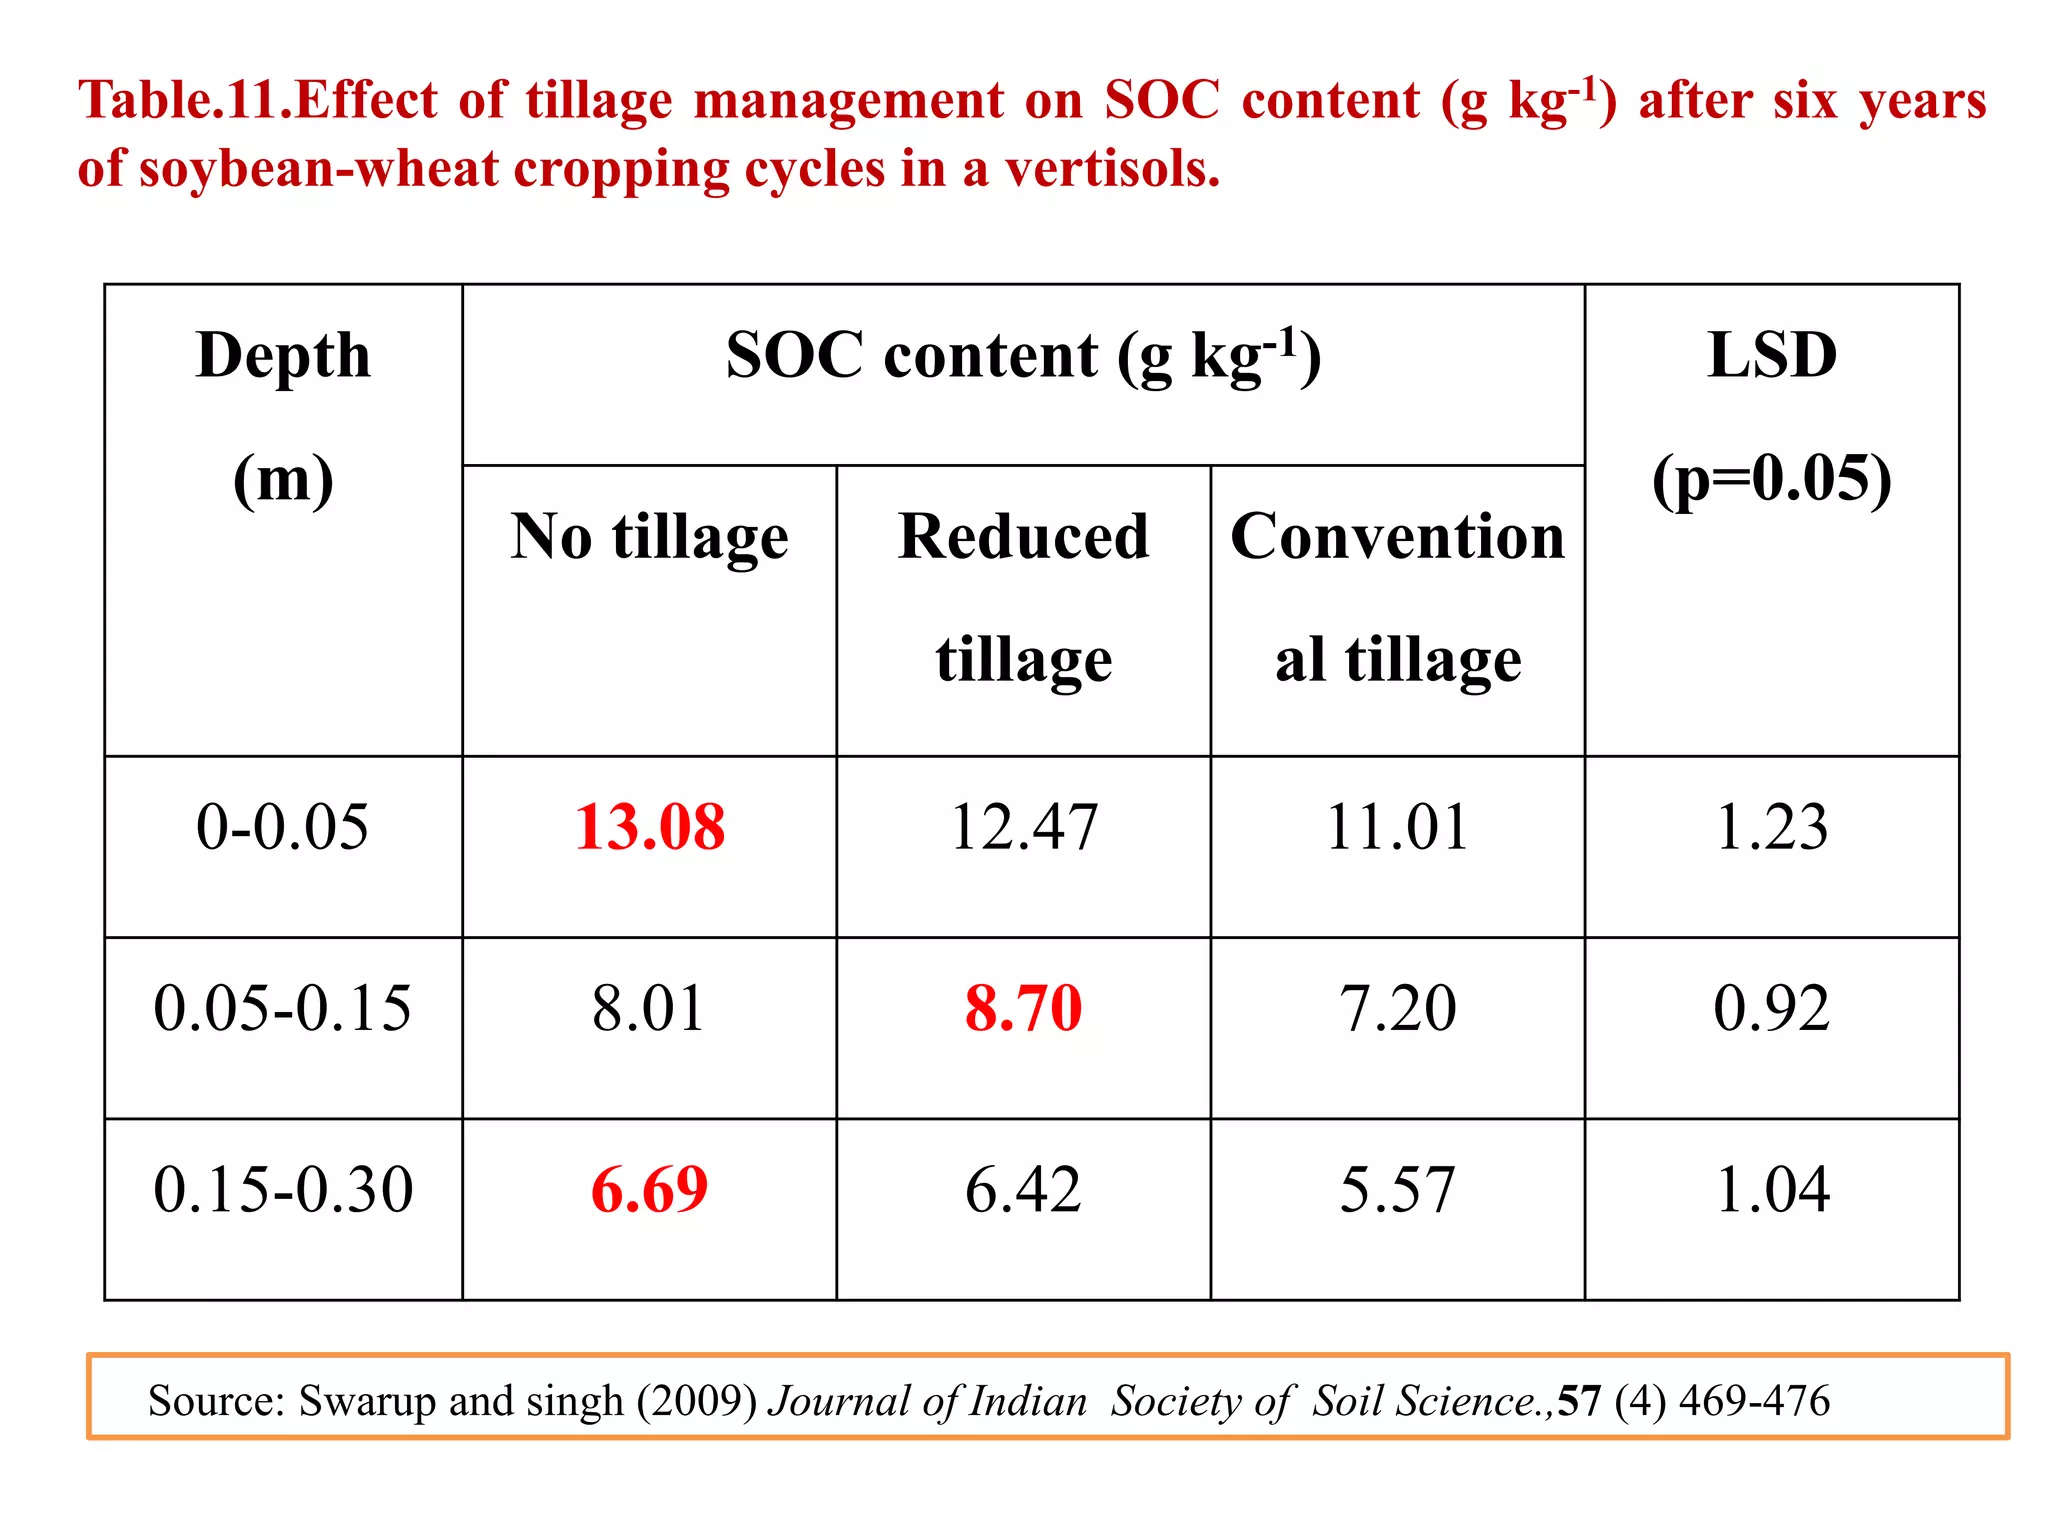
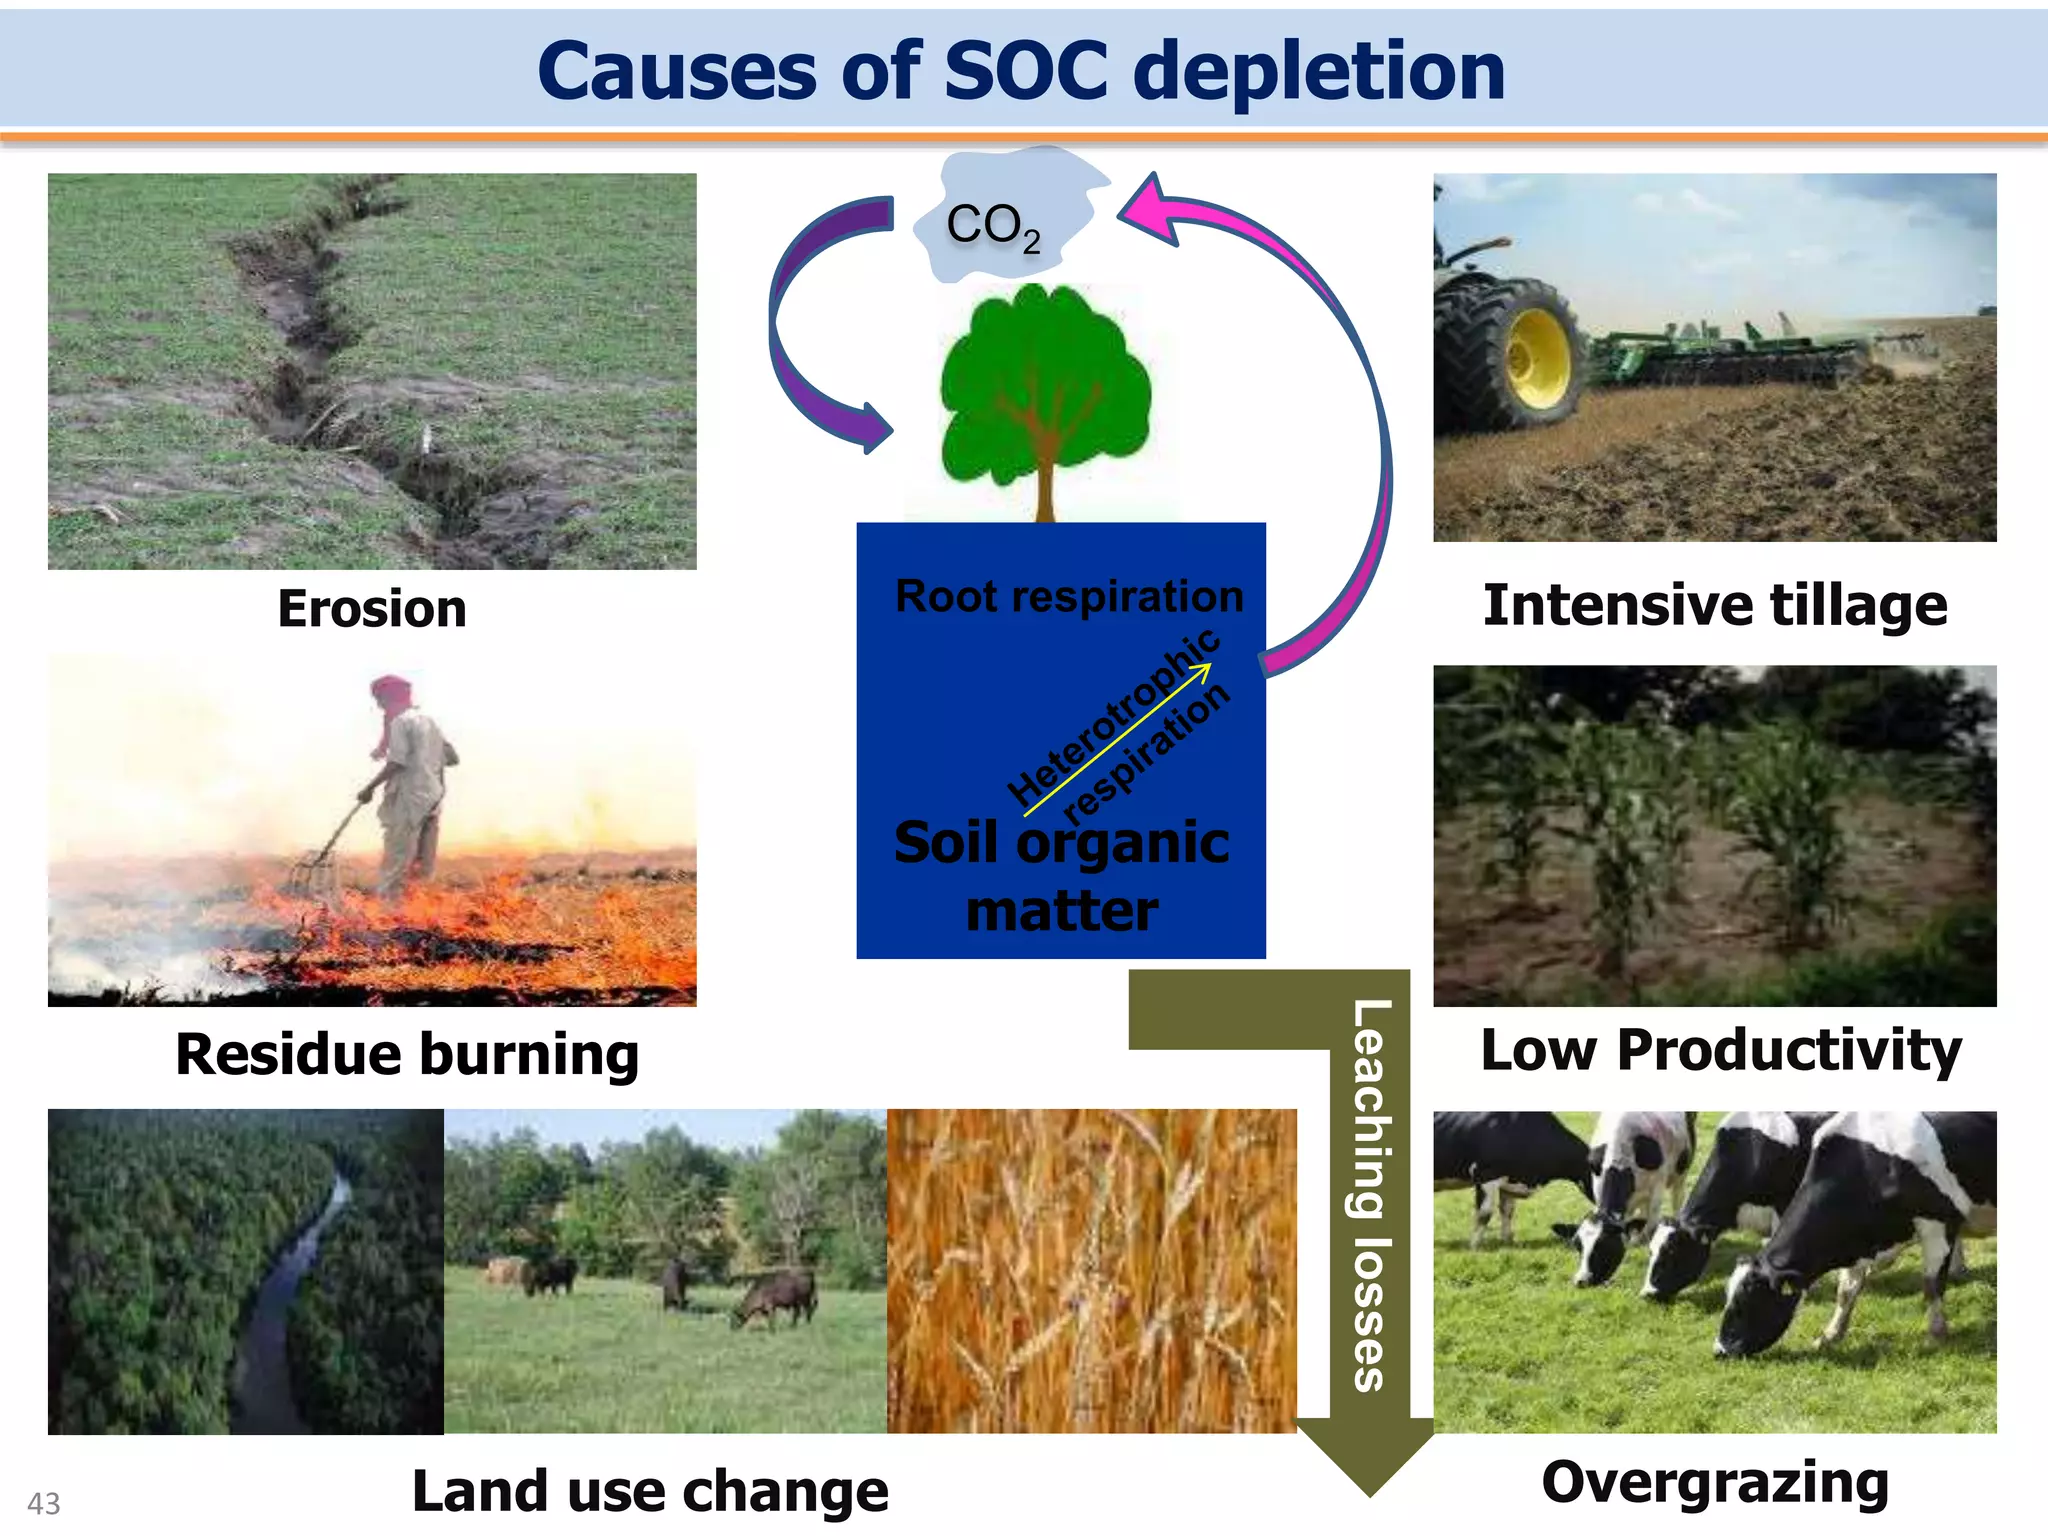
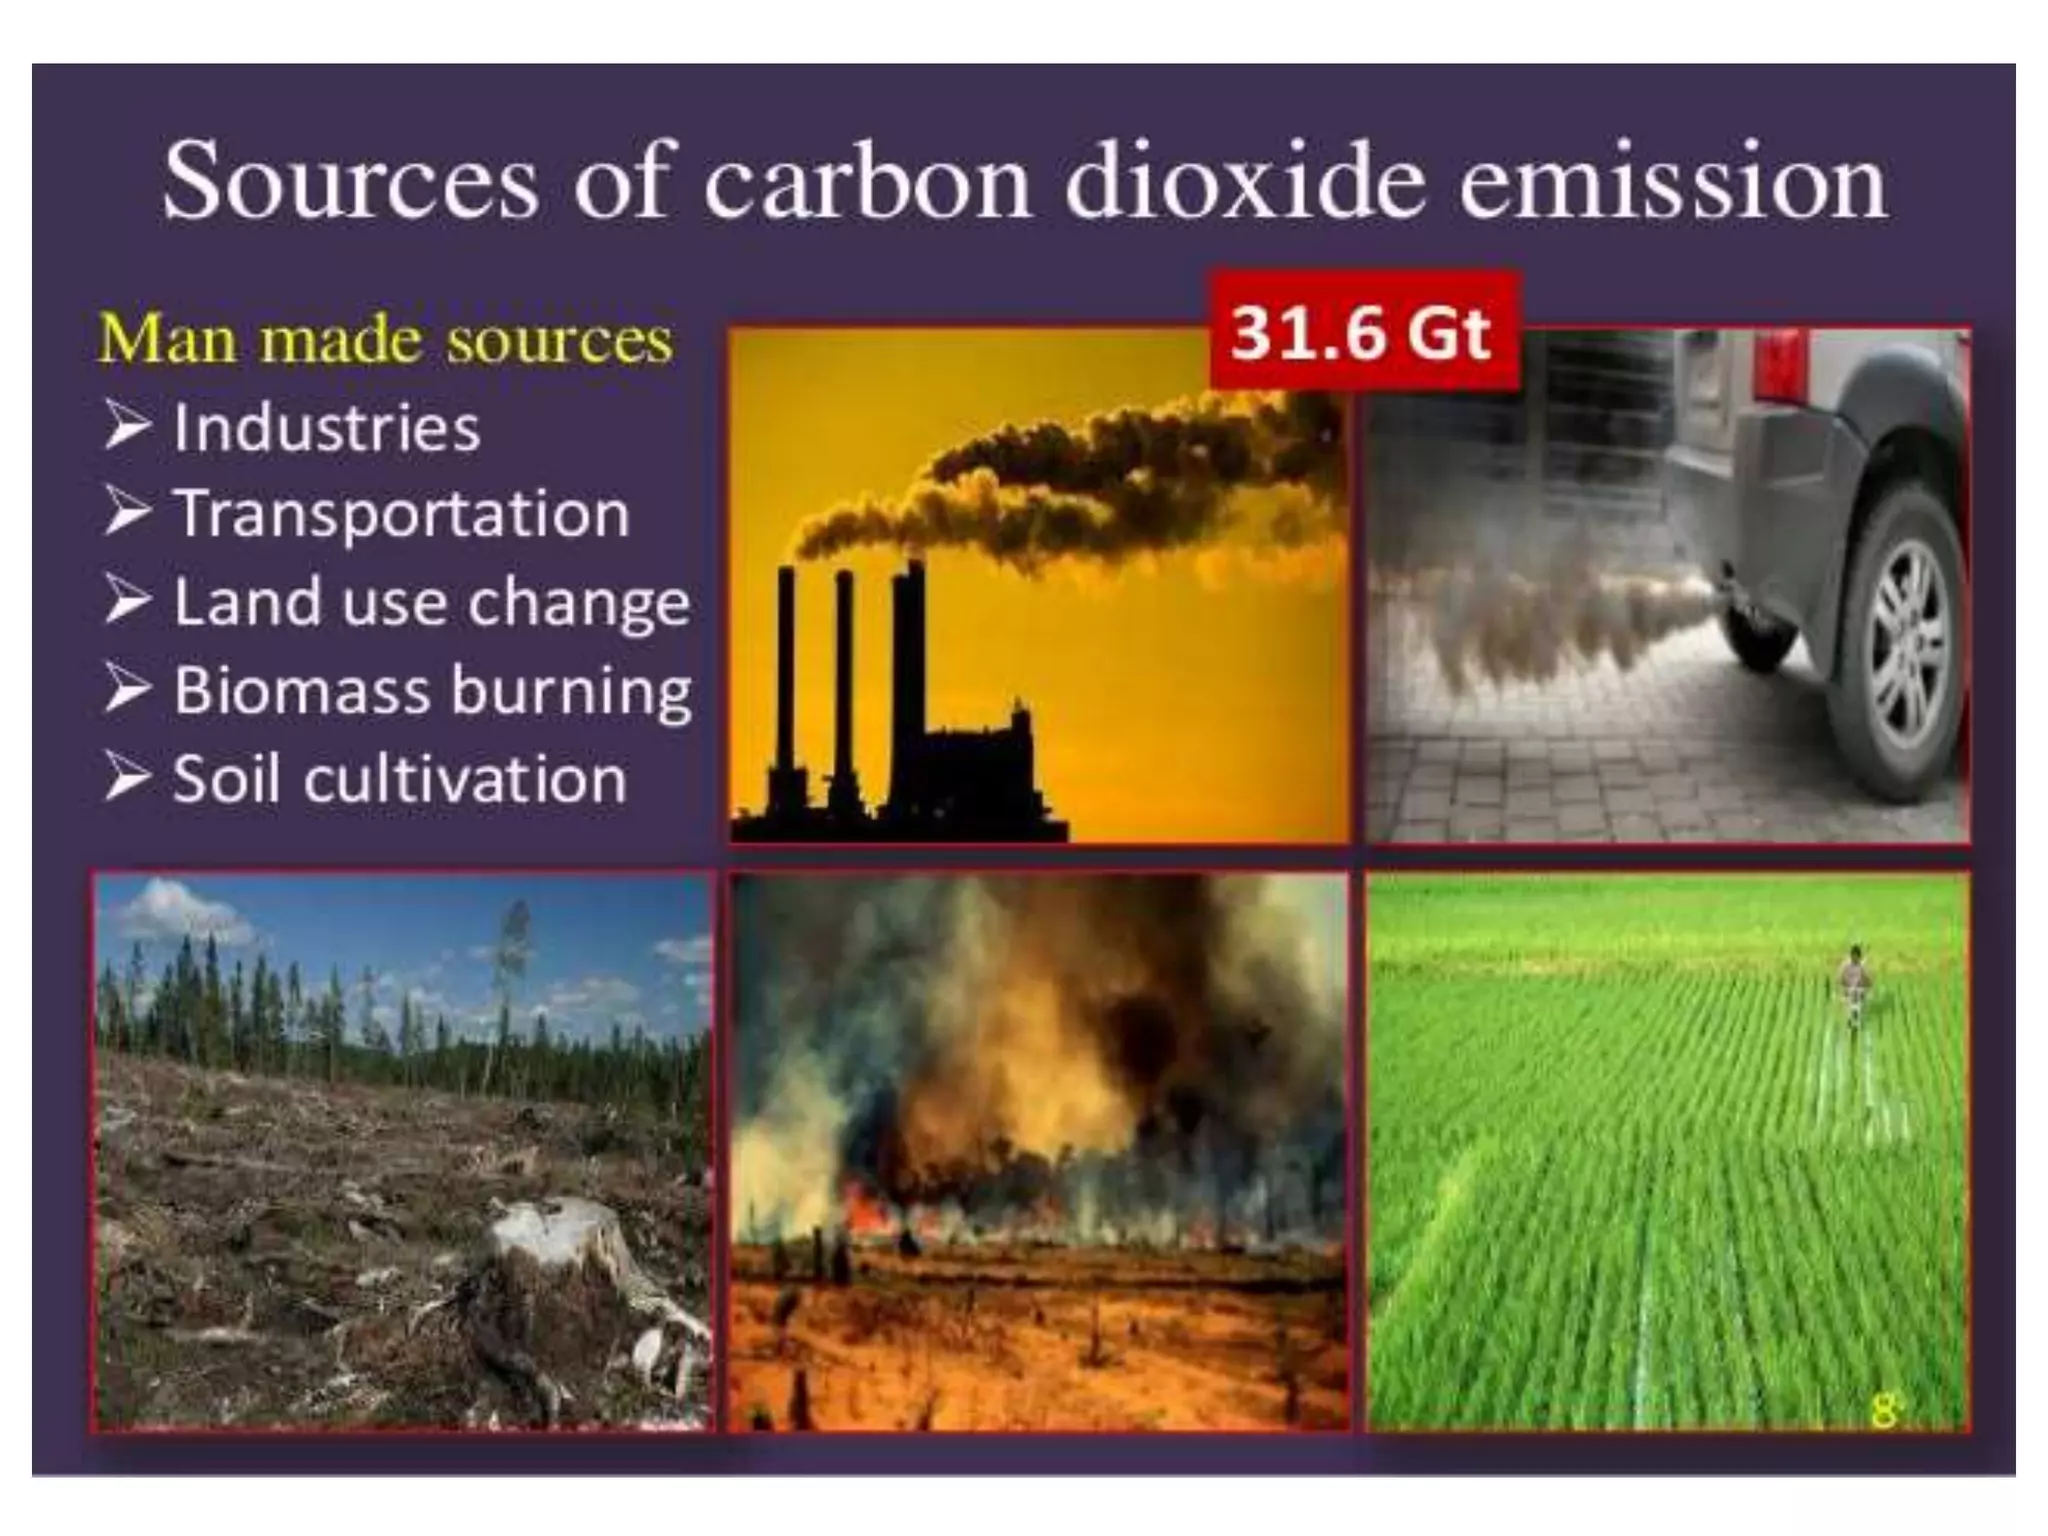
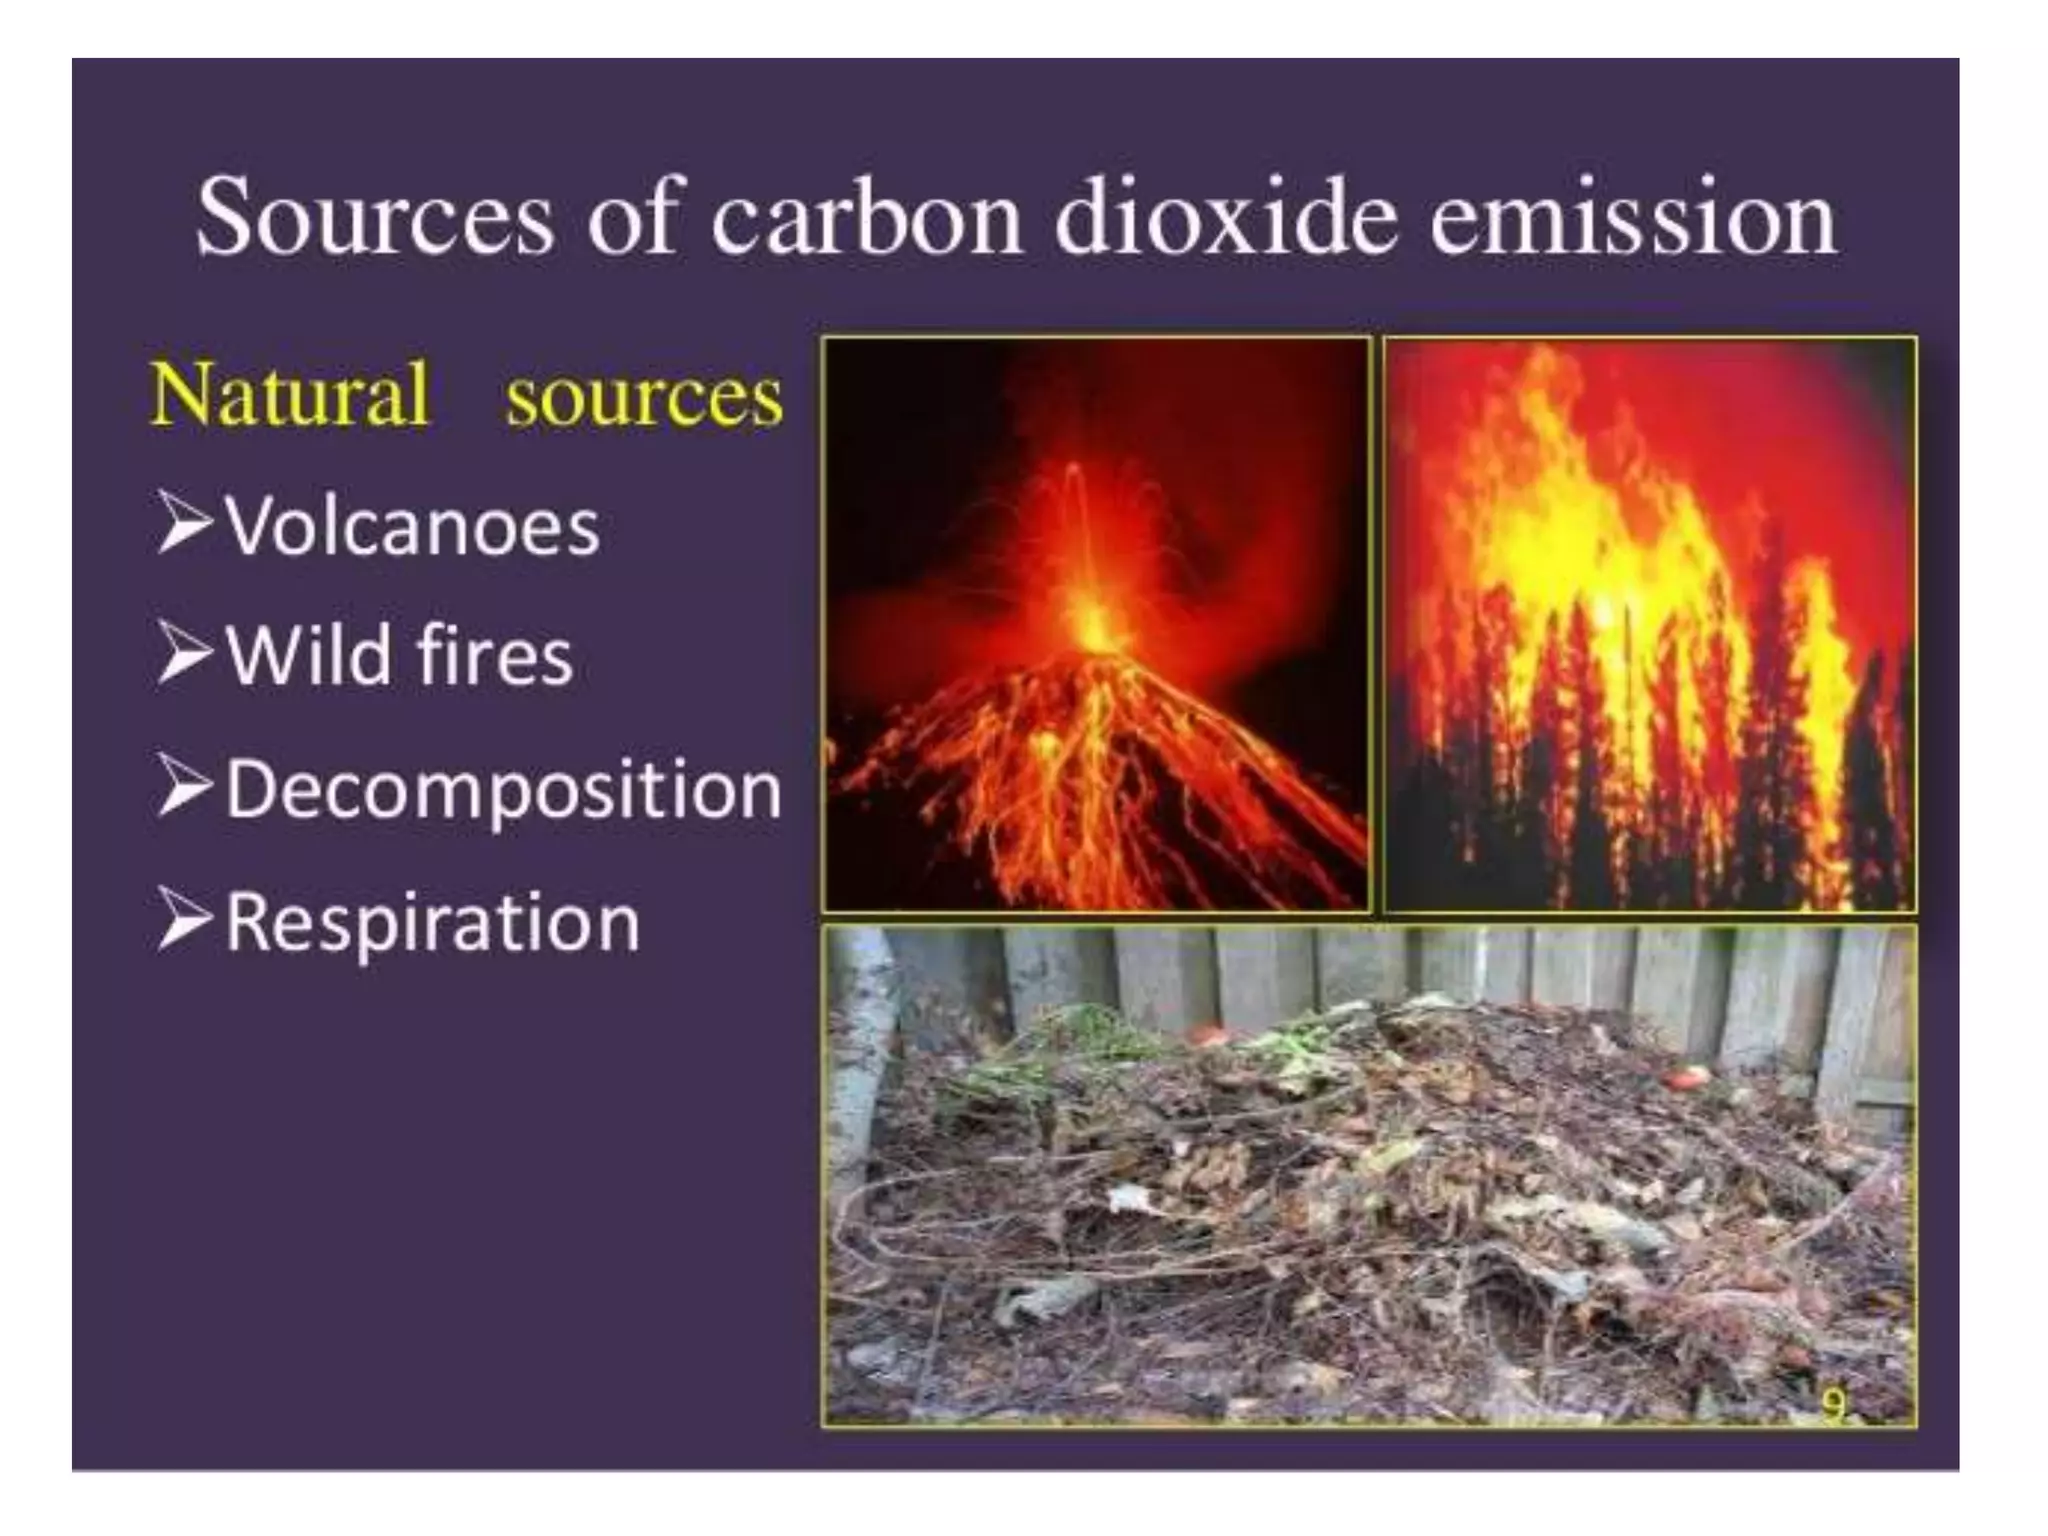
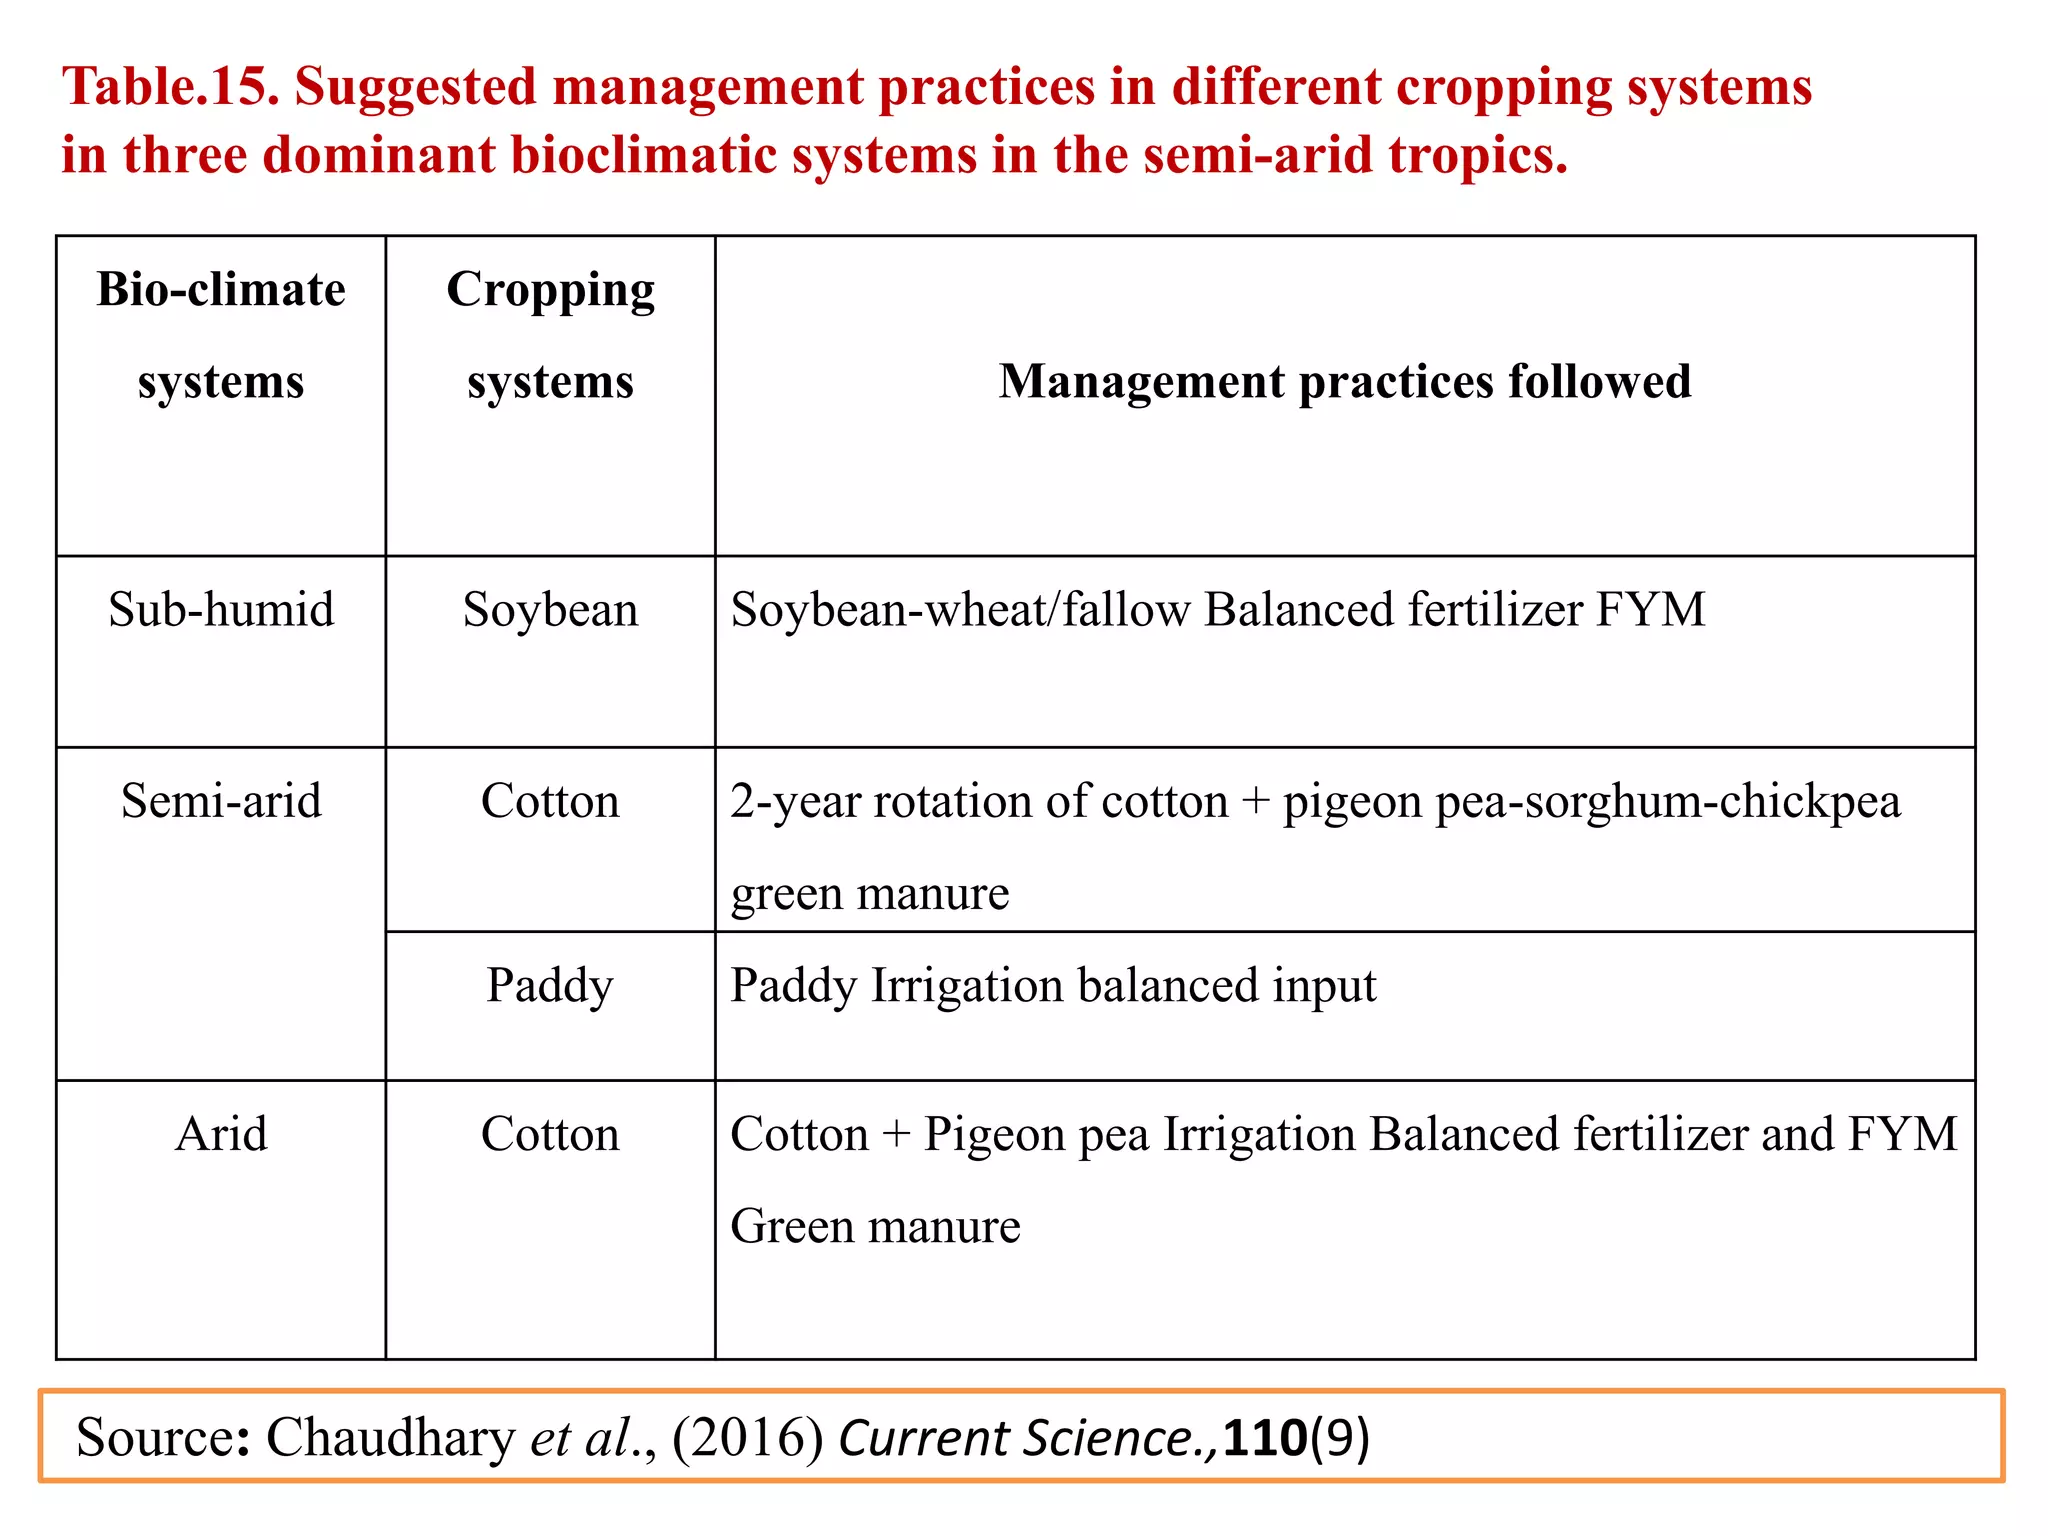
Seminar Topic
“SOIL CARBON DYNAMICS UNDER INTENSIVE CROPPING SYSTEMS’’
Submitted By
MISS. BHOSALE SNEHAL LAXMAN
Reg.No.2017 A/107M
Research Guide
Dr. SWATI. P. ZADE
ASSISTANT PROFESSOR,
College of Agriculture, Parbhani
VNMKV, Parbhani
Seminar Incharge
Dr. Syed Ismail
HEAD,
Department of Soil Science and Agricultural Chemistry
Submitted to
Department of Soil Science and Agricultural Chemistry
College of Agriculture,Parbhani.
Vasantrao Naik Marathwada Krushi Vidyapeeth ,
Parbhani
INTRODUCTION
 Soil is the largest carbon reservoir pool of terrestrial
ecosystem and plays a key role in the global carbon
budget and greenhouse effect.
 It contains 3.5% of the earth’s carbon reserve as
compared with 1.7% in the atmosphere , 8.9% in the
fossil fuels, 1.0% in the biota and 84.95% in the
oceans.
 Soil reserves about 1550 GT of carbon as Soil
Organic Carbon (SOC) and 1700 GT as carbonate
carbon (Soil Inorganic Carbon , i,e SIC)
Soil carbon(C) plays an important role in
exchange of CO2 between atmosphere and
biosphere.
SOC and SIC are important as it determine
ecosystem and agro-ecosystem functions
influencing soil structure ,soil fertility ,water
holding capacity , cation exchange capacity and
other soil characteristics.
What is Soil Carbon
It is also of global importance because of its role in the
global carbon cycle and therefore, the part it plays in
the mitigation of atmospheric levels of greenhouse
gases (GHGs) with special reference to CO2.
Soil organic carbon (SOC) is a source and sink of
carbon dioxide emisions to and from the atmosphere,
thus influencing future climate change.
The knowledge of soil organic carbon in terms of its
amount and quality is essential to sustain the quality
and productivity of soils.
Carbon is the simplest element on
the periodic table that also has four
valence electrons
Carbon
The Element
of Life
 Soil organic carbon (SOC) is building block for all
life on the earth and it is associated with soil organic
matter.
 Soil organic matter (SOM) is the well decomposed
plant and animal residues as well as soil microbial
organisms.
 It is an important component that regulates most of
the soil properties and it serves as an indicator for
assessing soil quality and climate change
phenomenon.
Why Carbon is Important in Agriculture
Soil organic carbon (SOC) is building block for all life on the earth.
Source: www.http google.in/Carbon cycle in agriculture.
What is Soil Carbon Dynamics
 Soil contain the largest dynamic reservoir of carbon on
Earth – larger than that stored in the atmosphere and
vegetation combined. This makes soils a critical
component of the global carbon cycle. Soil Carbon (C) is
mostly bound in what we call “Soil organic
matter”(SOM).
 SOM improves soil physical ,chemical and biological
properties.
 Increase in soil Organic Carbon (SOC) improve soil
health.
What is Carbon sequestration
Table.1.Carbon stock in Indian soils (Order-wise)
Soil order Soil depth
range (m)
Carbon stocks (pg)
SOC SIC TC
Entisols 0.03 0.62 0.89 1.51
0-1.5 2.56 2.86 5.42
Vertisols 0.03 2.59 1.07 3.66
0-1.5 8.77 6.14 14.90
Inceptisols 0.03 2.17 0.62 2.79
0-1.5 5.81 7.04 12.85
Aridisols 0.03 0.74 1.40 2.14
0-1.5 2.02 13.40 15.42
Molisols 0.03 0.09 0.00 0.09
0-1.5 0.49 0.07 0.56
Alfisols 0.03 3.14 0.16 3.30
0-1.5 9.72 4.48 14.20
Ultisols 0.03 0.20 0.00 0.20
0-1.5 0.55 0.00 0.55
Total 0.03 9.55 4.14 13.69
0-1.5 29.92 33.98 63.90
Source: Bhattacharya et.al.,(2009) Journal of Indian Society of Soil Science.,57(4):461-468
.
Fig.1. Distribution of carbon stock (total, organic and inorganic) in Alfisols,
Inceptisols and Vertisols and associated soils for 0–60 cm soil depth
Source : Venkanna et al., (2014) Current Science., 106 (4) : 604-611
Soil Order SOC
(%)
SIC
(%)
TC
(%)
SMBC
(µg kgˉ¹)
CO2
Mg CO2 kg
-124 hr-1
Entisols 1.830 2.759 4.88 1094.21 14.40
Inceptisols 2.246 2.698 7.944 1387.84 27.64
Vertisols 2.112 3.918 5.412 1223.18 20.62
Table.2.Soil organic status of various soil types of Maharashtra
Source: Malode K.R. (2013) Organic carbon mapping of agro-ecological zones of
Marathwada region of Maharashtra state.,Ph.D Thesis.,VNMKV Parbhani.
Table.3.Soil organic carbon stock in different cropping systems
Location Soil order Treatment OC
(%)
BD
(Mg m-3)
SOC stock
(Kg ha-1)
Barrackpor
(Rice-wheat-
Jute)
Typic
Eutrocrept
Control 0.54 1.34 10854
N 0.57 1.36 11628
NP 0.63 1.34 12663
NPK 0.74 1.35 14985
NPK+FYM 0.79 1.27 15050
Akola
(Sorghum-
wheat)
Typic
Haplustert
Control 0.36 1.27 6858
N 0.52 1.27 9906
NP 0.56 1.27 10668
NPK 0.61 1.26 11529
NPK +FYM 0.70 1.25 13125
Source: Manna et al.,(2012) Indian Journal of Soil Conservations.,40(1):70-77
Fig.2.Long term effect of manure and fertilizers in total organic carbon (g kgˉ¹)
under wheat -safflower sequence
Source: Manna et al.,(2006) Journal of Indian Society of Soil Science.,54(3)217-222
Table.4. Effect of long-term use of inorganic fertilizers and organic manure
on Water soluble carbon under rice-wheat cropping system
Treatment Depth (Cm)
0-15
(mg kg-1)
15-30
(mg kg-1)
30-45
(mg kg-1)
45-60
(mg kg-1)
T1 Control 16.8 13.6 12.8 12.3
T2 100% N 18.2 14.7 13.8 13.2
T3 100% NP 26.7 22.4 20.9 19.7
T4 100% NPK 35.3 29.6 27.2 26.1
T5 100% NPK+FYM 37.2 31.3 28.4 27.6
Source: Brar et al., (2013). Soil & Tillage Res. 128: 30-36
Table .5. Effect of nutrient management on soil organic carbon content in maize-wheat
cropping system
Treatments Organic carbon (g kg-1)
Maize Wheat
T1
100% NPK 8.3 8.3
T2
100% NPK + Zn 8.5 8.5
T3
100% NPK + Zn+ S 8.2 8.2
T4
100% NPK+ S 8.7 8.6
T5
100% NPK + Azatobactor 8.6 8.5
T6
10 t FYMha-1 + 100% NPK-NPK content of FYM 10.6 10.5
T7
100% NPK + 10 t FYM ha-1 10.7 10.6
T8
20 t FYM ha-1 10.6 10.3
T9
150% NPK 9.6 8.5
T10
100% NP 8.5 8.1
T11
100% N 8.1 7.8
T12
Control 7.4 7.2
CD(P=0.05) 0.6 0.6
Source: Verma and Mathur (2009) Journal of Indian Society of Soil Science., 57(3): 317-322
Table.6. Effect of nutrient management on soil microbial biomass carbon (SMBC)
content in maize-wheat cropping system.
Treatments
Microbial biomass carbon
(mg kg-1)
Maize Wheat
T1
100% NPK 212 208
T2
100% NPK + Zn 236 230
T3
100% NPK + Zn+ S 249 245
T4
100% NPK+ S 208 199
T5
100% NPK + Azatobactor 256 247
T6
10 t FYMha-1 + 100% NPK-NPK content of FYM 287 267
T7
100% NPK + 10 t FYM ha-1 296 289
T8
20 t FYM ha-1 309 307
T9
150% NPK 263 260
T10
100% NP 192 186
T11
100% N 181 177
T12
Control 173 168
CD(P=0.05) 7 7
Source: Verma and Mathur (2009) Journal of Indian Society of Soil Science 57(3): 317-322
Table.7.General statistics describing the SOC contents under different
cropping systems in India
Statistical
parameters
Rice-
wheat
Rice-rice Rice-fallow Rice-
pulse
Pearlmillet
-based
Soybean-
based
Maize-
wheat
Observarions 16 8 6 5 4 4 3
Mean 5.9 7.1 8.7 6.3 3.7 6.4 7.2
Medium 0.50 0.68 0.78 0.60 0.37 0.62 0.75
Minimum 0.34 0.50 0.35 0.50 0.23 0.38 0.61
Maximum 1.50 1.14 1.54 0.74 0.50 0.94 0.80
Range 1.16 0.64 1.19 0.24 0.27 0.56 0.19
Variance 0.08 0.04 0.20 0.01 0.02 0.05 0.01
Standard
Deviation
0.28 0.21 0.45 0.10 0.15 0.23 0.10
SEM (+-) 0.07 0.08 0.17 0.04 0.07 0.12 0.06
CV 46.8 29.2 51.8 1.52 40.1 36.3 13.6
Source: Pal et al.,(2006) Journal of Indian Society of Soil Science.,54(3):294-299
Fig.3.Mean organic carbon content under various cropping systems
Source: Pal et al.,(2006) Journal of Indian Society of Soil Science.,54(3):294-299
Table.8. Oxidizable SOC content under soybean-wheat cropping system after 29 years
Treatments
Oxidizable SOC (g c Kg1) Total carbon
content of
profile
(g C kg-1)
Net build up
in profile
(g C kg-1)
Increase over
initial profile
content
(%)
0-15 cm 15-30 cm 30-45 cm
T1: Initial soil 5.08 4.35 4.19 13.62 - -
T2: Control 5.57 4.77 4.35 14.69 1.07 7.9
T3:NP 6.84 5.70 4.50 16.95 3.33 24.4
T4:NK 5.74 4.93 4.56 15.23 1.61 11.8
T5:NPK 7.21 6.30 5.47 18.98 5.36 39.4
T6:N+ FYM 8.21 7.65 5.91 23.10 9.48 69.6
T7:NPK+FYM 10.44 8.44 7.97 26.85 13.23 97.1
CD (P=0.05) 1.75 0.06 0.04 - - -
Source: Bhattacharya et l.,(2004) Journal of Indian Society of Soil Science.,52(3):238-242
Carbon pool
Carbon pools are reservoirs of carbon that have the
capacity to both take in and released carbon.
Each of these pools exchange carbon with one another
known as carbon fluxes , comprising what is known as
the global carbon cycle.
Large C Pool
1)Oceanic pool 38000 Pg
2)Geologic pool 5000 Pg
3)Soil Carbon Pool / Pedologic C Pool
 Soil Organic Carbon (SOC) 1550 Pg
 Soil Inorganic Carbon(SIC) 950 Pg
4)Atmospheric pool 750 Pg
5)Biotic pool 620 Pg
Active pool:
The active pools generally contribute about 10-20 %
of SOM.
It includes all freshly added plant and animal residues
as well as micro-organisms.
It is readily decomposable, easily oxidizable and
susceptible to microbial break down.
More sensitive indicator of changes in soil health.
Used as indicator of soil quality.
Source: Lal (2009)Land Degrad.Develop.,80:441-454
Important fractions of the active
carbon pool
 Particulate organic Carbon (POC)
 Dissolve Organic Carbon (DOC)
 Microbial Biomass Carbon (MBC)
 Acid Hydrolysable Carbon (AHC)
 Permanganate Oxidizable Soil Carbon (POSC)
 Water Soluble Carbohydrate (WS-CHO)
Source: Kumari et al.,(2011) Journal of Indian Society of Soil Science .,59(3)245-250
Passive pool:
The passive pools generally contribute about 50-90%
of SOM.
The passive pool refers to fraction that is old
resistance further breakdown represents the products
of last stage of decomposition.
The passive fraction is chemically stable and can take
more than 2500 years to turn over.
It is the largest pool and the least likely to be
influenced by changes in management practices.
Source: Lal (2009)Land Degrad.Develop.,80:441-454
Important fractions of the passive
carbon pool
 Fulvic acid
 Humic acid
 Humin
 Charcoal
Source: Srinivasarao et al.,(2011) Indian Journal Dryland Agri.Res.Dev.26(1):53-64
Table.9.Soil organic carbon stock in different cropping systems with Inceptisole and
Vertisol orders
Location Treatment
Active pools (g m-2) Slow
pool (%)
SMBC SMBN AHC POM
Inceptisol
(Rice-Wheat-
Jute)
Control 33.8 2.28 105.2 10.6
N 32.4 2.14 116.0 16.5
NP 41.8 2.20 121.8 22.4
NPK 65.4 2.20 137.8 20.0
NPK + FYM 97.2 4.04 169.0 27.0
Vertisol
(Sorghum-wheat)
Control 40.2 1.72 92.4 10.3
N 44.0 2.04 118.0 23.3
NP 48.8 2.46 112.0 26.7
NPK 76.4 2.66 145.0 30.1
NPK + FYM 93.0 3.28 168.0 39.7
Source: Manna et al.,(2012) Indian Journal Soil Conservation.,40(1):70-77
What is mean by Soil organic matter turnover
The turnover of an element (eg., C,N,P)
in a pool is generally determined by the
balanced between Inputs (I) and Outputs
(O) of the element to and from the pool
Soil Organic Carbon Turnover and C:N Ratio
•Structural litter pools mainly consist of straw, wood, stem
and related plant parts. The C:N ratio varies around
150:1.These are high in lignin content.
•Metabolic pools comprise of particles of leaves ,bark,
flowers, fruits and animal manure. These fractions releases
mineral nitrogen as it is decomposed with loss of CO2.
•Active pool consist of microbial biomass carbon (MBC)
and its metabolites. The C:N ratio is around 5 to 15.This
fraction provides mineral nutrients and life to the soil.
• Slow decomposable soil organic fraction is
comparable to mature compost having C:N ratio
around 20:1. It makes temporary stable humus in
soil which is slowly decomposable, and
• Passive pool of organic carbon which is highly
recalcitrant with C:N ratio of 7:1 to 9:1.It is
resistant with other types of organic carbon
fractions in soil.
Table.10.Carbon pools of sub-humid, semi-arid and tropical and arid ecosystems
under different land management practices
Carbon pools Sal forest Mixed forest
Pearl
millet-
wheat-
fallow
Pearl
millet-
mustard-
sunflower
Soybean-
wheat-
fallow
land
Soil organic C (gm-2) 2854 2530 1063 1104 1144
Carbon input (g C m-2 yr-1) 250 250 281 365 265
Turnover (yr-1) 11.41 10.12 3.78 3.02 4.47
Soil microbial biomass C
(g m-2)
87 90 42.30 31.70 50.8
C input/soil microbial
biomass C
2.87 2.78 6.64 11.514 15.74
Source: Swarup et al.,(2009) Journal of Indian Society of Soil Science.,57(4):469-476
Soil CO2 Retention
 A sink is defined as a process or an activity that
removes a greenhouse gas from the atmosphere.
 Atmospheric concentration of CO2 can be
lowered either by reducing emission or by
taking CO2 out of the atmosphere and storing in
it terrestrial , oceanic, or freshwater aquatic
system.
Soil CO2 Retention
Less Retention More Retention
Table.11.Effect of tillage management on SOC content (g kg-1) after six years
of soybean-wheat cropping cycles in a vertisols.
Depth
(m)
SOC content (g kg-1) LSD
(p=0.05)
No tillage Reduced
tillage
Convention
al tillage
0-0.05 13.08 12.47 11.01 1.23
0.05-0.15 8.01 8.70 7.20 0.92
0.15-0.30 6.69 6.42 5.57 1.04
Source: Swarup and singh (2009) Journal of Indian Society of Soil Science.,57 (4) 469-476
Table.12.Distribution of carbon in different fractions of soil humus under maize-wheat
cropping system.
Treatments
Carbon in different fractions of soil organic matters
TOC
(g kg-1)
HAC
(g kg-1)
FAC
(g kg-1)
HAC-FAC
(g kg-1)
Humin-C
(g kg-1)
T1 : Control 6.6 1.21 2.06 3.27 3.33
T2 : 100% NP 5.9 0.73 1.93 2.66 3.24
T3 : 100% NP 7.2 1.26 1.92 3.18 4.02
T4 : 100% NP 8.5 1.73 3.72 5.05 3.05
T5 :100% NP 5.6 1.33 1.21 2.54 3.06
T6 : FYM 10.9 2.43 2.64 5.07 5.83
T7 : 1/2 (N+FYM) +
P(A+X/2) + K(B-Y/2)
0.12 1.61 3.42 5.03 5.17
SEm± 0.12 0.03 0.03 0.04 0.06
CD (P=0.05) 0.40 0.09 0.10 0.15 0.20
Source: Kumari et al.,(2011) Journal of Indian Society of Soil Science.,59(3)245-248
A and B= Full dose of P and K i.e. 80 kg P2O5 & 70 kg K20 kg ha-1 (110:90:70 kg NPK ha-1)
X and Y= Amount of P and K present in full dose of FYM
Table.13.Effect of organic sources on carbon pools in soil at harvest in rice
Treatments WSOC
(mg kgˉ¹)
Organic C
(g kgˉ¹)
Labile C
(mg gˉ¹)
Total C
(g kgˉ¹)
No manure 26.2 6.20 3.70 32.02
Wheat straw 31.5 6.70 4.20 39.73
FYM 36.2 7.00 4.85 37.58
Vermicompost 43.0 6.80 5.32 36.88
Poultry manure 47.2 7.40 5.24 37.35
LSD (0.05) 2.01 0.40 0.36 6.5
Source: Khursheed et al.,(2013) International journal of Enviornmental Pollution.,1:17-21
Fig.4.Variation of soil organic carbon accumulated by fodder crops
Source: Sundaram et al.,(2012) International journal of Enviornmental Biology .,2(3):165-168
Table.14.Long term effect of various treatments on soil labile C and Organic carbon
(O.C) under sorghum-wheat cropping sequence.
Treatments Labile C (mg kgˉ¹) OC (mg kgˉ¹)
T1 - 50%NPK 218 4.32
T2 - 100%NPK 234 5.11
T3 - 150%NPK 279 5.93
T4 - 100%NPK S free 223 5.10
T5 - 100%NPK + 2.5 kg Zn ha-1 239 5.15
T6 - 100%NP 231 4.90
T7 - 100%N 214 4.29
T8 - 100%NPK +10 t FYM ha-1 328 6.77
T9 - 100%NPK + 37.5 kg S ha-1 273 5.21
T10 - FYM only 10 t ha-1 306 6.01
T11 - 75% NPK 228 4.64
T12 - Control 206 2.81
SE(m)± 0.93 0.13
CD at 5% 2.59 0.38
Source: Puli et al.,(2013) International Journal of Applied Biology and Pharmaceutical Technology.,4(4):420-423
Causes of SOC depletion
Erosion
Residue burning Low Productivity
Land use change
Intensive tillage
CO2
Soil organic
matter
Root respiration
Overgrazing
Leachinglosses
43
Table.15. Suggested management practices in different cropping systems
in three dominant bioclimatic systems in the semi-arid tropics.
Bio-climate
systems
Cropping
systems Management practices followed
Sub-humid Soybean Soybean-wheat/fallow Balanced fertilizer FYM
Semi-arid Cotton 2-year rotation of cotton + pigeon pea-sorghum-chickpea
green manure
Paddy Paddy Irrigation balanced input
Arid Cotton Cotton + Pigeon pea Irrigation Balanced fertilizer and FYM
Green manure
Source: Chaudhary et al., (2016) Current Science.,110(9)
Conclusion:
The improvement of active pool of nutrients helps in nutrient
supply to the growing plants and in long term fertilizer experiment,
NPK + FYM application significantly increased the SMBC, SMBN
content in Inceptisole and Vertisols.
Regular input of biomass-C along with chemical fertilizer is
essential to improving soil quality in the semi arid region of India,
and for minimizing the depletion of SOC stock under continuous
cropping.
Soil carbon sequestration is an important strategy to mitigate
climate change as it removes CO2 from the atmosphere.
Soil carbon sequestration using innovative soil and crop
management is needed both to augment soil carbon storage,
and improve soil health and sustainability.
No single agricultural management practices in isolation can
enhance soil carbon sequestration and soil health
Legumes have universally recognized as fertility building agents.
SOIL  CARBON  DYNAMICS  UNDER  INTENSIVE  CROPPING  SYSTEM

SOIL CARBON DYNAMICS UNDER INTENSIVE CROPPING SYSTEM

  • 2.
    Seminar Topic “SOIL CARBONDYNAMICS UNDER INTENSIVE CROPPING SYSTEMS’’ Submitted By MISS. BHOSALE SNEHAL LAXMAN Reg.No.2017 A/107M Research Guide Dr. SWATI. P. ZADE ASSISTANT PROFESSOR, College of Agriculture, Parbhani VNMKV, Parbhani Seminar Incharge Dr. Syed Ismail HEAD, Department of Soil Science and Agricultural Chemistry Submitted to Department of Soil Science and Agricultural Chemistry College of Agriculture,Parbhani. Vasantrao Naik Marathwada Krushi Vidyapeeth , Parbhani
  • 3.
    INTRODUCTION  Soil isthe largest carbon reservoir pool of terrestrial ecosystem and plays a key role in the global carbon budget and greenhouse effect.  It contains 3.5% of the earth’s carbon reserve as compared with 1.7% in the atmosphere , 8.9% in the fossil fuels, 1.0% in the biota and 84.95% in the oceans.  Soil reserves about 1550 GT of carbon as Soil Organic Carbon (SOC) and 1700 GT as carbonate carbon (Soil Inorganic Carbon , i,e SIC)
  • 4.
    Soil carbon(C) playsan important role in exchange of CO2 between atmosphere and biosphere. SOC and SIC are important as it determine ecosystem and agro-ecosystem functions influencing soil structure ,soil fertility ,water holding capacity , cation exchange capacity and other soil characteristics. What is Soil Carbon
  • 5.
    It is alsoof global importance because of its role in the global carbon cycle and therefore, the part it plays in the mitigation of atmospheric levels of greenhouse gases (GHGs) with special reference to CO2. Soil organic carbon (SOC) is a source and sink of carbon dioxide emisions to and from the atmosphere, thus influencing future climate change. The knowledge of soil organic carbon in terms of its amount and quality is essential to sustain the quality and productivity of soils.
  • 6.
    Carbon is thesimplest element on the periodic table that also has four valence electrons Carbon The Element of Life
  • 7.
     Soil organiccarbon (SOC) is building block for all life on the earth and it is associated with soil organic matter.  Soil organic matter (SOM) is the well decomposed plant and animal residues as well as soil microbial organisms.  It is an important component that regulates most of the soil properties and it serves as an indicator for assessing soil quality and climate change phenomenon. Why Carbon is Important in Agriculture
  • 8.
    Soil organic carbon(SOC) is building block for all life on the earth.
  • 9.
    Source: www.http google.in/Carboncycle in agriculture.
  • 10.
    What is SoilCarbon Dynamics  Soil contain the largest dynamic reservoir of carbon on Earth – larger than that stored in the atmosphere and vegetation combined. This makes soils a critical component of the global carbon cycle. Soil Carbon (C) is mostly bound in what we call “Soil organic matter”(SOM).  SOM improves soil physical ,chemical and biological properties.  Increase in soil Organic Carbon (SOC) improve soil health.
  • 11.
    What is Carbonsequestration
  • 14.
    Table.1.Carbon stock inIndian soils (Order-wise) Soil order Soil depth range (m) Carbon stocks (pg) SOC SIC TC Entisols 0.03 0.62 0.89 1.51 0-1.5 2.56 2.86 5.42 Vertisols 0.03 2.59 1.07 3.66 0-1.5 8.77 6.14 14.90 Inceptisols 0.03 2.17 0.62 2.79 0-1.5 5.81 7.04 12.85 Aridisols 0.03 0.74 1.40 2.14 0-1.5 2.02 13.40 15.42 Molisols 0.03 0.09 0.00 0.09 0-1.5 0.49 0.07 0.56 Alfisols 0.03 3.14 0.16 3.30 0-1.5 9.72 4.48 14.20 Ultisols 0.03 0.20 0.00 0.20 0-1.5 0.55 0.00 0.55 Total 0.03 9.55 4.14 13.69 0-1.5 29.92 33.98 63.90 Source: Bhattacharya et.al.,(2009) Journal of Indian Society of Soil Science.,57(4):461-468
  • 15.
    . Fig.1. Distribution ofcarbon stock (total, organic and inorganic) in Alfisols, Inceptisols and Vertisols and associated soils for 0–60 cm soil depth Source : Venkanna et al., (2014) Current Science., 106 (4) : 604-611
  • 16.
    Soil Order SOC (%) SIC (%) TC (%) SMBC (µgkgˉ¹) CO2 Mg CO2 kg -124 hr-1 Entisols 1.830 2.759 4.88 1094.21 14.40 Inceptisols 2.246 2.698 7.944 1387.84 27.64 Vertisols 2.112 3.918 5.412 1223.18 20.62 Table.2.Soil organic status of various soil types of Maharashtra Source: Malode K.R. (2013) Organic carbon mapping of agro-ecological zones of Marathwada region of Maharashtra state.,Ph.D Thesis.,VNMKV Parbhani.
  • 17.
    Table.3.Soil organic carbonstock in different cropping systems Location Soil order Treatment OC (%) BD (Mg m-3) SOC stock (Kg ha-1) Barrackpor (Rice-wheat- Jute) Typic Eutrocrept Control 0.54 1.34 10854 N 0.57 1.36 11628 NP 0.63 1.34 12663 NPK 0.74 1.35 14985 NPK+FYM 0.79 1.27 15050 Akola (Sorghum- wheat) Typic Haplustert Control 0.36 1.27 6858 N 0.52 1.27 9906 NP 0.56 1.27 10668 NPK 0.61 1.26 11529 NPK +FYM 0.70 1.25 13125 Source: Manna et al.,(2012) Indian Journal of Soil Conservations.,40(1):70-77
  • 18.
    Fig.2.Long term effectof manure and fertilizers in total organic carbon (g kgˉ¹) under wheat -safflower sequence Source: Manna et al.,(2006) Journal of Indian Society of Soil Science.,54(3)217-222
  • 19.
    Table.4. Effect oflong-term use of inorganic fertilizers and organic manure on Water soluble carbon under rice-wheat cropping system Treatment Depth (Cm) 0-15 (mg kg-1) 15-30 (mg kg-1) 30-45 (mg kg-1) 45-60 (mg kg-1) T1 Control 16.8 13.6 12.8 12.3 T2 100% N 18.2 14.7 13.8 13.2 T3 100% NP 26.7 22.4 20.9 19.7 T4 100% NPK 35.3 29.6 27.2 26.1 T5 100% NPK+FYM 37.2 31.3 28.4 27.6 Source: Brar et al., (2013). Soil & Tillage Res. 128: 30-36
  • 20.
    Table .5. Effectof nutrient management on soil organic carbon content in maize-wheat cropping system Treatments Organic carbon (g kg-1) Maize Wheat T1 100% NPK 8.3 8.3 T2 100% NPK + Zn 8.5 8.5 T3 100% NPK + Zn+ S 8.2 8.2 T4 100% NPK+ S 8.7 8.6 T5 100% NPK + Azatobactor 8.6 8.5 T6 10 t FYMha-1 + 100% NPK-NPK content of FYM 10.6 10.5 T7 100% NPK + 10 t FYM ha-1 10.7 10.6 T8 20 t FYM ha-1 10.6 10.3 T9 150% NPK 9.6 8.5 T10 100% NP 8.5 8.1 T11 100% N 8.1 7.8 T12 Control 7.4 7.2 CD(P=0.05) 0.6 0.6 Source: Verma and Mathur (2009) Journal of Indian Society of Soil Science., 57(3): 317-322
  • 21.
    Table.6. Effect ofnutrient management on soil microbial biomass carbon (SMBC) content in maize-wheat cropping system. Treatments Microbial biomass carbon (mg kg-1) Maize Wheat T1 100% NPK 212 208 T2 100% NPK + Zn 236 230 T3 100% NPK + Zn+ S 249 245 T4 100% NPK+ S 208 199 T5 100% NPK + Azatobactor 256 247 T6 10 t FYMha-1 + 100% NPK-NPK content of FYM 287 267 T7 100% NPK + 10 t FYM ha-1 296 289 T8 20 t FYM ha-1 309 307 T9 150% NPK 263 260 T10 100% NP 192 186 T11 100% N 181 177 T12 Control 173 168 CD(P=0.05) 7 7 Source: Verma and Mathur (2009) Journal of Indian Society of Soil Science 57(3): 317-322
  • 22.
    Table.7.General statistics describingthe SOC contents under different cropping systems in India Statistical parameters Rice- wheat Rice-rice Rice-fallow Rice- pulse Pearlmillet -based Soybean- based Maize- wheat Observarions 16 8 6 5 4 4 3 Mean 5.9 7.1 8.7 6.3 3.7 6.4 7.2 Medium 0.50 0.68 0.78 0.60 0.37 0.62 0.75 Minimum 0.34 0.50 0.35 0.50 0.23 0.38 0.61 Maximum 1.50 1.14 1.54 0.74 0.50 0.94 0.80 Range 1.16 0.64 1.19 0.24 0.27 0.56 0.19 Variance 0.08 0.04 0.20 0.01 0.02 0.05 0.01 Standard Deviation 0.28 0.21 0.45 0.10 0.15 0.23 0.10 SEM (+-) 0.07 0.08 0.17 0.04 0.07 0.12 0.06 CV 46.8 29.2 51.8 1.52 40.1 36.3 13.6 Source: Pal et al.,(2006) Journal of Indian Society of Soil Science.,54(3):294-299
  • 23.
    Fig.3.Mean organic carboncontent under various cropping systems Source: Pal et al.,(2006) Journal of Indian Society of Soil Science.,54(3):294-299
  • 24.
    Table.8. Oxidizable SOCcontent under soybean-wheat cropping system after 29 years Treatments Oxidizable SOC (g c Kg1) Total carbon content of profile (g C kg-1) Net build up in profile (g C kg-1) Increase over initial profile content (%) 0-15 cm 15-30 cm 30-45 cm T1: Initial soil 5.08 4.35 4.19 13.62 - - T2: Control 5.57 4.77 4.35 14.69 1.07 7.9 T3:NP 6.84 5.70 4.50 16.95 3.33 24.4 T4:NK 5.74 4.93 4.56 15.23 1.61 11.8 T5:NPK 7.21 6.30 5.47 18.98 5.36 39.4 T6:N+ FYM 8.21 7.65 5.91 23.10 9.48 69.6 T7:NPK+FYM 10.44 8.44 7.97 26.85 13.23 97.1 CD (P=0.05) 1.75 0.06 0.04 - - - Source: Bhattacharya et l.,(2004) Journal of Indian Society of Soil Science.,52(3):238-242
  • 25.
    Carbon pool Carbon poolsare reservoirs of carbon that have the capacity to both take in and released carbon. Each of these pools exchange carbon with one another known as carbon fluxes , comprising what is known as the global carbon cycle. Large C Pool 1)Oceanic pool 38000 Pg 2)Geologic pool 5000 Pg 3)Soil Carbon Pool / Pedologic C Pool  Soil Organic Carbon (SOC) 1550 Pg  Soil Inorganic Carbon(SIC) 950 Pg 4)Atmospheric pool 750 Pg 5)Biotic pool 620 Pg
  • 27.
    Active pool: The activepools generally contribute about 10-20 % of SOM. It includes all freshly added plant and animal residues as well as micro-organisms. It is readily decomposable, easily oxidizable and susceptible to microbial break down. More sensitive indicator of changes in soil health. Used as indicator of soil quality. Source: Lal (2009)Land Degrad.Develop.,80:441-454
  • 28.
    Important fractions ofthe active carbon pool  Particulate organic Carbon (POC)  Dissolve Organic Carbon (DOC)  Microbial Biomass Carbon (MBC)  Acid Hydrolysable Carbon (AHC)  Permanganate Oxidizable Soil Carbon (POSC)  Water Soluble Carbohydrate (WS-CHO) Source: Kumari et al.,(2011) Journal of Indian Society of Soil Science .,59(3)245-250
  • 29.
    Passive pool: The passivepools generally contribute about 50-90% of SOM. The passive pool refers to fraction that is old resistance further breakdown represents the products of last stage of decomposition. The passive fraction is chemically stable and can take more than 2500 years to turn over. It is the largest pool and the least likely to be influenced by changes in management practices. Source: Lal (2009)Land Degrad.Develop.,80:441-454
  • 30.
    Important fractions ofthe passive carbon pool  Fulvic acid  Humic acid  Humin  Charcoal Source: Srinivasarao et al.,(2011) Indian Journal Dryland Agri.Res.Dev.26(1):53-64
  • 31.
    Table.9.Soil organic carbonstock in different cropping systems with Inceptisole and Vertisol orders Location Treatment Active pools (g m-2) Slow pool (%) SMBC SMBN AHC POM Inceptisol (Rice-Wheat- Jute) Control 33.8 2.28 105.2 10.6 N 32.4 2.14 116.0 16.5 NP 41.8 2.20 121.8 22.4 NPK 65.4 2.20 137.8 20.0 NPK + FYM 97.2 4.04 169.0 27.0 Vertisol (Sorghum-wheat) Control 40.2 1.72 92.4 10.3 N 44.0 2.04 118.0 23.3 NP 48.8 2.46 112.0 26.7 NPK 76.4 2.66 145.0 30.1 NPK + FYM 93.0 3.28 168.0 39.7 Source: Manna et al.,(2012) Indian Journal Soil Conservation.,40(1):70-77
  • 32.
    What is meanby Soil organic matter turnover The turnover of an element (eg., C,N,P) in a pool is generally determined by the balanced between Inputs (I) and Outputs (O) of the element to and from the pool
  • 33.
    Soil Organic CarbonTurnover and C:N Ratio •Structural litter pools mainly consist of straw, wood, stem and related plant parts. The C:N ratio varies around 150:1.These are high in lignin content. •Metabolic pools comprise of particles of leaves ,bark, flowers, fruits and animal manure. These fractions releases mineral nitrogen as it is decomposed with loss of CO2. •Active pool consist of microbial biomass carbon (MBC) and its metabolites. The C:N ratio is around 5 to 15.This fraction provides mineral nutrients and life to the soil.
  • 34.
    • Slow decomposablesoil organic fraction is comparable to mature compost having C:N ratio around 20:1. It makes temporary stable humus in soil which is slowly decomposable, and • Passive pool of organic carbon which is highly recalcitrant with C:N ratio of 7:1 to 9:1.It is resistant with other types of organic carbon fractions in soil.
  • 35.
    Table.10.Carbon pools ofsub-humid, semi-arid and tropical and arid ecosystems under different land management practices Carbon pools Sal forest Mixed forest Pearl millet- wheat- fallow Pearl millet- mustard- sunflower Soybean- wheat- fallow land Soil organic C (gm-2) 2854 2530 1063 1104 1144 Carbon input (g C m-2 yr-1) 250 250 281 365 265 Turnover (yr-1) 11.41 10.12 3.78 3.02 4.47 Soil microbial biomass C (g m-2) 87 90 42.30 31.70 50.8 C input/soil microbial biomass C 2.87 2.78 6.64 11.514 15.74 Source: Swarup et al.,(2009) Journal of Indian Society of Soil Science.,57(4):469-476
  • 36.
    Soil CO2 Retention A sink is defined as a process or an activity that removes a greenhouse gas from the atmosphere.  Atmospheric concentration of CO2 can be lowered either by reducing emission or by taking CO2 out of the atmosphere and storing in it terrestrial , oceanic, or freshwater aquatic system.
  • 37.
    Soil CO2 Retention LessRetention More Retention
  • 38.
    Table.11.Effect of tillagemanagement on SOC content (g kg-1) after six years of soybean-wheat cropping cycles in a vertisols. Depth (m) SOC content (g kg-1) LSD (p=0.05) No tillage Reduced tillage Convention al tillage 0-0.05 13.08 12.47 11.01 1.23 0.05-0.15 8.01 8.70 7.20 0.92 0.15-0.30 6.69 6.42 5.57 1.04 Source: Swarup and singh (2009) Journal of Indian Society of Soil Science.,57 (4) 469-476
  • 39.
    Table.12.Distribution of carbonin different fractions of soil humus under maize-wheat cropping system. Treatments Carbon in different fractions of soil organic matters TOC (g kg-1) HAC (g kg-1) FAC (g kg-1) HAC-FAC (g kg-1) Humin-C (g kg-1) T1 : Control 6.6 1.21 2.06 3.27 3.33 T2 : 100% NP 5.9 0.73 1.93 2.66 3.24 T3 : 100% NP 7.2 1.26 1.92 3.18 4.02 T4 : 100% NP 8.5 1.73 3.72 5.05 3.05 T5 :100% NP 5.6 1.33 1.21 2.54 3.06 T6 : FYM 10.9 2.43 2.64 5.07 5.83 T7 : 1/2 (N+FYM) + P(A+X/2) + K(B-Y/2) 0.12 1.61 3.42 5.03 5.17 SEm± 0.12 0.03 0.03 0.04 0.06 CD (P=0.05) 0.40 0.09 0.10 0.15 0.20 Source: Kumari et al.,(2011) Journal of Indian Society of Soil Science.,59(3)245-248 A and B= Full dose of P and K i.e. 80 kg P2O5 & 70 kg K20 kg ha-1 (110:90:70 kg NPK ha-1) X and Y= Amount of P and K present in full dose of FYM
  • 40.
    Table.13.Effect of organicsources on carbon pools in soil at harvest in rice Treatments WSOC (mg kgˉ¹) Organic C (g kgˉ¹) Labile C (mg gˉ¹) Total C (g kgˉ¹) No manure 26.2 6.20 3.70 32.02 Wheat straw 31.5 6.70 4.20 39.73 FYM 36.2 7.00 4.85 37.58 Vermicompost 43.0 6.80 5.32 36.88 Poultry manure 47.2 7.40 5.24 37.35 LSD (0.05) 2.01 0.40 0.36 6.5 Source: Khursheed et al.,(2013) International journal of Enviornmental Pollution.,1:17-21
  • 41.
    Fig.4.Variation of soilorganic carbon accumulated by fodder crops Source: Sundaram et al.,(2012) International journal of Enviornmental Biology .,2(3):165-168
  • 42.
    Table.14.Long term effectof various treatments on soil labile C and Organic carbon (O.C) under sorghum-wheat cropping sequence. Treatments Labile C (mg kgˉ¹) OC (mg kgˉ¹) T1 - 50%NPK 218 4.32 T2 - 100%NPK 234 5.11 T3 - 150%NPK 279 5.93 T4 - 100%NPK S free 223 5.10 T5 - 100%NPK + 2.5 kg Zn ha-1 239 5.15 T6 - 100%NP 231 4.90 T7 - 100%N 214 4.29 T8 - 100%NPK +10 t FYM ha-1 328 6.77 T9 - 100%NPK + 37.5 kg S ha-1 273 5.21 T10 - FYM only 10 t ha-1 306 6.01 T11 - 75% NPK 228 4.64 T12 - Control 206 2.81 SE(m)± 0.93 0.13 CD at 5% 2.59 0.38 Source: Puli et al.,(2013) International Journal of Applied Biology and Pharmaceutical Technology.,4(4):420-423
  • 43.
    Causes of SOCdepletion Erosion Residue burning Low Productivity Land use change Intensive tillage CO2 Soil organic matter Root respiration Overgrazing Leachinglosses 43
  • 46.
    Table.15. Suggested managementpractices in different cropping systems in three dominant bioclimatic systems in the semi-arid tropics. Bio-climate systems Cropping systems Management practices followed Sub-humid Soybean Soybean-wheat/fallow Balanced fertilizer FYM Semi-arid Cotton 2-year rotation of cotton + pigeon pea-sorghum-chickpea green manure Paddy Paddy Irrigation balanced input Arid Cotton Cotton + Pigeon pea Irrigation Balanced fertilizer and FYM Green manure Source: Chaudhary et al., (2016) Current Science.,110(9)
  • 47.
    Conclusion: The improvement ofactive pool of nutrients helps in nutrient supply to the growing plants and in long term fertilizer experiment, NPK + FYM application significantly increased the SMBC, SMBN content in Inceptisole and Vertisols. Regular input of biomass-C along with chemical fertilizer is essential to improving soil quality in the semi arid region of India, and for minimizing the depletion of SOC stock under continuous cropping.
  • 48.
    Soil carbon sequestrationis an important strategy to mitigate climate change as it removes CO2 from the atmosphere. Soil carbon sequestration using innovative soil and crop management is needed both to augment soil carbon storage, and improve soil health and sustainability. No single agricultural management practices in isolation can enhance soil carbon sequestration and soil health Legumes have universally recognized as fertility building agents.