Download as PDF, PPTX

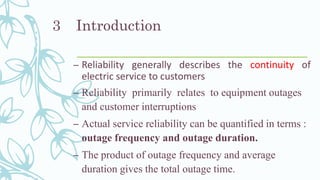
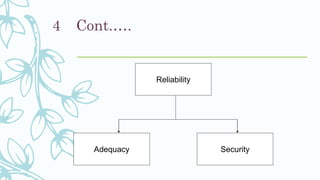
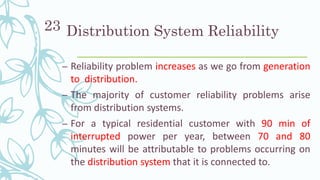


Chapter three of the document discusses power system reliability analysis, focusing on the concepts of reliability, adequacy, and security within power systems. It explains the need for sufficient facilities to meet consumer demand, evaluates transmission and distribution system reliability, and introduces various reliability indices to measure performance. Additionally, the chapter highlights the importance of understanding outage frequency, duration, and their economic impacts on service delivery.


![Power system planning & operation [eceg 4410]](https://cdn.slidesharecdn.com/ss_thumbnails/powersystemplanningoperationeceg-4410-130607134359-phpapp01-thumbnail.jpg?width=640&height=640&fit=bounds)


![protection of transmission lines[distance relay protection scheme]](https://cdn.slidesharecdn.com/ss_thumbnails/os-exe3-23-may2011-sr-i-776s21tr-lineprotection-120425095503-phpapp02-thumbnail.jpg?width=640&height=640&fit=bounds)


