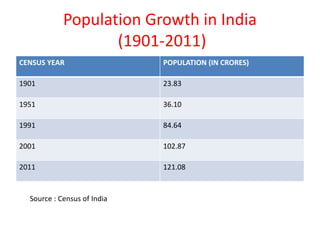
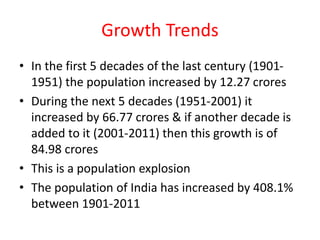
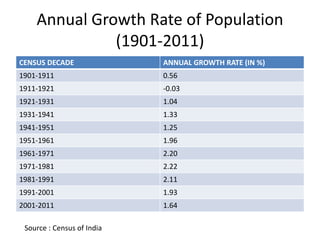
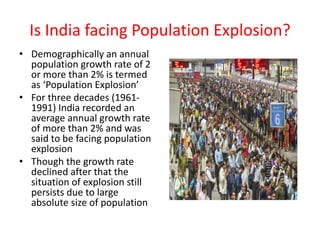
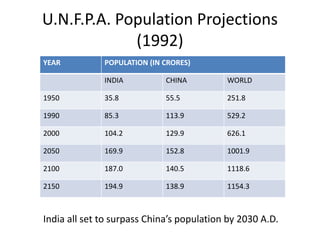
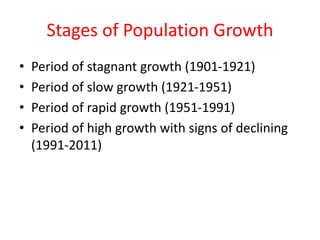
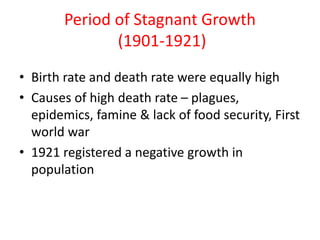
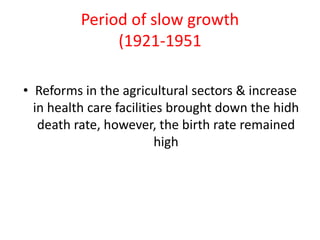
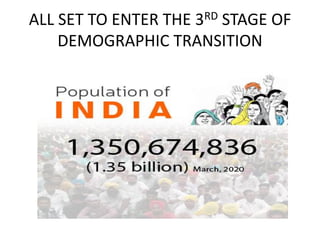
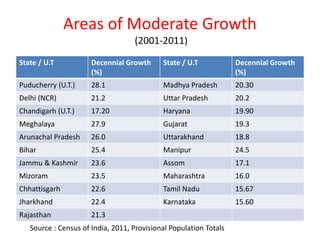
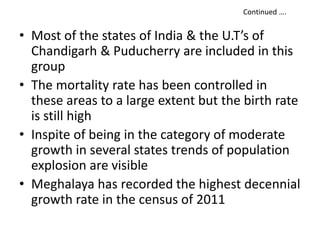
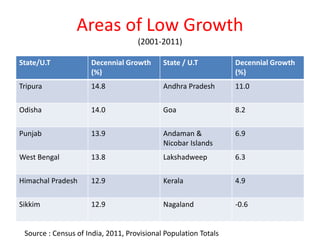
Dr. Meenakshi Prasad
Assistant Professor
P.G. Deptt. of Geography
Magadh University
Bodh Gaya
Source : google images
Some Amazing Facts
• India accounts for 17.5% of the global
population (Census 2011) while covers 2.4% of
the global area
• Second most populous country in the world
after China
• Population of India (121.08 crores) equates
the combined population of 6 countries,i.e.
U.S.A, Indonesia, Brazil, Pakistan, Japan &
Bangladesh
Population Clock of India
(30th January, 2020)
TIME POPULATION GROWTH
PER SECOND 1
PER HOUR 2403
PER DAY 57,685
PER MONTH 13,84,457
PER YEAR 16,613,486
Source : www.medindia.net
Population Growth in India
(1901-2011)
CENSUS YEAR POPULATION (IN CRORES)
1901 23.83
1951 36.10
1991 84.64
2001 102.87
2011 121.08
Source : Census of India
Growth Trends
• In the first 5 decades of the last century (1901-
1951) the population increased by 12.27 crores
• During the next 5 decades (1951-2001) it
increased by 66.77 crores & if another decade is
added to it (2001-2011) then this growth is of
84.98 crores
• This is a population explosion
• The population of India has increased by 408.1%
between 1901-2011
Annual Growth Rate of Population
(1901-2011)
CENSUS DECADE ANNUAL GROWTH RATE (IN %)
1901-1911 0.56
1911-1921 -0.03
1921-1931 1.04
1931-1941 1.33
1941-1951 1.25
1951-1961 1.96
1961-1971 2.20
1971-1981 2.22
1981-1991 2.11
1991-2001 1.93
2001-2011 1.64
Source : Census of India
The Great Population Divide
• The year 1921 is regarded as the
Great Population Divide in the
Demographic history of India as it is
the only year to have registered a
negative growth in India’s total
population
Is India facing Population Explosion?
• Demographically an annual
population growth rate of 2
or more than 2% is termed
as ‘Population Explosion’
• For three decades (1961-
1991) India recorded an
average annual growth rate
of more than 2% and was
said to be facing population
explosion
• Though the growth rate
declined after that the
situation of explosion still
persists due to large
absolute size of population
U.N.F.P.A. Population Projections
(1992)
YEAR POPULATION (IN CRORES)
INDIA CHINA WORLD
1950 35.8 55.5 251.8
1990 85.3 113.9 529.2
2000 104.2 129.9 626.1
2050 169.9 152.8 1001.9
2100 187.0 140.5 1118.6
2150 194.9 138.9 1154.3
India all set to surpass China’s population by 2030 A.D.
Stages of Population Growth
• Period of stagnant growth (1901-1921)
• Period of slow growth (1921-1951)
• Period of rapid growth (1951-1991)
• Period of high growth with signs of declining
(1991-2011)
Period of Stagnant Growth
(1901-1921)
• Birth rate and death rate were equally high
• Causes of high death rate – plagues,
epidemics, famine & lack of food security, First
world war
• 1921 registered a negative growth in
population
Period of slow growth
(1921-1951
• Reforms in the agricultural sectors & increase
in health care facilities brought down the hidh
death rate, however, the birth rate remained
high
Period of Rapid Increase in Population
(1951-1991)
• Post-independence period
• Growth in agriculture, improvement in food
security and supply, increase in health services
significantly brought down the death rate
• However, the same factors maintained a high
birth rate
• Period of population explosion
Period of High Growth with signs of
Declining (1991-2011)
• The decennial growth rate continuously
declined
• Causes responsible were – success of family
planning programmes, desire for a higher
standard of living, increase in educational
level, increasing participation of females in
work force, decline in joint family syaytem
ALL SET TO ENTER THE 3RD STAGE OF
DEMOGRAPHIC TRANSITION
Regional Trends : Variations
• There are variations in the growth trend of
population at regional level in India
• These variations can be studied under 2
distinct heads :
• (i)Long term growth variations &
• (ii)Short term growth variations
Variations in long Term Growth
• During the last 110 years, i.e. between 1901-
2011, the population of India has increased by
408.1%
• During the last century this growth was
approximately 329%
• The long term growth depicts regional
variations
Variations in Long Term Growth
Based on variations in long term growth
the country can be divided into three
regions :
(i)Areas of very high growth (more than
500%)
(ii)Areas of moderate growth (250-500%)
(iii)Areas of low growth (less than 250%)
Areas of Very High Growth in
Population
• Includes the north-eastern
states of India
• There are 3 basic causes of
exceptionally high growth
here –
(i)In-migration of labourers
from Bihar, West Bengal &
Odisha
(ii)Arrival of illegal immigrants
from Bangladesh
(iii)High natural growth rate
post independence
Source : google images
Areas of Moderate Growth
• The plateau states of
peninsular India and the
states of central plains
come under the
category
• Natural growth rate is
responsible for
moderate growth
• Negligible impact of
migrant population
Source : google images
Areas of Low Growth
• Includes states of north-
western India – Punjab,
Haryana, J & K (including
Laddakh), Himachal Pradesh
• Emigration and out-
migration of population to
other areas, economic
development of Punjab &
Haryana, militant activities
in Punjab and J& k, Article
370 in J & K are the
responsible factors for this
low growth
Source : google images
Short Term Growth
• This is the growth of the last decade (2001-2011)
• Tremendous regional variations are observed in
the short term growth of population in India
• There are only 4 states and 1 U.T. where the
decennial growth rate of population has
increased in 2011 as compared to the last decade
(1991-2001)
• These include Arunachal Pradesh, Chhattisgarh,
Manipur, Tamil Nadu & Puducherry
Regional Variations in Shot Term
Growth
• Based on the decennial growth rate of (2001-
2011) Indian States & U.T.’s can be classified
under four groups:
(i)Areas of Very High Growth (45-60%)
(ii)Areas of High Growth (30-45%)
(iii)Areas of Moderate Growth (15-30%)
(iv)Areas of Low Growth (less than 15%)
• The national average of decennial growth during
this period was 17.7%
Areas of Very High Growth
• Only 2 Union Territories of Dadar & Nagar
Haveli (55.9%) and Daman & Diu (53.8%) are
included in this group
• The main cause of very high growth is
population migration to these areas
Areas of High Growth
• No region of India falls in this category
Areas of Moderate Growth
(2001-2011)
State / U.T Decennial Growth
(%)
State / U.T Decennial Growth
(%)
Puducherry (U.T.) 28.1 Madhya Pradesh 20.30
Delhi (NCR) 21.2 Uttar Pradesh 20.2
Chandigarh (U.T.) 17.20 Haryana 19.90
Meghalaya 27.9 Gujarat 19.3
Arunachal Pradesh 26.0 Uttarakhand 18.8
Bihar 25.4 Manipur 24.5
Jammu & Kashmir 23.6 Assom 17.1
Mizoram 23.5 Maharashtra 16.0
Chhattisgarh 22.6 Tamil Nadu 15.67
Jharkhand 22.4 Karnataka 15.60
Rajasthan 21.3
Source : Census of India, 2011, Provisional Population Totals
• Most of the states of India & the U.T’s of
Chandigarh & Puducherry are included in this
group
• The mortality rate has been controlled in
these areas to a large extent but the birth rate
is still high
• Inspite of being in the category of moderate
growth in several states trends of population
explosion are visible
• Meghalaya has recorded the highest decennial
growth rate in the census of 2011
Continued ….
Areas of Low Growth
(2001-2011)
State/U.T Decennial Growth
(%)
State / U.T Decennial Growth
(%)
Tripura 14.8 Andhra Pradesh 11.0
Odisha 14.0 Goa 8.2
Punjab 13.9 Andaman &
Nicobar Islands
6.9
West Bengal 13.8 Lakshadweep 6.3
Himachal Pradesh 12.9 Kerala 4.9
Sikkim 12.9 Nagaland -0.6
Source : Census of India, 2011, Provisional Population Totals
The areas having low growth can be sub-divided
into 3 categories:
• First category includes states like Kerala, Goa &
Punjab where population control programmes
have been successful due to economic & social
development
• The second category includes states like Tripura,
West Bengal, Himachal Pradesh, Sikkim, Andhra
Pradesh & Nagaland where apart from
developmental works, political & administrative
efforts & participation of the people have made
population control programmes a success
• Odisha lies in the third category and has a
different situation. It is a backward state & has a
high death rate
Continued ….
Conclusion
The National Population Policy, 2000, adopted
by the Government of India presented the
long term objective of achieving a stable
population by 2045. But the crucial question is
can this objective be achieved? It was
envisaged that if the NPP is fully implemented,
the population of India should be 1013 million
by 2002 & 1107 million by 2010. However, in
2001 itself India exceeded the estimated
population for the year
2002 by 14 million and the population in 2011
census is higher by about 110 million
compared to the target set for the year 2010.
It will no doubt be an uphill task for the
Government & the people to achieve the
much cherished goal of stable population.
References:
• Census of India
• Chandana, R.C: Population Geography, Kalyani
Publisers, New Delhi, 2017
• Ojha, S.K : Jansankhya evam nagrikaran,
Bauddhik Prakashan, 2017
• http://censusindia.gov.in/2011-prov-
results/data_files/india/Final_PPT_2011_chap
ter3.pdf
Population Growth in India : Trends & Patterns

Population Growth in India : Trends & Patterns

  • 1.
    Dr. Meenakshi Prasad AssistantProfessor P.G. Deptt. of Geography Magadh University Bodh Gaya Source : google images
  • 2.
    Some Amazing Facts •India accounts for 17.5% of the global population (Census 2011) while covers 2.4% of the global area • Second most populous country in the world after China • Population of India (121.08 crores) equates the combined population of 6 countries,i.e. U.S.A, Indonesia, Brazil, Pakistan, Japan & Bangladesh
  • 3.
    Population Clock ofIndia (30th January, 2020) TIME POPULATION GROWTH PER SECOND 1 PER HOUR 2403 PER DAY 57,685 PER MONTH 13,84,457 PER YEAR 16,613,486 Source : www.medindia.net
  • 4.
    Population Growth inIndia (1901-2011) CENSUS YEAR POPULATION (IN CRORES) 1901 23.83 1951 36.10 1991 84.64 2001 102.87 2011 121.08 Source : Census of India
  • 5.
    Growth Trends • Inthe first 5 decades of the last century (1901- 1951) the population increased by 12.27 crores • During the next 5 decades (1951-2001) it increased by 66.77 crores & if another decade is added to it (2001-2011) then this growth is of 84.98 crores • This is a population explosion • The population of India has increased by 408.1% between 1901-2011
  • 6.
    Annual Growth Rateof Population (1901-2011) CENSUS DECADE ANNUAL GROWTH RATE (IN %) 1901-1911 0.56 1911-1921 -0.03 1921-1931 1.04 1931-1941 1.33 1941-1951 1.25 1951-1961 1.96 1961-1971 2.20 1971-1981 2.22 1981-1991 2.11 1991-2001 1.93 2001-2011 1.64 Source : Census of India
  • 7.
    The Great PopulationDivide • The year 1921 is regarded as the Great Population Divide in the Demographic history of India as it is the only year to have registered a negative growth in India’s total population
  • 8.
    Is India facingPopulation Explosion? • Demographically an annual population growth rate of 2 or more than 2% is termed as ‘Population Explosion’ • For three decades (1961- 1991) India recorded an average annual growth rate of more than 2% and was said to be facing population explosion • Though the growth rate declined after that the situation of explosion still persists due to large absolute size of population
  • 9.
    U.N.F.P.A. Population Projections (1992) YEARPOPULATION (IN CRORES) INDIA CHINA WORLD 1950 35.8 55.5 251.8 1990 85.3 113.9 529.2 2000 104.2 129.9 626.1 2050 169.9 152.8 1001.9 2100 187.0 140.5 1118.6 2150 194.9 138.9 1154.3 India all set to surpass China’s population by 2030 A.D.
  • 10.
    Stages of PopulationGrowth • Period of stagnant growth (1901-1921) • Period of slow growth (1921-1951) • Period of rapid growth (1951-1991) • Period of high growth with signs of declining (1991-2011)
  • 11.
    Period of StagnantGrowth (1901-1921) • Birth rate and death rate were equally high • Causes of high death rate – plagues, epidemics, famine & lack of food security, First world war • 1921 registered a negative growth in population
  • 12.
    Period of slowgrowth (1921-1951 • Reforms in the agricultural sectors & increase in health care facilities brought down the hidh death rate, however, the birth rate remained high
  • 13.
    Period of RapidIncrease in Population (1951-1991) • Post-independence period • Growth in agriculture, improvement in food security and supply, increase in health services significantly brought down the death rate • However, the same factors maintained a high birth rate • Period of population explosion
  • 14.
    Period of HighGrowth with signs of Declining (1991-2011) • The decennial growth rate continuously declined • Causes responsible were – success of family planning programmes, desire for a higher standard of living, increase in educational level, increasing participation of females in work force, decline in joint family syaytem
  • 15.
    ALL SET TOENTER THE 3RD STAGE OF DEMOGRAPHIC TRANSITION
  • 16.
    Regional Trends :Variations • There are variations in the growth trend of population at regional level in India • These variations can be studied under 2 distinct heads : • (i)Long term growth variations & • (ii)Short term growth variations
  • 17.
    Variations in longTerm Growth • During the last 110 years, i.e. between 1901- 2011, the population of India has increased by 408.1% • During the last century this growth was approximately 329% • The long term growth depicts regional variations
  • 18.
    Variations in LongTerm Growth Based on variations in long term growth the country can be divided into three regions : (i)Areas of very high growth (more than 500%) (ii)Areas of moderate growth (250-500%) (iii)Areas of low growth (less than 250%)
  • 19.
    Areas of VeryHigh Growth in Population • Includes the north-eastern states of India • There are 3 basic causes of exceptionally high growth here – (i)In-migration of labourers from Bihar, West Bengal & Odisha (ii)Arrival of illegal immigrants from Bangladesh (iii)High natural growth rate post independence Source : google images
  • 20.
    Areas of ModerateGrowth • The plateau states of peninsular India and the states of central plains come under the category • Natural growth rate is responsible for moderate growth • Negligible impact of migrant population Source : google images
  • 21.
    Areas of LowGrowth • Includes states of north- western India – Punjab, Haryana, J & K (including Laddakh), Himachal Pradesh • Emigration and out- migration of population to other areas, economic development of Punjab & Haryana, militant activities in Punjab and J& k, Article 370 in J & K are the responsible factors for this low growth Source : google images
  • 22.
    Short Term Growth •This is the growth of the last decade (2001-2011) • Tremendous regional variations are observed in the short term growth of population in India • There are only 4 states and 1 U.T. where the decennial growth rate of population has increased in 2011 as compared to the last decade (1991-2001) • These include Arunachal Pradesh, Chhattisgarh, Manipur, Tamil Nadu & Puducherry
  • 23.
    Regional Variations inShot Term Growth • Based on the decennial growth rate of (2001- 2011) Indian States & U.T.’s can be classified under four groups: (i)Areas of Very High Growth (45-60%) (ii)Areas of High Growth (30-45%) (iii)Areas of Moderate Growth (15-30%) (iv)Areas of Low Growth (less than 15%) • The national average of decennial growth during this period was 17.7%
  • 24.
    Areas of VeryHigh Growth • Only 2 Union Territories of Dadar & Nagar Haveli (55.9%) and Daman & Diu (53.8%) are included in this group • The main cause of very high growth is population migration to these areas Areas of High Growth • No region of India falls in this category
  • 25.
    Areas of ModerateGrowth (2001-2011) State / U.T Decennial Growth (%) State / U.T Decennial Growth (%) Puducherry (U.T.) 28.1 Madhya Pradesh 20.30 Delhi (NCR) 21.2 Uttar Pradesh 20.2 Chandigarh (U.T.) 17.20 Haryana 19.90 Meghalaya 27.9 Gujarat 19.3 Arunachal Pradesh 26.0 Uttarakhand 18.8 Bihar 25.4 Manipur 24.5 Jammu & Kashmir 23.6 Assom 17.1 Mizoram 23.5 Maharashtra 16.0 Chhattisgarh 22.6 Tamil Nadu 15.67 Jharkhand 22.4 Karnataka 15.60 Rajasthan 21.3 Source : Census of India, 2011, Provisional Population Totals
  • 26.
    • Most ofthe states of India & the U.T’s of Chandigarh & Puducherry are included in this group • The mortality rate has been controlled in these areas to a large extent but the birth rate is still high • Inspite of being in the category of moderate growth in several states trends of population explosion are visible • Meghalaya has recorded the highest decennial growth rate in the census of 2011 Continued ….
  • 27.
    Areas of LowGrowth (2001-2011) State/U.T Decennial Growth (%) State / U.T Decennial Growth (%) Tripura 14.8 Andhra Pradesh 11.0 Odisha 14.0 Goa 8.2 Punjab 13.9 Andaman & Nicobar Islands 6.9 West Bengal 13.8 Lakshadweep 6.3 Himachal Pradesh 12.9 Kerala 4.9 Sikkim 12.9 Nagaland -0.6 Source : Census of India, 2011, Provisional Population Totals
  • 28.
    The areas havinglow growth can be sub-divided into 3 categories: • First category includes states like Kerala, Goa & Punjab where population control programmes have been successful due to economic & social development • The second category includes states like Tripura, West Bengal, Himachal Pradesh, Sikkim, Andhra Pradesh & Nagaland where apart from developmental works, political & administrative efforts & participation of the people have made population control programmes a success • Odisha lies in the third category and has a different situation. It is a backward state & has a high death rate Continued ….
  • 29.
    Conclusion The National PopulationPolicy, 2000, adopted by the Government of India presented the long term objective of achieving a stable population by 2045. But the crucial question is can this objective be achieved? It was envisaged that if the NPP is fully implemented, the population of India should be 1013 million by 2002 & 1107 million by 2010. However, in 2001 itself India exceeded the estimated population for the year
  • 30.
    2002 by 14million and the population in 2011 census is higher by about 110 million compared to the target set for the year 2010. It will no doubt be an uphill task for the Government & the people to achieve the much cherished goal of stable population.
  • 31.
    References: • Census ofIndia • Chandana, R.C: Population Geography, Kalyani Publisers, New Delhi, 2017 • Ojha, S.K : Jansankhya evam nagrikaran, Bauddhik Prakashan, 2017 • http://censusindia.gov.in/2011-prov- results/data_files/india/Final_PPT_2011_chap ter3.pdf