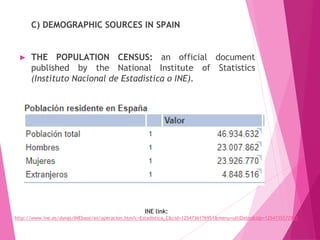
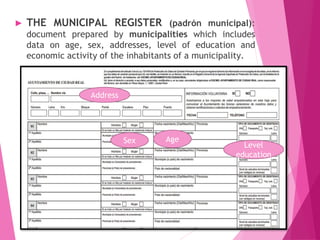
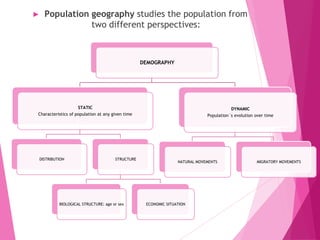
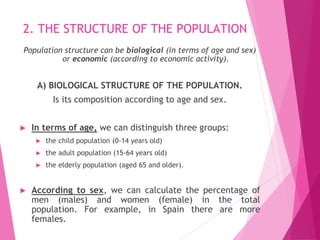
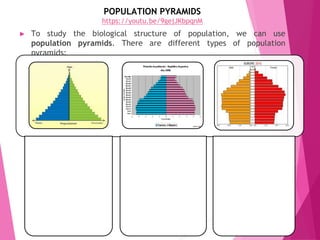
2. Possible answers
► Ancient times:
► To find out who has to pay taxes.
► To make it easier to recruit soldiers.
► For example, in ancient Rome censors counted the
population.
► In modern times: states have other reasons to be
interested in population figures, such as:
► Planning for the cost of pensions.
► Forecasting how many places are needed in schools
and hospitals.
3. 1. POPULATION GEOGRAPHY
► Population geography:
► Studies the inhabitants of the planet and their
relationship to the physical environment.
► Analyse the evolution and composition of the
population and its spatial distribution.
► To find out about (conocer más detalles) the population,
geography uses a science:
► Demography, which deals with the quantitative and
statistical study of the population.
► Therefore, is the statistical study of human populations,
especially with reference to size and density,
distribution, and vital statistics (births, marriages,
deaths, etc.).
4. B) DEMOGRAPHIC SOURCES.
► Developed countries count their population
using questionnaires, such as census forms:
► Allow them to find out accurate population
figures, as well as information about certain
characteristics (age, sex, occupation…).
► We can obtain with a lot of precision population
figures and information about the population.
► In the poorest countries, population figures are
based on estimates made by governments and
by other agencies, such as United Nations:
► Allow them to know approximately population
figures.
► We can obtain population figures with no so
much precision.
5. C) DEMOGRAPHIC SOURCES IN SPAIN
► THE POPULATION CENSUS: an official document
published by the National Institute of Statistics
(Instituto Nacional de Estadística o INE).
INE link:
http://www.ine.es/dyngs/INEbase/es/operacion.htm?c=Estadistica_C&cid=1254736176951&menu=ultiDatos&idp=1254735572981
6. ► THE CIVIL REGISTRY: in this registry, the Ministry
of Justice records all births, deaths and marriages
that take place in the country. It is compulsory to
register these events.
7. ► THE MUNICIPAL REGISTER (padrón municipal):
document prepared by municipalities which includes
data on age, sex, addresses, level of education and
economic activity of the inhabitants of a municipality.
AgeSex
Address
Level
education
8. ► Population geography studies the population from
two different perspectives:
DEMOGRAPHY
STATIC
Characteristics of population at any given time
DISTRIBUTION STRUCTURE
BIOLOGICAL STRUCTURE: age or sex ECONOMIC SITUATION
DYNAMIC
Population´s evolution over time
NATURAL MOVEMENTS MIGRATORY MOVEMENTS
9. 2. THE STRUCTURE OF THE POPULATION
Population structure can be biological (in terms of age and sex)
or economic (according to economic activity).
A) BIOLOGICAL STRUCTURE OF THE POPULATION.
Is its composition according to age and sex.
► In terms of age, we can distinguish three groups:
► the child population (0-14 years old)
► the adult population (15-64 years old)
► the elderly population (aged 65 and older).
► According to sex, we can calculate the percentage of
men (males) and women (female) in the total
population. For example, in Spain there are more
females.
10. ► To study the biological structure of population, we can use
population pyramids. There are different types of population
pyramids:
TRIANGLE SHAPE
It reflects a very young
population
(High birth rate and high
death rate)
High percentage of
population under 14 years.
Very small group of
elderly people.
Example: poor countries in
Africa or Asia.
BELL SHAPE
It reflects a young
population
(High birth rate but lower
death rate)
The group of elderly
people has increased
because the age of death
is higher.
Example: developing
countries (Brazil or
Argentina).
URN SHAPE
It reflects an ageing
population because of
fewer births
(Low birth rate and low
death rate)
Example: population of
Europe (image above) or
Spain and developed
countries, in general.
POPULATION PYRAMIDS
https://youtu.be/9gejJKbpqnM
12. B) ECONOMIC STRUCTURE.
► Active population: people who are available to
work (Active population in Spain: 58 %).
►Employed population: working population or
people who have a paid job.
►Unemployed population: people who are looking
for a job (Unemployment rate in Spain: 16 %).
► Inactive population: people who do not do paid
work and are not seeking it. It includes children
over 16, students, the retired, people unable to
work.
13. 3. NATURAL MOVEMENTS
►
(2014) Armenia
Births 41.790
Total population 2.983.990
Note: birth rates are low in developed countries (rates lower than 20 ‰),
whereas less developed countries have rates with higher values (more than
25-30 ‰; sometimes can be as high as 50 ‰).
EUROPE: between 9 ‰ and 11 ‰.
SPAIN: 8,4 ‰ (2017).
15. ►
Note: developed countries have low death rates (below 10 ‰),
whereas in less developed countries these rates are high (more
than 15-20 ‰) because poor sanitary conditions, hunger, wars…
In Spain the crude death rate is 9 ‰ (2017).
(2014) Armenia
Deaths 27.196
Total population 2.983.990
16. ► OTHER DEMOGRAPHIC INDICATORS RELATED TO MORTALITY:
► The infant mortality rate:
► Less developed countries have a high infant mortality rate (more than 60 ‰)
► More developed countries have a low infant mortality rate (less than 25 ‰)
► In Spain: 2.7 ‰
► https://www.indexmundi.com/map/?t=0&v=29&r=xx&l=es
► https://www.youtube.com/watch?v=THTDfWnohko
► Life expectancy:
► Estimated average expresses the number of years that a person can expect to live
for from the moment of their birth in an specific place.
► Women have a higher life expectancy than men.
► In less developed countries life expectancy is below 50, while in developed
countries it is about 80.
► In Spain, life expectancy is 83 years.
► http://www.elmundo.es/ciencia-y-salud/salud/2017/11/24/5a16dd19268e3e063a8b4658.html
18. ► Currently, as you can see in the chart below, it is
calculated that the world population exceeds
7.3 billion.
19. ACTIVITIES
1. According to the information you have in the tables, you have to
calculate: the crude birth rate, the crude death rate, the infant
mortality rate and the rate of the natural increase.
Then, you have to indicate if the countries that represent the data
that the tables contain are developed or less developed countries
and why.
Births Deaths Deaths of infants
under 1 year
Total population
125.014 104.755 1.000 11.204.000
Births Deaths Deaths of infants
under 1 year
Total population
767.691 603.141 1.500 67.221.943
20. 4. MIGRATORY MOVEMENTS
► MIGRATION: is the movement of people
from one part of the planet to another.
► Emigration: is the term used to indicate people
leaving the country in which they reside.
► DEPARTURE OF PEOPLE FROM ONE PLACE.
► Immigration: is used to indicate people arriving
at some country.
► ARRIVAL OF PEOPLE TO ONE PLACE.
VIDEO: https://www.youtube.com/watch?v=zpXXvx1gCpU
22. To finish point 4, Migratory
movements…
► … You have to complete the information you
have in your photocopies with the information
you have in your book:
► CAUSES OF MIGRATION (PAGE 18).
► TYPES OF MIGRATION (PAGE 19).
► CONSEQUENCES OF MIGRATION (PAGE 21): after reading
the information you have on page 21, you have to insert a
comment on the blog (before 08/11/2019), giving your
personal point of view about the problems and
consequences of migration.